African vs Immigrants from Asia Disability Age Over 75
COMPARE
African
Immigrants from Asia
Disability Age Over 75
Disability Age Over 75 Comparison
Africans
Immigrants from Asia
48.9%
DISABILITY AGE OVER 75
0.3/ 100
METRIC RATING
261st/ 347
METRIC RANK
47.0%
DISABILITY AGE OVER 75
76.5/ 100
METRIC RATING
152nd/ 347
METRIC RANK
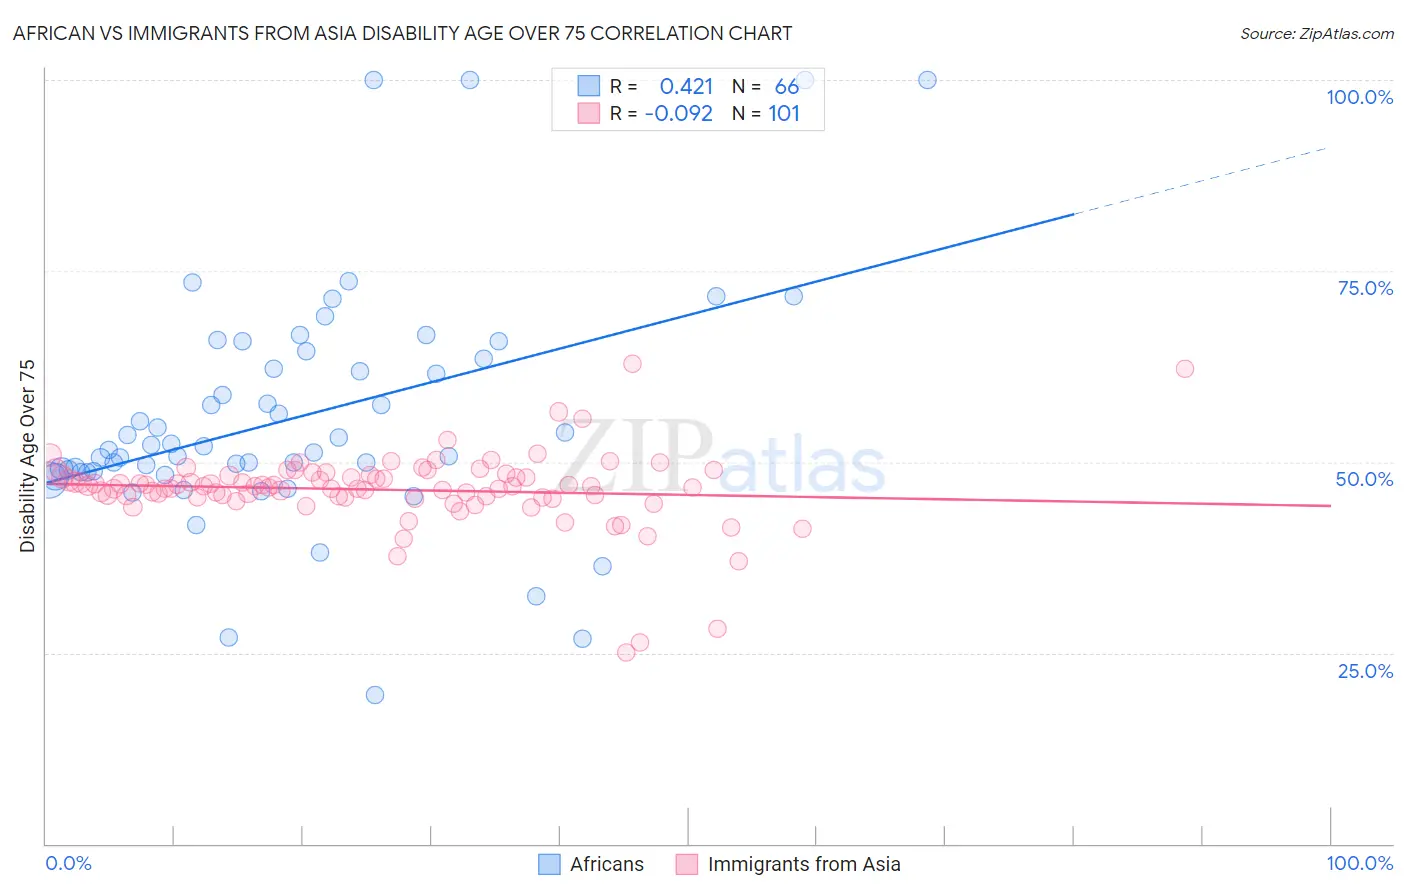
African vs Immigrants from Asia Disability Age Over 75 Correlation Chart
The statistical analysis conducted on geographies consisting of 468,767,757 people shows a moderate positive correlation between the proportion of Africans and percentage of population with a disability over the age of 75 in the United States with a correlation coefficient (R) of 0.421 and weighted average of 48.9%. Similarly, the statistical analysis conducted on geographies consisting of 547,274,857 people shows a slight negative correlation between the proportion of Immigrants from Asia and percentage of population with a disability over the age of 75 in the United States with a correlation coefficient (R) of -0.092 and weighted average of 47.0%, a difference of 3.9%.
Disability Age Over 75 Correlation Summary
| Measurement | African | Immigrants from Asia |
| Minimum | 19.4% | 25.1% |
| Maximum | 100.0% | 62.9% |
| Range | 80.6% | 37.8% |
| Mean | 55.8% | 46.4% |
| Median | 51.8% | 46.8% |
| Interquartile 25% (IQ1) | 48.7% | 45.4% |
| Interquartile 75% (IQ3) | 63.5% | 48.2% |
| Interquartile Range (IQR) | 14.9% | 2.8% |
| Standard Deviation (Sample) | 15.7% | 5.1% |
| Standard Deviation (Population) | 15.5% | 5.1% |
Similar Demographics by Disability Age Over 75
Demographics Similar to Africans by Disability Age Over 75
In terms of disability age over 75, the demographic groups most similar to Africans are Immigrants from Afghanistan (48.8%, a difference of 0.060%), Immigrants from West Indies (48.9%, a difference of 0.060%), Salvadoran (48.9%, a difference of 0.080%), Central American (48.8%, a difference of 0.10%), and Immigrants from Honduras (48.9%, a difference of 0.13%).
| Demographics | Rating | Rank | Disability Age Over 75 |
| Immigrants | Vietnam | 0.6 /100 | #254 | Tragic 48.7% |
| Chinese | 0.5 /100 | #255 | Tragic 48.7% |
| Immigrants | Congo | 0.5 /100 | #256 | Tragic 48.7% |
| Blackfeet | 0.5 /100 | #257 | Tragic 48.8% |
| Immigrants | Philippines | 0.4 /100 | #258 | Tragic 48.8% |
| Central Americans | 0.4 /100 | #259 | Tragic 48.8% |
| Immigrants | Afghanistan | 0.4 /100 | #260 | Tragic 48.8% |
| Africans | 0.3 /100 | #261 | Tragic 48.9% |
| Immigrants | West Indies | 0.3 /100 | #262 | Tragic 48.9% |
| Salvadorans | 0.3 /100 | #263 | Tragic 48.9% |
| Immigrants | Honduras | 0.3 /100 | #264 | Tragic 48.9% |
| Hondurans | 0.3 /100 | #265 | Tragic 48.9% |
| U.S. Virgin Islanders | 0.2 /100 | #266 | Tragic 48.9% |
| Malaysians | 0.2 /100 | #267 | Tragic 49.0% |
| Guatemalans | 0.2 /100 | #268 | Tragic 49.0% |
Demographics Similar to Immigrants from Asia by Disability Age Over 75
In terms of disability age over 75, the demographic groups most similar to Immigrants from Asia are Immigrants from Zaire (47.1%, a difference of 0.050%), Immigrants from Belarus (47.1%, a difference of 0.050%), Immigrants from Iran (47.1%, a difference of 0.060%), French Canadian (47.0%, a difference of 0.080%), and Immigrants from Russia (47.0%, a difference of 0.090%).
| Demographics | Rating | Rank | Disability Age Over 75 |
| Costa Ricans | 84.5 /100 | #145 | Excellent 46.9% |
| Guyanese | 84.3 /100 | #146 | Excellent 46.9% |
| Immigrants | Peru | 84.1 /100 | #147 | Excellent 46.9% |
| Asians | 81.6 /100 | #148 | Excellent 46.9% |
| Welsh | 81.3 /100 | #149 | Excellent 47.0% |
| Immigrants | Russia | 79.3 /100 | #150 | Good 47.0% |
| French Canadians | 79.0 /100 | #151 | Good 47.0% |
| Immigrants | Asia | 76.5 /100 | #152 | Good 47.0% |
| Immigrants | Zaire | 74.8 /100 | #153 | Good 47.1% |
| Immigrants | Belarus | 74.8 /100 | #154 | Good 47.1% |
| Immigrants | Iran | 74.7 /100 | #155 | Good 47.1% |
| Arabs | 73.3 /100 | #156 | Good 47.1% |
| Bhutanese | 72.6 /100 | #157 | Good 47.1% |
| Immigrants | Guyana | 71.9 /100 | #158 | Good 47.1% |
| Immigrants | Morocco | 71.4 /100 | #159 | Good 47.1% |