Zip Codes with the Highest Percentage of Population Employed in Agriculture, Fishing & Hunting in Hot Springs National Park, AR
RELATED REPORTS & OPTIONS
Agriculture, Fishing & Hunting
Hot Springs National Park
Compare Zip Codes
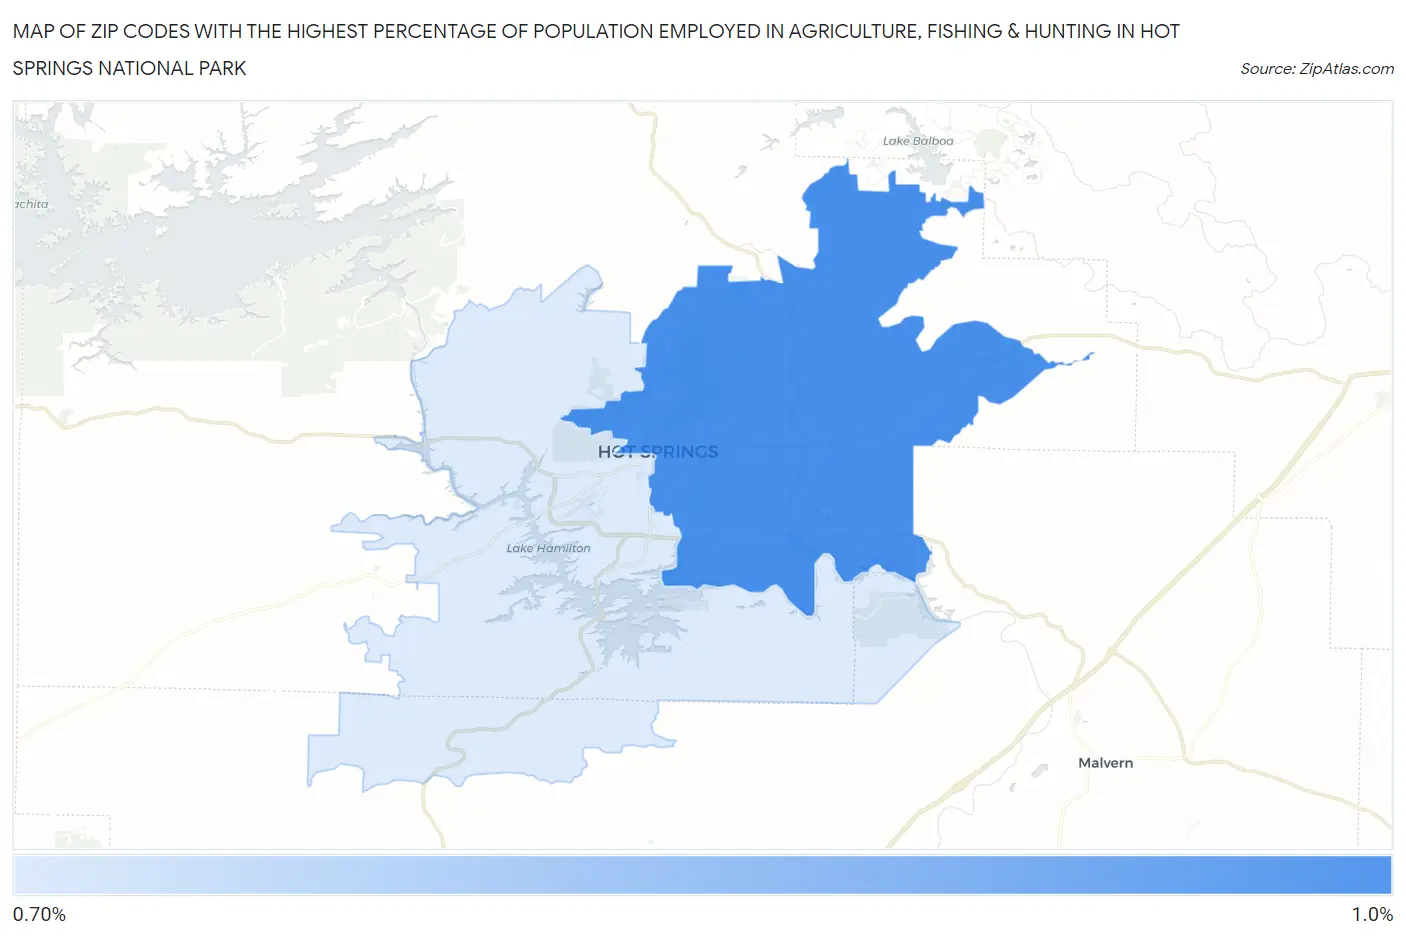
Map of Zip Codes with the Highest Percentage of Population Employed in Agriculture, Fishing & Hunting in Hot Springs National Park
0.79%
0.90%
Zip Codes with the Highest Percentage of Population Employed in Agriculture, Fishing & Hunting in Hot Springs National Park, AR
| Zip Code | % Employed | vs State | vs National | |
| 1. | 71901 | 0.90% | 2.2%(-1.29)#370 | 1.2%(-0.304)#16,733 |
| 2. | 71913 | 0.79% | 2.2%(-1.40)#378 | 1.2%(-0.408)#17,289 |
1
Common Questions
What are the Top Zip Codes with the Highest Percentage of Population Employed in Agriculture, Fishing & Hunting in Hot Springs National Park, AR?
Top Zip Codes with the Highest Percentage of Population Employed in Agriculture, Fishing & Hunting in Hot Springs National Park, AR are:
What zip code has the Highest Percentage of Population Employed in Agriculture, Fishing & Hunting in Hot Springs National Park, AR?
71901 has the Highest Percentage of Population Employed in Agriculture, Fishing & Hunting in Hot Springs National Park, AR with 0.90%.
What is the Percentage of Population Employed in Agriculture, Fishing & Hunting in Arkansas?
Percentage of Population Employed in Agriculture, Fishing & Hunting in Arkansas is 2.2%.
What is the Percentage of Population Employed in Agriculture, Fishing & Hunting in the United States?
Percentage of Population Employed in Agriculture, Fishing & Hunting in the United States is 1.2%.