Zip Codes with the Highest Percentage of Population Taking Taxi / Cab to Work in Vancouver, WA
RELATED REPORTS & OPTIONS
Taxi / Cab
Vancouver
Compare Zip Codes
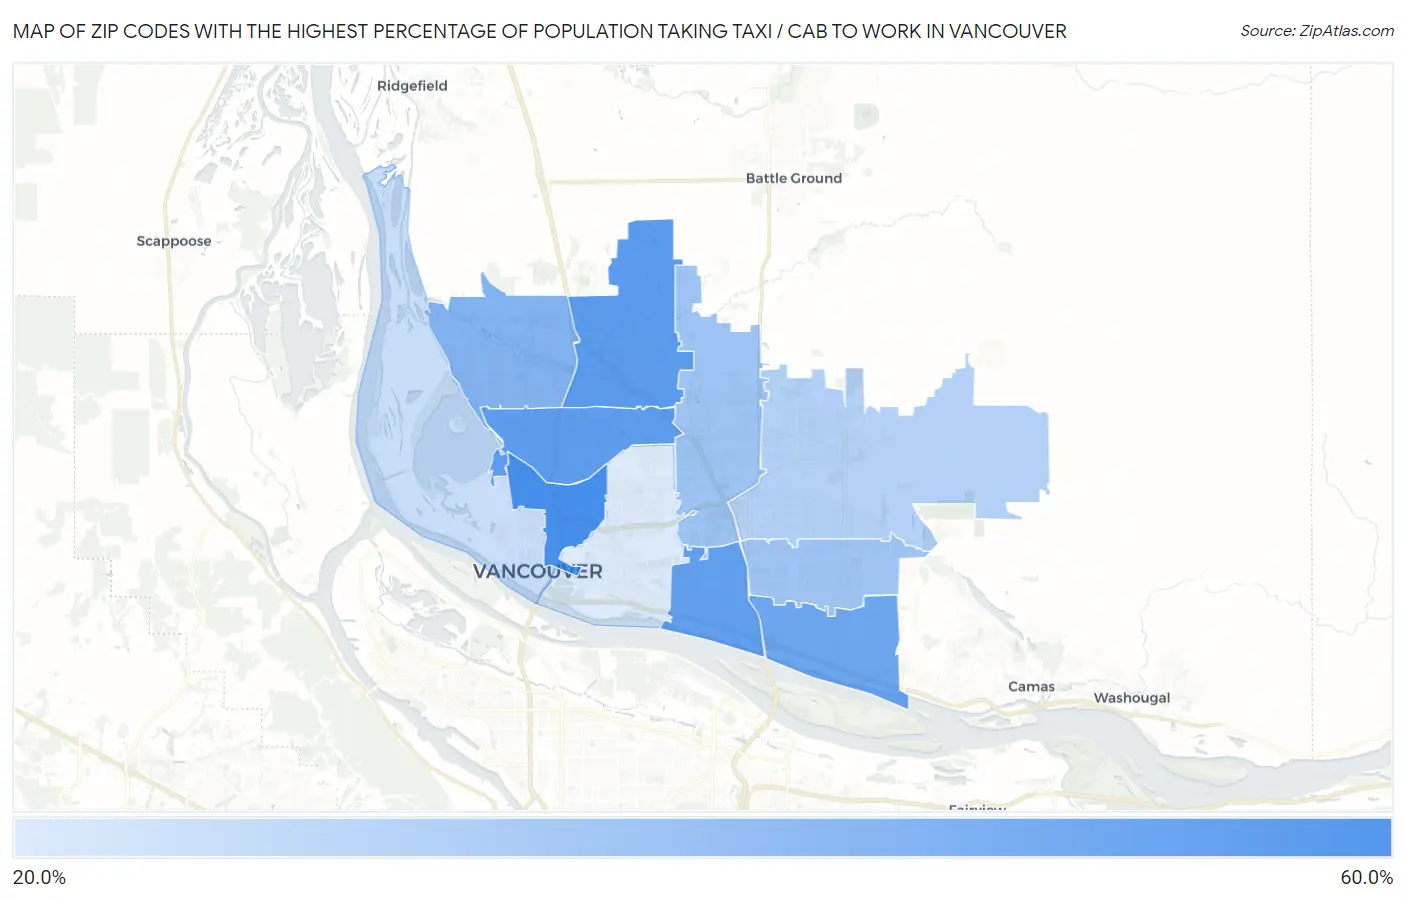
Map of Zip Codes with the Highest Percentage of Population Taking Taxi / Cab to Work in Vancouver
29.1%
51.1%
Zip Codes with the Highest Percentage of Population Taking Taxi / Cab to Work in Vancouver, WA
| Zip Code | % Take Taxi / Cab | vs State | vs National | |
| 1. | 98663 | 51.1% | 38.8%(+12.3)#65 | 38.2%(+12.9)#2,648 |
| 2. | 98686 | 48.2% | 38.8%(+9.40)#85 | 38.2%(+10.0)#3,549 |
| 3. | 98665 | 47.6% | 38.8%(+8.80)#92 | 38.2%(+9.40)#3,749 |
| 4. | 98664 | 46.6% | 38.8%(+7.80)#107 | 38.2%(+8.40)#4,077 |
| 5. | 98683 | 45.1% | 38.8%(+6.30)#122 | 38.2%(+6.90)#4,624 |
| 6. | 98685 | 42.0% | 38.8%(+3.20)#143 | 38.2%(+3.80)#5,723 |
| 7. | 98662 | 37.9% | 38.8%(-0.900)#195 | 38.2%(-0.300)#7,527 |
| 8. | 98684 | 37.4% | 38.8%(-1.40)#201 | 38.2%(-0.800)#7,766 |
| 9. | 98682 | 34.8% | 38.8%(-4.00)#220 | 38.2%(-3.40)#8,955 |
| 10. | 98660 | 32.1% | 38.8%(-6.70)#240 | 38.2%(-6.10)#10,144 |
| 11. | 98661 | 29.1% | 38.8%(-9.70)#269 | 38.2%(-9.10)#11,223 |
1
Common Questions
What are the Top 10 Zip Codes with the Highest Percentage of Population Taking Taxi / Cab to Work in Vancouver, WA?
Top 10 Zip Codes with the Highest Percentage of Population Taking Taxi / Cab to Work in Vancouver, WA are:
What zip code has the Highest Percentage of Population Taking Taxi / Cab to Work in Vancouver, WA?
98663 has the Highest Percentage of Population Taking Taxi / Cab to Work in Vancouver, WA with 51.1%.
What is the Percentage of Population Taking Taxi / Cab to Work in Vancouver, WA?
Percentage of Population Taking Taxi / Cab to Work in Vancouver is 37.5%.
What is the Percentage of Population Taking Taxi / Cab to Work in Washington?
Percentage of Population Taking Taxi / Cab to Work in Washington is 38.8%.
What is the Percentage of Population Taking Taxi / Cab to Work in the United States?
Percentage of Population Taking Taxi / Cab to Work in the United States is 38.2%.