Sprague, WA Map & Demographics
Sprague Map
Sprague Overview
$28,964
PER CAPITA INCOME
$71,944
AVG FAMILY INCOME
$66,250
AVG HOUSEHOLD INCOME
47.5%
WAGE / INCOME GAP [ % ]
52.5¢/ $1
WAGE / INCOME GAP [ $ ]
0.43
INEQUALITY / GINI INDEX
632
TOTAL POPULATION
337
MALE POPULATION
295
FEMALE POPULATION
114.24
MALES / 100 FEMALES
87.54
FEMALES / 100 MALES
43.1
MEDIAN AGE
3.1
AVG FAMILY SIZE
2.6
AVG HOUSEHOLD SIZE
263
LABOR FORCE [ PEOPLE ]
54.3%
PERCENT IN LABOR FORCE
12.5%
UNEMPLOYMENT RATE
Sprague Zip Codes
Sprague Area Codes
Income in Sprague
Income Overview in Sprague
Per Capita Income in Sprague is $28,964, while median incomes of families and households are $71,944 and $66,250 respectively.
| Characteristic | Number | Measure |
| Per Capita Income | 632 | $28,964 |
| Median Family Income | 176 | $71,944 |
| Mean Family Income | 176 | $86,311 |
| Median Household Income | 242 | $66,250 |
| Mean Household Income | 242 | $75,791 |
| Income Deficit | 176 | $0 |
| Wage / Income Gap (%) | 632 | 47.49% |
| Wage / Income Gap ($) | 632 | 52.51¢ per $1 |
| Gini / Inequality Index | 632 | 0.43 |
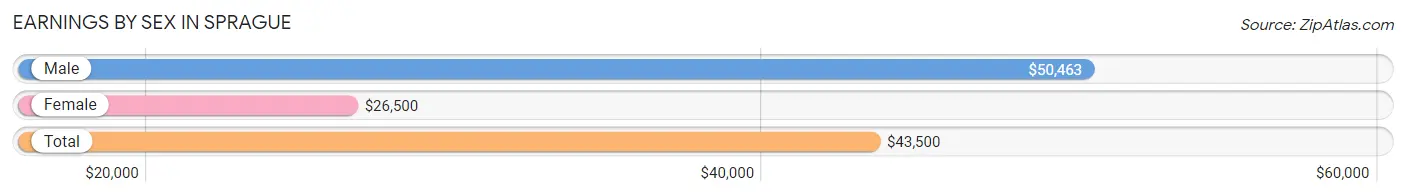
Earnings by Sex in Sprague
Average Earnings in Sprague are $43,500, $50,463 for men and $26,500 for women, a difference of 47.5%.
| Sex | Number | Average Earnings |
| Male | 146 (60.3%) | $50,463 |
| Female | 96 (39.7%) | $26,500 |
| Total | 242 (100.0%) | $43,500 |
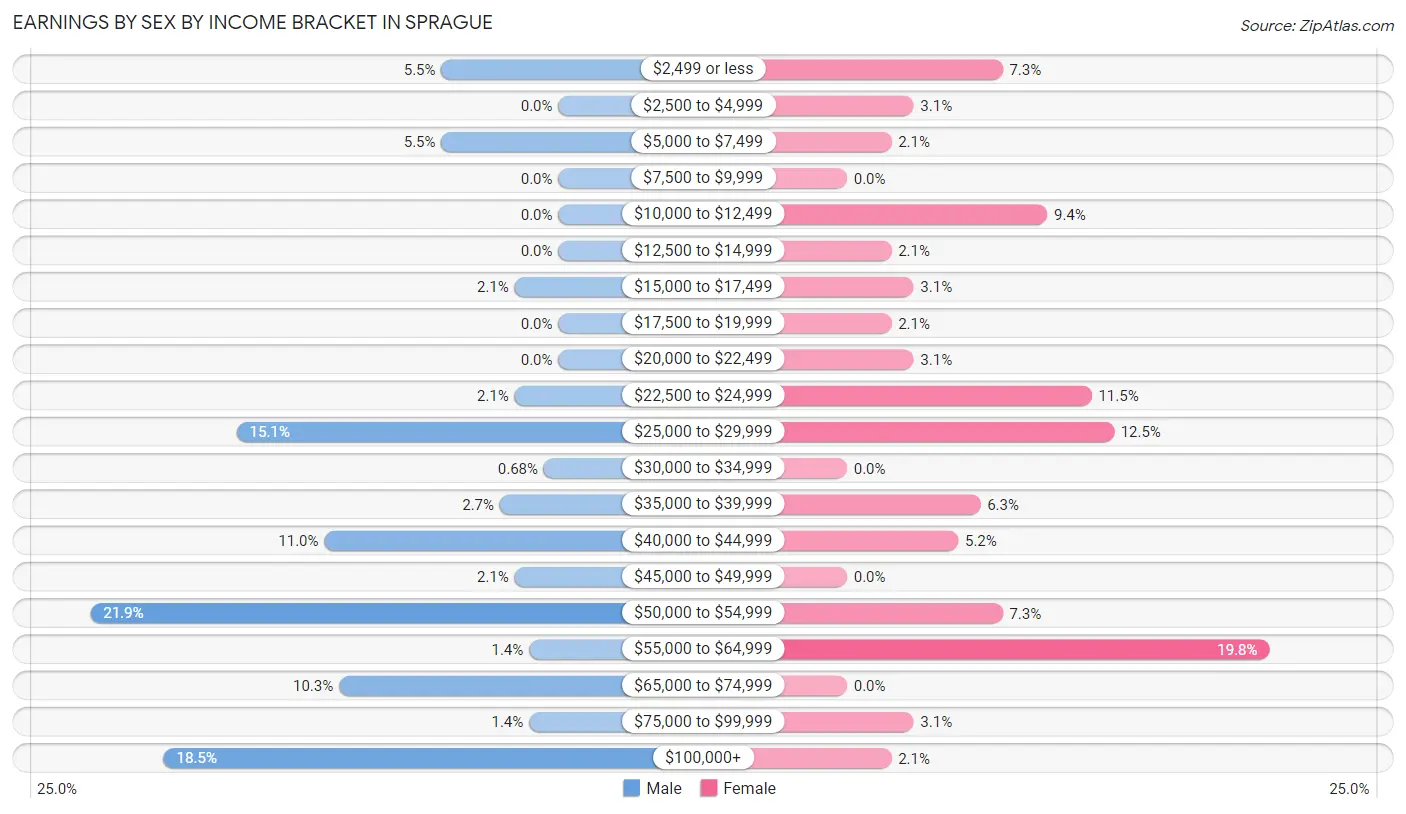
Earnings by Sex by Income Bracket in Sprague
The most common earnings brackets in Sprague are $50,000 to $54,999 for men (32 | 21.9%) and $55,000 to $64,999 for women (19 | 19.8%).
| Income | Male | Female |
| $2,499 or less | 8 (5.5%) | 7 (7.3%) |
| $2,500 to $4,999 | 0 (0.0%) | 3 (3.1%) |
| $5,000 to $7,499 | 8 (5.5%) | 2 (2.1%) |
| $7,500 to $9,999 | 0 (0.0%) | 0 (0.0%) |
| $10,000 to $12,499 | 0 (0.0%) | 9 (9.4%) |
| $12,500 to $14,999 | 0 (0.0%) | 2 (2.1%) |
| $15,000 to $17,499 | 3 (2.1%) | 3 (3.1%) |
| $17,500 to $19,999 | 0 (0.0%) | 2 (2.1%) |
| $20,000 to $22,499 | 0 (0.0%) | 3 (3.1%) |
| $22,500 to $24,999 | 3 (2.1%) | 11 (11.5%) |
| $25,000 to $29,999 | 22 (15.1%) | 12 (12.5%) |
| $30,000 to $34,999 | 1 (0.7%) | 0 (0.0%) |
| $35,000 to $39,999 | 4 (2.7%) | 6 (6.2%) |
| $40,000 to $44,999 | 16 (11.0%) | 5 (5.2%) |
| $45,000 to $49,999 | 3 (2.1%) | 0 (0.0%) |
| $50,000 to $54,999 | 32 (21.9%) | 7 (7.3%) |
| $55,000 to $64,999 | 2 (1.4%) | 19 (19.8%) |
| $65,000 to $74,999 | 15 (10.3%) | 0 (0.0%) |
| $75,000 to $99,999 | 2 (1.4%) | 3 (3.1%) |
| $100,000+ | 27 (18.5%) | 2 (2.1%) |
| Total | 146 (100.0%) | 96 (100.0%) |
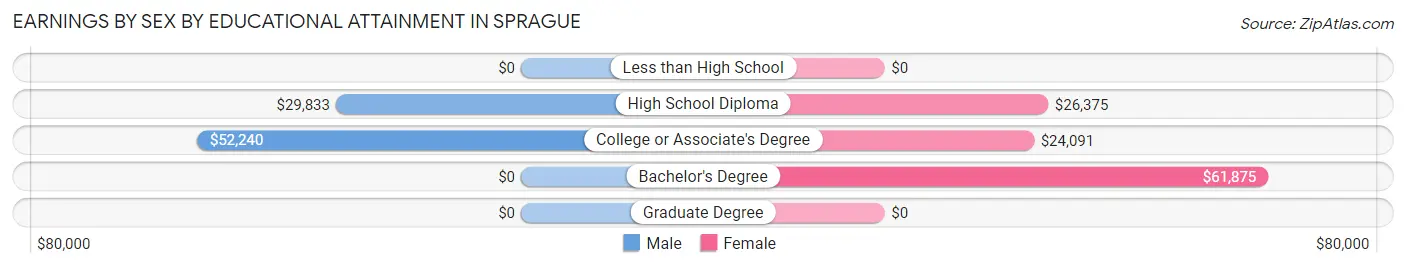
Earnings by Sex by Educational Attainment in Sprague
Average earnings in Sprague are $51,389 for men and $27,000 for women, a difference of 47.5%. Men with an educational attainment of college or associate's degree enjoy the highest average annual earnings of $52,240, while those with high school diploma education earn the least with $29,833. Women with an educational attainment of bachelor's degree earn the most with the average annual earnings of $61,875, while those with college or associate's degree education have the smallest earnings of $24,091.
| Educational Attainment | Male Income | Female Income |
| Less than High School | - | - |
| High School Diploma | $29,833 | $26,375 |
| College or Associate's Degree | $52,240 | $24,091 |
| Bachelor's Degree | - | - |
| Graduate Degree | - | - |
| Total | $51,389 | $27,000 |
Family Income in Sprague
Family Income Brackets in Sprague
According to the Sprague family income data, there are 67 families falling into the $50,000 to $74,999 income range, which is the most common income bracket and makes up 38.1% of all families. Conversely, the $10,000 to $14,999 income bracket is the least frequent group with only 2 families (1.1%) belonging to this category.
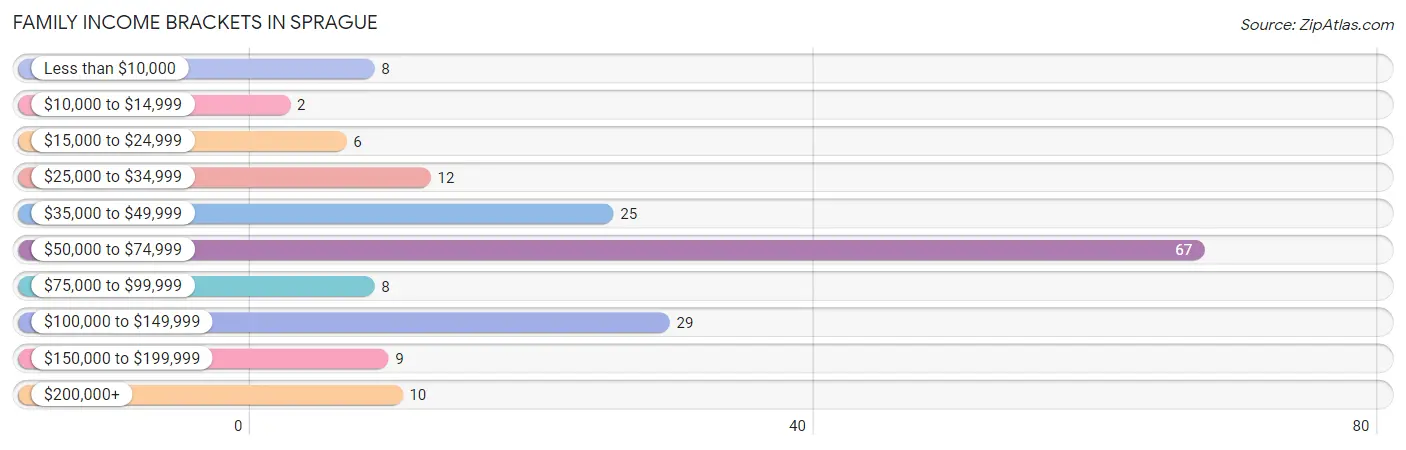
| Income Bracket | # Families | % Families |
| Less than $10,000 | 8 | 4.5% |
| $10,000 to $14,999 | 2 | 1.1% |
| $15,000 to $24,999 | 6 | 3.4% |
| $25,000 to $34,999 | 12 | 6.8% |
| $35,000 to $49,999 | 25 | 14.2% |
| $50,000 to $74,999 | 67 | 38.1% |
| $75,000 to $99,999 | 8 | 4.5% |
| $100,000 to $149,999 | 29 | 16.5% |
| $150,000 to $199,999 | 9 | 5.1% |
| $200,000+ | 10 | 5.7% |
Family Income by Famaliy Size in Sprague
4-person families (45 | 25.6%) account for the highest median family income in Sprague with $74,120 per family, while 2-person families (79 | 44.9%) have the highest median income of $26,562 per family member.
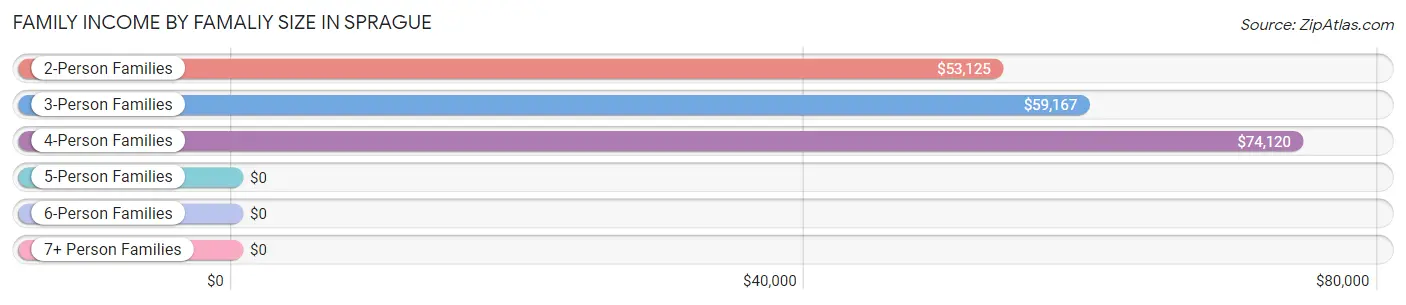
| Income Bracket | # Families | Median Income |
| 2-Person Families | 79 (44.9%) | $53,125 |
| 3-Person Families | 32 (18.2%) | $59,167 |
| 4-Person Families | 45 (25.6%) | $74,120 |
| 5-Person Families | 8 (4.5%) | $0 |
| 6-Person Families | 9 (5.1%) | $0 |
| 7+ Person Families | 3 (1.7%) | $0 |
| Total | 176 (100.0%) | $71,944 |
Family Income by Number of Earners in Sprague
The median family income in Sprague is $71,944, with families comprising 3+ earners (15) having the highest median family income of $118,125, while families with no earners (54) have the lowest median family income of $43,056, accounting for 8.5% and 30.7% of families, respectively.
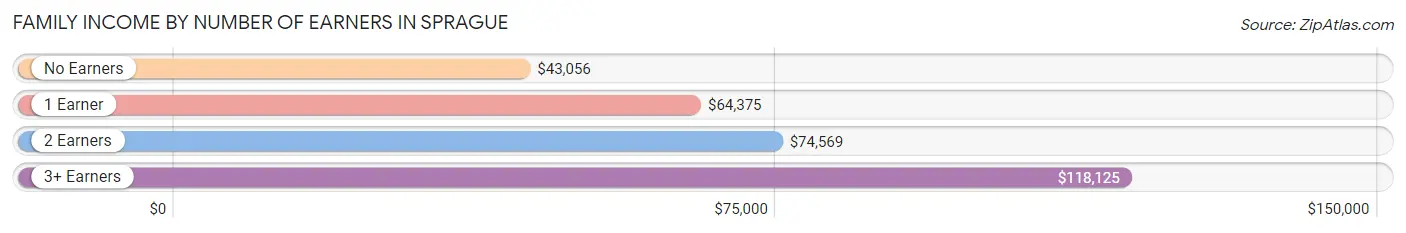
| Number of Earners | # Families | Median Income |
| No Earners | 54 (30.7%) | $43,056 |
| 1 Earner | 37 (21.0%) | $64,375 |
| 2 Earners | 70 (39.8%) | $74,569 |
| 3+ Earners | 15 (8.5%) | $118,125 |
| Total | 176 (100.0%) | $71,944 |
Household Income in Sprague
Household Income Brackets in Sprague
With 68 households falling in the category, the $50,000 to $74,999 income range is the most frequent in Sprague, accounting for 28.1% of all households. In contrast, only 9 households (3.7%) fall into the $150,000 to $199,999 income bracket, making it the least populous group.
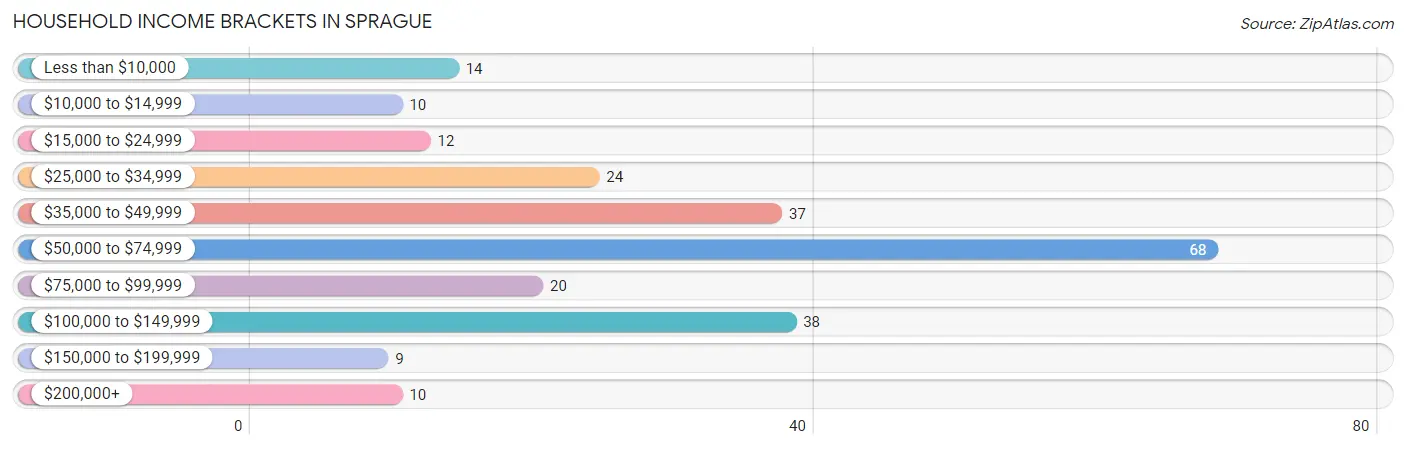
| Income Bracket | # Households | % Households |
| Less than $10,000 | 14 | 5.8% |
| $10,000 to $14,999 | 10 | 4.1% |
| $15,000 to $24,999 | 12 | 5.0% |
| $25,000 to $34,999 | 24 | 9.9% |
| $35,000 to $49,999 | 37 | 15.3% |
| $50,000 to $74,999 | 68 | 28.1% |
| $75,000 to $99,999 | 20 | 8.3% |
| $100,000 to $149,999 | 38 | 15.7% |
| $150,000 to $199,999 | 9 | 3.7% |
| $200,000+ | 10 | 4.1% |
Household Income by Householder Age in Sprague
The median household income in Sprague is $66,250, with the highest median household income of $73,966 found in the 25 to 44 years age bracket for the primary householder. A total of 76 households (31.4%) fall into this category. Meanwhile, the 15 to 24 years age bracket for the primary householder has the lowest median household income of $0, with 7 households (2.9%) in this group.
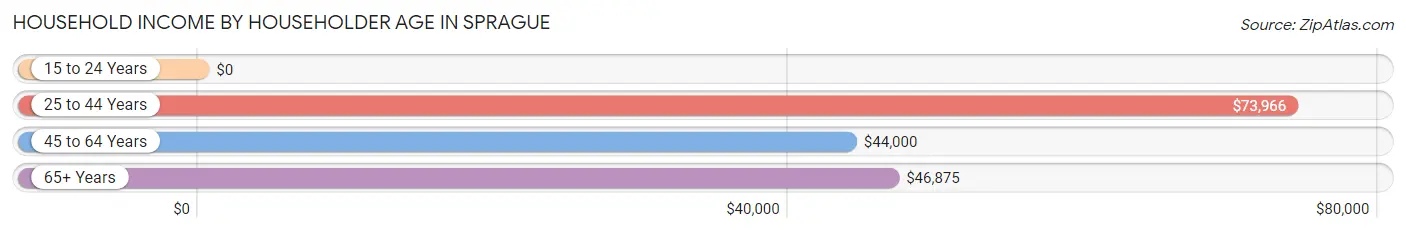
| Income Bracket | # Households | Median Income |
| 15 to 24 Years | 7 (2.9%) | $0 |
| 25 to 44 Years | 76 (31.4%) | $73,966 |
| 45 to 64 Years | 92 (38.0%) | $44,000 |
| 65+ Years | 67 (27.7%) | $46,875 |
| Total | 242 (100.0%) | $66,250 |
Poverty in Sprague
Income Below Poverty by Sex and Age in Sprague
With 16.3% poverty level for males and 10.5% for females among the residents of Sprague, 15 year old males and 16 and 17 year old females are the most vulnerable to poverty, with 3 males (37.5%) and 4 females (44.4%) in their respective age groups living below the poverty level.
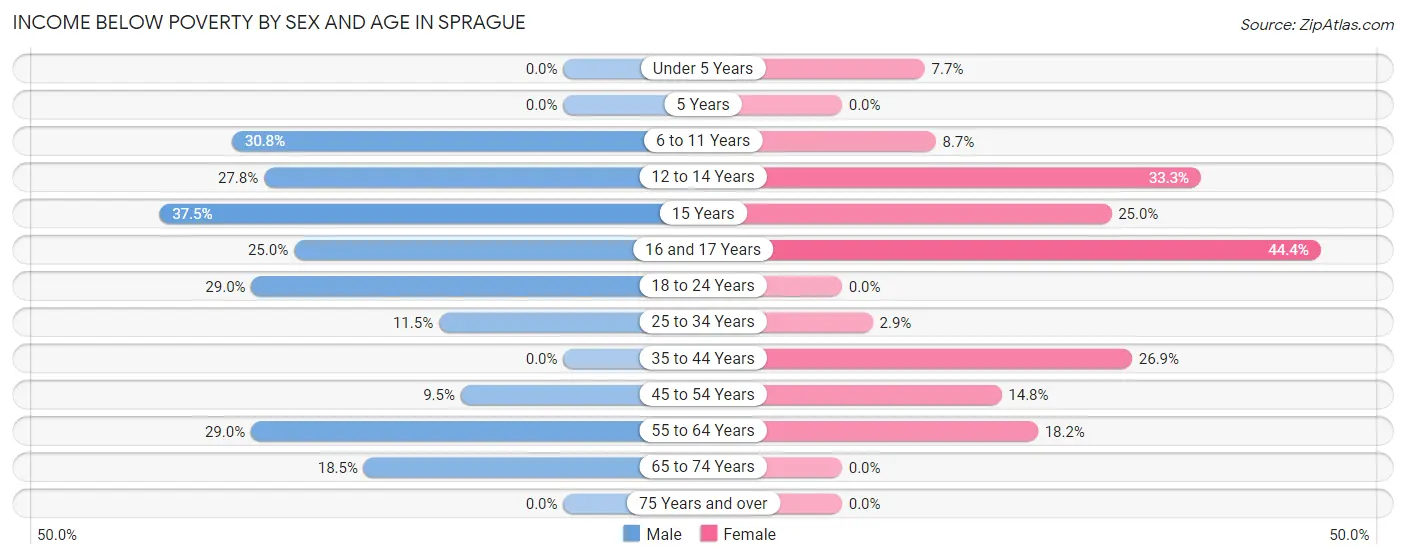
| Age Bracket | Male | Female |
| Under 5 Years | 0 (0.0%) | 2 (7.7%) |
| 5 Years | 0 (0.0%) | 0 (0.0%) |
| 6 to 11 Years | 4 (30.8%) | 2 (8.7%) |
| 12 to 14 Years | 5 (27.8%) | 2 (33.3%) |
| 15 Years | 3 (37.5%) | 1 (25.0%) |
| 16 and 17 Years | 2 (25.0%) | 4 (44.4%) |
| 18 to 24 Years | 11 (28.9%) | 0 (0.0%) |
| 25 to 34 Years | 3 (11.5%) | 1 (2.9%) |
| 35 to 44 Years | 0 (0.0%) | 7 (26.9%) |
| 45 to 54 Years | 2 (9.5%) | 4 (14.8%) |
| 55 to 64 Years | 20 (29.0%) | 8 (18.2%) |
| 65 to 74 Years | 5 (18.5%) | 0 (0.0%) |
| 75 Years and over | 0 (0.0%) | 0 (0.0%) |
| Total | 55 (16.3%) | 31 (10.5%) |
Income Above Poverty by Sex and Age in Sprague
According to the poverty statistics in Sprague, males aged under 5 years and females aged 5 years are the age groups that are most secure financially, with 100.0% of males and 100.0% of females in these age groups living above the poverty line.
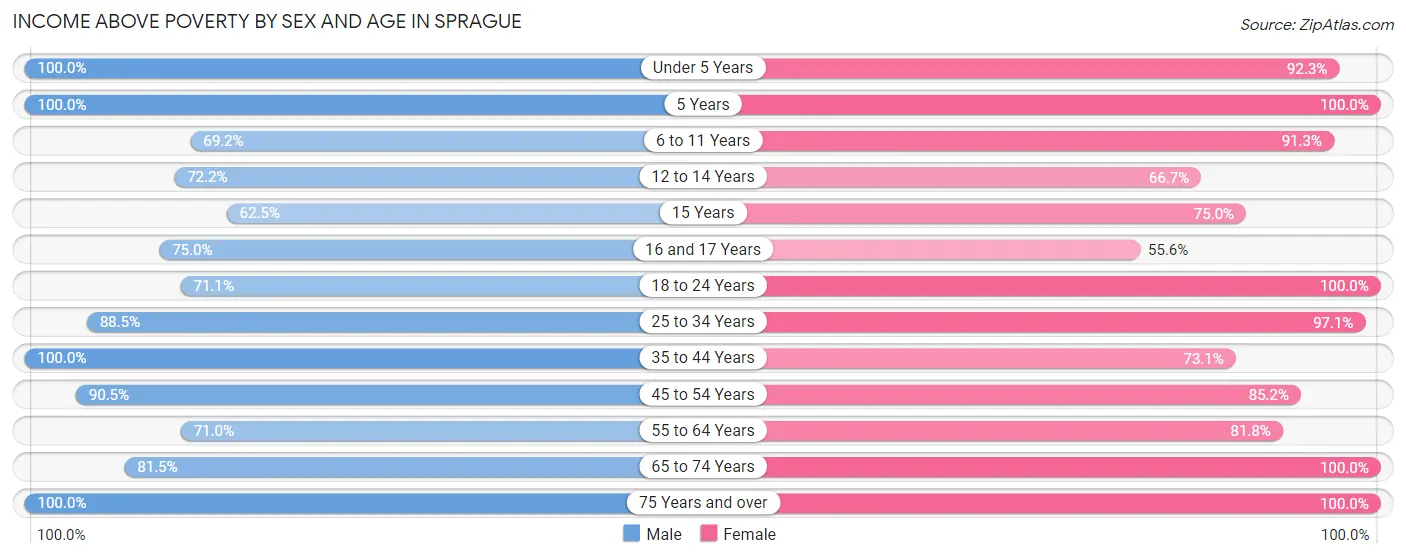
| Age Bracket | Male | Female |
| Under 5 Years | 26 (100.0%) | 24 (92.3%) |
| 5 Years | 9 (100.0%) | 15 (100.0%) |
| 6 to 11 Years | 9 (69.2%) | 21 (91.3%) |
| 12 to 14 Years | 13 (72.2%) | 4 (66.7%) |
| 15 Years | 5 (62.5%) | 3 (75.0%) |
| 16 and 17 Years | 6 (75.0%) | 5 (55.6%) |
| 18 to 24 Years | 27 (71.1%) | 12 (100.0%) |
| 25 to 34 Years | 23 (88.5%) | 34 (97.1%) |
| 35 to 44 Years | 42 (100.0%) | 19 (73.1%) |
| 45 to 54 Years | 19 (90.5%) | 23 (85.2%) |
| 55 to 64 Years | 49 (71.0%) | 36 (81.8%) |
| 65 to 74 Years | 22 (81.5%) | 36 (100.0%) |
| 75 Years and over | 32 (100.0%) | 32 (100.0%) |
| Total | 282 (83.7%) | 264 (89.5%) |
Income Below Poverty Among Married-Couple Families in Sprague
The poverty statistics for married-couple families in Sprague show that 1.5% or 2 of the total 131 families live below the poverty line. Families with 1 or 2 children have the highest poverty rate of 2.0%, comprising of 1 families. On the other hand, families with 3 or 4 children have the lowest poverty rate of 0.0%, which includes 0 families.
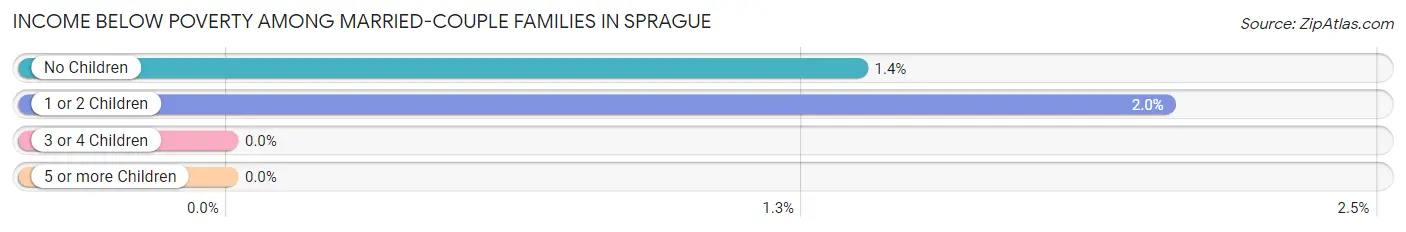
| Children | Above Poverty | Below Poverty |
| No Children | 72 (98.6%) | 1 (1.4%) |
| 1 or 2 Children | 48 (98.0%) | 1 (2.0%) |
| 3 or 4 Children | 9 (100.0%) | 0 (0.0%) |
| 5 or more Children | 0 (0.0%) | 0 (0.0%) |
| Total | 129 (98.5%) | 2 (1.5%) |
Income Below Poverty Among Single-Parent Households in Sprague
According to the poverty data in Sprague, 20.0% or 3 single-father households and 36.7% or 11 single-mother households are living below the poverty line. Among single-father households, those with 1 or 2 children have the highest poverty rate, with 3 households (33.3%) experiencing poverty. Likewise, among single-mother households, those with 3 or 4 children have the highest poverty rate, with 2 households (100.0%) falling below the poverty line.
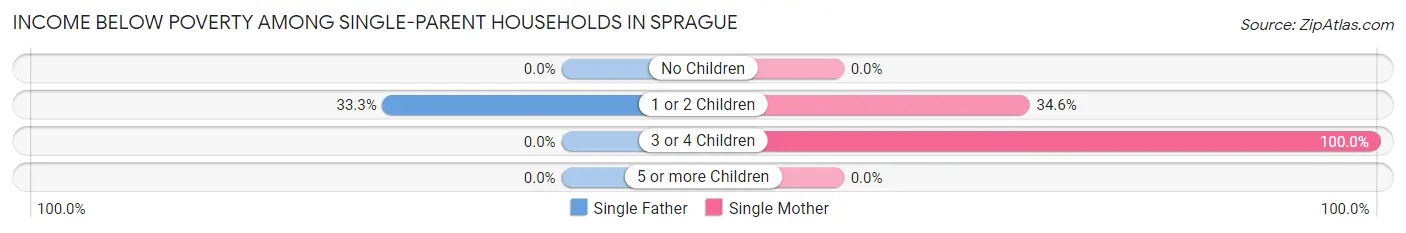
| Children | Single Father | Single Mother |
| No Children | 0 (0.0%) | 0 (0.0%) |
| 1 or 2 Children | 3 (33.3%) | 9 (34.6%) |
| 3 or 4 Children | 0 (0.0%) | 2 (100.0%) |
| 5 or more Children | 0 (0.0%) | 0 (0.0%) |
| Total | 3 (20.0%) | 11 (36.7%) |
Income Below Poverty Among Married-Couple vs Single-Parent Households in Sprague
The poverty data for Sprague shows that 2 of the married-couple family households (1.5%) and 14 of the single-parent households (31.1%) are living below the poverty level. Within the married-couple family households, those with 1 or 2 children have the highest poverty rate, with 1 households (2.0%) falling below the poverty line. Among the single-parent households, those with 3 or 4 children have the highest poverty rate, with 2 household (100.0%) living below poverty.
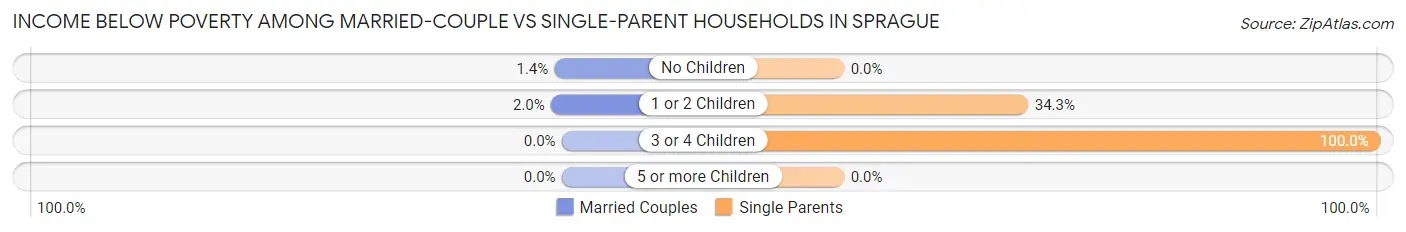
| Children | Married-Couple Families | Single-Parent Households |
| No Children | 1 (1.4%) | 0 (0.0%) |
| 1 or 2 Children | 1 (2.0%) | 12 (34.3%) |
| 3 or 4 Children | 0 (0.0%) | 2 (100.0%) |
| 5 or more Children | 0 (0.0%) | 0 (0.0%) |
| Total | 2 (1.5%) | 14 (31.1%) |
Race in Sprague
The most populous races in Sprague are White / Caucasian (597 | 94.5%), Hispanic or Latino (33 | 5.2%), and Two or more Races (24 | 3.8%).
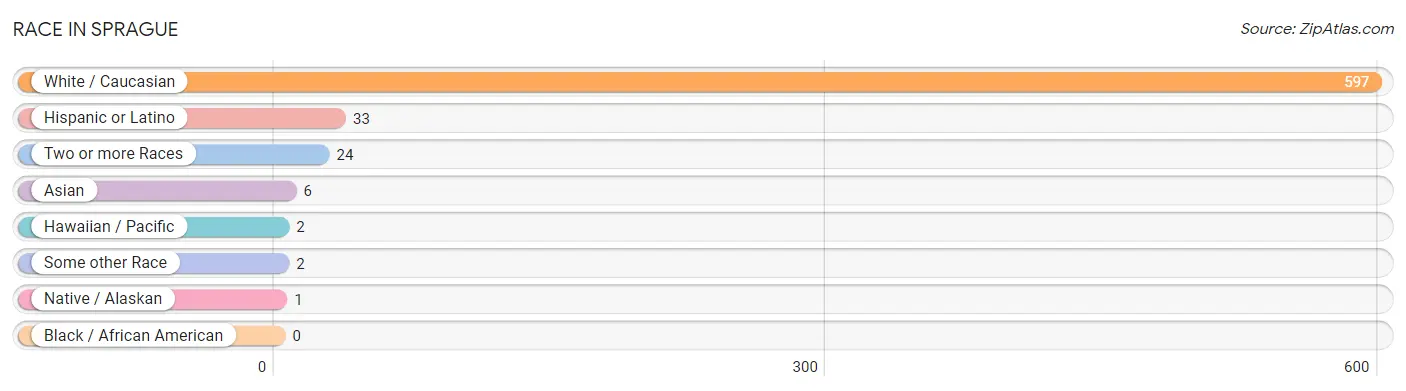
| Race | # Population | % Population |
| Asian | 6 | 0.9% |
| Black / African American | 0 | 0.0% |
| Hawaiian / Pacific | 2 | 0.3% |
| Hispanic or Latino | 33 | 5.2% |
| Native / Alaskan | 1 | 0.2% |
| White / Caucasian | 597 | 94.5% |
| Two or more Races | 24 | 3.8% |
| Some other Race | 2 | 0.3% |
| Total | 632 | 100.0% |
Ancestry in Sprague
The most populous ancestries reported in Sprague are American (126 | 19.9%), German (121 | 19.2%), Irish (95 | 15.0%), English (86 | 13.6%), and Italian (55 | 8.7%), together accounting for 76.4% of all Sprague residents.
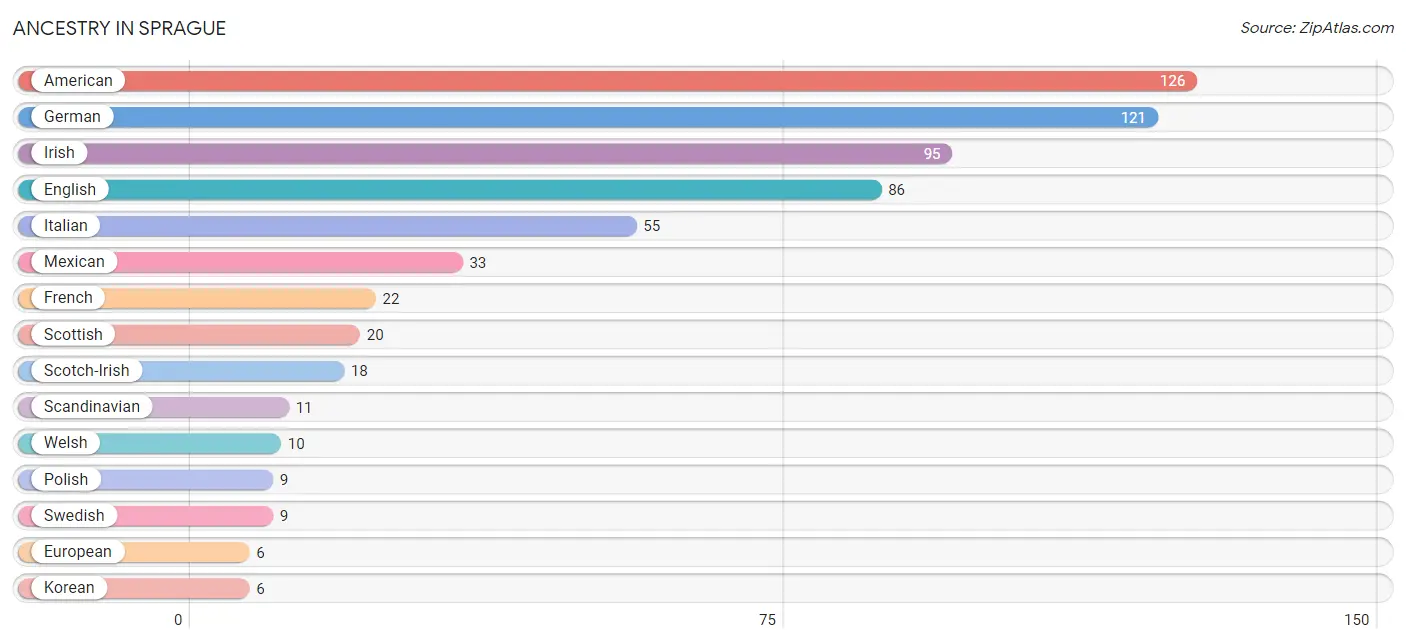
| Ancestry | # Population | % Population |
| American | 126 | 19.9% |
| British | 1 | 0.2% |
| Canadian | 2 | 0.3% |
| Cherokee | 1 | 0.2% |
| Danish | 2 | 0.3% |
| English | 86 | 13.6% |
| European | 6 | 0.9% |
| Finnish | 2 | 0.3% |
| French | 22 | 3.5% |
| French Canadian | 2 | 0.3% |
| German | 121 | 19.2% |
| Guamanian / Chamorro | 2 | 0.3% |
| Irish | 95 | 15.0% |
| Italian | 55 | 8.7% |
| Korean | 6 | 0.9% |
| Lithuanian | 1 | 0.2% |
| Mexican | 33 | 5.2% |
| Northern European | 1 | 0.2% |
| Norwegian | 4 | 0.6% |
| Polish | 9 | 1.4% |
| Russian | 4 | 0.6% |
| Scandinavian | 11 | 1.7% |
| Scotch-Irish | 18 | 2.9% |
| Scottish | 20 | 3.2% |
| Sioux | 1 | 0.2% |
| Swedish | 9 | 1.4% |
| Tlingit-Haida | 2 | 0.3% |
| Welsh | 10 | 1.6% | View All 28 Rows |
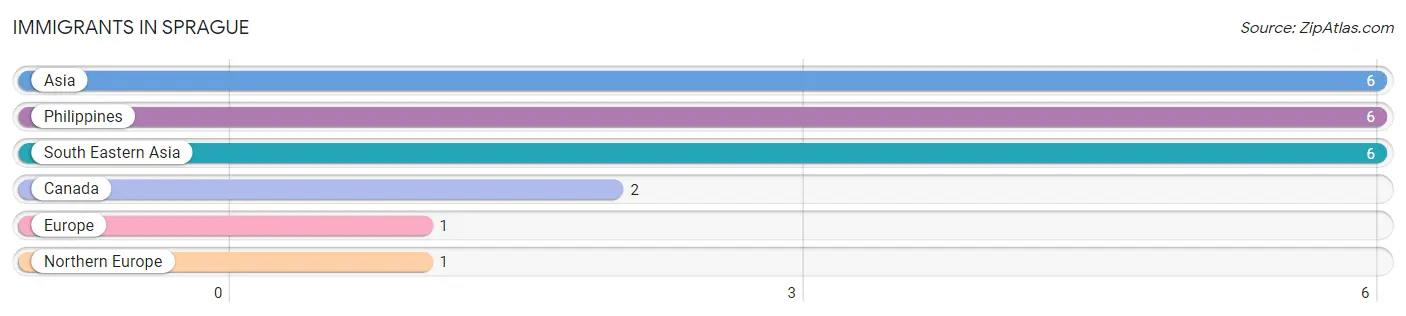
Immigrants in Sprague
The most numerous immigrant groups reported in Sprague came from Asia (6 | 0.9%), Philippines (6 | 0.9%), South Eastern Asia (6 | 0.9%), Canada (2 | 0.3%), and Europe (1 | 0.2%), together accounting for 3.3% of all Sprague residents.
| Immigration Origin | # Population | % Population |
| Asia | 6 | 0.9% |
| Canada | 2 | 0.3% |
| Europe | 1 | 0.2% |
| Northern Europe | 1 | 0.2% |
| Philippines | 6 | 0.9% |
| South Eastern Asia | 6 | 0.9% | View All 6 Rows |
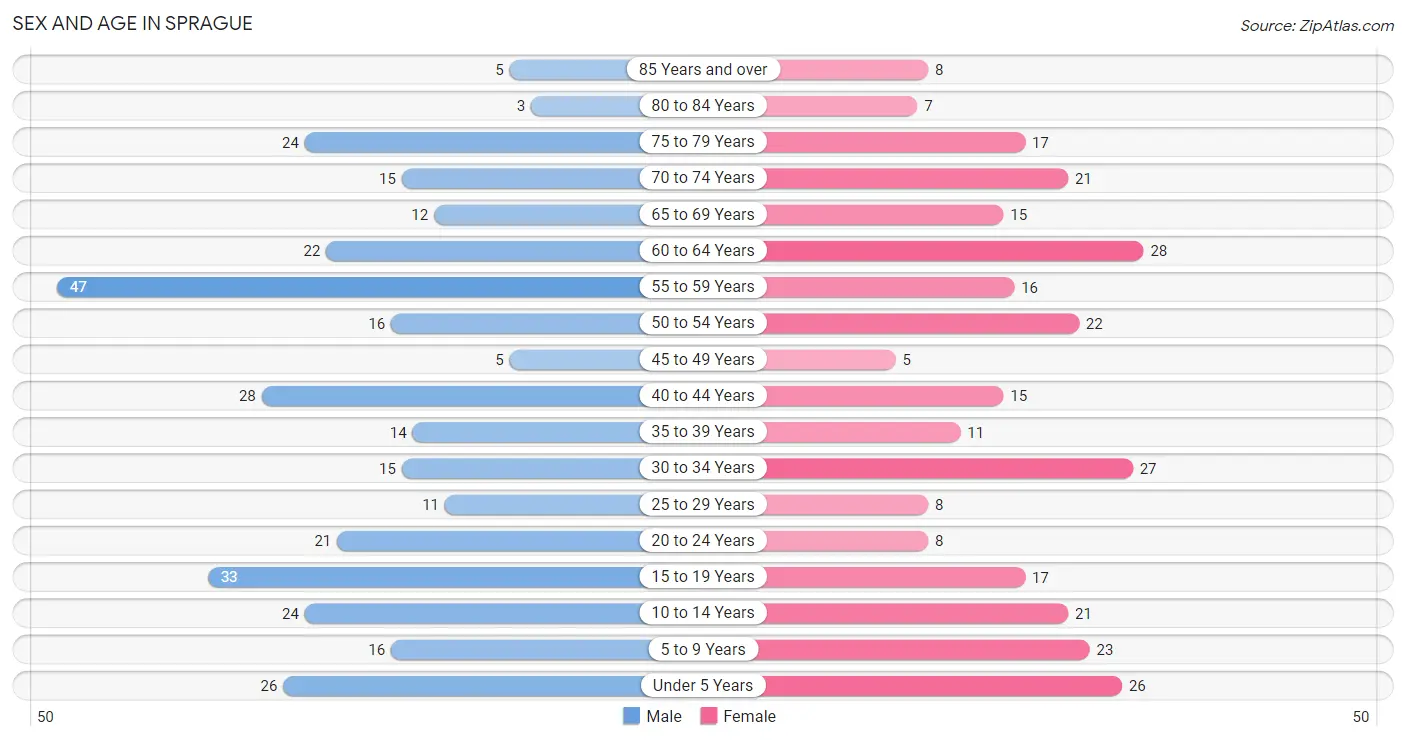
Sex and Age in Sprague
Sex and Age in Sprague
The most populous age groups in Sprague are 55 to 59 Years (47 | 14.0%) for men and 60 to 64 Years (28 | 9.5%) for women.
| Age Bracket | Male | Female |
| Under 5 Years | 26 (7.7%) | 26 (8.8%) |
| 5 to 9 Years | 16 (4.8%) | 23 (7.8%) |
| 10 to 14 Years | 24 (7.1%) | 21 (7.1%) |
| 15 to 19 Years | 33 (9.8%) | 17 (5.8%) |
| 20 to 24 Years | 21 (6.2%) | 8 (2.7%) |
| 25 to 29 Years | 11 (3.3%) | 8 (2.7%) |
| 30 to 34 Years | 15 (4.4%) | 27 (9.1%) |
| 35 to 39 Years | 14 (4.2%) | 11 (3.7%) |
| 40 to 44 Years | 28 (8.3%) | 15 (5.1%) |
| 45 to 49 Years | 5 (1.5%) | 5 (1.7%) |
| 50 to 54 Years | 16 (4.8%) | 22 (7.5%) |
| 55 to 59 Years | 47 (14.0%) | 16 (5.4%) |
| 60 to 64 Years | 22 (6.5%) | 28 (9.5%) |
| 65 to 69 Years | 12 (3.6%) | 15 (5.1%) |
| 70 to 74 Years | 15 (4.4%) | 21 (7.1%) |
| 75 to 79 Years | 24 (7.1%) | 17 (5.8%) |
| 80 to 84 Years | 3 (0.9%) | 7 (2.4%) |
| 85 Years and over | 5 (1.5%) | 8 (2.7%) |
| Total | 337 (100.0%) | 295 (100.0%) |
Families and Households in Sprague
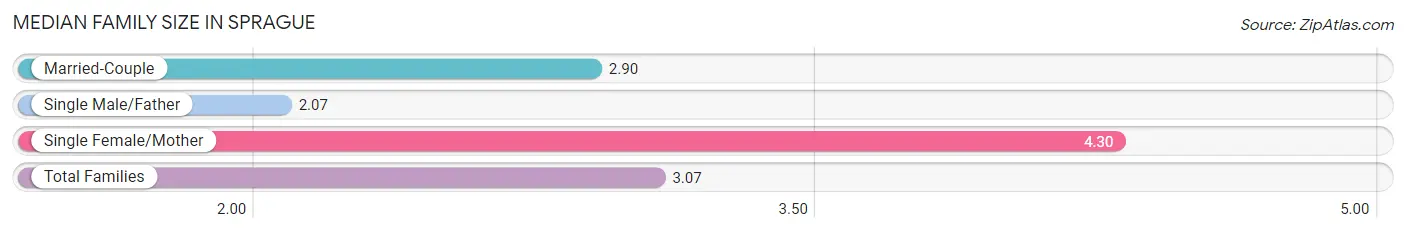
Median Family Size in Sprague
The median family size in Sprague is 3.07 persons per family, with single female/mother families (30 | 17.1%) accounting for the largest median family size of 4.3 persons per family. On the other hand, single male/father families (15 | 8.5%) represent the smallest median family size with 2.07 persons per family.
| Family Type | # Families | Family Size |
| Married-Couple | 131 (74.4%) | 2.90 |
| Single Male/Father | 15 (8.5%) | 2.07 |
| Single Female/Mother | 30 (17.1%) | 4.30 |
| Total Families | 176 (100.0%) | 3.07 |
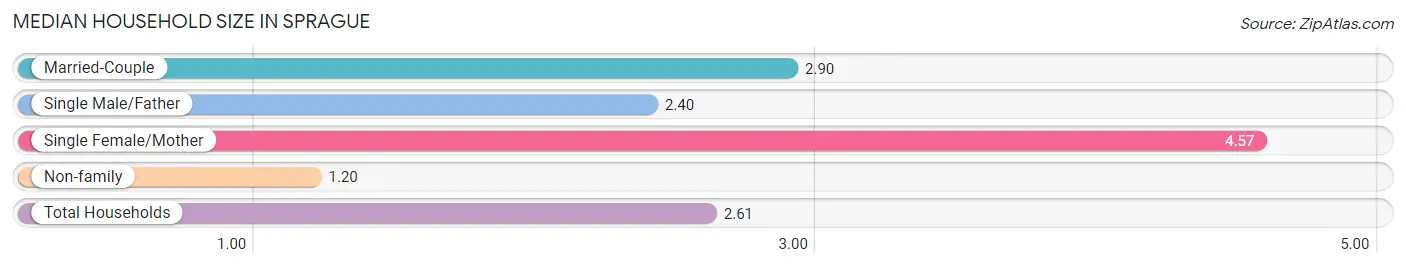
Median Household Size in Sprague
The median household size in Sprague is 2.61 persons per household, with single female/mother households (30 | 12.4%) accounting for the largest median household size of 4.57 persons per household. non-family households (66 | 27.3%) represent the smallest median household size with 1.20 persons per household.
| Household Type | # Households | Household Size |
| Married-Couple | 131 (54.1%) | 2.90 |
| Single Male/Father | 15 (6.2%) | 2.40 |
| Single Female/Mother | 30 (12.4%) | 4.57 |
| Non-family | 66 (27.3%) | 1.20 |
| Total Households | 242 (100.0%) | 2.61 |
Household Size by Marriage Status in Sprague
Out of a total of 242 households in Sprague, 176 (72.7%) are family households, while 66 (27.3%) are nonfamily households. The most numerous type of family households are 2-person households, comprising 71, and the most common type of nonfamily households are 1-person households, comprising 50.
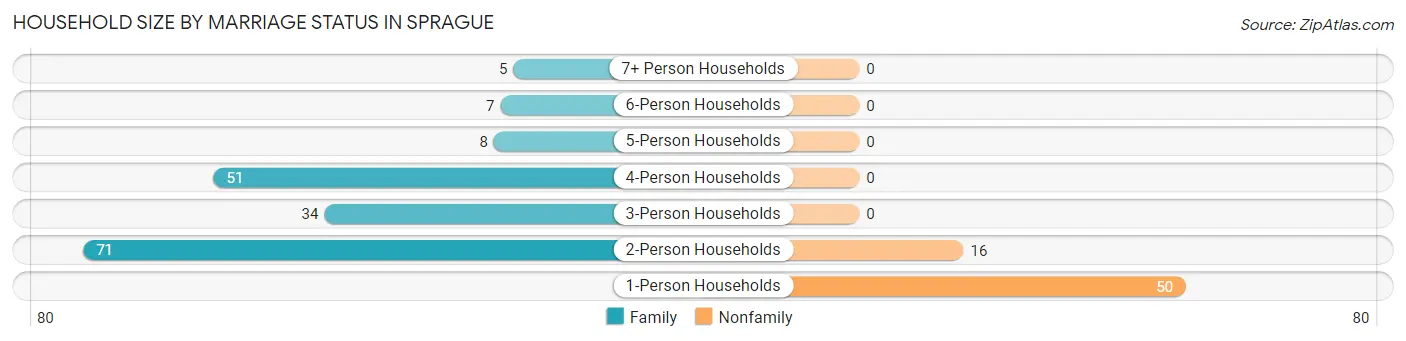
| Household Size | Family Households | Nonfamily Households |
| 1-Person Households | - | 50 (20.7%) |
| 2-Person Households | 71 (29.3%) | 16 (6.6%) |
| 3-Person Households | 34 (14.1%) | 0 (0.0%) |
| 4-Person Households | 51 (21.1%) | 0 (0.0%) |
| 5-Person Households | 8 (3.3%) | 0 (0.0%) |
| 6-Person Households | 7 (2.9%) | 0 (0.0%) |
| 7+ Person Households | 5 (2.1%) | 0 (0.0%) |
| Total | 176 (72.7%) | 66 (27.3%) |
Female Fertility in Sprague
Fertility by Age in Sprague
Average fertility rate in Sprague is 20.0 births per 1,000 women. Women in the age bracket of 20 to 34 years have the highest fertility rate with 47.0 births per 1,000 women. Women in the age bracket of 20 to 34 years acount for 100.0% of all women with births.
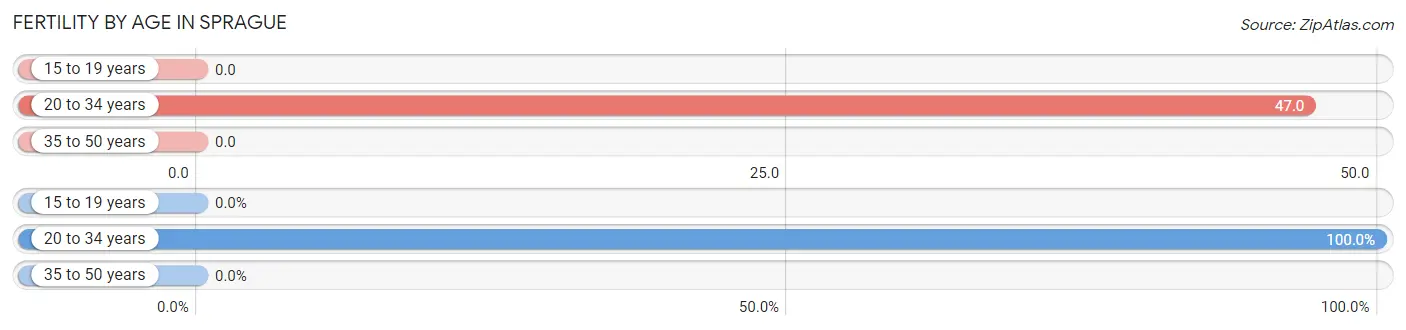
| Age Bracket | Women with Births | Births / 1,000 Women |
| 15 to 19 years | 0 (0.0%) | 0.0 |
| 20 to 34 years | 2 (100.0%) | 47.0 |
| 35 to 50 years | 0 (0.0%) | 0.0 |
| Total | 2 (100.0%) | 20.0 |
Fertility by Age by Marriage Status in Sprague
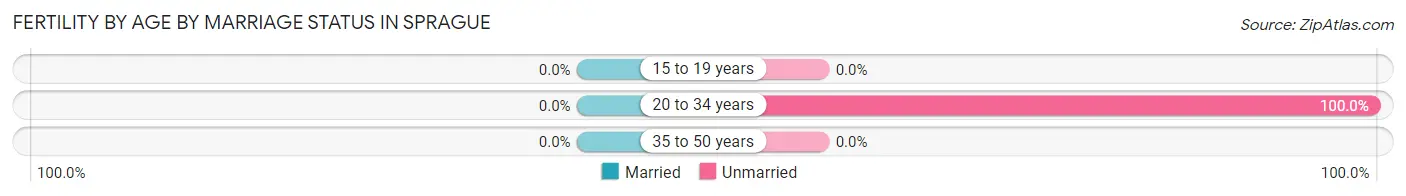
| Age Bracket | Married | Unmarried |
| 15 to 19 years | 0 (0.0%) | 0 (0.0%) |
| 20 to 34 years | 0 (0.0%) | 2 (100.0%) |
| 35 to 50 years | 0 (0.0%) | 0 (0.0%) |
| Total | 0 (0.0%) | 2 (100.0%) |
Fertility by Education in Sprague
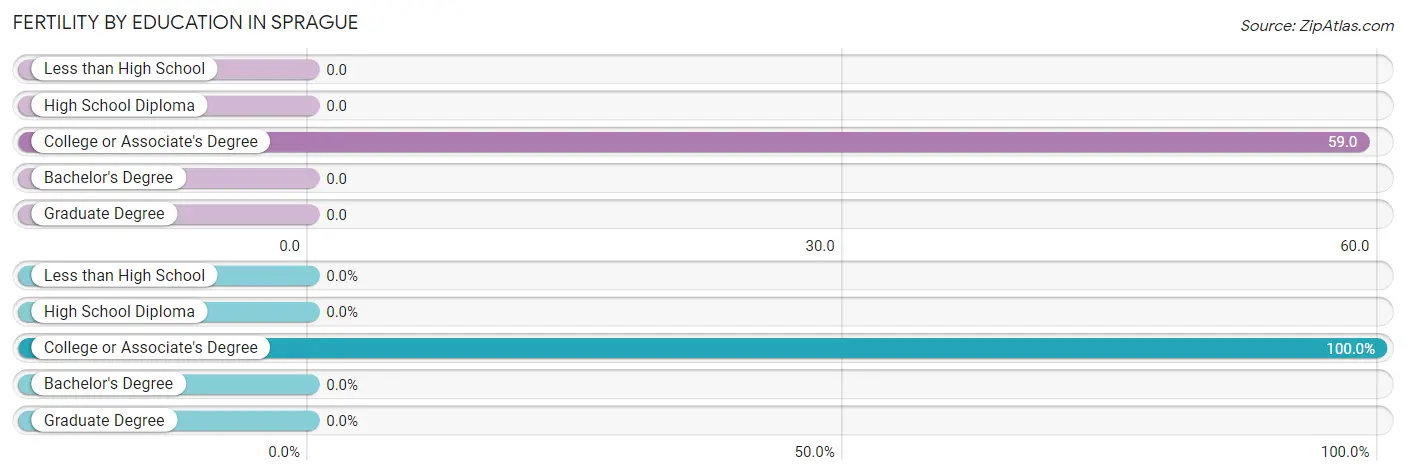
| Educational Attainment | Women with Births | Births / 1,000 Women |
| Less than High School | 0 (0.0%) | 0.0 |
| High School Diploma | 0 (0.0%) | 0.0 |
| College or Associate's Degree | 2 (100.0%) | 59.0 |
| Bachelor's Degree | 0 (0.0%) | 0.0 |
| Graduate Degree | 0 (0.0%) | 0.0 |
| Total | 2 (100.0%) | 20.0 |
Fertility by Education by Marriage Status in Sprague
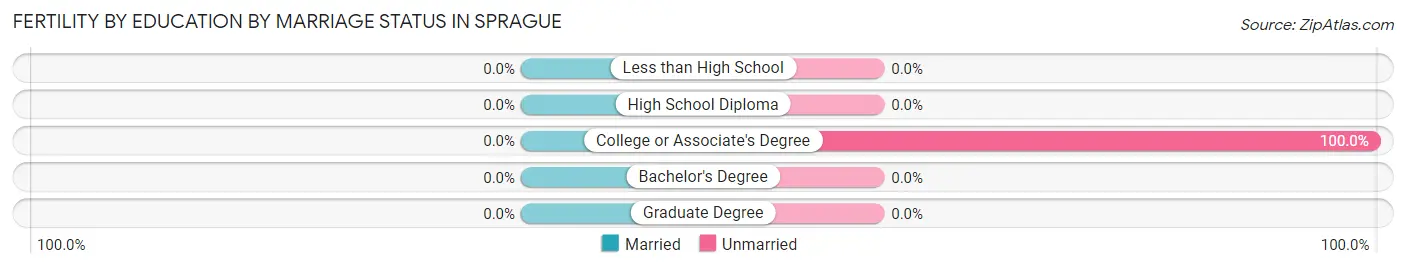
| Educational Attainment | Married | Unmarried |
| Less than High School | 0 (0.0%) | 0 (0.0%) |
| High School Diploma | 0 (0.0%) | 0 (0.0%) |
| College or Associate's Degree | 0 (0.0%) | 2 (100.0%) |
| Bachelor's Degree | 0 (0.0%) | 0 (0.0%) |
| Graduate Degree | 0 (0.0%) | 0 (0.0%) |
| Total | 0 (0.0%) | 2 (100.0%) |
Employment Characteristics in Sprague
Employment by Class of Employer in Sprague
Among the 227 employed individuals in Sprague, private company employees (128 | 56.4%), state government employees (48 | 21.1%), and local government employees (20 | 8.8%) make up the most common classes of employment.
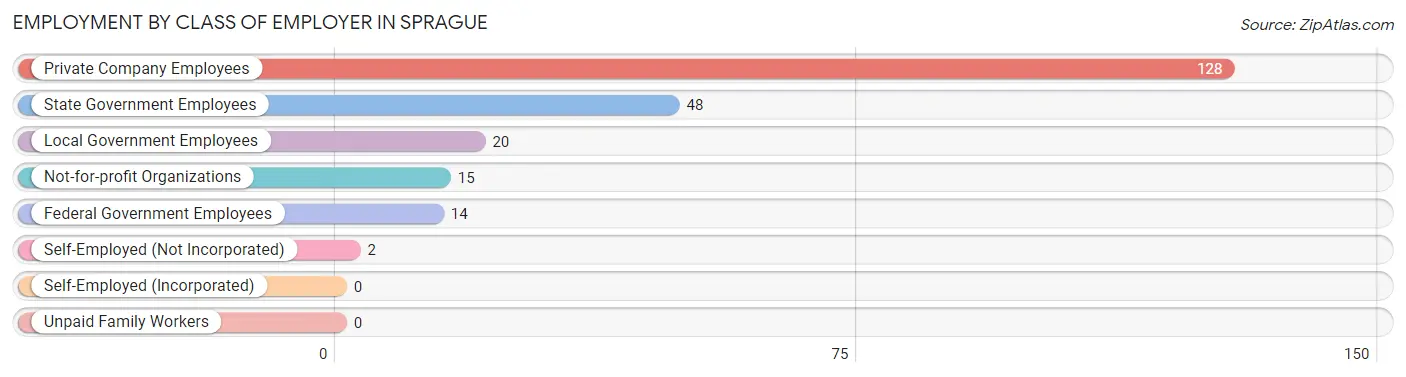
| Employer Class | # Employees | % Employees |
| Private Company Employees | 128 | 56.4% |
| Self-Employed (Incorporated) | 0 | 0.0% |
| Self-Employed (Not Incorporated) | 2 | 0.9% |
| Not-for-profit Organizations | 15 | 6.6% |
| Local Government Employees | 20 | 8.8% |
| State Government Employees | 48 | 21.1% |
| Federal Government Employees | 14 | 6.2% |
| Unpaid Family Workers | 0 | 0.0% |
| Total | 227 | 100.0% |
Employment Status by Age in Sprague
According to the labor force statistics for Sprague, out of the total population over 16 years of age (484), 54.3% or 263 individuals are in the labor force, with 12.5% or 33 of them unemployed. The age group with the highest labor force participation rate is 25 to 29 years, with 100.0% or 19 individuals in the labor force. Within the labor force, the 20 to 24 years age range has the highest percentage of unemployed individuals, with 33.3% or 8 of them being unemployed.
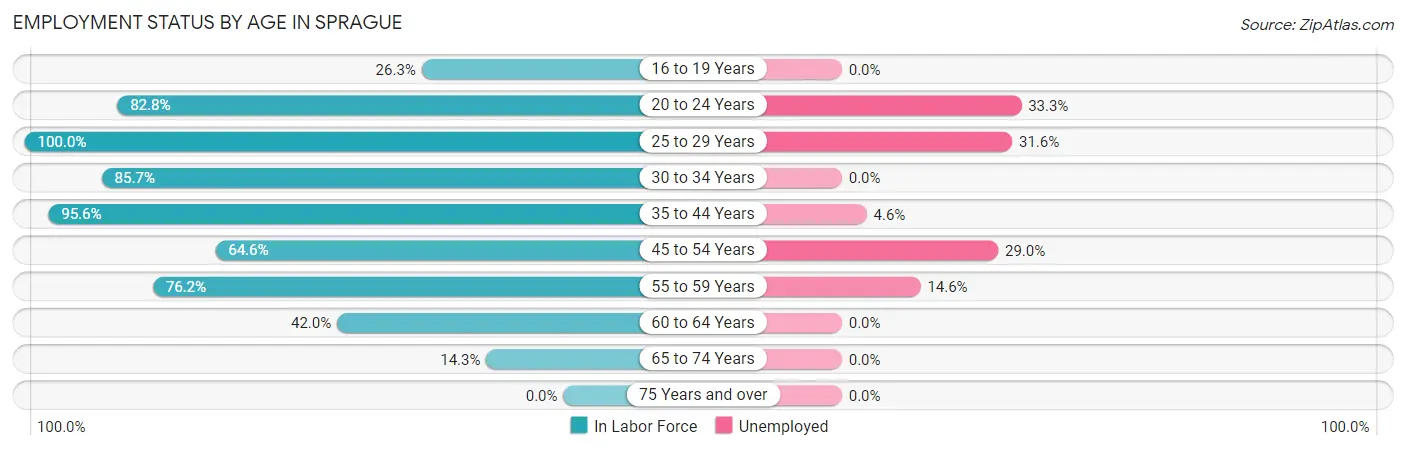
| Age Bracket | In Labor Force | Unemployed |
| 16 to 19 Years | 10 (26.3%) | 0 (0.0%) |
| 20 to 24 Years | 24 (82.8%) | 8 (33.3%) |
| 25 to 29 Years | 19 (100.0%) | 6 (31.6%) |
| 30 to 34 Years | 36 (85.7%) | 0 (0.0%) |
| 35 to 44 Years | 65 (95.6%) | 3 (4.6%) |
| 45 to 54 Years | 31 (64.6%) | 9 (29.0%) |
| 55 to 59 Years | 48 (76.2%) | 7 (14.6%) |
| 60 to 64 Years | 21 (42.0%) | 0 (0.0%) |
| 65 to 74 Years | 9 (14.3%) | 0 (0.0%) |
| 75 Years and over | 0 (0.0%) | 0 (0.0%) |
| Total | 263 (54.3%) | 33 (12.5%) |
Employment Status by Educational Attainment in Sprague
According to labor force statistics for Sprague, 75.9% of individuals (220) out of the total population between 25 and 64 years of age (290) are in the labor force, with 11.4% or 25 of them being unemployed. The group with the highest labor force participation rate are those with the educational attainment of high school diploma, with 77.6% or 66 individuals in the labor force. Within the labor force, individuals with less than high school education have the highest percentage of unemployment, with 56.3% or 9 of them being unemployed.
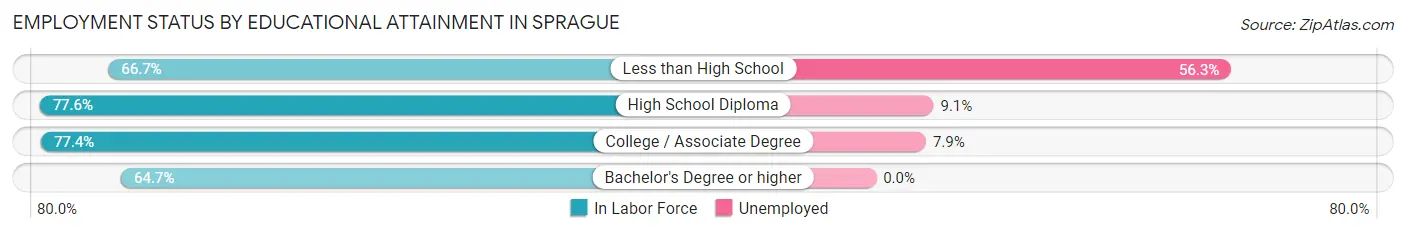
| Educational Attainment | In Labor Force | Unemployed |
| Less than High School | 16 (66.7%) | 14 (56.3%) |
| High School Diploma | 66 (77.6%) | 8 (9.1%) |
| College / Associate Degree | 127 (77.4%) | 13 (7.9%) |
| Bachelor's Degree or higher | 11 (64.7%) | 0 (0.0%) |
| Total | 220 (75.9%) | 33 (11.4%) |
Employment Occupations by Sex in Sprague
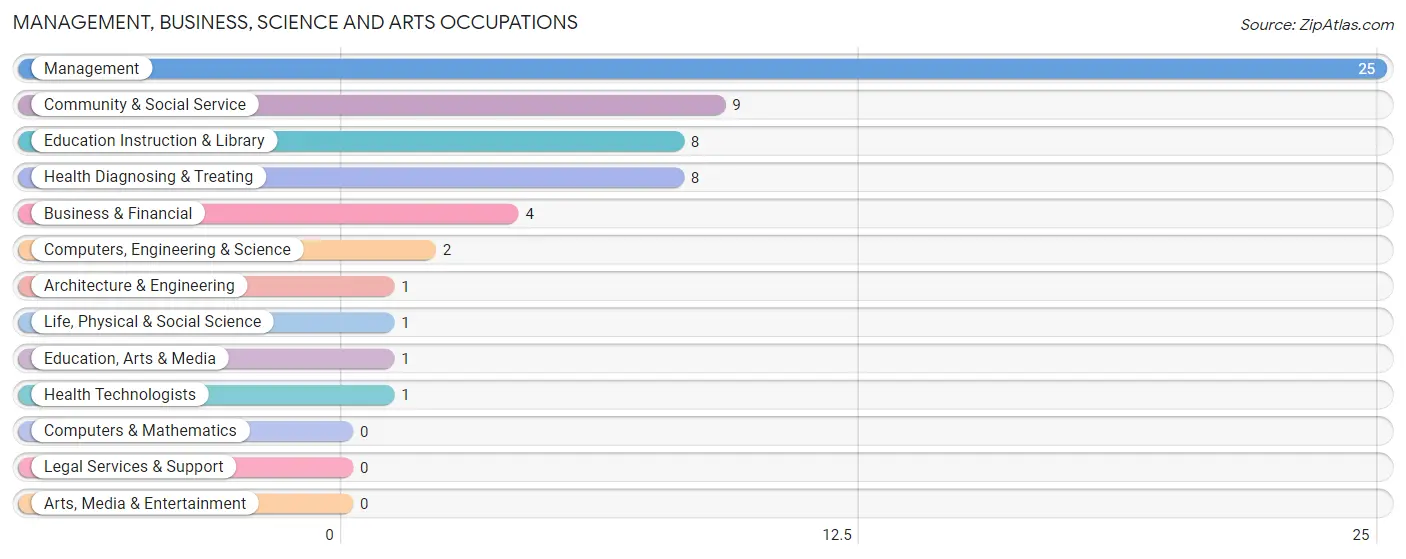
Management, Business, Science and Arts Occupations
The most common Management, Business, Science and Arts occupations in Sprague are Management (25 | 10.9%), Community & Social Service (9 | 3.9%), Education Instruction & Library (8 | 3.5%), Health Diagnosing & Treating (8 | 3.5%), and Business & Financial (4 | 1.7%).
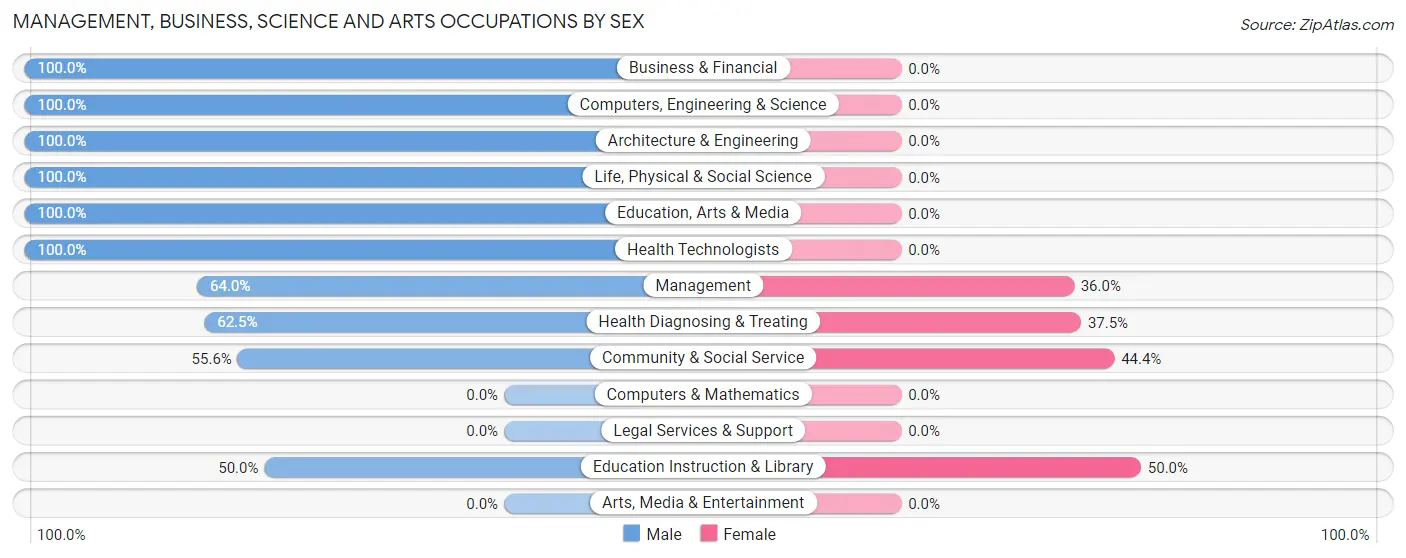
Management, Business, Science and Arts Occupations by Sex
Within the Management, Business, Science and Arts occupations in Sprague, the most male-oriented occupations are Business & Financial (100.0%), Computers, Engineering & Science (100.0%), and Architecture & Engineering (100.0%), while the most female-oriented occupations are Education Instruction & Library (50.0%), Community & Social Service (44.4%), and Health Diagnosing & Treating (37.5%).
| Occupation | Male | Female |
| Management | 16 (64.0%) | 9 (36.0%) |
| Business & Financial | 4 (100.0%) | 0 (0.0%) |
| Computers, Engineering & Science | 2 (100.0%) | 0 (0.0%) |
| Computers & Mathematics | 0 (0.0%) | 0 (0.0%) |
| Architecture & Engineering | 1 (100.0%) | 0 (0.0%) |
| Life, Physical & Social Science | 1 (100.0%) | 0 (0.0%) |
| Community & Social Service | 5 (55.6%) | 4 (44.4%) |
| Education, Arts & Media | 1 (100.0%) | 0 (0.0%) |
| Legal Services & Support | 0 (0.0%) | 0 (0.0%) |
| Education Instruction & Library | 4 (50.0%) | 4 (50.0%) |
| Arts, Media & Entertainment | 0 (0.0%) | 0 (0.0%) |
| Health Diagnosing & Treating | 5 (62.5%) | 3 (37.5%) |
| Health Technologists | 1 (100.0%) | 0 (0.0%) |
| Total (Category) | 32 (66.7%) | 16 (33.3%) |
| Total (Overall) | 141 (61.3%) | 89 (38.7%) |
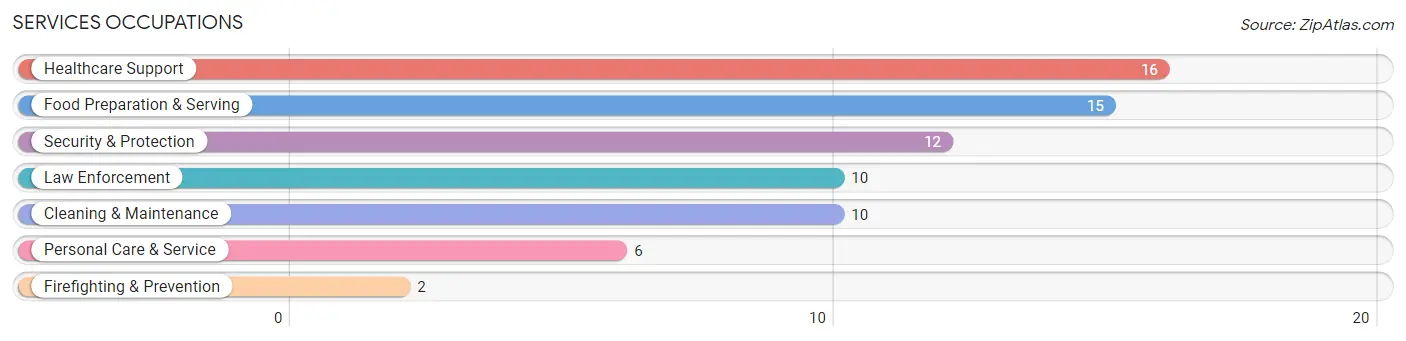
Services Occupations
The most common Services occupations in Sprague are Healthcare Support (16 | 7.0%), Food Preparation & Serving (15 | 6.5%), Security & Protection (12 | 5.2%), Law Enforcement (10 | 4.3%), and Cleaning & Maintenance (10 | 4.3%).
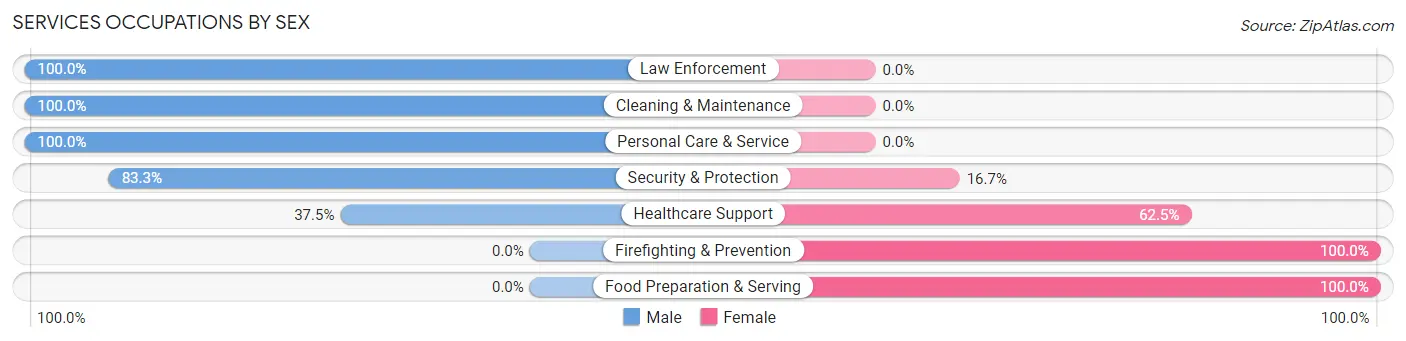
Services Occupations by Sex
Within the Services occupations in Sprague, the most male-oriented occupations are Law Enforcement (100.0%), Cleaning & Maintenance (100.0%), and Personal Care & Service (100.0%), while the most female-oriented occupations are Firefighting & Prevention (100.0%), Food Preparation & Serving (100.0%), and Healthcare Support (62.5%).
| Occupation | Male | Female |
| Healthcare Support | 6 (37.5%) | 10 (62.5%) |
| Security & Protection | 10 (83.3%) | 2 (16.7%) |
| Firefighting & Prevention | 0 (0.0%) | 2 (100.0%) |
| Law Enforcement | 10 (100.0%) | 0 (0.0%) |
| Food Preparation & Serving | 0 (0.0%) | 15 (100.0%) |
| Cleaning & Maintenance | 10 (100.0%) | 0 (0.0%) |
| Personal Care & Service | 6 (100.0%) | 0 (0.0%) |
| Total (Category) | 32 (54.2%) | 27 (45.8%) |
| Total (Overall) | 141 (61.3%) | 89 (38.7%) |
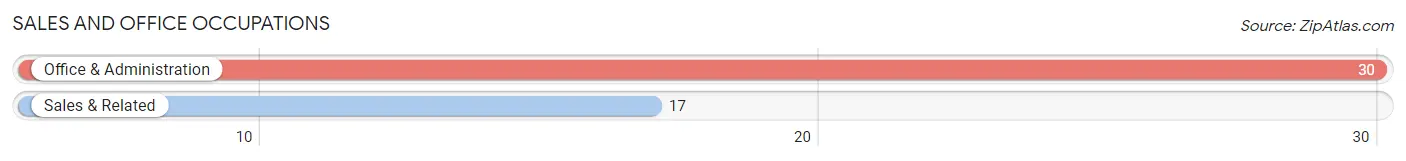
Sales and Office Occupations
The most common Sales and Office occupations in Sprague are Office & Administration (30 | 13.0%), and Sales & Related (17 | 7.4%).
Sales and Office Occupations by Sex
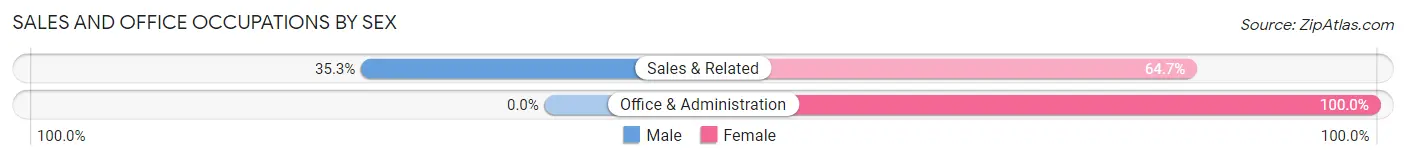
| Occupation | Male | Female |
| Sales & Related | 6 (35.3%) | 11 (64.7%) |
| Office & Administration | 0 (0.0%) | 30 (100.0%) |
| Total (Category) | 6 (12.8%) | 41 (87.2%) |
| Total (Overall) | 141 (61.3%) | 89 (38.7%) |
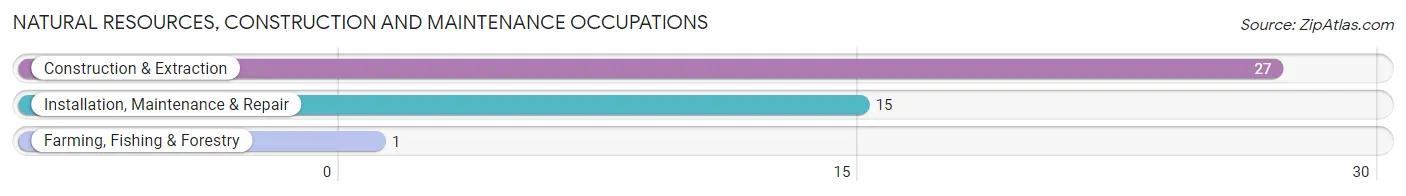
Natural Resources, Construction and Maintenance Occupations
The most common Natural Resources, Construction and Maintenance occupations in Sprague are Construction & Extraction (27 | 11.7%), Installation, Maintenance & Repair (15 | 6.5%), and Farming, Fishing & Forestry (1 | 0.4%).
Natural Resources, Construction and Maintenance Occupations by Sex
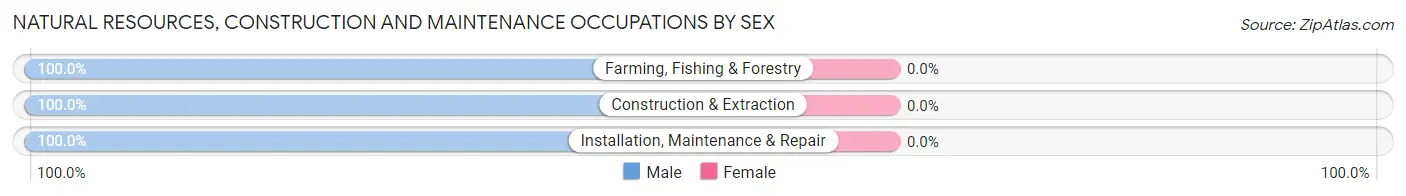
| Occupation | Male | Female |
| Farming, Fishing & Forestry | 1 (100.0%) | 0 (0.0%) |
| Construction & Extraction | 27 (100.0%) | 0 (0.0%) |
| Installation, Maintenance & Repair | 15 (100.0%) | 0 (0.0%) |
| Total (Category) | 43 (100.0%) | 0 (0.0%) |
| Total (Overall) | 141 (61.3%) | 89 (38.7%) |
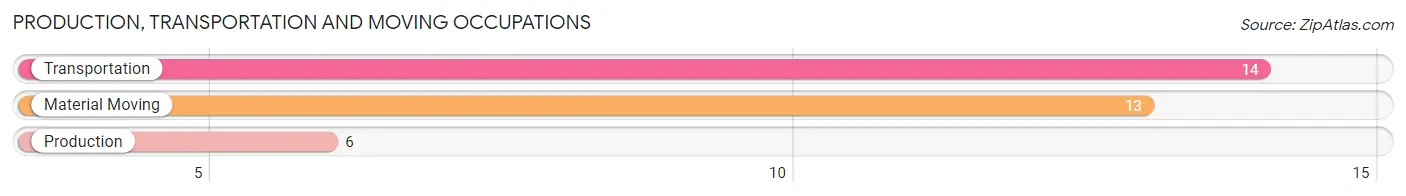
Production, Transportation and Moving Occupations
The most common Production, Transportation and Moving occupations in Sprague are Transportation (14 | 6.1%), Material Moving (13 | 5.7%), and Production (6 | 2.6%).
Production, Transportation and Moving Occupations by Sex
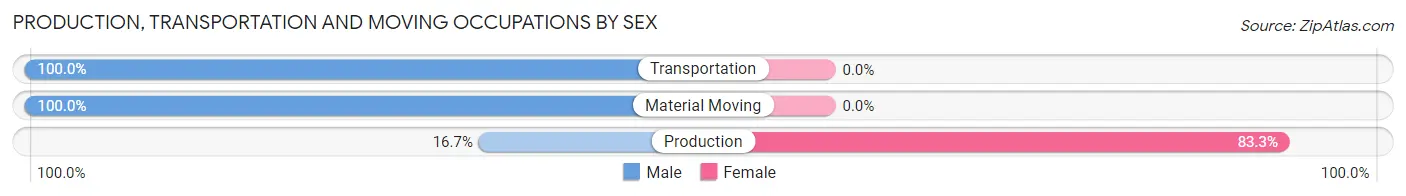
| Occupation | Male | Female |
| Production | 1 (16.7%) | 5 (83.3%) |
| Transportation | 14 (100.0%) | 0 (0.0%) |
| Material Moving | 13 (100.0%) | 0 (0.0%) |
| Total (Category) | 28 (84.9%) | 5 (15.1%) |
| Total (Overall) | 141 (61.3%) | 89 (38.7%) |
Employment Industries by Sex in Sprague
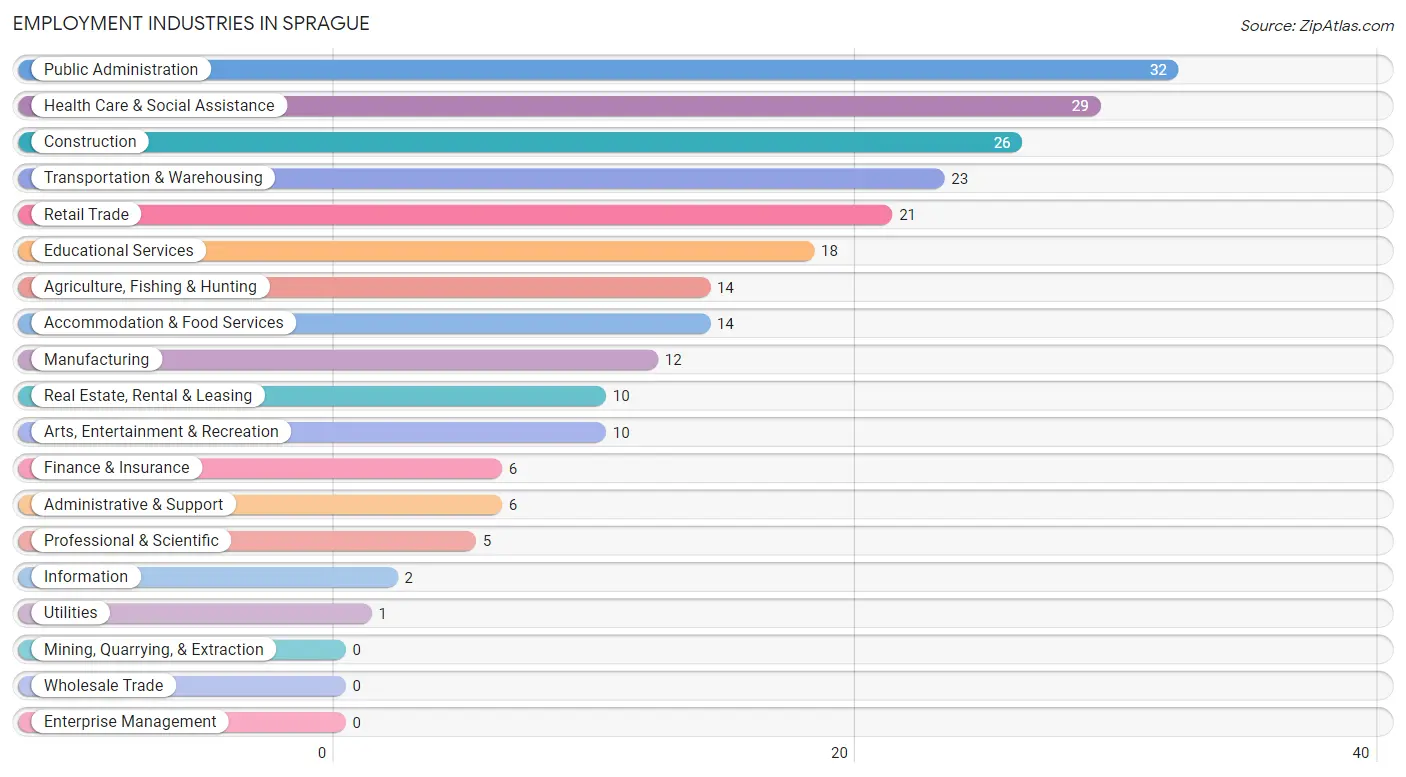
Employment Industries in Sprague
The major employment industries in Sprague include Public Administration (32 | 13.9%), Health Care & Social Assistance (29 | 12.6%), Construction (26 | 11.3%), Transportation & Warehousing (23 | 10.0%), and Retail Trade (21 | 9.1%).
Employment Industries by Sex in Sprague
The Sprague industries that see more men than women are Agriculture, Fishing & Hunting (100.0%), Construction (100.0%), and Utilities (100.0%), whereas the industries that tend to have a higher number of women are Information (100.0%), Accommodation & Food Services (100.0%), and Finance & Insurance (83.3%).
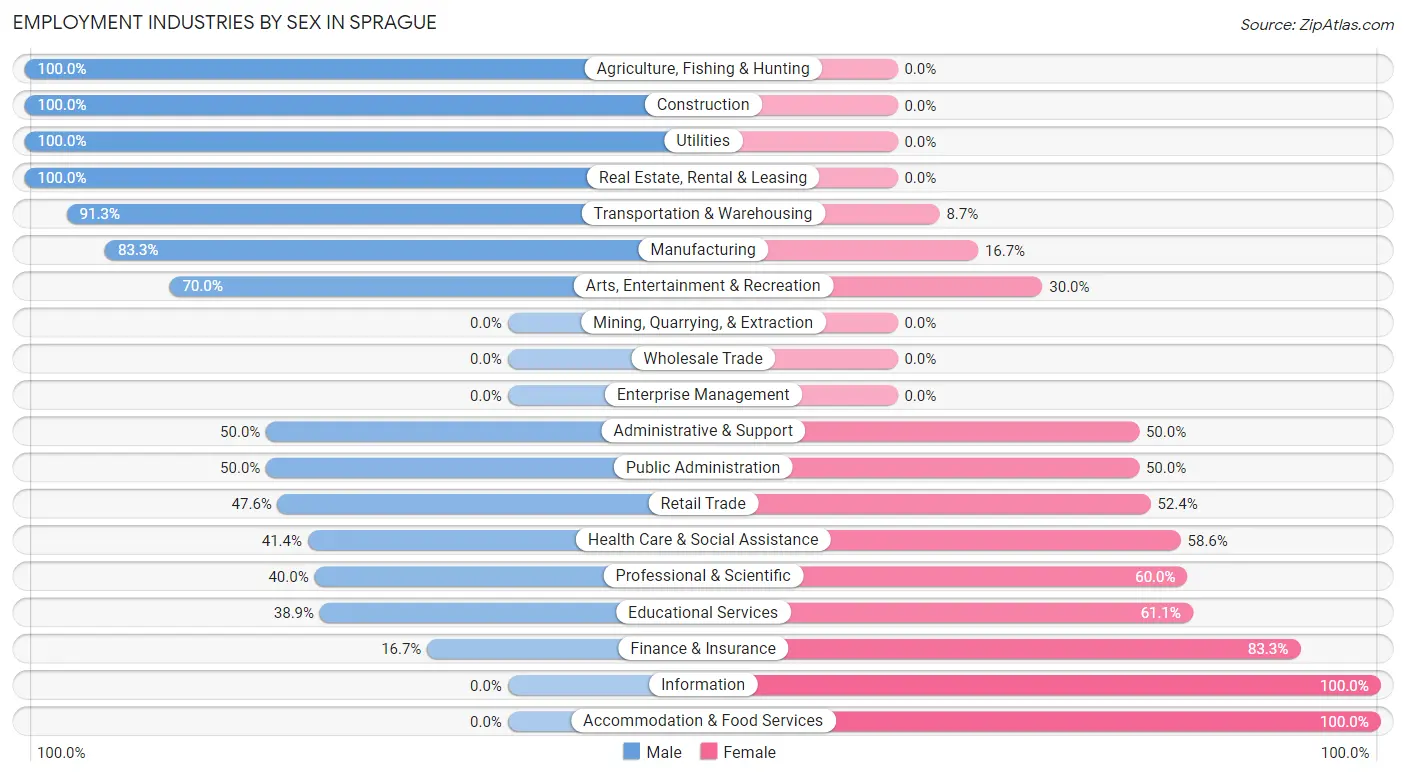
| Industry | Male | Female |
| Agriculture, Fishing & Hunting | 14 (100.0%) | 0 (0.0%) |
| Mining, Quarrying, & Extraction | 0 (0.0%) | 0 (0.0%) |
| Construction | 26 (100.0%) | 0 (0.0%) |
| Manufacturing | 10 (83.3%) | 2 (16.7%) |
| Wholesale Trade | 0 (0.0%) | 0 (0.0%) |
| Retail Trade | 10 (47.6%) | 11 (52.4%) |
| Transportation & Warehousing | 21 (91.3%) | 2 (8.7%) |
| Utilities | 1 (100.0%) | 0 (0.0%) |
| Information | 0 (0.0%) | 2 (100.0%) |
| Finance & Insurance | 1 (16.7%) | 5 (83.3%) |
| Real Estate, Rental & Leasing | 10 (100.0%) | 0 (0.0%) |
| Professional & Scientific | 2 (40.0%) | 3 (60.0%) |
| Enterprise Management | 0 (0.0%) | 0 (0.0%) |
| Administrative & Support | 3 (50.0%) | 3 (50.0%) |
| Educational Services | 7 (38.9%) | 11 (61.1%) |
| Health Care & Social Assistance | 12 (41.4%) | 17 (58.6%) |
| Arts, Entertainment & Recreation | 7 (70.0%) | 3 (30.0%) |
| Accommodation & Food Services | 0 (0.0%) | 14 (100.0%) |
| Public Administration | 16 (50.0%) | 16 (50.0%) |
| Total | 141 (61.3%) | 89 (38.7%) |
Education in Sprague
School Enrollment in Sprague
The most common levels of schooling among the 115 students in Sprague are high school (31 | 27.0%), middle school (30 | 26.1%), and elementary school (28 | 24.3%).
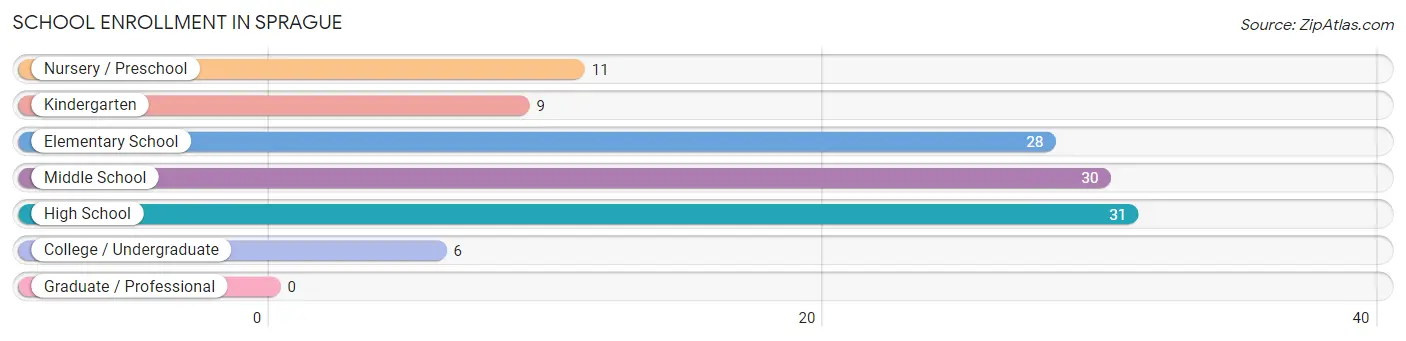
| School Level | # Students | % Students |
| Nursery / Preschool | 11 | 9.6% |
| Kindergarten | 9 | 7.8% |
| Elementary School | 28 | 24.3% |
| Middle School | 30 | 26.1% |
| High School | 31 | 27.0% |
| College / Undergraduate | 6 | 5.2% |
| Graduate / Professional | 0 | 0.0% |
| Total | 115 | 100.0% |
School Enrollment by Age by Funding Source in Sprague
Out of a total of 115 students who are enrolled in schools in Sprague, 12 (10.4%) attend a private institution, while the remaining 103 (89.6%) are enrolled in public schools. The age group of 18 to 19 year olds has the highest likelihood of being enrolled in private schools, with 3 (60.0% in the age bracket) enrolled. Conversely, the age group of 3 to 4 year olds has the lowest likelihood of being enrolled in a private school, with 11 (100.0% in the age bracket) attending a public institution.
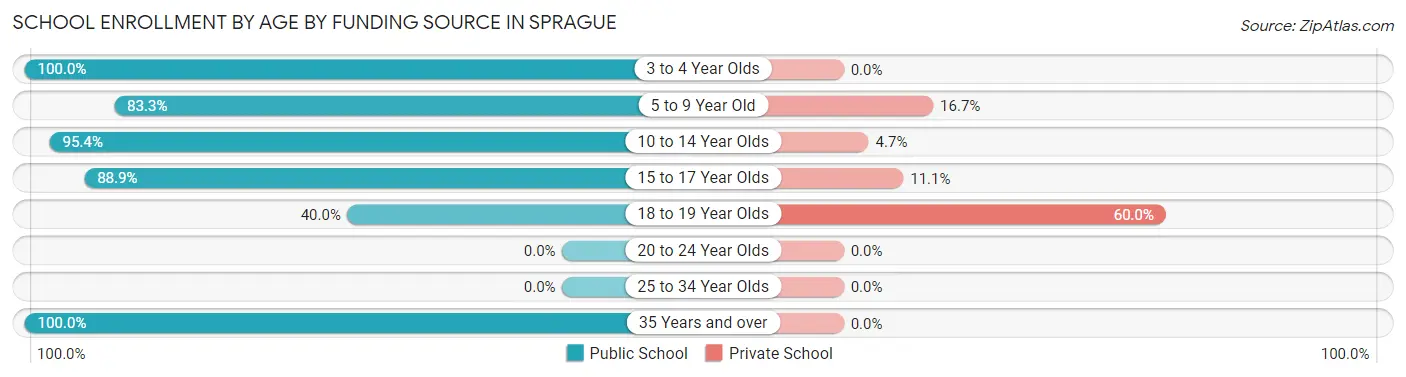
| Age Bracket | Public School | Private School |
| 3 to 4 Year Olds | 11 (100.0%) | 0 (0.0%) |
| 5 to 9 Year Old | 20 (83.3%) | 4 (16.7%) |
| 10 to 14 Year Olds | 41 (95.4%) | 2 (4.6%) |
| 15 to 17 Year Olds | 24 (88.9%) | 3 (11.1%) |
| 18 to 19 Year Olds | 2 (40.0%) | 3 (60.0%) |
| 20 to 24 Year Olds | 0 (0.0%) | 0 (0.0%) |
| 25 to 34 Year Olds | 0 (0.0%) | 0 (0.0%) |
| 35 Years and over | 5 (100.0%) | 0 (0.0%) |
| Total | 103 (89.6%) | 12 (10.4%) |
Educational Attainment by Field of Study in Sprague
Education (15 | 34.9%), business (9 | 20.9%), bio, nature & agricultural (7 | 16.3%), liberal arts & history (4 | 9.3%), and psychology (3 | 7.0%) are the most common fields of study among 43 individuals in Sprague who have obtained a bachelor's degree or higher.
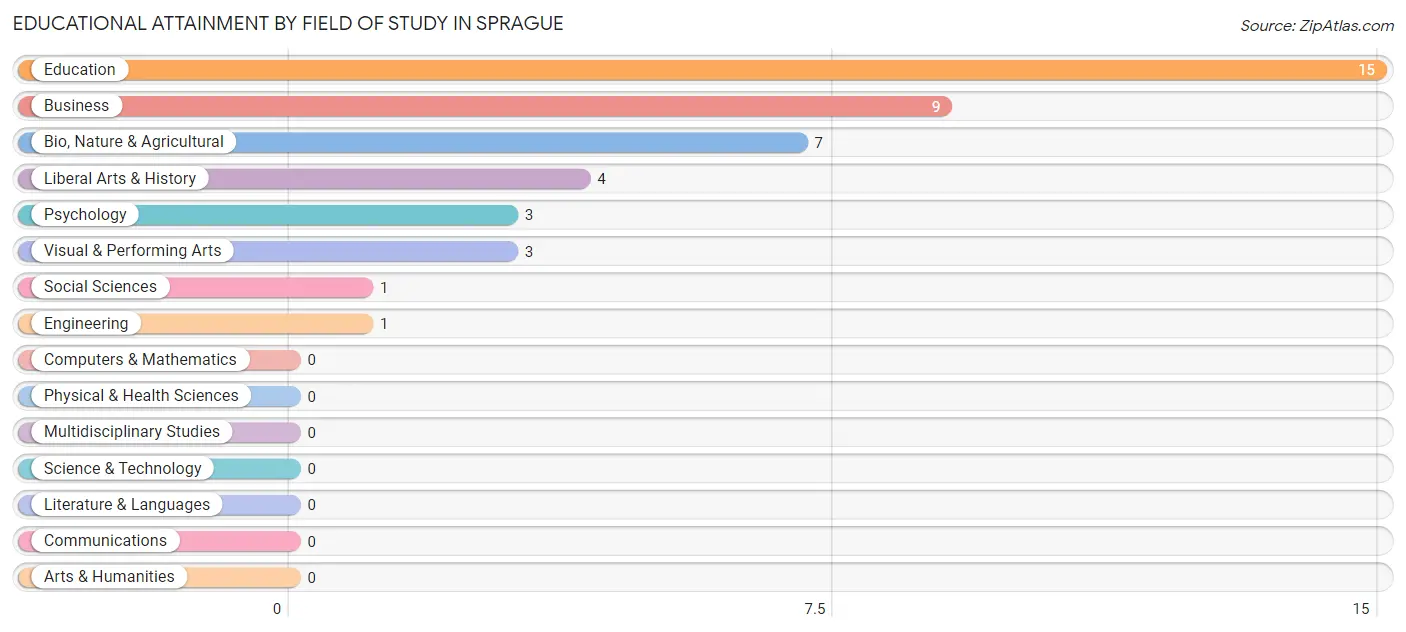
| Field of Study | # Graduates | % Graduates |
| Computers & Mathematics | 0 | 0.0% |
| Bio, Nature & Agricultural | 7 | 16.3% |
| Physical & Health Sciences | 0 | 0.0% |
| Psychology | 3 | 7.0% |
| Social Sciences | 1 | 2.3% |
| Engineering | 1 | 2.3% |
| Multidisciplinary Studies | 0 | 0.0% |
| Science & Technology | 0 | 0.0% |
| Business | 9 | 20.9% |
| Education | 15 | 34.9% |
| Literature & Languages | 0 | 0.0% |
| Liberal Arts & History | 4 | 9.3% |
| Visual & Performing Arts | 3 | 7.0% |
| Communications | 0 | 0.0% |
| Arts & Humanities | 0 | 0.0% |
| Total | 43 | 100.0% |
Transportation & Commute in Sprague
Vehicle Availability by Sex in Sprague
The most prevalent vehicle ownership categories in Sprague are males with 3 vehicles (65, accounting for 46.8%) and females with 3 vehicles (22, making up 73.9%).
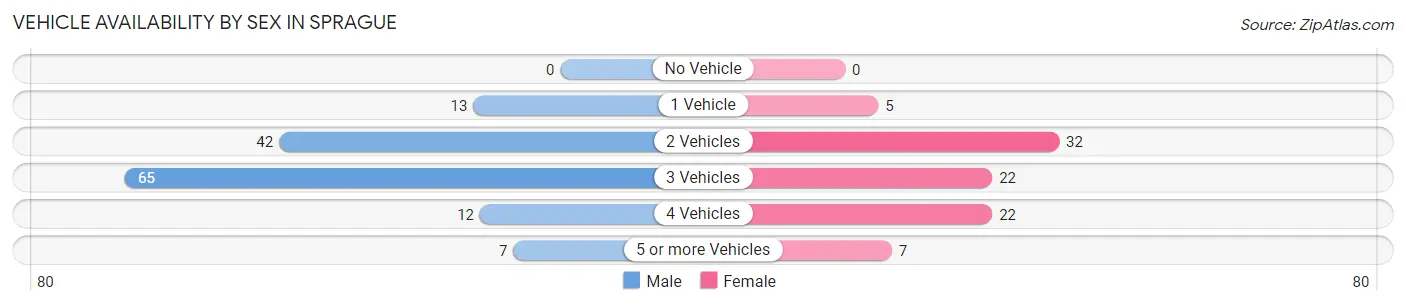
| Vehicles Available | Male | Female |
| No Vehicle | 0 (0.0%) | 0 (0.0%) |
| 1 Vehicle | 13 (9.3%) | 5 (5.7%) |
| 2 Vehicles | 42 (30.2%) | 32 (36.4%) |
| 3 Vehicles | 65 (46.8%) | 22 (25.0%) |
| 4 Vehicles | 12 (8.6%) | 22 (25.0%) |
| 5 or more Vehicles | 7 (5.0%) | 7 (8.0%) |
| Total | 139 (100.0%) | 88 (100.0%) |
Commute Time in Sprague
The most frequently occuring commute durations in Sprague are 30 to 34 minutes (61 commuters, 27.1%), 40 to 44 minutes (37 commuters, 16.4%), and 25 to 29 minutes (30 commuters, 13.3%).
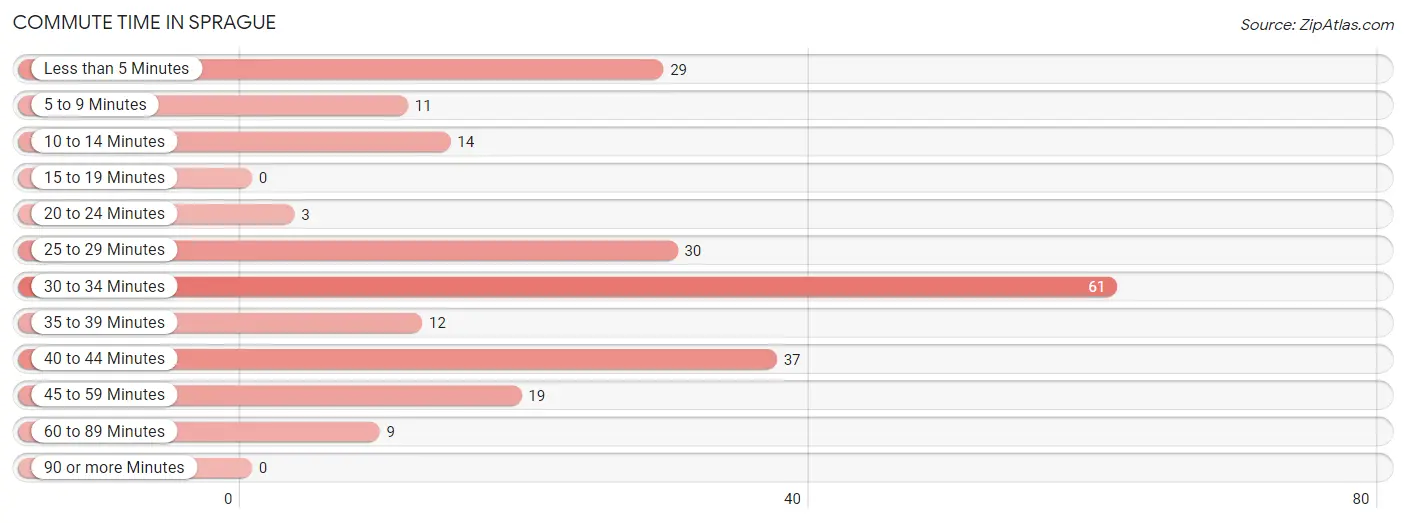
| Commute Time | # Commuters | % Commuters |
| Less than 5 Minutes | 29 | 12.9% |
| 5 to 9 Minutes | 11 | 4.9% |
| 10 to 14 Minutes | 14 | 6.2% |
| 15 to 19 Minutes | 0 | 0.0% |
| 20 to 24 Minutes | 3 | 1.3% |
| 25 to 29 Minutes | 30 | 13.3% |
| 30 to 34 Minutes | 61 | 27.1% |
| 35 to 39 Minutes | 12 | 5.3% |
| 40 to 44 Minutes | 37 | 16.4% |
| 45 to 59 Minutes | 19 | 8.4% |
| 60 to 89 Minutes | 9 | 4.0% |
| 90 or more Minutes | 0 | 0.0% |
Commute Time by Sex in Sprague
The most common commute times in Sprague are 30 to 34 minutes (44 commuters, 31.7%) for males and 30 to 34 minutes (17 commuters, 19.8%) for females.
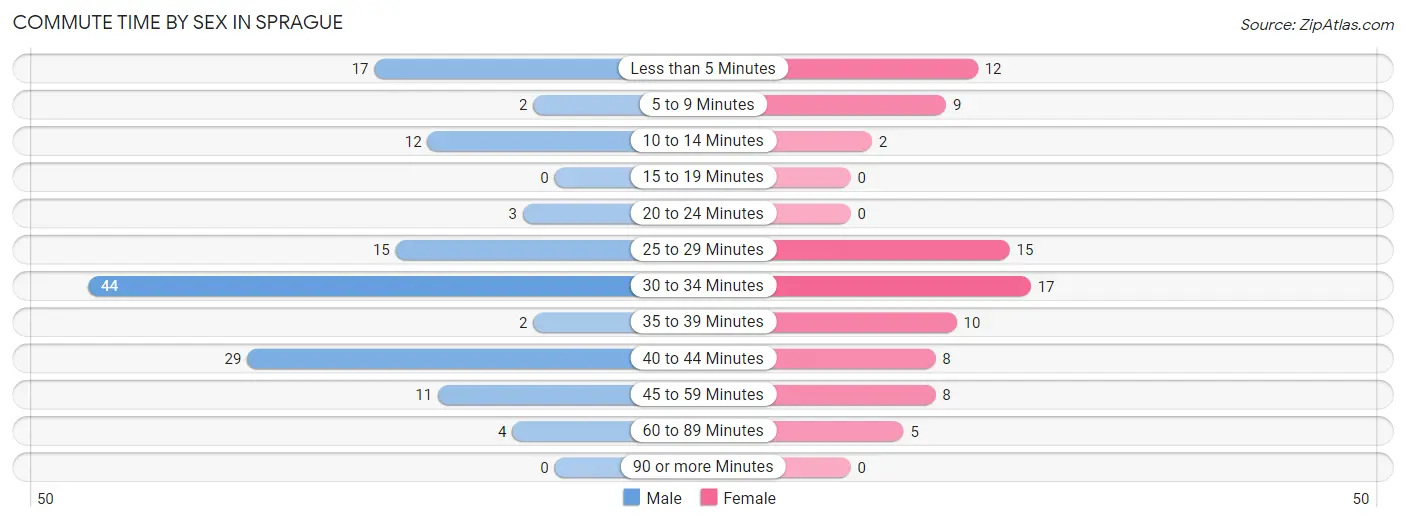
| Commute Time | Male | Female |
| Less than 5 Minutes | 17 (12.2%) | 12 (14.0%) |
| 5 to 9 Minutes | 2 (1.4%) | 9 (10.5%) |
| 10 to 14 Minutes | 12 (8.6%) | 2 (2.3%) |
| 15 to 19 Minutes | 0 (0.0%) | 0 (0.0%) |
| 20 to 24 Minutes | 3 (2.2%) | 0 (0.0%) |
| 25 to 29 Minutes | 15 (10.8%) | 15 (17.4%) |
| 30 to 34 Minutes | 44 (31.7%) | 17 (19.8%) |
| 35 to 39 Minutes | 2 (1.4%) | 10 (11.6%) |
| 40 to 44 Minutes | 29 (20.9%) | 8 (9.3%) |
| 45 to 59 Minutes | 11 (7.9%) | 8 (9.3%) |
| 60 to 89 Minutes | 4 (2.9%) | 5 (5.8%) |
| 90 or more Minutes | 0 (0.0%) | 0 (0.0%) |
Time of Departure to Work by Sex in Sprague
The most frequent times of departure to work in Sprague are 6:00 AM to 6:29 AM (31, 22.3%) for males and 7:30 AM to 7:59 AM (17, 19.8%) for females.
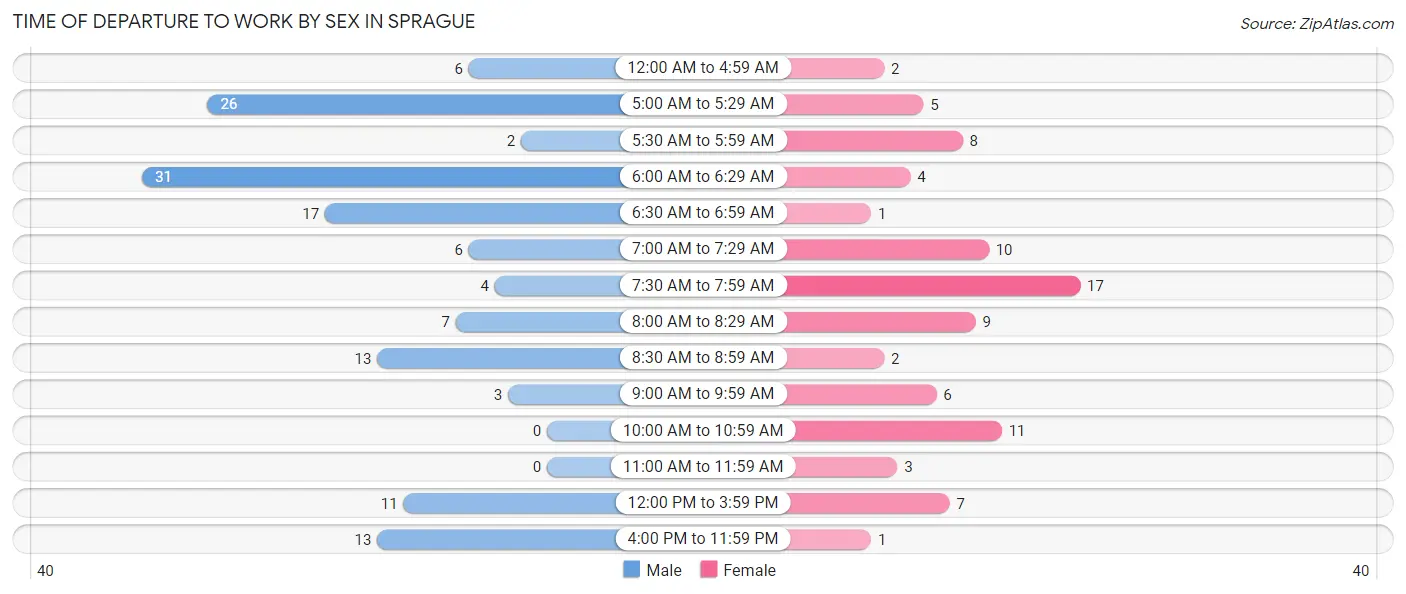
| Time of Departure | Male | Female |
| 12:00 AM to 4:59 AM | 6 (4.3%) | 2 (2.3%) |
| 5:00 AM to 5:29 AM | 26 (18.7%) | 5 (5.8%) |
| 5:30 AM to 5:59 AM | 2 (1.4%) | 8 (9.3%) |
| 6:00 AM to 6:29 AM | 31 (22.3%) | 4 (4.6%) |
| 6:30 AM to 6:59 AM | 17 (12.2%) | 1 (1.2%) |
| 7:00 AM to 7:29 AM | 6 (4.3%) | 10 (11.6%) |
| 7:30 AM to 7:59 AM | 4 (2.9%) | 17 (19.8%) |
| 8:00 AM to 8:29 AM | 7 (5.0%) | 9 (10.5%) |
| 8:30 AM to 8:59 AM | 13 (9.3%) | 2 (2.3%) |
| 9:00 AM to 9:59 AM | 3 (2.2%) | 6 (7.0%) |
| 10:00 AM to 10:59 AM | 0 (0.0%) | 11 (12.8%) |
| 11:00 AM to 11:59 AM | 0 (0.0%) | 3 (3.5%) |
| 12:00 PM to 3:59 PM | 11 (7.9%) | 7 (8.1%) |
| 4:00 PM to 11:59 PM | 13 (9.3%) | 1 (1.2%) |
| Total | 139 (100.0%) | 86 (100.0%) |
Housing Occupancy in Sprague
Occupancy by Ownership in Sprague
Of the total 242 dwellings in Sprague, owner-occupied units account for 208 (86.0%), while renter-occupied units make up 34 (14.1%).
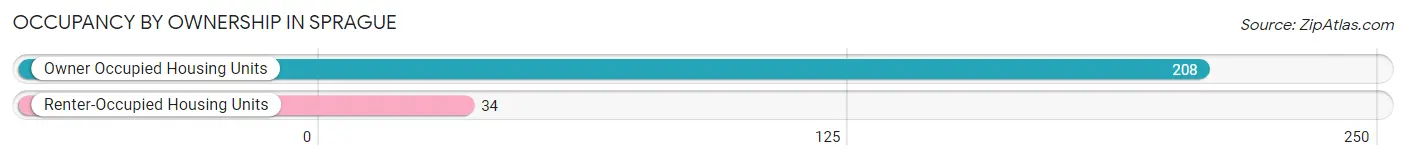
| Occupancy | # Housing Units | % Housing Units |
| Owner Occupied Housing Units | 208 | 86.0% |
| Renter-Occupied Housing Units | 34 | 14.1% |
| Total Occupied Housing Units | 242 | 100.0% |
Occupancy by Household Size in Sprague
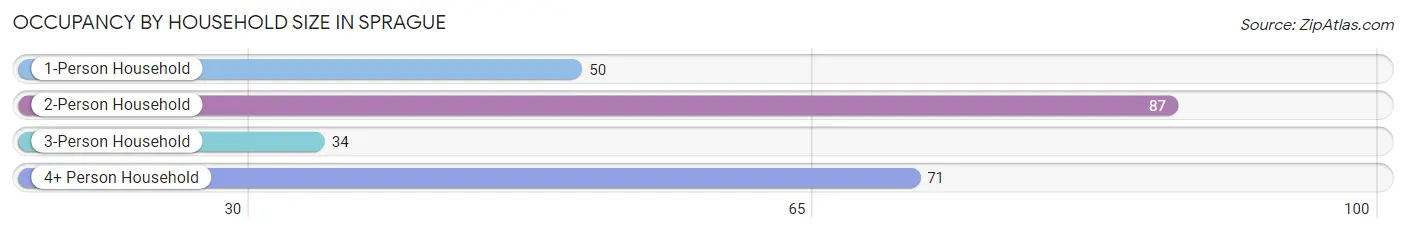
| Household Size | # Housing Units | % Housing Units |
| 1-Person Household | 50 | 20.7% |
| 2-Person Household | 87 | 35.9% |
| 3-Person Household | 34 | 14.1% |
| 4+ Person Household | 71 | 29.3% |
| Total Housing Units | 242 | 100.0% |
Occupancy by Ownership by Household Size in Sprague
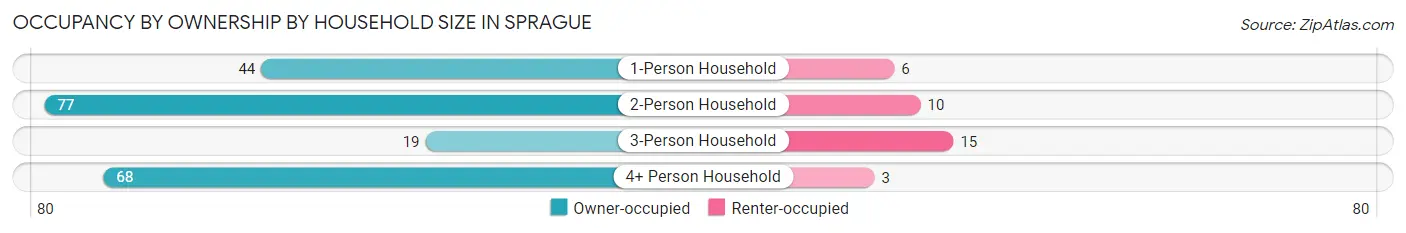
| Household Size | Owner-occupied | Renter-occupied |
| 1-Person Household | 44 (88.0%) | 6 (12.0%) |
| 2-Person Household | 77 (88.5%) | 10 (11.5%) |
| 3-Person Household | 19 (55.9%) | 15 (44.1%) |
| 4+ Person Household | 68 (95.8%) | 3 (4.2%) |
| Total Housing Units | 208 (86.0%) | 34 (14.1%) |
Occupancy by Educational Attainment in Sprague
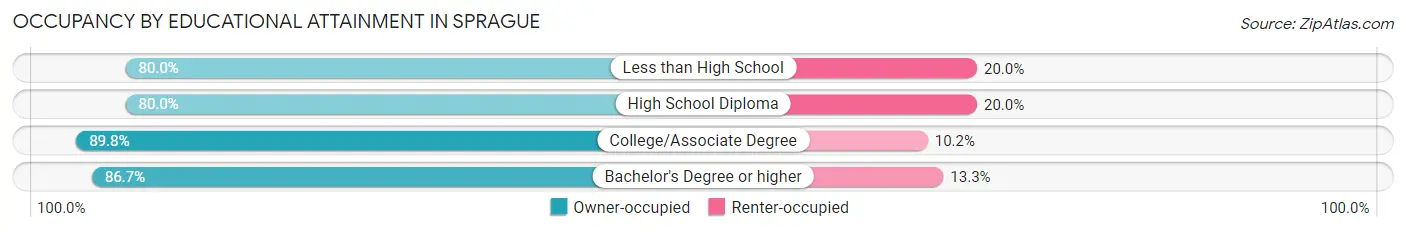
| Household Size | Owner-occupied | Renter-occupied |
| Less than High School | 20 (80.0%) | 5 (20.0%) |
| High School Diploma | 48 (80.0%) | 12 (20.0%) |
| College/Associate Degree | 114 (89.8%) | 13 (10.2%) |
| Bachelor's Degree or higher | 26 (86.7%) | 4 (13.3%) |
Occupancy by Age of Householder in Sprague
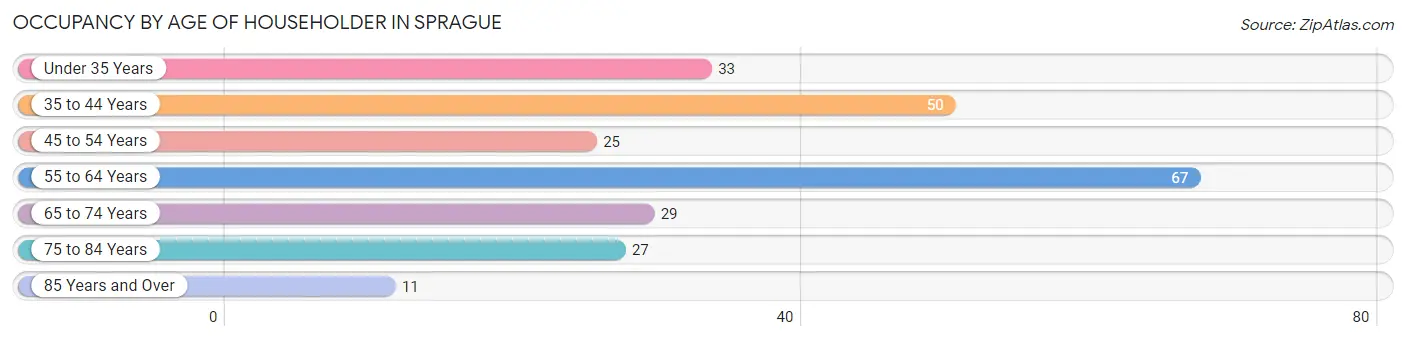
| Age Bracket | # Households | % Households |
| Under 35 Years | 33 | 13.6% |
| 35 to 44 Years | 50 | 20.7% |
| 45 to 54 Years | 25 | 10.3% |
| 55 to 64 Years | 67 | 27.7% |
| 65 to 74 Years | 29 | 12.0% |
| 75 to 84 Years | 27 | 11.2% |
| 85 Years and Over | 11 | 4.5% |
| Total | 242 | 100.0% |
Housing Finances in Sprague
Median Income by Occupancy in Sprague
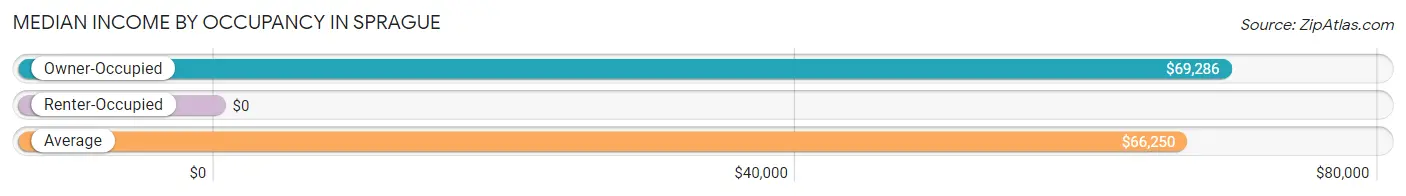
| Occupancy Type | # Households | Median Income |
| Owner-Occupied | 208 (86.0%) | $69,286 |
| Renter-Occupied | 34 (14.1%) | $0 |
| Average | 242 (100.0%) | $66,250 |
Occupancy by Householder Income Bracket in Sprague
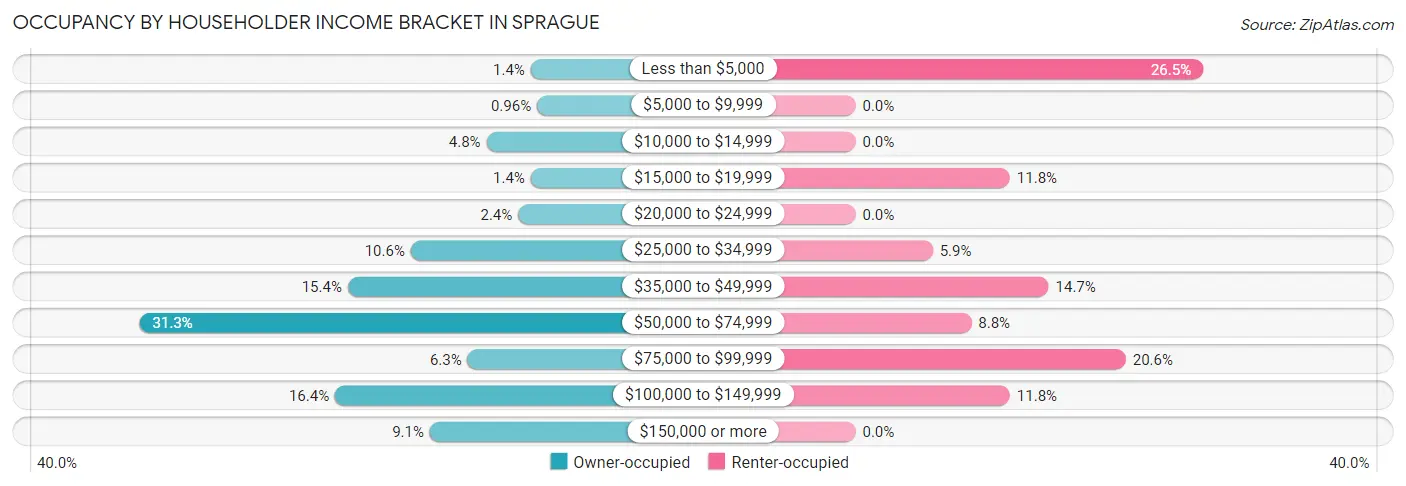
| Income Bracket | Owner-occupied | Renter-occupied |
| Less than $5,000 | 3 (1.4%) | 9 (26.5%) |
| $5,000 to $9,999 | 2 (1.0%) | 0 (0.0%) |
| $10,000 to $14,999 | 10 (4.8%) | 0 (0.0%) |
| $15,000 to $19,999 | 3 (1.4%) | 4 (11.8%) |
| $20,000 to $24,999 | 5 (2.4%) | 0 (0.0%) |
| $25,000 to $34,999 | 22 (10.6%) | 2 (5.9%) |
| $35,000 to $49,999 | 32 (15.4%) | 5 (14.7%) |
| $50,000 to $74,999 | 65 (31.2%) | 3 (8.8%) |
| $75,000 to $99,999 | 13 (6.2%) | 7 (20.6%) |
| $100,000 to $149,999 | 34 (16.4%) | 4 (11.8%) |
| $150,000 or more | 19 (9.1%) | 0 (0.0%) |
| Total | 208 (100.0%) | 34 (100.0%) |
Monthly Housing Cost Tiers in Sprague
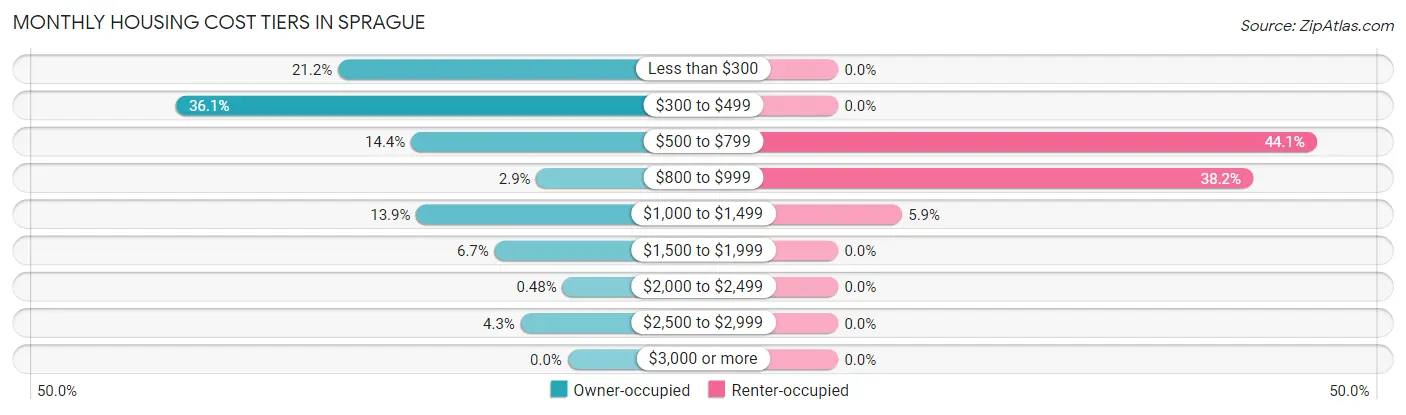
| Monthly Cost | Owner-occupied | Renter-occupied |
| Less than $300 | 44 (21.1%) | 0 (0.0%) |
| $300 to $499 | 75 (36.1%) | 0 (0.0%) |
| $500 to $799 | 30 (14.4%) | 15 (44.1%) |
| $800 to $999 | 6 (2.9%) | 13 (38.2%) |
| $1,000 to $1,499 | 29 (13.9%) | 2 (5.9%) |
| $1,500 to $1,999 | 14 (6.7%) | 0 (0.0%) |
| $2,000 to $2,499 | 1 (0.5%) | 0 (0.0%) |
| $2,500 to $2,999 | 9 (4.3%) | 0 (0.0%) |
| $3,000 or more | 0 (0.0%) | 0 (0.0%) |
| Total | 208 (100.0%) | 34 (100.0%) |
Physical Housing Characteristics in Sprague
Housing Structures in Sprague
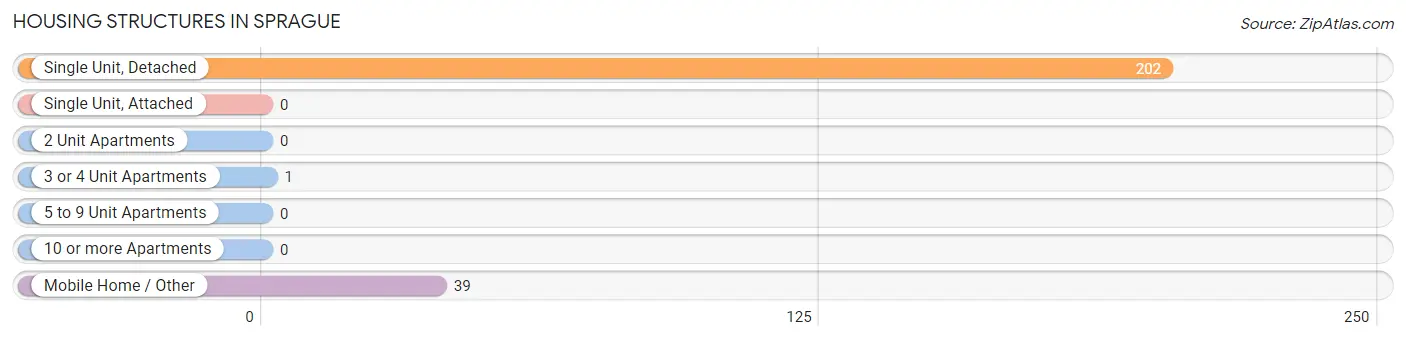
| Structure Type | # Housing Units | % Housing Units |
| Single Unit, Detached | 202 | 83.5% |
| Single Unit, Attached | 0 | 0.0% |
| 2 Unit Apartments | 0 | 0.0% |
| 3 or 4 Unit Apartments | 1 | 0.4% |
| 5 to 9 Unit Apartments | 0 | 0.0% |
| 10 or more Apartments | 0 | 0.0% |
| Mobile Home / Other | 39 | 16.1% |
| Total | 242 | 100.0% |
Housing Structures by Occupancy in Sprague
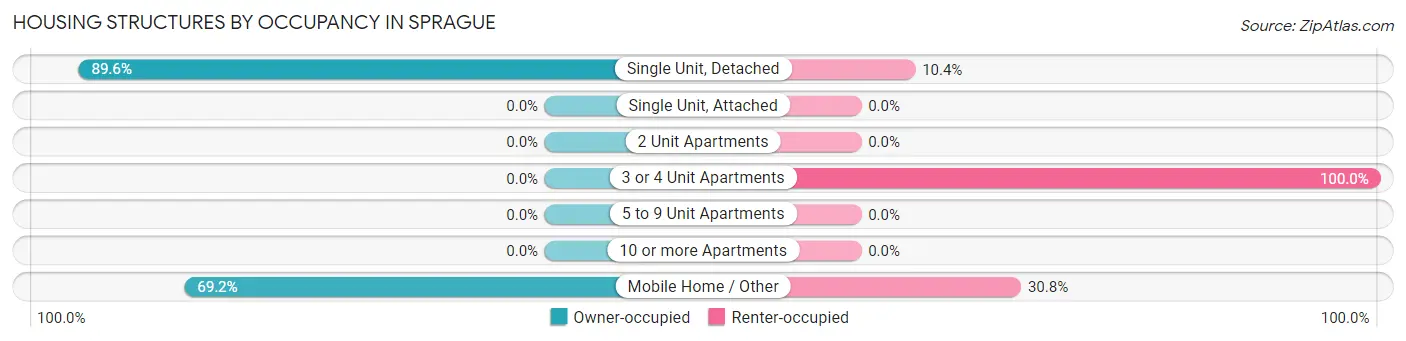
| Structure Type | Owner-occupied | Renter-occupied |
| Single Unit, Detached | 181 (89.6%) | 21 (10.4%) |
| Single Unit, Attached | 0 (0.0%) | 0 (0.0%) |
| 2 Unit Apartments | 0 (0.0%) | 0 (0.0%) |
| 3 or 4 Unit Apartments | 0 (0.0%) | 1 (100.0%) |
| 5 to 9 Unit Apartments | 0 (0.0%) | 0 (0.0%) |
| 10 or more Apartments | 0 (0.0%) | 0 (0.0%) |
| Mobile Home / Other | 27 (69.2%) | 12 (30.8%) |
| Total | 208 (86.0%) | 34 (14.1%) |
Housing Structures by Number of Rooms in Sprague
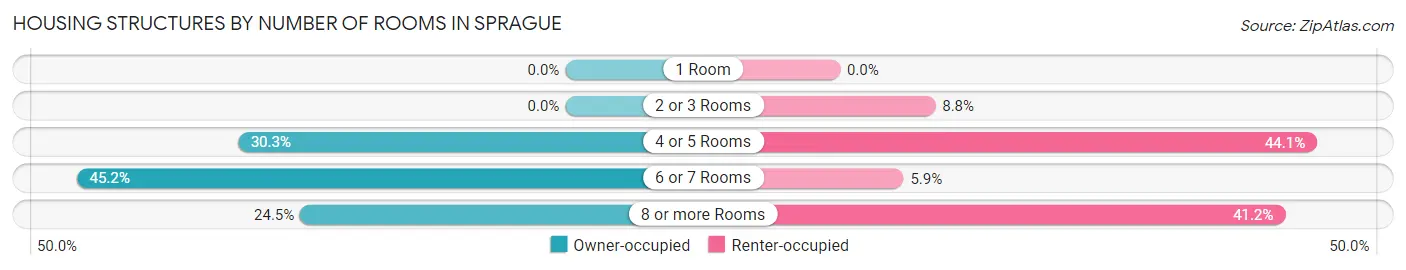
| Number of Rooms | Owner-occupied | Renter-occupied |
| 1 Room | 0 (0.0%) | 0 (0.0%) |
| 2 or 3 Rooms | 0 (0.0%) | 3 (8.8%) |
| 4 or 5 Rooms | 63 (30.3%) | 15 (44.1%) |
| 6 or 7 Rooms | 94 (45.2%) | 2 (5.9%) |
| 8 or more Rooms | 51 (24.5%) | 14 (41.2%) |
| Total | 208 (100.0%) | 34 (100.0%) |
Housing Structure by Heating Type in Sprague
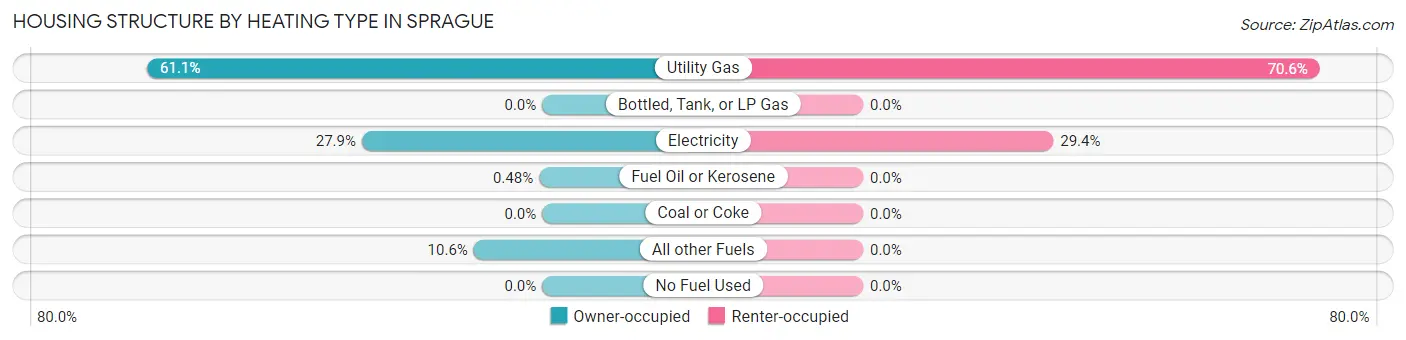
| Heating Type | Owner-occupied | Renter-occupied |
| Utility Gas | 127 (61.1%) | 24 (70.6%) |
| Bottled, Tank, or LP Gas | 0 (0.0%) | 0 (0.0%) |
| Electricity | 58 (27.9%) | 10 (29.4%) |
| Fuel Oil or Kerosene | 1 (0.5%) | 0 (0.0%) |
| Coal or Coke | 0 (0.0%) | 0 (0.0%) |
| All other Fuels | 22 (10.6%) | 0 (0.0%) |
| No Fuel Used | 0 (0.0%) | 0 (0.0%) |
| Total | 208 (100.0%) | 34 (100.0%) |
Household Vehicle Usage in Sprague
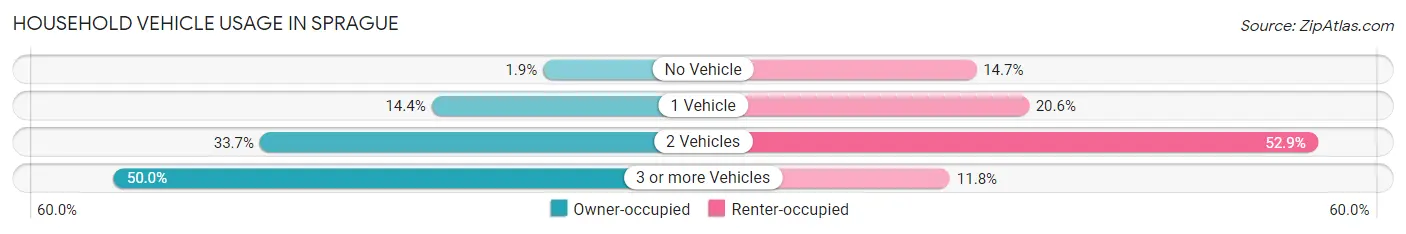
| Vehicles per Household | Owner-occupied | Renter-occupied |
| No Vehicle | 4 (1.9%) | 5 (14.7%) |
| 1 Vehicle | 30 (14.4%) | 7 (20.6%) |
| 2 Vehicles | 70 (33.7%) | 18 (52.9%) |
| 3 or more Vehicles | 104 (50.0%) | 4 (11.8%) |
| Total | 208 (100.0%) | 34 (100.0%) |
Real Estate & Mortgages in Sprague
Real Estate and Mortgage Overview in Sprague
| Characteristic | Without Mortgage | With Mortgage |
| Housing Units | 133 | 75 |
| Median Property Value | $94,700 | $170,800 |
| Median Household Income | $46,875 | $14 |
| Monthly Housing Costs | $361 | $0 |
| Real Estate Taxes | $387 | $4 |
Property Value by Mortgage Status in Sprague
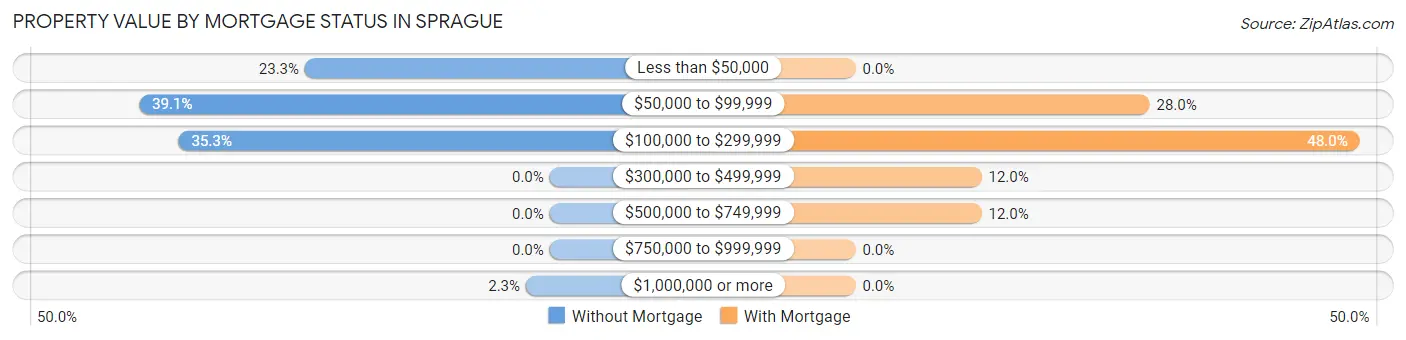
| Property Value | Without Mortgage | With Mortgage |
| Less than $50,000 | 31 (23.3%) | 0 (0.0%) |
| $50,000 to $99,999 | 52 (39.1%) | 21 (28.0%) |
| $100,000 to $299,999 | 47 (35.3%) | 36 (48.0%) |
| $300,000 to $499,999 | 0 (0.0%) | 9 (12.0%) |
| $500,000 to $749,999 | 0 (0.0%) | 9 (12.0%) |
| $750,000 to $999,999 | 0 (0.0%) | 0 (0.0%) |
| $1,000,000 or more | 3 (2.3%) | 0 (0.0%) |
| Total | 133 (100.0%) | 75 (100.0%) |
Household Income by Mortgage Status in Sprague
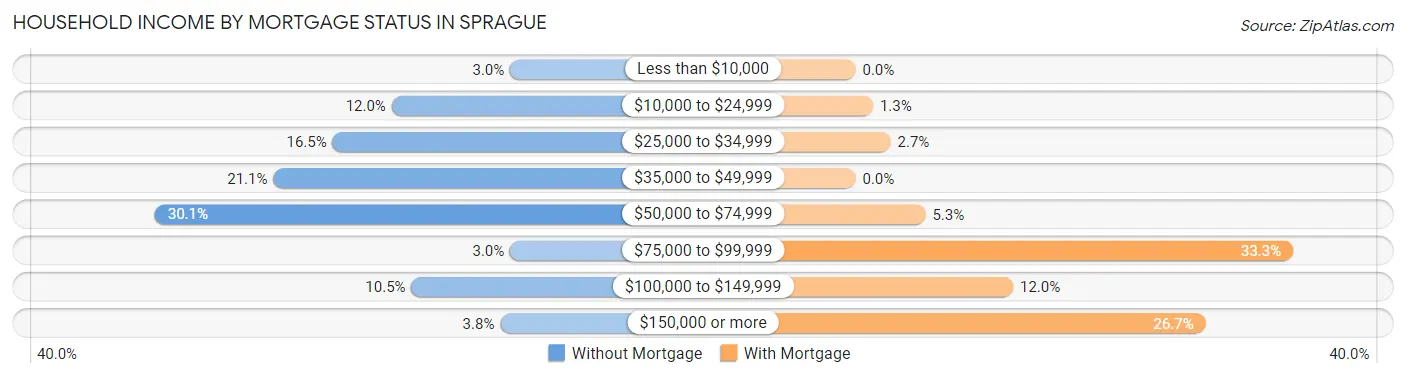
| Household Income | Without Mortgage | With Mortgage |
| Less than $10,000 | 4 (3.0%) | 0 (0.0%) |
| $10,000 to $24,999 | 16 (12.0%) | 1 (1.3%) |
| $25,000 to $34,999 | 22 (16.5%) | 2 (2.7%) |
| $35,000 to $49,999 | 28 (21.0%) | 0 (0.0%) |
| $50,000 to $74,999 | 40 (30.1%) | 4 (5.3%) |
| $75,000 to $99,999 | 4 (3.0%) | 25 (33.3%) |
| $100,000 to $149,999 | 14 (10.5%) | 9 (12.0%) |
| $150,000 or more | 5 (3.8%) | 20 (26.7%) |
| Total | 133 (100.0%) | 75 (100.0%) |
Property Value to Household Income Ratio in Sprague
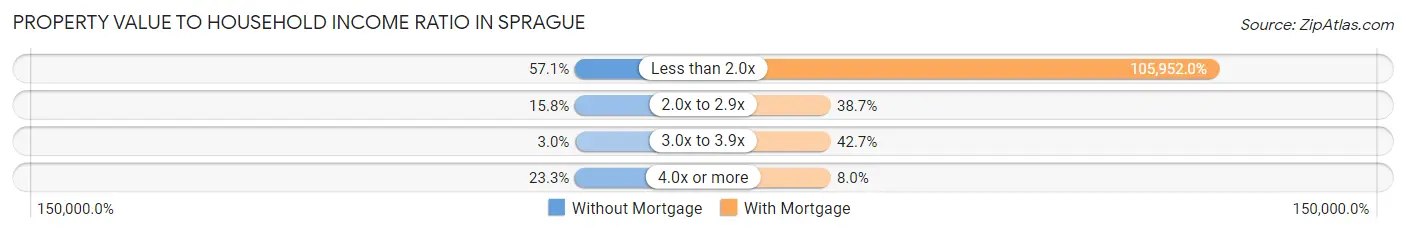
| Value-to-Income Ratio | Without Mortgage | With Mortgage |
| Less than 2.0x | 76 (57.1%) | 79,464 (105,952.0%) |
| 2.0x to 2.9x | 21 (15.8%) | 29 (38.7%) |
| 3.0x to 3.9x | 4 (3.0%) | 32 (42.7%) |
| 4.0x or more | 31 (23.3%) | 6 (8.0%) |
| Total | 133 (100.0%) | 75 (100.0%) |
Real Estate Taxes by Mortgage Status in Sprague
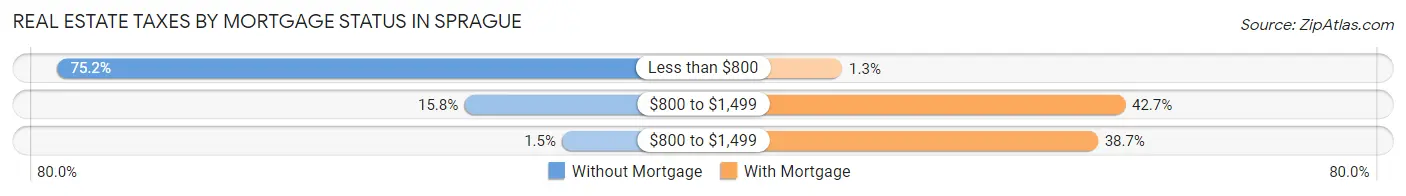
| Property Taxes | Without Mortgage | With Mortgage |
| Less than $800 | 100 (75.2%) | 1 (1.3%) |
| $800 to $1,499 | 21 (15.8%) | 32 (42.7%) |
| $800 to $1,499 | 2 (1.5%) | 29 (38.7%) |
| Total | 133 (100.0%) | 75 (100.0%) |
Health & Disability in Sprague
Health Insurance Coverage by Age in Sprague
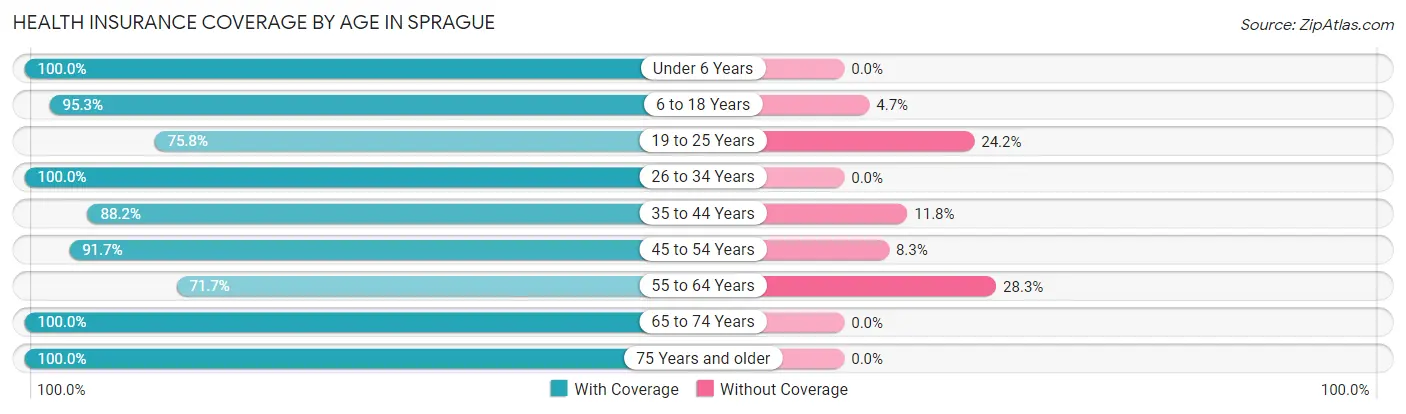
| Age Bracket | With Coverage | Without Coverage |
| Under 6 Years | 76 (100.0%) | 0 (0.0%) |
| 6 to 18 Years | 102 (95.3%) | 5 (4.7%) |
| 19 to 25 Years | 25 (75.8%) | 8 (24.2%) |
| 26 to 34 Years | 60 (100.0%) | 0 (0.0%) |
| 35 to 44 Years | 60 (88.2%) | 8 (11.8%) |
| 45 to 54 Years | 44 (91.7%) | 4 (8.3%) |
| 55 to 64 Years | 81 (71.7%) | 32 (28.3%) |
| 65 to 74 Years | 63 (100.0%) | 0 (0.0%) |
| 75 Years and older | 64 (100.0%) | 0 (0.0%) |
| Total | 575 (91.0%) | 57 (9.0%) |
Health Insurance Coverage by Citizenship Status in Sprague
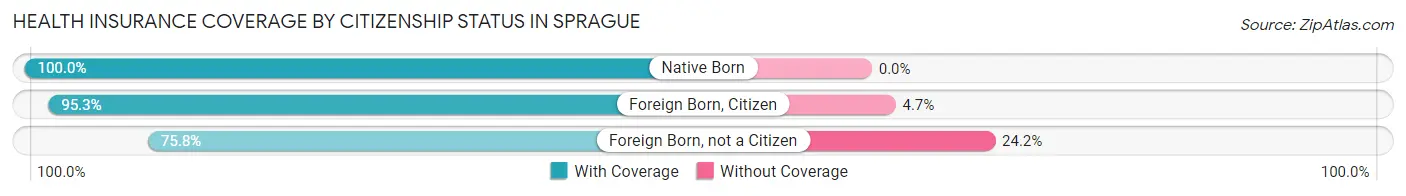
| Citizenship Status | With Coverage | Without Coverage |
| Native Born | 76 (100.0%) | 0 (0.0%) |
| Foreign Born, Citizen | 102 (95.3%) | 5 (4.7%) |
| Foreign Born, not a Citizen | 25 (75.8%) | 8 (24.2%) |
Health Insurance Coverage by Household Income in Sprague
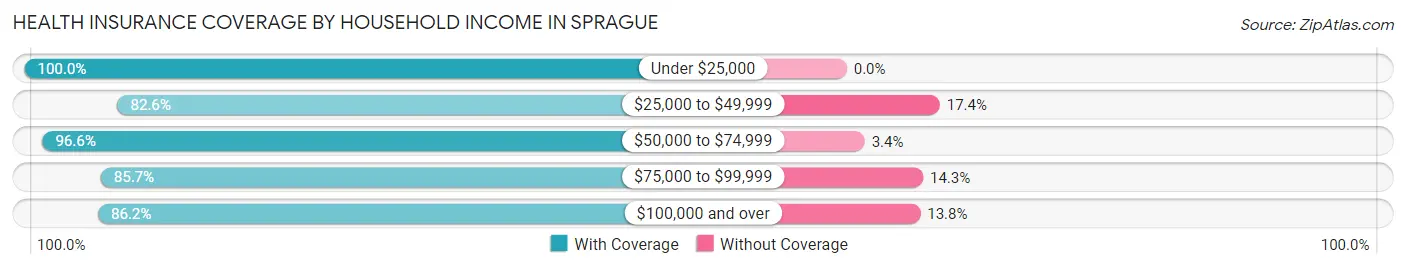
| Household Income | With Coverage | Without Coverage |
| Under $25,000 | 69 (100.0%) | 0 (0.0%) |
| $25,000 to $49,999 | 90 (82.6%) | 19 (17.4%) |
| $50,000 to $74,999 | 230 (96.6%) | 8 (3.4%) |
| $75,000 to $99,999 | 42 (85.7%) | 7 (14.3%) |
| $100,000 and over | 144 (86.2%) | 23 (13.8%) |
Public vs Private Health Insurance Coverage by Age in Sprague
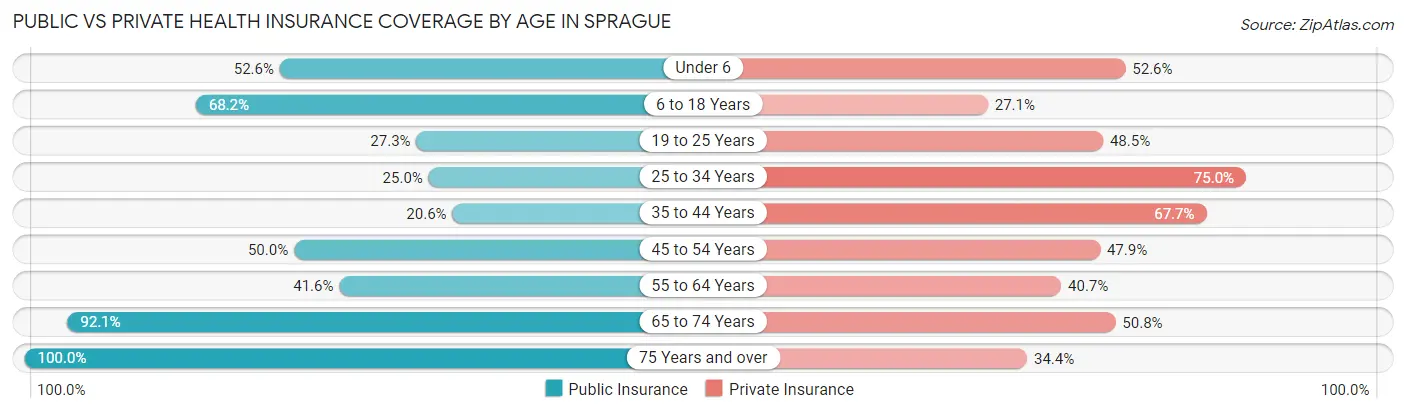
| Age Bracket | Public Insurance | Private Insurance |
| Under 6 | 40 (52.6%) | 40 (52.6%) |
| 6 to 18 Years | 73 (68.2%) | 29 (27.1%) |
| 19 to 25 Years | 9 (27.3%) | 16 (48.5%) |
| 25 to 34 Years | 15 (25.0%) | 45 (75.0%) |
| 35 to 44 Years | 14 (20.6%) | 46 (67.6%) |
| 45 to 54 Years | 24 (50.0%) | 23 (47.9%) |
| 55 to 64 Years | 47 (41.6%) | 46 (40.7%) |
| 65 to 74 Years | 58 (92.1%) | 32 (50.8%) |
| 75 Years and over | 64 (100.0%) | 22 (34.4%) |
| Total | 344 (54.4%) | 299 (47.3%) |
Disability Status by Sex by Age in Sprague
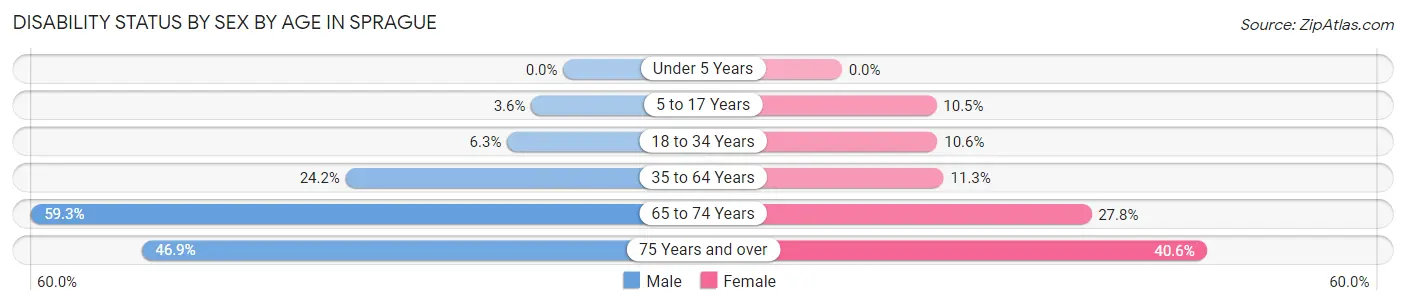
| Age Bracket | Male | Female |
| Under 5 Years | 0 (0.0%) | 0 (0.0%) |
| 5 to 17 Years | 2 (3.6%) | 6 (10.5%) |
| 18 to 34 Years | 4 (6.2%) | 5 (10.6%) |
| 35 to 64 Years | 32 (24.2%) | 11 (11.3%) |
| 65 to 74 Years | 16 (59.3%) | 10 (27.8%) |
| 75 Years and over | 15 (46.9%) | 13 (40.6%) |
Disability Class by Sex by Age in Sprague
Disability Class: Hearing Difficulty
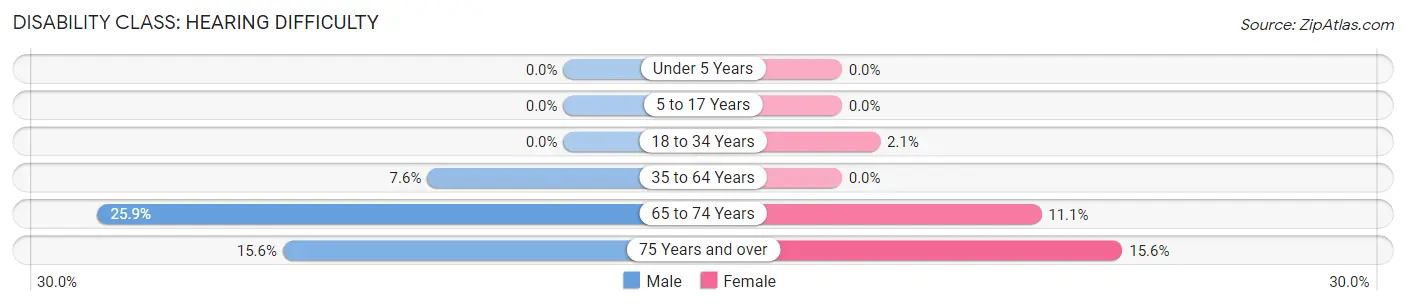
| Age Bracket | Male | Female |
| Under 5 Years | 0 (0.0%) | 0 (0.0%) |
| 5 to 17 Years | 0 (0.0%) | 0 (0.0%) |
| 18 to 34 Years | 0 (0.0%) | 1 (2.1%) |
| 35 to 64 Years | 10 (7.6%) | 0 (0.0%) |
| 65 to 74 Years | 7 (25.9%) | 4 (11.1%) |
| 75 Years and over | 5 (15.6%) | 5 (15.6%) |
Disability Class: Vision Difficulty
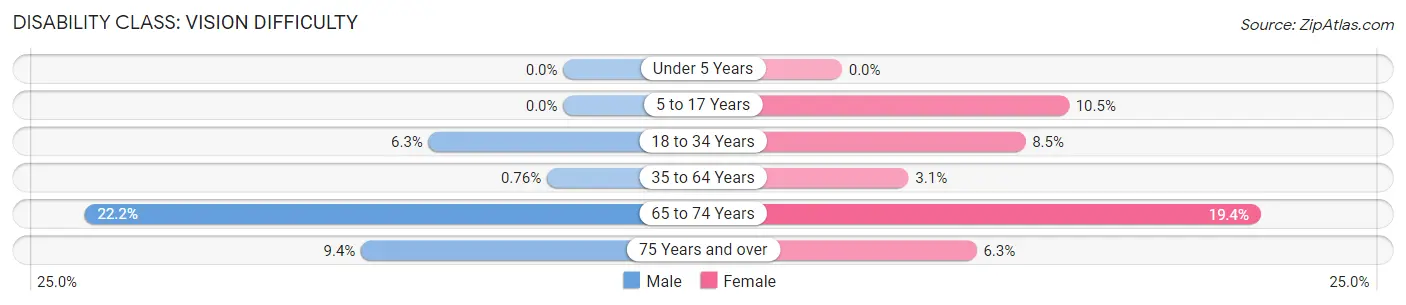
| Age Bracket | Male | Female |
| Under 5 Years | 0 (0.0%) | 0 (0.0%) |
| 5 to 17 Years | 0 (0.0%) | 6 (10.5%) |
| 18 to 34 Years | 4 (6.2%) | 4 (8.5%) |
| 35 to 64 Years | 1 (0.8%) | 3 (3.1%) |
| 65 to 74 Years | 6 (22.2%) | 7 (19.4%) |
| 75 Years and over | 3 (9.4%) | 2 (6.2%) |
Disability Class: Cognitive Difficulty
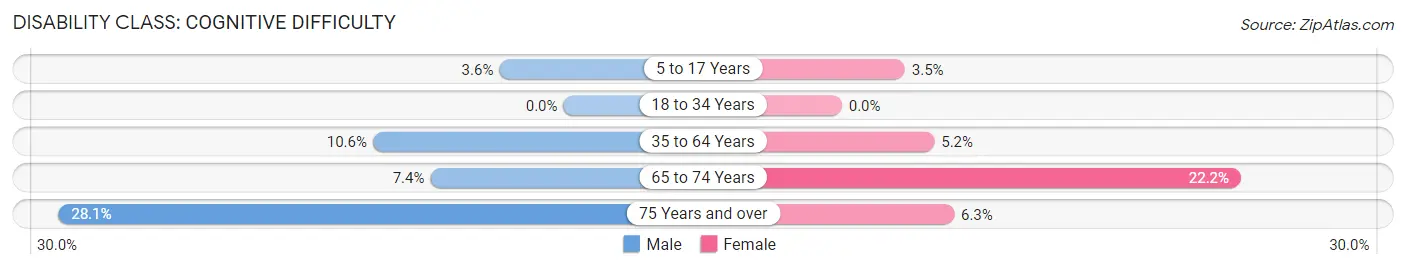
| Age Bracket | Male | Female |
| 5 to 17 Years | 2 (3.6%) | 2 (3.5%) |
| 18 to 34 Years | 0 (0.0%) | 0 (0.0%) |
| 35 to 64 Years | 14 (10.6%) | 5 (5.1%) |
| 65 to 74 Years | 2 (7.4%) | 8 (22.2%) |
| 75 Years and over | 9 (28.1%) | 2 (6.2%) |
Disability Class: Ambulatory Difficulty
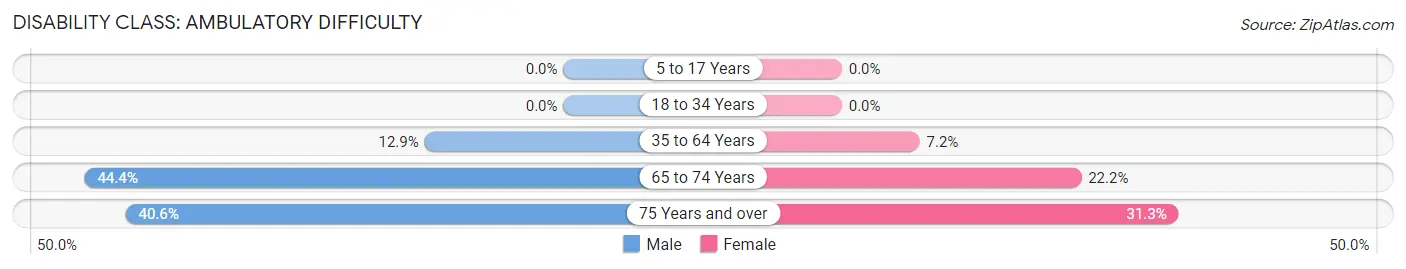
| Age Bracket | Male | Female |
| 5 to 17 Years | 0 (0.0%) | 0 (0.0%) |
| 18 to 34 Years | 0 (0.0%) | 0 (0.0%) |
| 35 to 64 Years | 17 (12.9%) | 7 (7.2%) |
| 65 to 74 Years | 12 (44.4%) | 8 (22.2%) |
| 75 Years and over | 13 (40.6%) | 10 (31.2%) |
Disability Class: Self-Care Difficulty
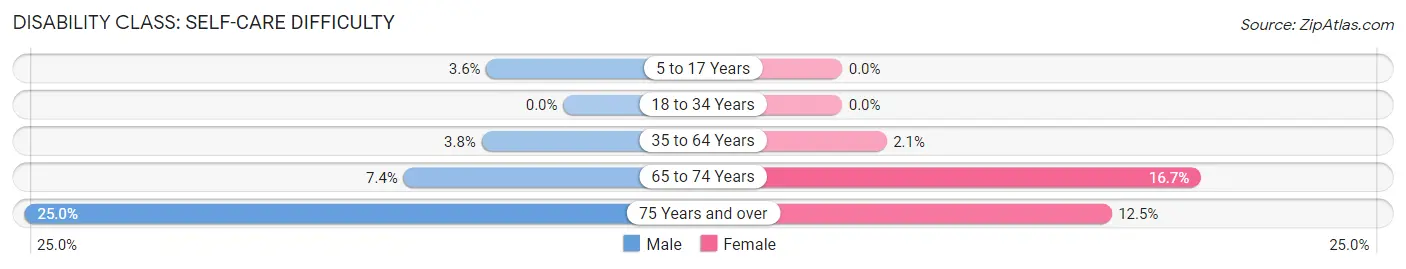
| Age Bracket | Male | Female |
| 5 to 17 Years | 2 (3.6%) | 0 (0.0%) |
| 18 to 34 Years | 0 (0.0%) | 0 (0.0%) |
| 35 to 64 Years | 5 (3.8%) | 2 (2.1%) |
| 65 to 74 Years | 2 (7.4%) | 6 (16.7%) |
| 75 Years and over | 8 (25.0%) | 4 (12.5%) |
Technology Access in Sprague
Computing Device Access in Sprague
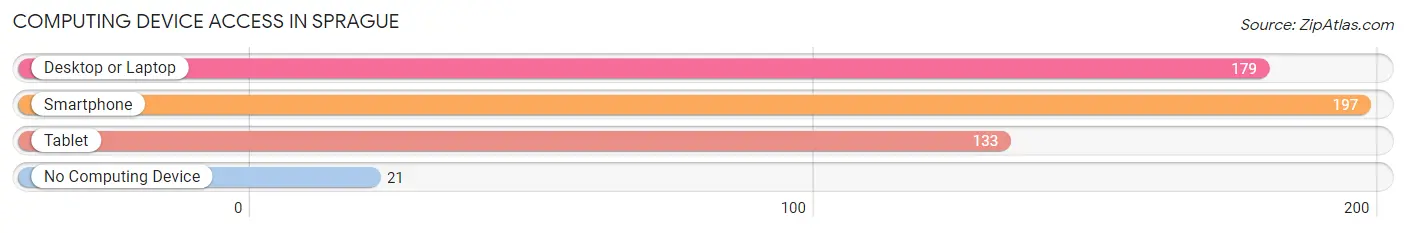
| Device Type | # Households | % Households |
| Desktop or Laptop | 179 | 74.0% |
| Smartphone | 197 | 81.4% |
| Tablet | 133 | 55.0% |
| No Computing Device | 21 | 8.7% |
| Total | 242 | 100.0% |
Internet Access in Sprague
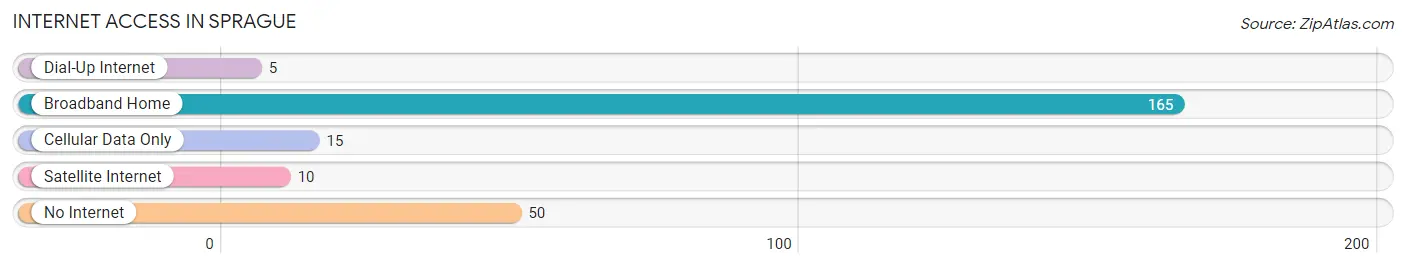
| Internet Type | # Households | % Households |
| Dial-Up Internet | 5 | 2.1% |
| Broadband Home | 165 | 68.2% |
| Cellular Data Only | 15 | 6.2% |
| Satellite Internet | 10 | 4.1% |
| No Internet | 50 | 20.7% |
| Total | 242 | 100.0% |
Sprague Summary
Sprague is a small town located in Lincoln County, Washington, United States. It is situated on the banks of the Sprague River, approximately 20 miles east of Spokane. The town was founded in 1881 and was named after the river. As of the 2010 census, the population of Sprague was 545.
History
Sprague was founded in 1881 by a group of settlers from the Midwest. The town was named after the nearby Sprague River, which was named after Edward Sprague, a fur trader who had explored the area in the early 1800s. The town was originally a farming community, but it soon became a hub for the lumber industry. The first sawmill was built in 1883, and by the early 1900s, the town had become a major lumber producer.
In the early 1900s, Sprague also became a major railroad hub. The Northern Pacific Railway built a line through the town in 1902, and the Great Northern Railway followed suit in 1906. The railroads brought a great deal of economic activity to the town, and it soon became a major shipping center for the region.
Geography
Sprague is located in the eastern part of Washington State, approximately 20 miles east of Spokane. The town is situated on the banks of the Sprague River, which flows through the town and into the Columbia River. The town is surrounded by rolling hills and farmland, and is located in the foothills of the Rocky Mountains.
The climate in Sprague is semi-arid, with hot summers and cold winters. The average annual temperature is around 50 degrees Fahrenheit, and the average annual precipitation is around 15 inches.
Economy
Sprague’s economy is largely based on agriculture and tourism. The town is home to several farms, which produce a variety of crops, including wheat, barley, and hay. The town is also home to several wineries, which produce a variety of wines.
Tourism is also an important part of the local economy. The town is home to several historic sites, including the Sprague River Railroad Museum and the Sprague River Logging Museum. The town also hosts several annual events, including the Sprague River Days Festival and the Sprague River Rodeo.
Demographics
As of the 2010 census, the population of Sprague was 545. The racial makeup of the town was 95.2% White, 0.2% African American, 0.7% Native American, 0.2% Asian, 0.2% Pacific Islander, and 3.7% from other races. The median household income was $37,500, and the median family income was $41,250.
Conclusion
Sprague is a small town located in Lincoln County, Washington, United States. It was founded in 1881 and is situated on the banks of the Sprague River. The town’s economy is largely based on agriculture and tourism, and the population of Sprague was 545 as of the 2010 census. Sprague is home to several historic sites and hosts several annual events, making it a popular destination for tourists.
Common Questions
What is Per Capita Income in Sprague?
Per Capita income in Sprague is $28,964.
What is the Median Family Income in Sprague?
Median Family Income in Sprague is $71,944.
What is the Median Household income in Sprague?
Median Household Income in Sprague is $66,250.
What is Income or Wage Gap in Sprague?
Income or Wage Gap in Sprague is 47.5%.
Women in Sprague earn 52.5 cents for every dollar earned by a man.
What is Inequality or Gini Index in Sprague?
Inequality or Gini Index in Sprague is 0.43.
What is the Total Population of Sprague?
Total Population of Sprague is 632.
What is the Total Male Population of Sprague?
Total Male Population of Sprague is 337.
What is the Total Female Population of Sprague?
Total Female Population of Sprague is 295.
What is the Ratio of Males per 100 Females in Sprague?
There are 114.24 Males per 100 Females in Sprague.
What is the Ratio of Females per 100 Males in Sprague?
There are 87.54 Females per 100 Males in Sprague.
What is the Median Population Age in Sprague?
Median Population Age in Sprague is 43.1 Years.
What is the Average Family Size in Sprague
Average Family Size in Sprague is 3.1 People.
What is the Average Household Size in Sprague
Average Household Size in Sprague is 2.6 People.
How Large is the Labor Force in Sprague?
There are 263 People in the Labor Forcein in Sprague.
What is the Percentage of People in the Labor Force in Sprague?
54.3% of People are in the Labor Force in Sprague.
What is the Unemployment Rate in Sprague?
Unemployment Rate in Sprague is 12.5%.