Silverdale, WA Map & Demographics
Silverdale Map
Silverdale Overview
$45,400
PER CAPITA INCOME
$120,512
AVG FAMILY INCOME
$96,564
AVG HOUSEHOLD INCOME
34.0%
WAGE / INCOME GAP [ % ]
66.0¢/ $1
WAGE / INCOME GAP [ $ ]
0.40
INEQUALITY / GINI INDEX
21,774
TOTAL POPULATION
10,869
MALE POPULATION
10,905
FEMALE POPULATION
99.67
MALES / 100 FEMALES
100.33
FEMALES / 100 MALES
37.7
MEDIAN AGE
3.0
AVG FAMILY SIZE
2.5
AVG HOUSEHOLD SIZE
11,376
LABOR FORCE [ PEOPLE ]
64.1%
PERCENT IN LABOR FORCE
5.1%
UNEMPLOYMENT RATE
Silverdale Area Codes
Income in Silverdale
Income Overview in Silverdale
Per Capita Income in Silverdale is $45,400, while median incomes of families and households are $120,512 and $96,564 respectively.
| Characteristic | Number | Measure |
| Per Capita Income | 21,774 | $45,400 |
| Median Family Income | 5,701 | $120,512 |
| Mean Family Income | 5,701 | $133,539 |
| Median Household Income | 8,465 | $96,564 |
| Mean Household Income | 8,465 | $115,063 |
| Income Deficit | 5,701 | $0 |
| Wage / Income Gap (%) | 21,774 | 33.96% |
| Wage / Income Gap ($) | 21,774 | 66.04¢ per $1 |
| Gini / Inequality Index | 21,774 | 0.40 |
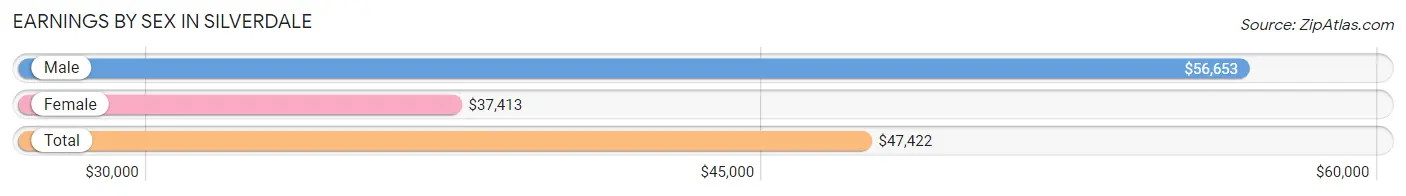
Earnings by Sex in Silverdale
Average Earnings in Silverdale are $47,422, $56,653 for men and $37,413 for women, a difference of 34.0%.
| Sex | Number | Average Earnings |
| Male | 6,581 (56.1%) | $56,653 |
| Female | 5,150 (43.9%) | $37,413 |
| Total | 11,731 (100.0%) | $47,422 |
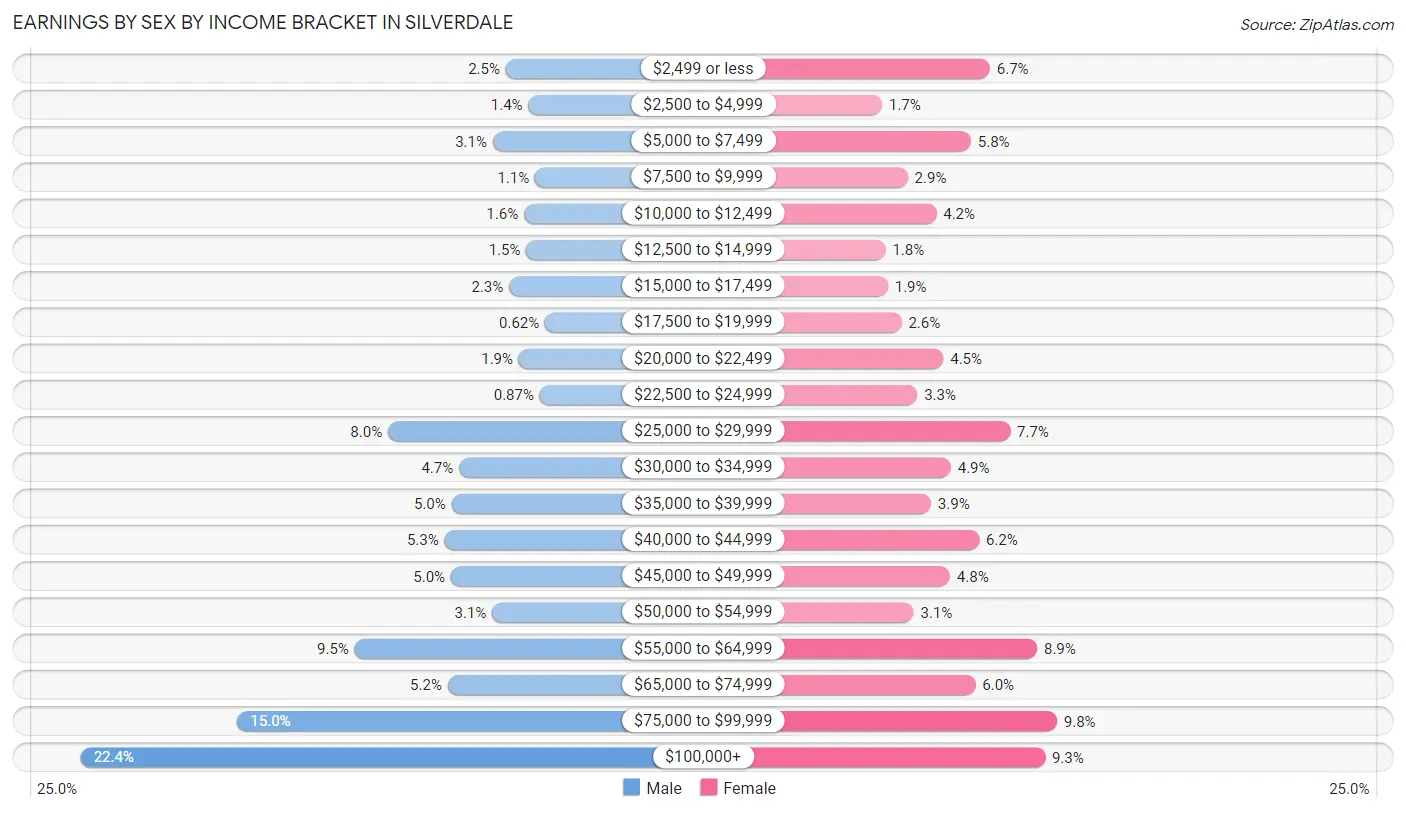
Earnings by Sex by Income Bracket in Silverdale
The most common earnings brackets in Silverdale are $100,000+ for men (1,472 | 22.4%) and $75,000 to $99,999 for women (507 | 9.8%).
| Income | Male | Female |
| $2,499 or less | 162 (2.5%) | 345 (6.7%) |
| $2,500 to $4,999 | 92 (1.4%) | 85 (1.7%) |
| $5,000 to $7,499 | 202 (3.1%) | 299 (5.8%) |
| $7,500 to $9,999 | 72 (1.1%) | 147 (2.9%) |
| $10,000 to $12,499 | 106 (1.6%) | 216 (4.2%) |
| $12,500 to $14,999 | 99 (1.5%) | 93 (1.8%) |
| $15,000 to $17,499 | 152 (2.3%) | 99 (1.9%) |
| $17,500 to $19,999 | 41 (0.6%) | 132 (2.6%) |
| $20,000 to $22,499 | 122 (1.8%) | 233 (4.5%) |
| $22,500 to $24,999 | 57 (0.9%) | 170 (3.3%) |
| $25,000 to $29,999 | 525 (8.0%) | 394 (7.6%) |
| $30,000 to $34,999 | 306 (4.6%) | 251 (4.9%) |
| $35,000 to $39,999 | 329 (5.0%) | 203 (3.9%) |
| $40,000 to $44,999 | 351 (5.3%) | 319 (6.2%) |
| $45,000 to $49,999 | 331 (5.0%) | 249 (4.8%) |
| $50,000 to $54,999 | 204 (3.1%) | 161 (3.1%) |
| $55,000 to $64,999 | 628 (9.5%) | 459 (8.9%) |
| $65,000 to $74,999 | 341 (5.2%) | 310 (6.0%) |
| $75,000 to $99,999 | 989 (15.0%) | 507 (9.8%) |
| $100,000+ | 1,472 (22.4%) | 478 (9.3%) |
| Total | 6,581 (100.0%) | 5,150 (100.0%) |
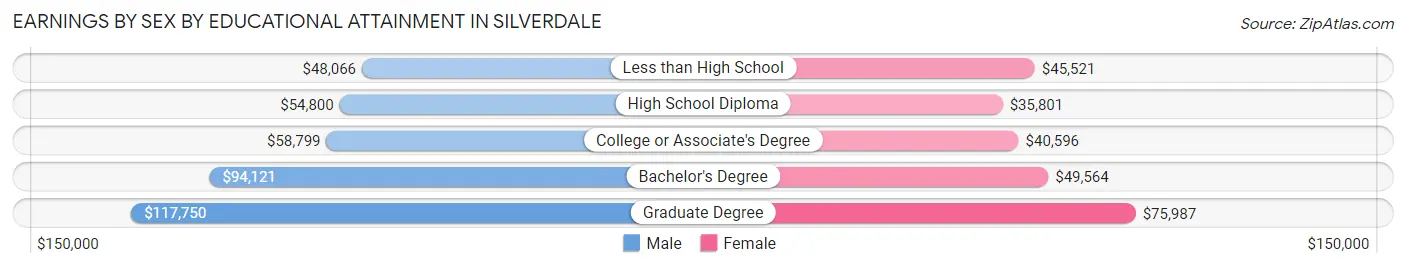
Earnings by Sex by Educational Attainment in Silverdale
Average earnings in Silverdale are $69,983 for men and $43,065 for women, a difference of 38.5%. Men with an educational attainment of graduate degree enjoy the highest average annual earnings of $117,750, while those with less than high school education earn the least with $48,066. Women with an educational attainment of graduate degree earn the most with the average annual earnings of $75,987, while those with high school diploma education have the smallest earnings of $35,801.
| Educational Attainment | Male Income | Female Income |
| Less than High School | $48,066 | $45,521 |
| High School Diploma | $54,800 | $35,801 |
| College or Associate's Degree | $58,799 | $40,596 |
| Bachelor's Degree | $94,121 | $49,564 |
| Graduate Degree | $117,750 | $75,987 |
| Total | $69,983 | $43,065 |
Family Income in Silverdale
Family Income Brackets in Silverdale
According to the Silverdale family income data, there are 1,294 families falling into the $100,000 to $149,999 income range, which is the most common income bracket and makes up 22.7% of all families. Conversely, the $10,000 to $14,999 income bracket is the least frequent group with only 51 families (0.9%) belonging to this category.
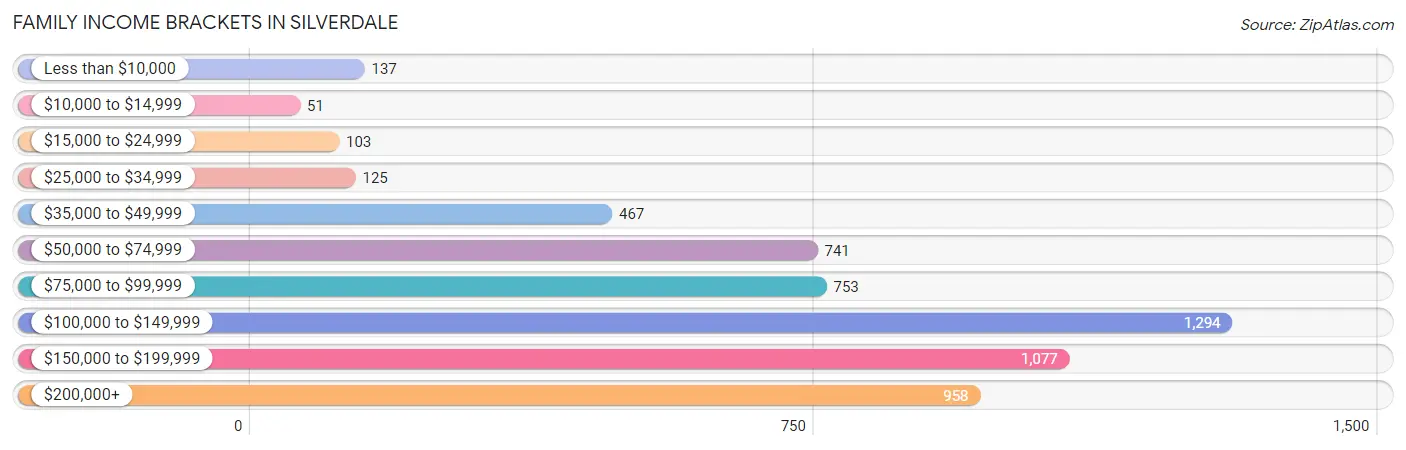
| Income Bracket | # Families | % Families |
| Less than $10,000 | 137 | 2.4% |
| $10,000 to $14,999 | 51 | 0.9% |
| $15,000 to $24,999 | 103 | 1.8% |
| $25,000 to $34,999 | 125 | 2.2% |
| $35,000 to $49,999 | 467 | 8.2% |
| $50,000 to $74,999 | 741 | 13.0% |
| $75,000 to $99,999 | 753 | 13.2% |
| $100,000 to $149,999 | 1,294 | 22.7% |
| $150,000 to $199,999 | 1,077 | 18.9% |
| $200,000+ | 958 | 16.8% |
Family Income by Famaliy Size in Silverdale
7+ person families (76 | 1.3%) account for the highest median family income in Silverdale with $193,261 per family, while 2-person families (2,637 | 46.3%) have the highest median income of $47,230 per family member.
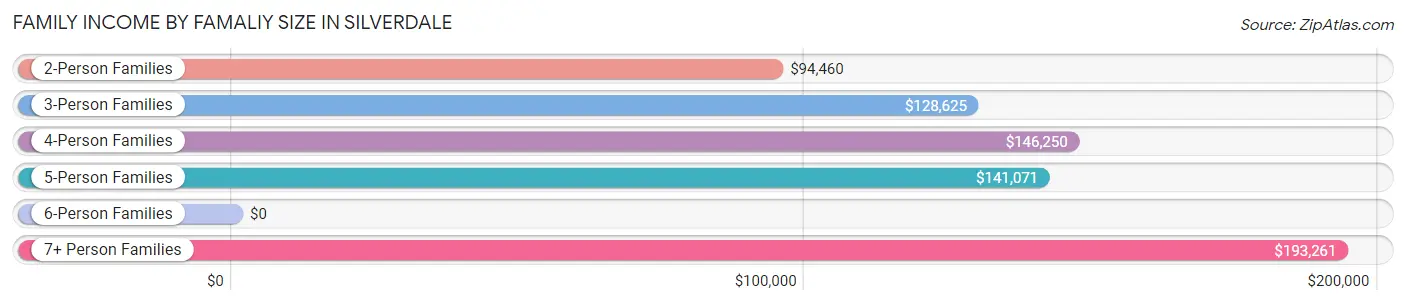
| Income Bracket | # Families | Median Income |
| 2-Person Families | 2,637 (46.3%) | $94,460 |
| 3-Person Families | 1,459 (25.6%) | $128,625 |
| 4-Person Families | 1,069 (18.8%) | $146,250 |
| 5-Person Families | 338 (5.9%) | $141,071 |
| 6-Person Families | 122 (2.1%) | $0 |
| 7+ Person Families | 76 (1.3%) | $193,261 |
| Total | 5,701 (100.0%) | $120,512 |
Family Income by Number of Earners in Silverdale
The median family income in Silverdale is $120,512, with families comprising 3+ earners (661) having the highest median family income of $214,219, while families with no earners (745) have the lowest median family income of $69,967, accounting for 11.6% and 13.1% of families, respectively.
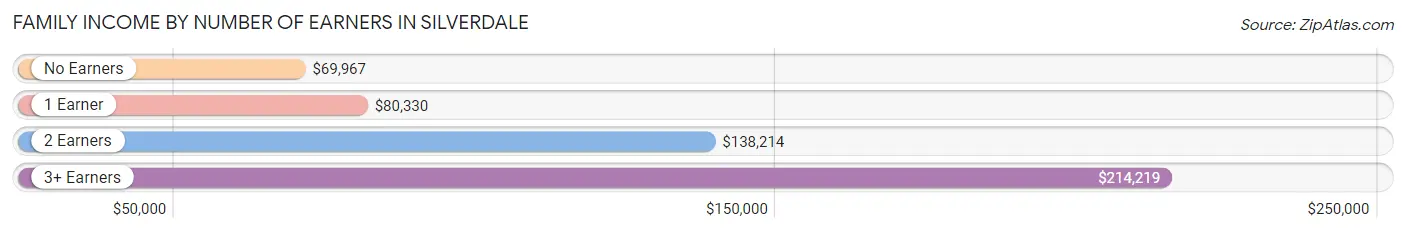
| Number of Earners | # Families | Median Income |
| No Earners | 745 (13.1%) | $69,967 |
| 1 Earner | 1,855 (32.5%) | $80,330 |
| 2 Earners | 2,440 (42.8%) | $138,214 |
| 3+ Earners | 661 (11.6%) | $214,219 |
| Total | 5,701 (100.0%) | $120,512 |
Household Income in Silverdale
Household Income Brackets in Silverdale
With 1,828 households falling in the category, the $100,000 to $149,999 income range is the most frequent in Silverdale, accounting for 21.6% of all households. In contrast, only 110 households (1.3%) fall into the $10,000 to $14,999 income bracket, making it the least populous group.
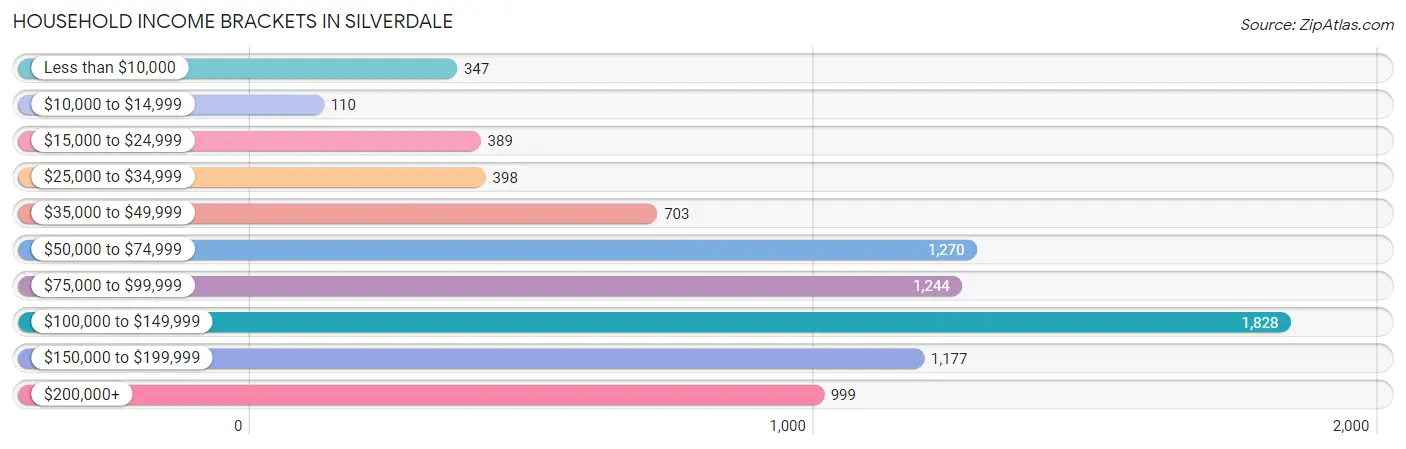
| Income Bracket | # Households | % Households |
| Less than $10,000 | 347 | 4.1% |
| $10,000 to $14,999 | 110 | 1.3% |
| $15,000 to $24,999 | 389 | 4.6% |
| $25,000 to $34,999 | 398 | 4.7% |
| $35,000 to $49,999 | 703 | 8.3% |
| $50,000 to $74,999 | 1,270 | 15.0% |
| $75,000 to $99,999 | 1,244 | 14.7% |
| $100,000 to $149,999 | 1,828 | 21.6% |
| $150,000 to $199,999 | 1,177 | 13.9% |
| $200,000+ | 999 | 11.8% |
Household Income by Householder Age in Silverdale
The median household income in Silverdale is $96,564, with the highest median household income of $126,892 found in the 45 to 64 years age bracket for the primary householder. A total of 2,557 households (30.2%) fall into this category. Meanwhile, the 65+ years age bracket for the primary householder has the lowest median household income of $67,554, with 2,414 households (28.5%) in this group.
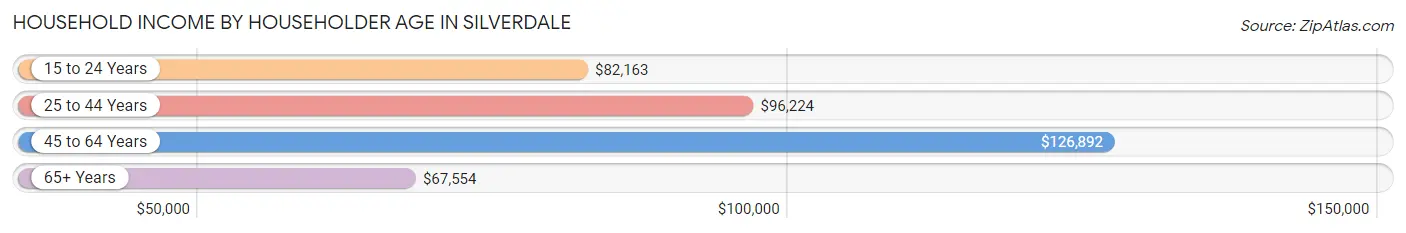
| Income Bracket | # Households | Median Income |
| 15 to 24 Years | 631 (7.4%) | $82,163 |
| 25 to 44 Years | 2,863 (33.8%) | $96,224 |
| 45 to 64 Years | 2,557 (30.2%) | $126,892 |
| 65+ Years | 2,414 (28.5%) | $67,554 |
| Total | 8,465 (100.0%) | $96,564 |
Poverty in Silverdale
Income Below Poverty by Sex and Age in Silverdale
With 5.3% poverty level for males and 8.5% for females among the residents of Silverdale, 6 to 11 year old males and 16 and 17 year old females are the most vulnerable to poverty, with 82 males (11.7%) and 46 females (20.3%) in their respective age groups living below the poverty level.
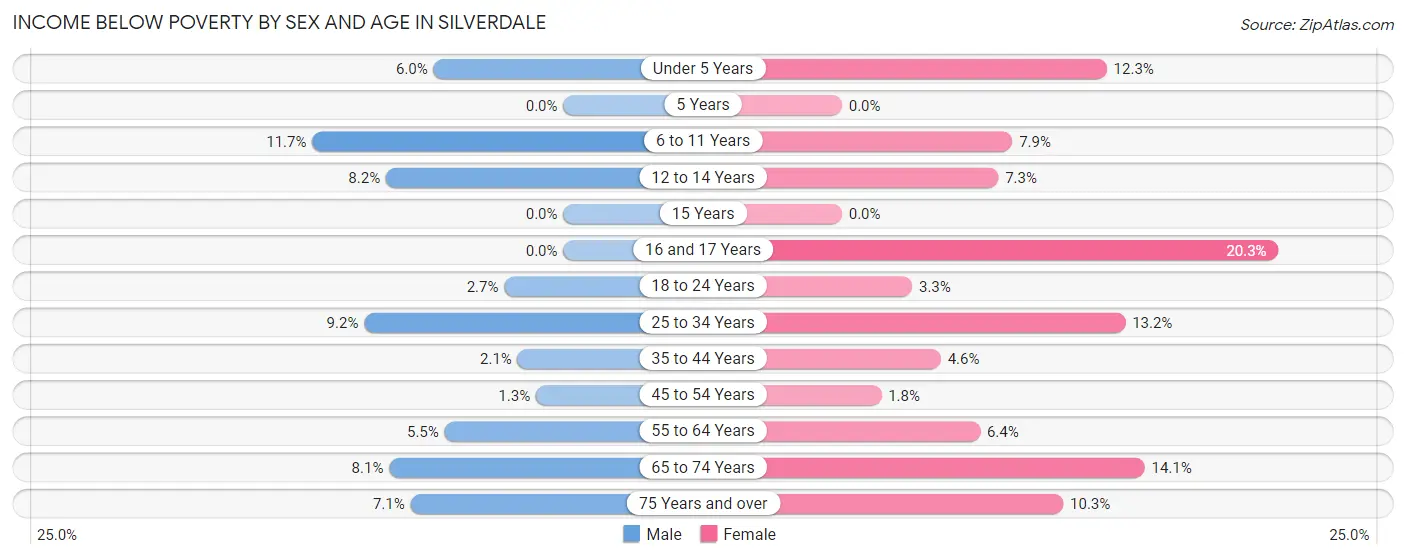
| Age Bracket | Male | Female |
| Under 5 Years | 31 (6.0%) | 88 (12.3%) |
| 5 Years | 0 (0.0%) | 0 (0.0%) |
| 6 to 11 Years | 82 (11.7%) | 61 (7.9%) |
| 12 to 14 Years | 32 (8.2%) | 18 (7.3%) |
| 15 Years | 0 (0.0%) | 0 (0.0%) |
| 16 and 17 Years | 0 (0.0%) | 46 (20.3%) |
| 18 to 24 Years | 43 (2.7%) | 30 (3.3%) |
| 25 to 34 Years | 142 (9.2%) | 236 (13.2%) |
| 35 to 44 Years | 30 (2.1%) | 56 (4.6%) |
| 45 to 54 Years | 16 (1.3%) | 24 (1.8%) |
| 55 to 64 Years | 69 (5.5%) | 66 (6.4%) |
| 65 to 74 Years | 82 (8.1%) | 186 (14.1%) |
| 75 Years and over | 42 (7.1%) | 98 (10.3%) |
| Total | 569 (5.3%) | 909 (8.5%) |
Income Above Poverty by Sex and Age in Silverdale
According to the poverty statistics in Silverdale, males aged 5 years and females aged 5 years are the age groups that are most secure financially, with 100.0% of males and 100.0% of females in these age groups living above the poverty line.
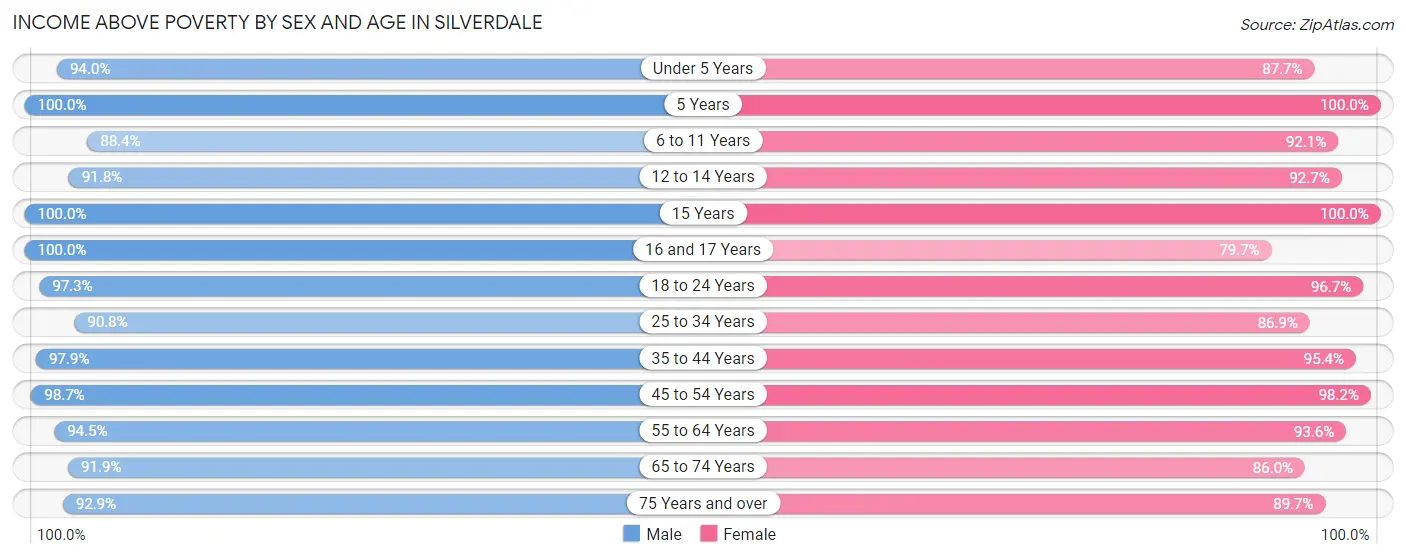
| Age Bracket | Male | Female |
| Under 5 Years | 484 (94.0%) | 628 (87.7%) |
| 5 Years | 114 (100.0%) | 130 (100.0%) |
| 6 to 11 Years | 622 (88.3%) | 710 (92.1%) |
| 12 to 14 Years | 357 (91.8%) | 230 (92.7%) |
| 15 Years | 113 (100.0%) | 83 (100.0%) |
| 16 and 17 Years | 270 (100.0%) | 181 (79.7%) |
| 18 to 24 Years | 1,529 (97.3%) | 891 (96.7%) |
| 25 to 34 Years | 1,394 (90.8%) | 1,558 (86.9%) |
| 35 to 44 Years | 1,388 (97.9%) | 1,165 (95.4%) |
| 45 to 54 Years | 1,246 (98.7%) | 1,290 (98.2%) |
| 55 to 64 Years | 1,184 (94.5%) | 964 (93.6%) |
| 65 to 74 Years | 933 (91.9%) | 1,138 (86.0%) |
| 75 Years and over | 550 (92.9%) | 856 (89.7%) |
| Total | 10,184 (94.7%) | 9,824 (91.5%) |
Income Below Poverty Among Married-Couple Families in Silverdale
The poverty statistics for married-couple families in Silverdale show that 1.9% or 86 of the total 4,453 families live below the poverty line. Families with 1 or 2 children have the highest poverty rate of 2.4%, comprising of 35 families. On the other hand, families with 3 or 4 children have the lowest poverty rate of 0.0%, which includes 0 families.
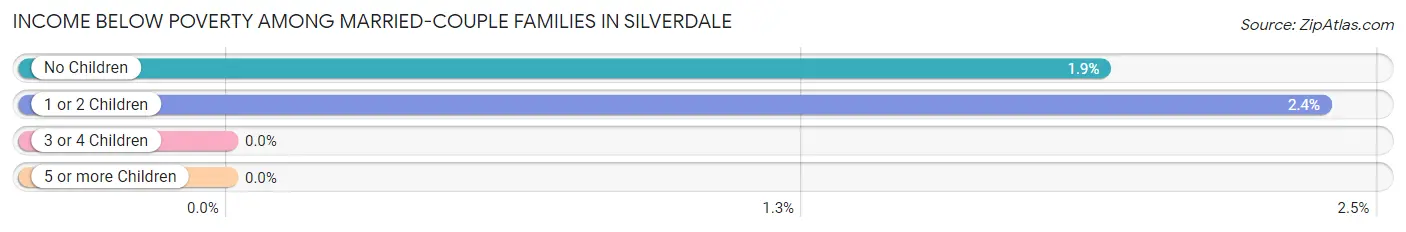
| Children | Above Poverty | Below Poverty |
| No Children | 2,636 (98.1%) | 51 (1.9%) |
| 1 or 2 Children | 1,436 (97.6%) | 35 (2.4%) |
| 3 or 4 Children | 279 (100.0%) | 0 (0.0%) |
| 5 or more Children | 16 (100.0%) | 0 (0.0%) |
| Total | 4,367 (98.1%) | 86 (1.9%) |
Income Below Poverty Among Single-Parent Households in Silverdale
According to the poverty data in Silverdale, 3.4% or 13 single-father households and 18.5% or 160 single-mother households are living below the poverty line. Among single-father households, those with no children have the highest poverty rate, with 13 households (7.7%) experiencing poverty. Likewise, among single-mother households, those with 3 or 4 children have the highest poverty rate, with 29 households (40.3%) falling below the poverty line.
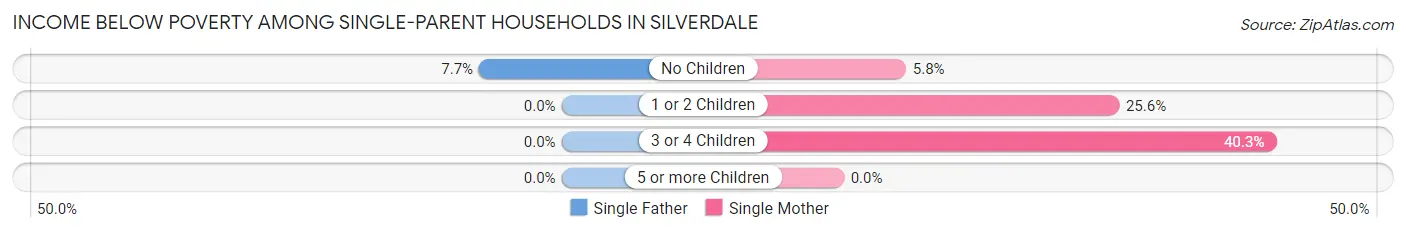
| Children | Single Father | Single Mother |
| No Children | 13 (7.7%) | 21 (5.8%) |
| 1 or 2 Children | 0 (0.0%) | 110 (25.6%) |
| 3 or 4 Children | 0 (0.0%) | 29 (40.3%) |
| 5 or more Children | 0 (0.0%) | 0 (0.0%) |
| Total | 13 (3.4%) | 160 (18.5%) |
Income Below Poverty Among Married-Couple vs Single-Parent Households in Silverdale
The poverty data for Silverdale shows that 86 of the married-couple family households (1.9%) and 173 of the single-parent households (13.9%) are living below the poverty level. Within the married-couple family households, those with 1 or 2 children have the highest poverty rate, with 35 households (2.4%) falling below the poverty line. Among the single-parent households, those with 3 or 4 children have the highest poverty rate, with 29 household (29.9%) living below poverty.
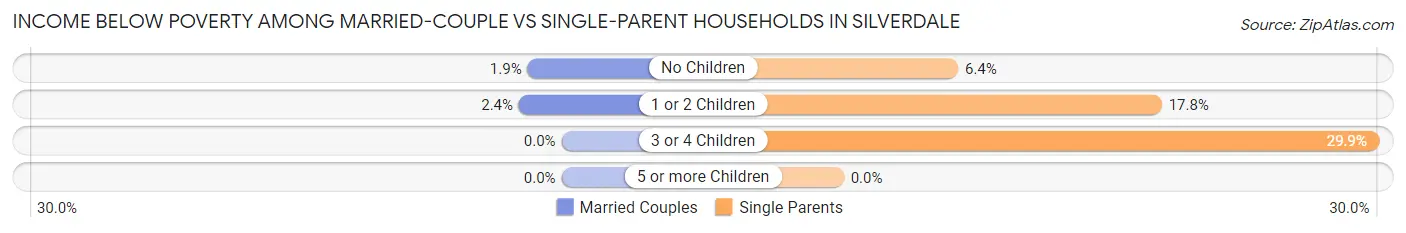
| Children | Married-Couple Families | Single-Parent Households |
| No Children | 51 (1.9%) | 34 (6.4%) |
| 1 or 2 Children | 35 (2.4%) | 110 (17.8%) |
| 3 or 4 Children | 0 (0.0%) | 29 (29.9%) |
| 5 or more Children | 0 (0.0%) | 0 (0.0%) |
| Total | 86 (1.9%) | 173 (13.9%) |
Race in Silverdale
The most populous races in Silverdale are White / Caucasian (15,247 | 70.0%), Two or more Races (2,655 | 12.2%), and Asian (1,965 | 9.0%).
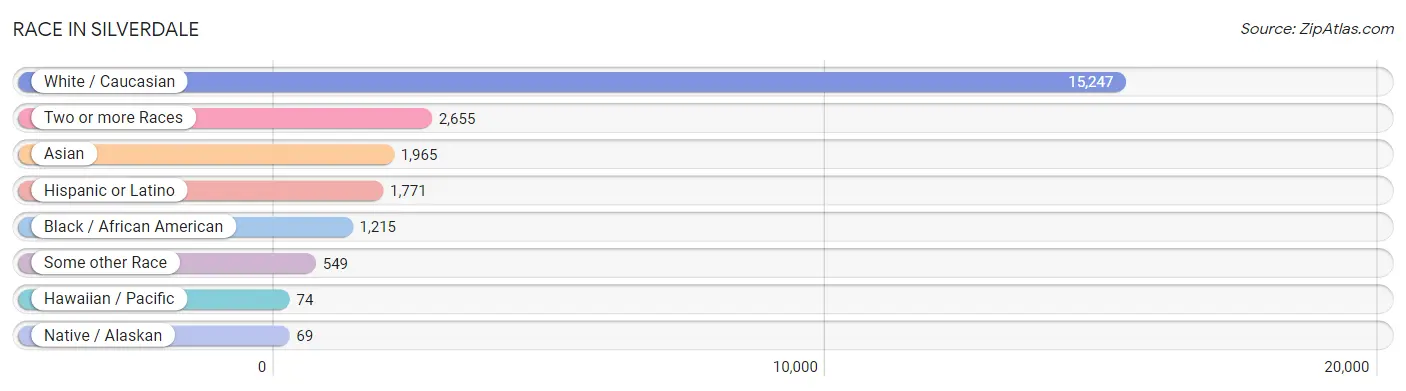
| Race | # Population | % Population |
| Asian | 1,965 | 9.0% |
| Black / African American | 1,215 | 5.6% |
| Hawaiian / Pacific | 74 | 0.3% |
| Hispanic or Latino | 1,771 | 8.1% |
| Native / Alaskan | 69 | 0.3% |
| White / Caucasian | 15,247 | 70.0% |
| Two or more Races | 2,655 | 12.2% |
| Some other Race | 549 | 2.5% |
| Total | 21,774 | 100.0% |
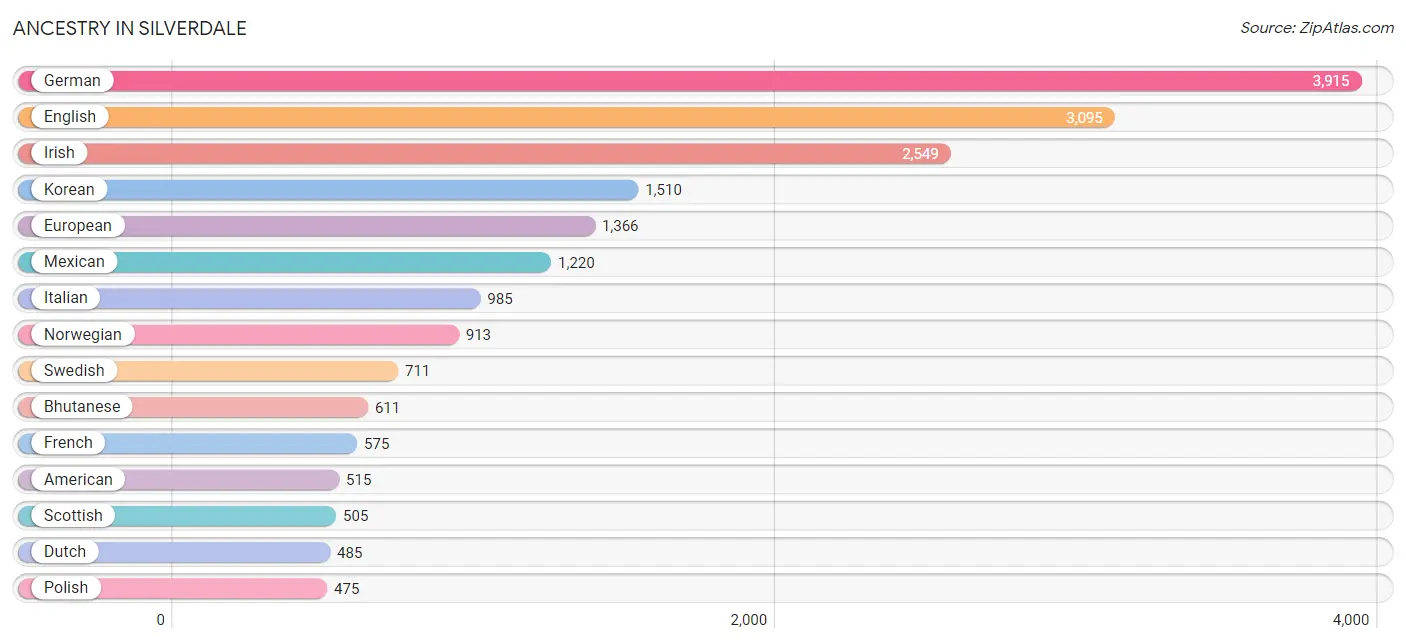
Ancestry in Silverdale
The most populous ancestries reported in Silverdale are German (3,915 | 18.0%), English (3,095 | 14.2%), Irish (2,549 | 11.7%), Korean (1,510 | 6.9%), and European (1,366 | 6.3%), together accounting for 57.1% of all Silverdale residents.
| Ancestry | # Population | % Population |
| African | 13 | 0.1% |
| American | 515 | 2.4% |
| Arab | 20 | 0.1% |
| Argentinean | 15 | 0.1% |
| Armenian | 31 | 0.1% |
| Austrian | 44 | 0.2% |
| Bangladeshi | 26 | 0.1% |
| Bhutanese | 611 | 2.8% |
| Blackfeet | 98 | 0.4% |
| Bolivian | 4 | 0.0% |
| British | 145 | 0.7% |
| British West Indian | 9 | 0.0% |
| Burmese | 186 | 0.9% |
| Canadian | 12 | 0.1% |
| Celtic | 23 | 0.1% |
| Central American | 113 | 0.5% |
| Cherokee | 150 | 0.7% |
| Chippewa | 9 | 0.0% |
| Choctaw | 6 | 0.0% |
| Colombian | 10 | 0.1% |
| Comanche | 10 | 0.1% |
| Creek | 42 | 0.2% |
| Cuban | 11 | 0.1% |
| Czech | 95 | 0.4% |
| Danish | 204 | 0.9% |
| Dutch | 485 | 2.2% |
| Eastern European | 6 | 0.0% |
| Ecuadorian | 7 | 0.0% |
| English | 3,095 | 14.2% |
| European | 1,366 | 6.3% |
| Fijian | 4 | 0.0% |
| Filipino | 9 | 0.0% |
| Finnish | 144 | 0.7% |
| French | 575 | 2.6% |
| French Canadian | 161 | 0.7% |
| German | 3,915 | 18.0% |
| Greek | 84 | 0.4% |
| Guamanian / Chamorro | 64 | 0.3% |
| Guatemalan | 84 | 0.4% |
| Haitian | 112 | 0.5% |
| Hungarian | 82 | 0.4% |
| Icelander | 9 | 0.0% |
| Indian (Asian) | 232 | 1.1% |
| Iranian | 8 | 0.0% |
| Irish | 2,549 | 11.7% |
| Italian | 985 | 4.5% |
| Jamaican | 5 | 0.0% |
| Korean | 1,510 | 6.9% |
| Laotian | 122 | 0.6% |
| Lebanese | 6 | 0.0% |
| Lithuanian | 39 | 0.2% |
| Macedonian | 9 | 0.0% |
| Mexican | 1,220 | 5.6% |
| Mexican American Indian | 12 | 0.1% |
| Native Hawaiian | 99 | 0.4% |
| Nigerian | 19 | 0.1% |
| Northern European | 49 | 0.2% |
| Norwegian | 913 | 4.2% |
| Pakistani | 45 | 0.2% |
| Polish | 475 | 2.2% |
| Portuguese | 56 | 0.3% |
| Pueblo | 28 | 0.1% |
| Puerto Rican | 96 | 0.4% |
| Romanian | 59 | 0.3% |
| Russian | 44 | 0.2% |
| Salvadoran | 29 | 0.1% |
| Samoan | 26 | 0.1% |
| Scandinavian | 309 | 1.4% |
| Scotch-Irish | 241 | 1.1% |
| Scottish | 505 | 2.3% |
| Sioux | 5 | 0.0% |
| Slovak | 40 | 0.2% |
| South American | 82 | 0.4% |
| South American Indian | 7 | 0.0% |
| Spaniard | 45 | 0.2% |
| Spanish | 157 | 0.7% |
| Sri Lankan | 279 | 1.3% |
| Subsaharan African | 32 | 0.2% |
| Swedish | 711 | 3.3% |
| Swiss | 109 | 0.5% |
| Thai | 151 | 0.7% |
| Tlingit-Haida | 29 | 0.1% |
| Ukrainian | 46 | 0.2% |
| Ute | 8 | 0.0% |
| Venezuelan | 46 | 0.2% |
| Welsh | 140 | 0.6% |
| Yaqui | 15 | 0.1% |
| Yup'ik | 25 | 0.1% | View All 88 Rows |
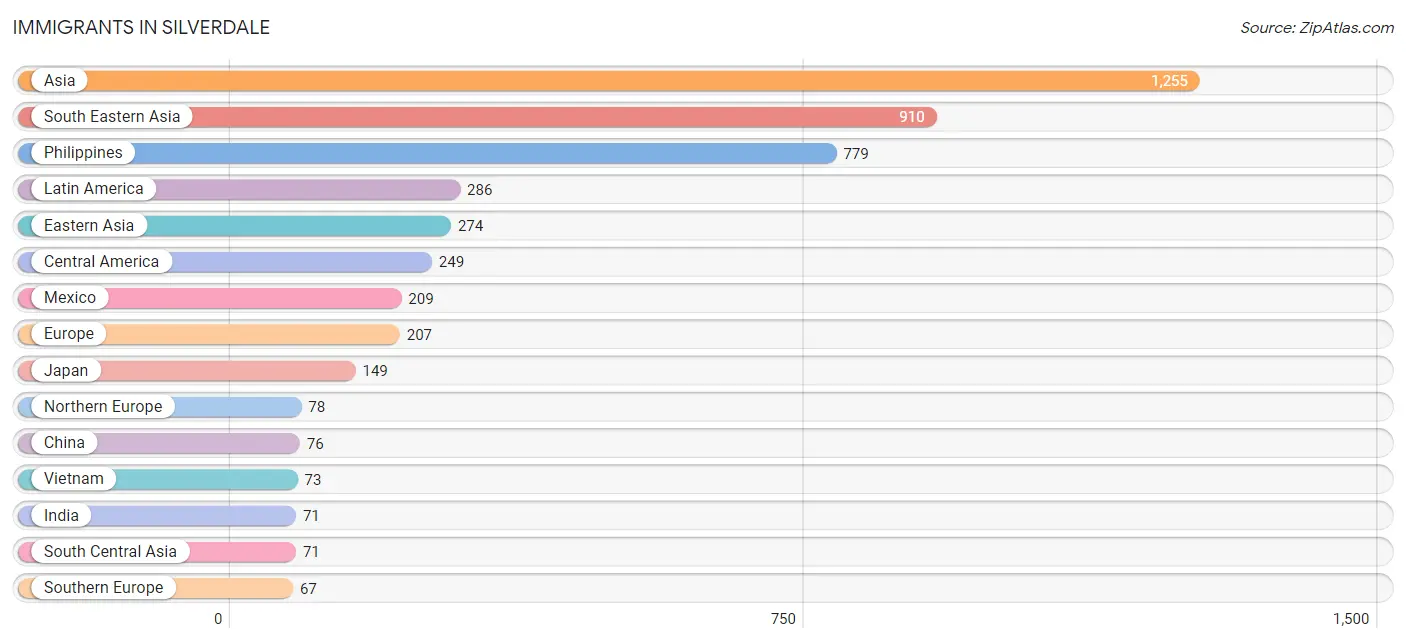
Immigrants in Silverdale
The most numerous immigrant groups reported in Silverdale came from Asia (1,255 | 5.8%), South Eastern Asia (910 | 4.2%), Philippines (779 | 3.6%), Latin America (286 | 1.3%), and Eastern Asia (274 | 1.3%), together accounting for 16.1% of all Silverdale residents.
| Immigration Origin | # Population | % Population |
| Africa | 39 | 0.2% |
| Argentina | 5 | 0.0% |
| Asia | 1,255 | 5.8% |
| Australia | 15 | 0.1% |
| Canada | 7 | 0.0% |
| Caribbean | 32 | 0.2% |
| Central America | 249 | 1.1% |
| China | 76 | 0.4% |
| Denmark | 9 | 0.0% |
| Eastern Asia | 274 | 1.3% |
| Eastern Europe | 53 | 0.2% |
| El Salvador | 29 | 0.1% |
| England | 56 | 0.3% |
| Europe | 207 | 0.9% |
| Germany | 9 | 0.0% |
| Guatemala | 11 | 0.1% |
| Haiti | 29 | 0.1% |
| India | 71 | 0.3% |
| Italy | 60 | 0.3% |
| Jamaica | 3 | 0.0% |
| Japan | 149 | 0.7% |
| Korea | 49 | 0.2% |
| Laos | 8 | 0.0% |
| Latin America | 286 | 1.3% |
| Mexico | 209 | 1.0% |
| Nigeria | 19 | 0.1% |
| Northern Africa | 6 | 0.0% |
| Northern Europe | 78 | 0.4% |
| Norway | 13 | 0.1% |
| Oceania | 15 | 0.1% |
| Philippines | 779 | 3.6% |
| Poland | 53 | 0.2% |
| South Africa | 14 | 0.1% |
| South America | 5 | 0.0% |
| South Central Asia | 71 | 0.3% |
| South Eastern Asia | 910 | 4.2% |
| Southern Europe | 67 | 0.3% |
| Spain | 7 | 0.0% |
| Taiwan | 9 | 0.0% |
| Thailand | 50 | 0.2% |
| Vietnam | 73 | 0.3% |
| Western Africa | 19 | 0.1% |
| Western Europe | 9 | 0.0% | View All 43 Rows |
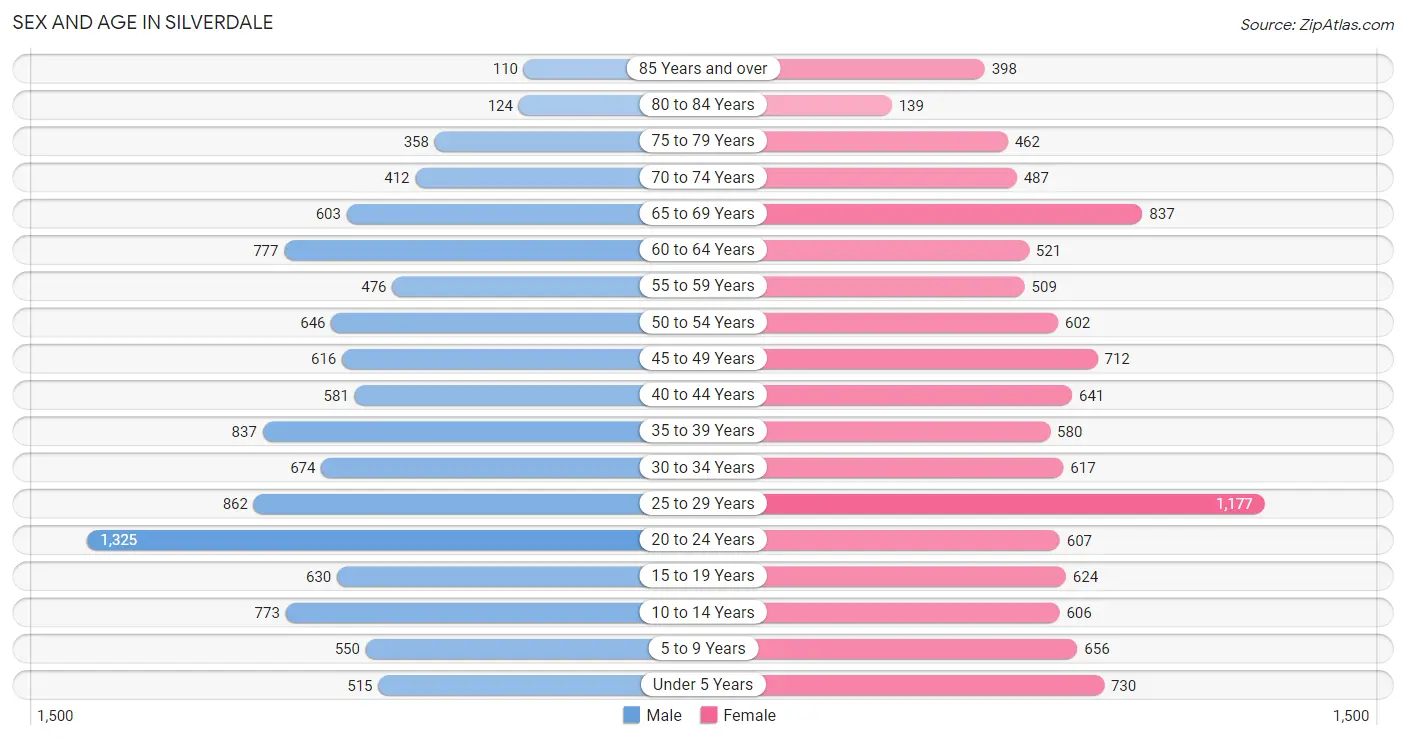
Sex and Age in Silverdale
Sex and Age in Silverdale
The most populous age groups in Silverdale are 20 to 24 Years (1,325 | 12.2%) for men and 25 to 29 Years (1,177 | 10.8%) for women.
| Age Bracket | Male | Female |
| Under 5 Years | 515 (4.7%) | 730 (6.7%) |
| 5 to 9 Years | 550 (5.1%) | 656 (6.0%) |
| 10 to 14 Years | 773 (7.1%) | 606 (5.6%) |
| 15 to 19 Years | 630 (5.8%) | 624 (5.7%) |
| 20 to 24 Years | 1,325 (12.2%) | 607 (5.6%) |
| 25 to 29 Years | 862 (7.9%) | 1,177 (10.8%) |
| 30 to 34 Years | 674 (6.2%) | 617 (5.7%) |
| 35 to 39 Years | 837 (7.7%) | 580 (5.3%) |
| 40 to 44 Years | 581 (5.3%) | 641 (5.9%) |
| 45 to 49 Years | 616 (5.7%) | 712 (6.5%) |
| 50 to 54 Years | 646 (5.9%) | 602 (5.5%) |
| 55 to 59 Years | 476 (4.4%) | 509 (4.7%) |
| 60 to 64 Years | 777 (7.1%) | 521 (4.8%) |
| 65 to 69 Years | 603 (5.6%) | 837 (7.7%) |
| 70 to 74 Years | 412 (3.8%) | 487 (4.5%) |
| 75 to 79 Years | 358 (3.3%) | 462 (4.2%) |
| 80 to 84 Years | 124 (1.1%) | 139 (1.3%) |
| 85 Years and over | 110 (1.0%) | 398 (3.6%) |
| Total | 10,869 (100.0%) | 10,905 (100.0%) |
Families and Households in Silverdale
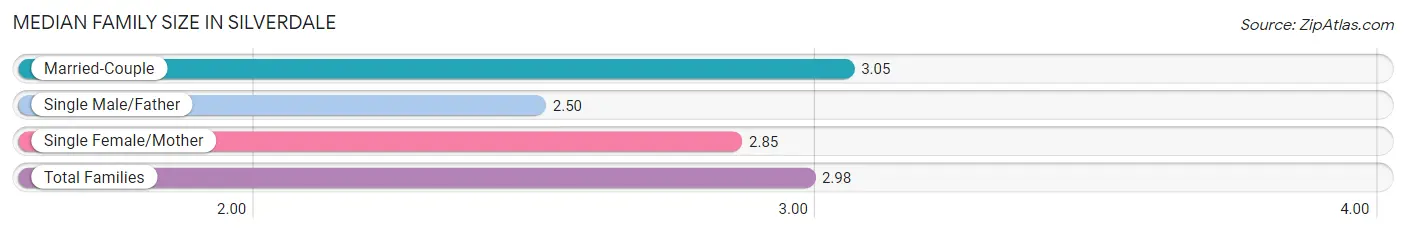
Median Family Size in Silverdale
The median family size in Silverdale is 2.98 persons per family, with married-couple families (4,453 | 78.1%) accounting for the largest median family size of 3.05 persons per family. On the other hand, single male/father families (384 | 6.7%) represent the smallest median family size with 2.50 persons per family.
| Family Type | # Families | Family Size |
| Married-Couple | 4,453 (78.1%) | 3.05 |
| Single Male/Father | 384 (6.7%) | 2.50 |
| Single Female/Mother | 864 (15.2%) | 2.85 |
| Total Families | 5,701 (100.0%) | 2.98 |
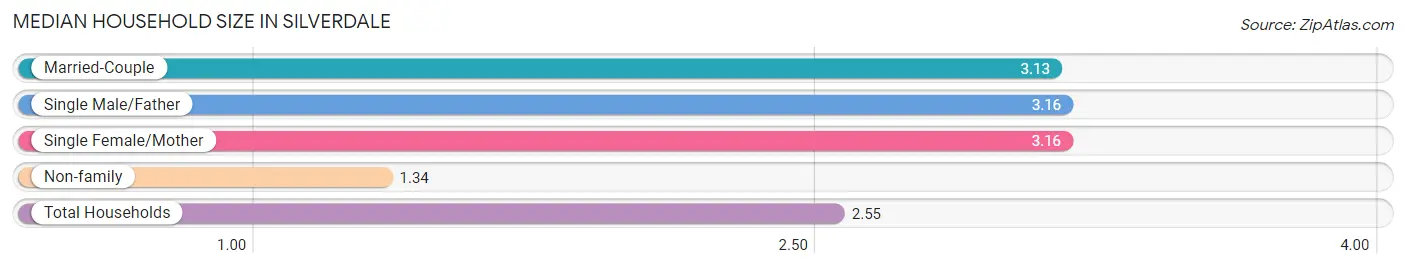
Median Household Size in Silverdale
The median household size in Silverdale is 2.55 persons per household, with single male/father households (384 | 4.5%) accounting for the largest median household size of 3.16 persons per household. non-family households (2,764 | 32.7%) represent the smallest median household size with 1.34 persons per household.
| Household Type | # Households | Household Size |
| Married-Couple | 4,453 (52.6%) | 3.13 |
| Single Male/Father | 384 (4.5%) | 3.16 |
| Single Female/Mother | 864 (10.2%) | 3.16 |
| Non-family | 2,764 (32.7%) | 1.34 |
| Total Households | 8,465 (100.0%) | 2.55 |
Household Size by Marriage Status in Silverdale
Out of a total of 8,465 households in Silverdale, 5,701 (67.3%) are family households, while 2,764 (32.7%) are nonfamily households. The most numerous type of family households are 2-person households, comprising 2,323, and the most common type of nonfamily households are 1-person households, comprising 2,072.
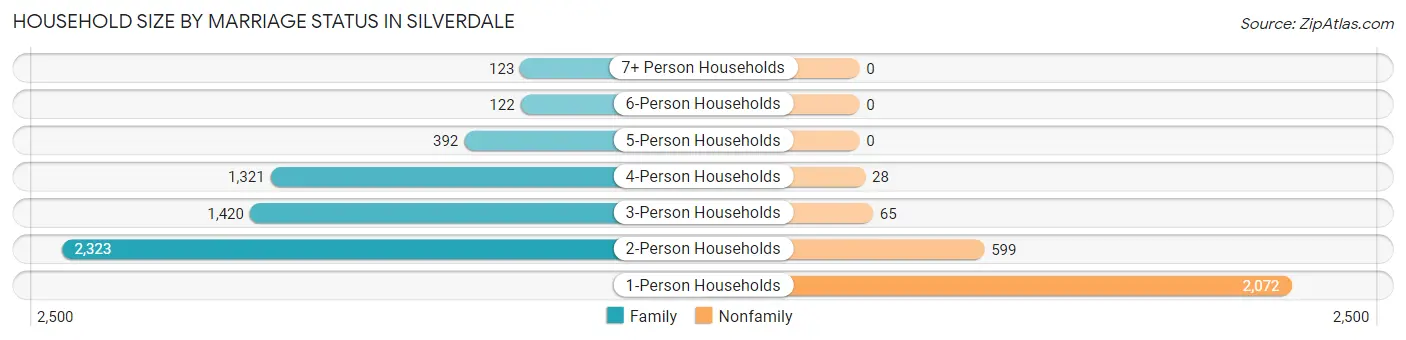
| Household Size | Family Households | Nonfamily Households |
| 1-Person Households | - | 2,072 (24.5%) |
| 2-Person Households | 2,323 (27.4%) | 599 (7.1%) |
| 3-Person Households | 1,420 (16.8%) | 65 (0.8%) |
| 4-Person Households | 1,321 (15.6%) | 28 (0.3%) |
| 5-Person Households | 392 (4.6%) | 0 (0.0%) |
| 6-Person Households | 122 (1.4%) | 0 (0.0%) |
| 7+ Person Households | 123 (1.5%) | 0 (0.0%) |
| Total | 5,701 (67.3%) | 2,764 (32.7%) |
Female Fertility in Silverdale
Fertility by Age in Silverdale
Average fertility rate in Silverdale is 24.0 births per 1,000 women. Women in the age bracket of 20 to 34 years have the highest fertility rate with 49.0 births per 1,000 women. Women in the age bracket of 20 to 34 years acount for 92.9% of all women with births.
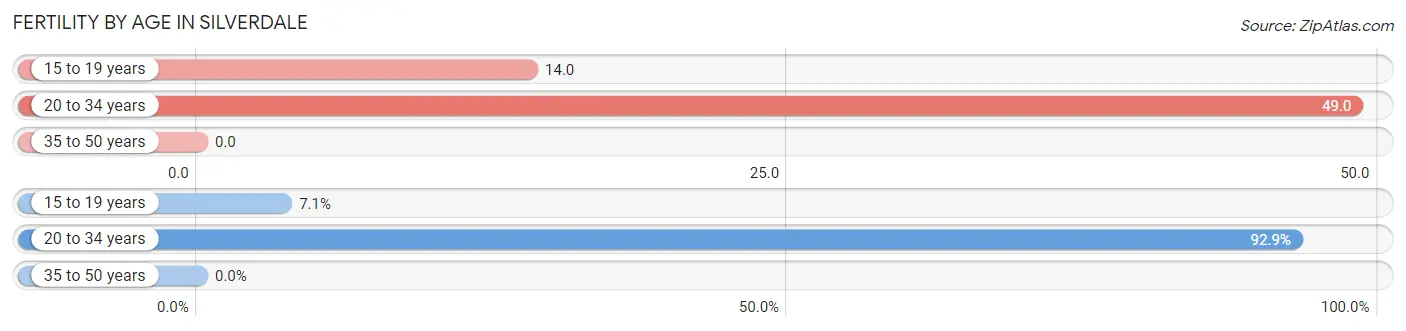
| Age Bracket | Women with Births | Births / 1,000 Women |
| 15 to 19 years | 9 (7.1%) | 14.0 |
| 20 to 34 years | 117 (92.9%) | 49.0 |
| 35 to 50 years | 0 (0.0%) | 0.0 |
| Total | 126 (100.0%) | 24.0 |
Fertility by Age by Marriage Status in Silverdale
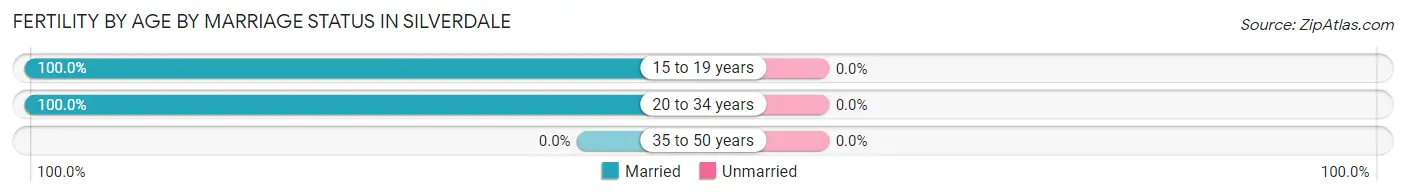
| Age Bracket | Married | Unmarried |
| 15 to 19 years | 9 (100.0%) | 0 (0.0%) |
| 20 to 34 years | 117 (100.0%) | 0 (0.0%) |
| 35 to 50 years | 0 (0.0%) | 0 (0.0%) |
| Total | 126 (100.0%) | 0 (0.0%) |
Fertility by Education in Silverdale
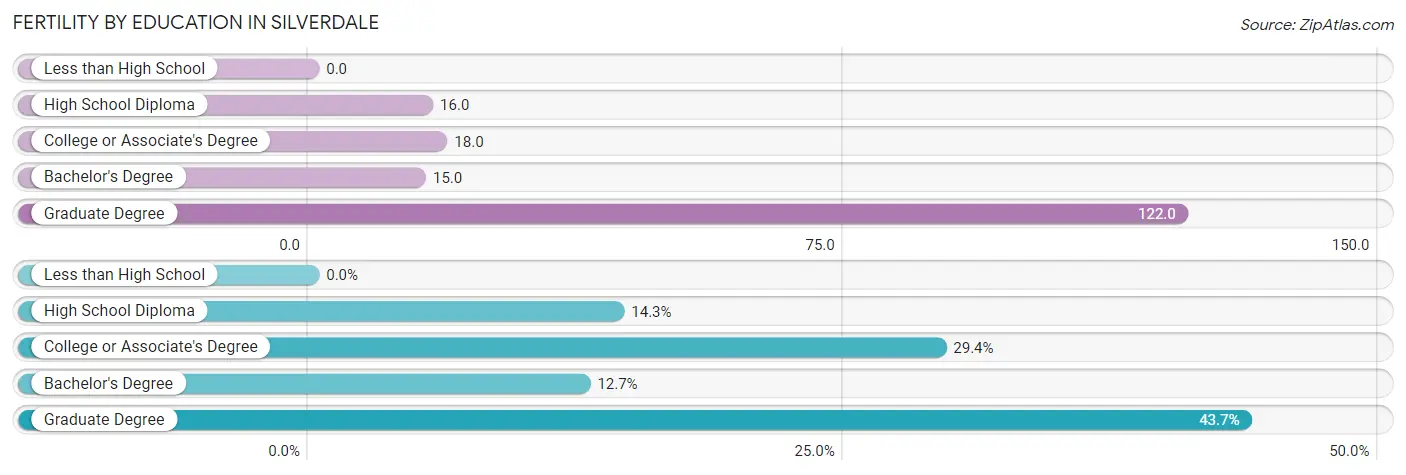
| Educational Attainment | Women with Births | Births / 1,000 Women |
| Less than High School | 0 (0.0%) | 0.0 |
| High School Diploma | 18 (14.3%) | 16.0 |
| College or Associate's Degree | 37 (29.4%) | 18.0 |
| Bachelor's Degree | 16 (12.7%) | 15.0 |
| Graduate Degree | 55 (43.6%) | 122.0 |
| Total | 126 (100.0%) | 24.0 |
Fertility by Education by Marriage Status in Silverdale
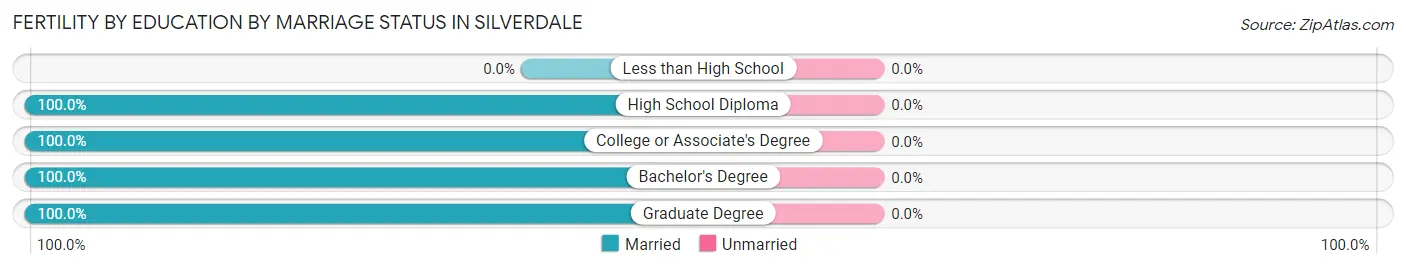
| Educational Attainment | Married | Unmarried |
| Less than High School | 0 (0.0%) | 0 (0.0%) |
| High School Diploma | 18 (100.0%) | 0 (0.0%) |
| College or Associate's Degree | 37 (100.0%) | 0 (0.0%) |
| Bachelor's Degree | 16 (100.0%) | 0 (0.0%) |
| Graduate Degree | 55 (100.0%) | 0 (0.0%) |
| Total | 126 (100.0%) | 0 (0.0%) |
Employment Characteristics in Silverdale
Employment by Class of Employer in Silverdale
Among the 10,644 employed individuals in Silverdale, private company employees (4,731 | 44.5%), federal government employees (3,879 | 36.4%), and local government employees (625 | 5.9%) make up the most common classes of employment.
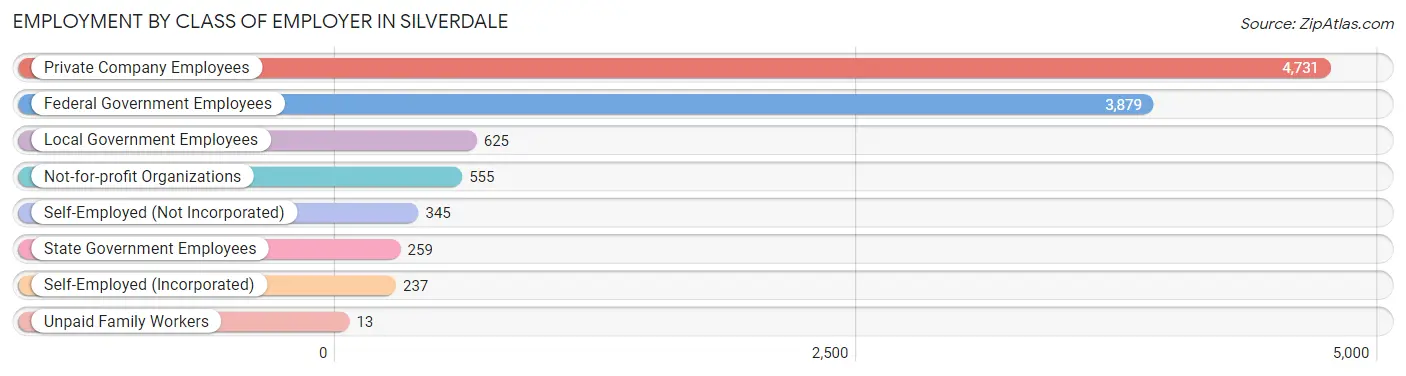
| Employer Class | # Employees | % Employees |
| Private Company Employees | 4,731 | 44.5% |
| Self-Employed (Incorporated) | 237 | 2.2% |
| Self-Employed (Not Incorporated) | 345 | 3.2% |
| Not-for-profit Organizations | 555 | 5.2% |
| Local Government Employees | 625 | 5.9% |
| State Government Employees | 259 | 2.4% |
| Federal Government Employees | 3,879 | 36.4% |
| Unpaid Family Workers | 13 | 0.1% |
| Total | 10,644 | 100.0% |
Employment Status by Age in Silverdale
According to the labor force statistics for Silverdale, out of the total population over 16 years of age (17,748), 64.1% or 11,376 individuals are in the labor force, with 5.1% or 580 of them unemployed. The age group with the highest labor force participation rate is 20 to 24 years, with 89.4% or 1,727 individuals in the labor force. Within the labor force, the 16 to 19 years age range has the highest percentage of unemployed individuals, with 18.4% or 59 of them being unemployed.
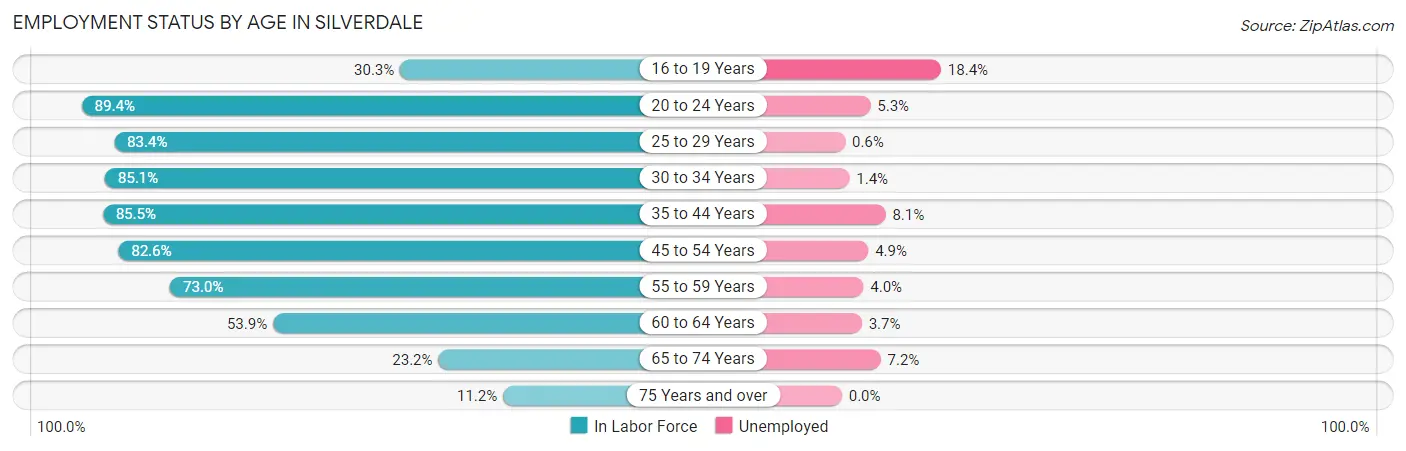
| Age Bracket | In Labor Force | Unemployed |
| 16 to 19 Years | 321 (30.3%) | 59 (18.4%) |
| 20 to 24 Years | 1,727 (89.4%) | 92 (5.3%) |
| 25 to 29 Years | 1,701 (83.4%) | 10 (0.6%) |
| 30 to 34 Years | 1,099 (85.1%) | 15 (1.4%) |
| 35 to 44 Years | 2,256 (85.5%) | 183 (8.1%) |
| 45 to 54 Years | 2,128 (82.6%) | 104 (4.9%) |
| 55 to 59 Years | 719 (73.0%) | 29 (4.0%) |
| 60 to 64 Years | 700 (53.9%) | 26 (3.7%) |
| 65 to 74 Years | 543 (23.2%) | 39 (7.2%) |
| 75 Years and over | 178 (11.2%) | 0 (0.0%) |
| Total | 11,376 (64.1%) | 580 (5.1%) |
Employment Status by Educational Attainment in Silverdale
According to labor force statistics for Silverdale, 79.5% of individuals (8,608) out of the total population between 25 and 64 years of age (10,828) are in the labor force, with 4.4% or 379 of them being unemployed. The group with the highest labor force participation rate are those with the educational attainment of bachelor's degree or higher, with 82.6% or 3,098 individuals in the labor force. Within the labor force, individuals with high school diploma education have the highest percentage of unemployment, with 11.8% or 199 of them being unemployed.
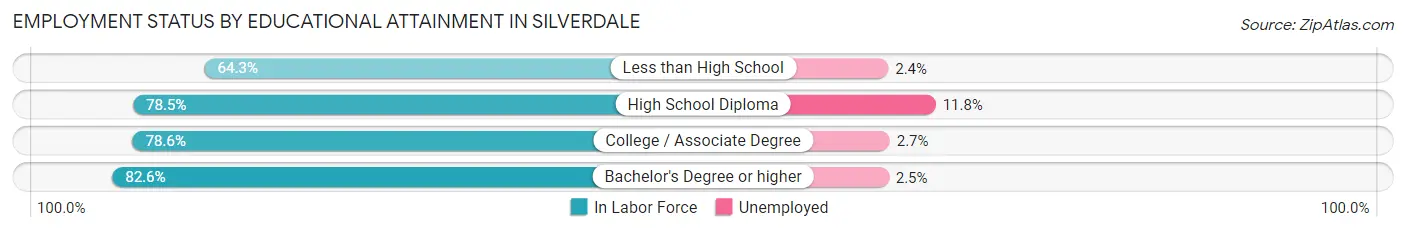
| Educational Attainment | In Labor Force | Unemployed |
| Less than High School | 252 (64.3%) | 9 (2.4%) |
| High School Diploma | 1,689 (78.5%) | 254 (11.8%) |
| College / Associate Degree | 3,565 (78.6%) | 122 (2.7%) |
| Bachelor's Degree or higher | 3,098 (82.6%) | 94 (2.5%) |
| Total | 8,608 (79.5%) | 476 (4.4%) |
Employment Occupations by Sex in Silverdale
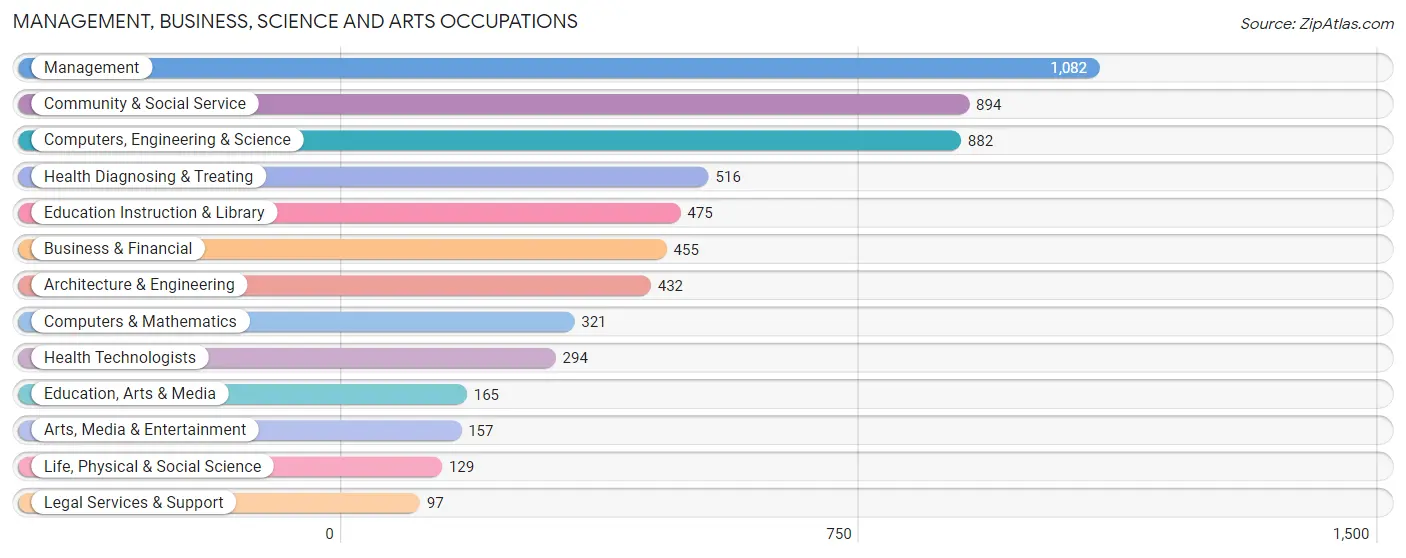
Management, Business, Science and Arts Occupations
The most common Management, Business, Science and Arts occupations in Silverdale are Management (1,082 | 11.8%), Community & Social Service (894 | 9.8%), Computers, Engineering & Science (882 | 9.7%), Health Diagnosing & Treating (516 | 5.7%), and Education Instruction & Library (475 | 5.2%).
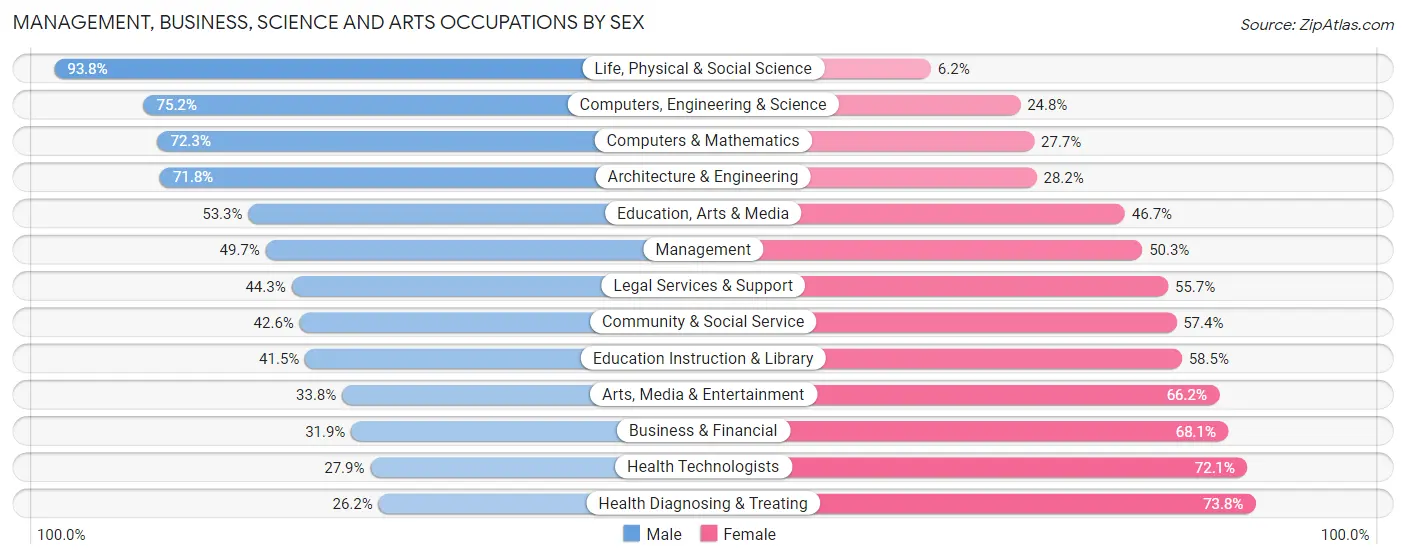
Management, Business, Science and Arts Occupations by Sex
Within the Management, Business, Science and Arts occupations in Silverdale, the most male-oriented occupations are Life, Physical & Social Science (93.8%), Computers, Engineering & Science (75.2%), and Computers & Mathematics (72.3%), while the most female-oriented occupations are Health Diagnosing & Treating (73.8%), Health Technologists (72.1%), and Business & Financial (68.1%).
| Occupation | Male | Female |
| Management | 538 (49.7%) | 544 (50.3%) |
| Business & Financial | 145 (31.9%) | 310 (68.1%) |
| Computers, Engineering & Science | 663 (75.2%) | 219 (24.8%) |
| Computers & Mathematics | 232 (72.3%) | 89 (27.7%) |
| Architecture & Engineering | 310 (71.8%) | 122 (28.2%) |
| Life, Physical & Social Science | 121 (93.8%) | 8 (6.2%) |
| Community & Social Service | 381 (42.6%) | 513 (57.4%) |
| Education, Arts & Media | 88 (53.3%) | 77 (46.7%) |
| Legal Services & Support | 43 (44.3%) | 54 (55.7%) |
| Education Instruction & Library | 197 (41.5%) | 278 (58.5%) |
| Arts, Media & Entertainment | 53 (33.8%) | 104 (66.2%) |
| Health Diagnosing & Treating | 135 (26.2%) | 381 (73.8%) |
| Health Technologists | 82 (27.9%) | 212 (72.1%) |
| Total (Category) | 1,862 (48.6%) | 1,967 (51.4%) |
| Total (Overall) | 4,653 (51.0%) | 4,478 (49.0%) |
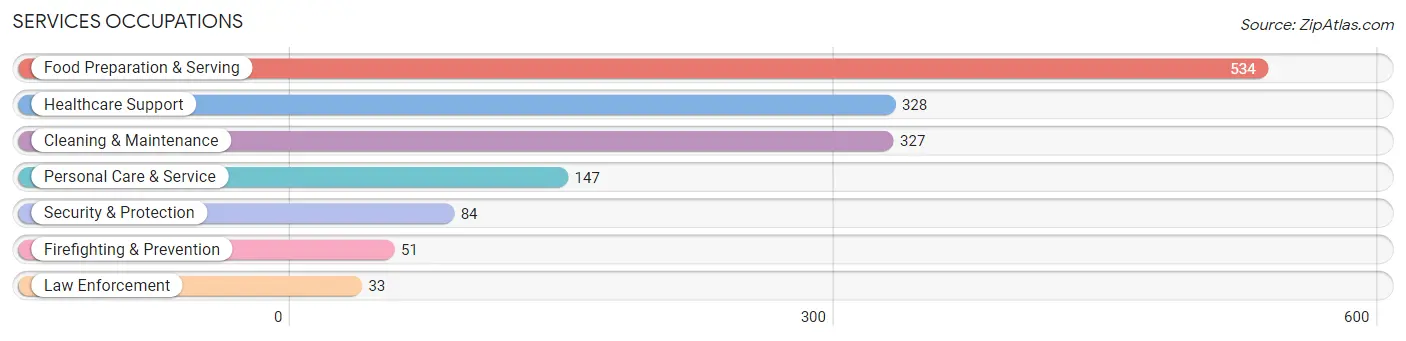
Services Occupations
The most common Services occupations in Silverdale are Food Preparation & Serving (534 | 5.9%), Healthcare Support (328 | 3.6%), Cleaning & Maintenance (327 | 3.6%), Personal Care & Service (147 | 1.6%), and Security & Protection (84 | 0.9%).
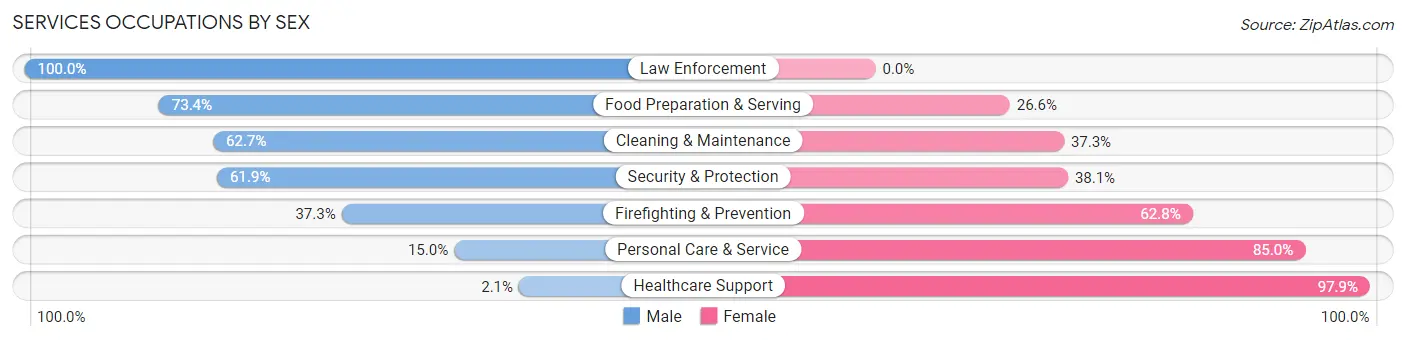
Services Occupations by Sex
Within the Services occupations in Silverdale, the most male-oriented occupations are Law Enforcement (100.0%), Food Preparation & Serving (73.4%), and Cleaning & Maintenance (62.7%), while the most female-oriented occupations are Healthcare Support (97.9%), Personal Care & Service (85.0%), and Firefighting & Prevention (62.7%).
| Occupation | Male | Female |
| Healthcare Support | 7 (2.1%) | 321 (97.9%) |
| Security & Protection | 52 (61.9%) | 32 (38.1%) |
| Firefighting & Prevention | 19 (37.2%) | 32 (62.7%) |
| Law Enforcement | 33 (100.0%) | 0 (0.0%) |
| Food Preparation & Serving | 392 (73.4%) | 142 (26.6%) |
| Cleaning & Maintenance | 205 (62.7%) | 122 (37.3%) |
| Personal Care & Service | 22 (15.0%) | 125 (85.0%) |
| Total (Category) | 678 (47.7%) | 742 (52.2%) |
| Total (Overall) | 4,653 (51.0%) | 4,478 (49.0%) |
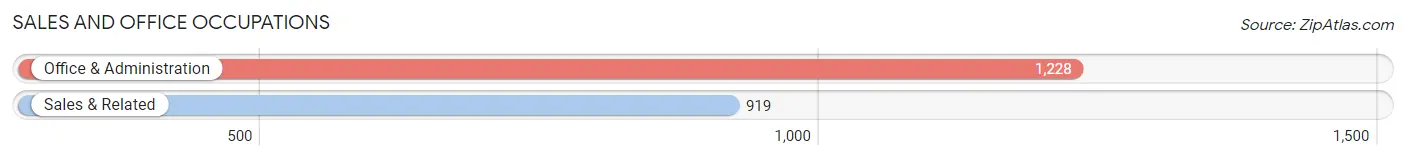
Sales and Office Occupations
The most common Sales and Office occupations in Silverdale are Office & Administration (1,228 | 13.5%), and Sales & Related (919 | 10.1%).
Sales and Office Occupations by Sex
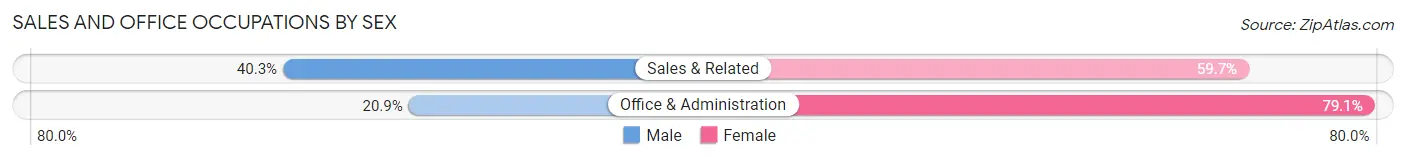
| Occupation | Male | Female |
| Sales & Related | 370 (40.3%) | 549 (59.7%) |
| Office & Administration | 257 (20.9%) | 971 (79.1%) |
| Total (Category) | 627 (29.2%) | 1,520 (70.8%) |
| Total (Overall) | 4,653 (51.0%) | 4,478 (49.0%) |
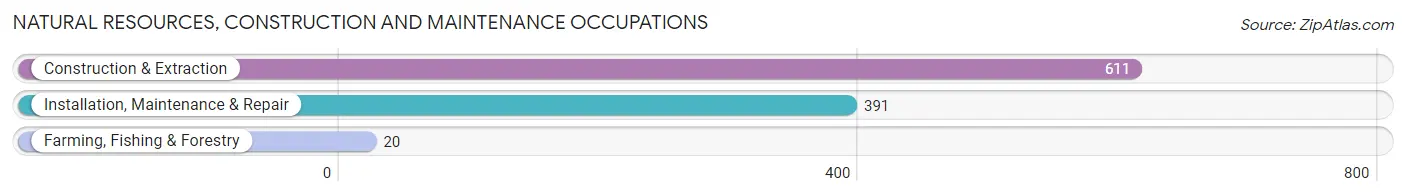
Natural Resources, Construction and Maintenance Occupations
The most common Natural Resources, Construction and Maintenance occupations in Silverdale are Construction & Extraction (611 | 6.7%), Installation, Maintenance & Repair (391 | 4.3%), and Farming, Fishing & Forestry (20 | 0.2%).
Natural Resources, Construction and Maintenance Occupations by Sex
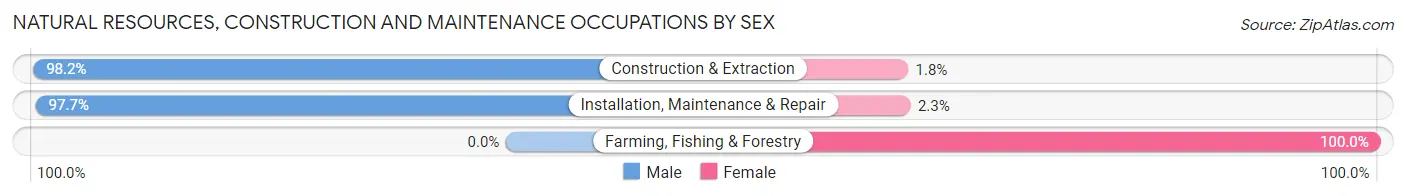
| Occupation | Male | Female |
| Farming, Fishing & Forestry | 0 (0.0%) | 20 (100.0%) |
| Construction & Extraction | 600 (98.2%) | 11 (1.8%) |
| Installation, Maintenance & Repair | 382 (97.7%) | 9 (2.3%) |
| Total (Category) | 982 (96.1%) | 40 (3.9%) |
| Total (Overall) | 4,653 (51.0%) | 4,478 (49.0%) |
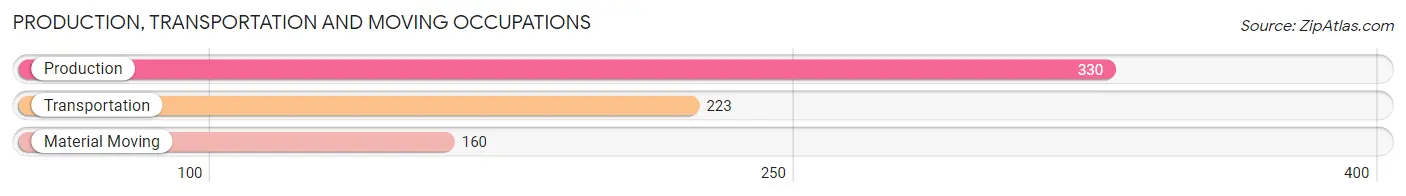
Production, Transportation and Moving Occupations
The most common Production, Transportation and Moving occupations in Silverdale are Production (330 | 3.6%), Transportation (223 | 2.4%), and Material Moving (160 | 1.8%).
Production, Transportation and Moving Occupations by Sex
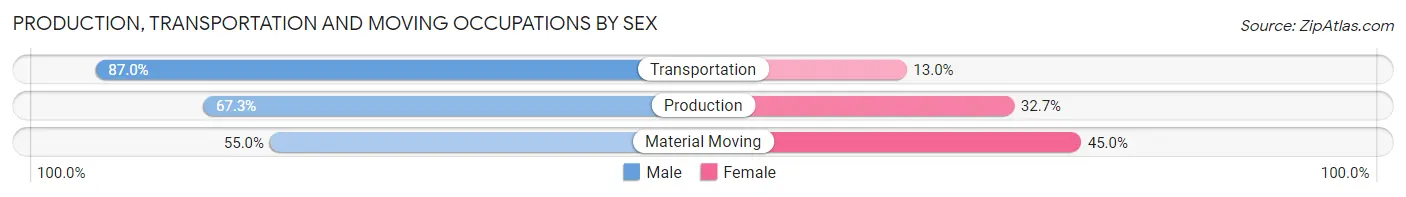
| Occupation | Male | Female |
| Production | 222 (67.3%) | 108 (32.7%) |
| Transportation | 194 (87.0%) | 29 (13.0%) |
| Material Moving | 88 (55.0%) | 72 (45.0%) |
| Total (Category) | 504 (70.7%) | 209 (29.3%) |
| Total (Overall) | 4,653 (51.0%) | 4,478 (49.0%) |
Employment Industries by Sex in Silverdale
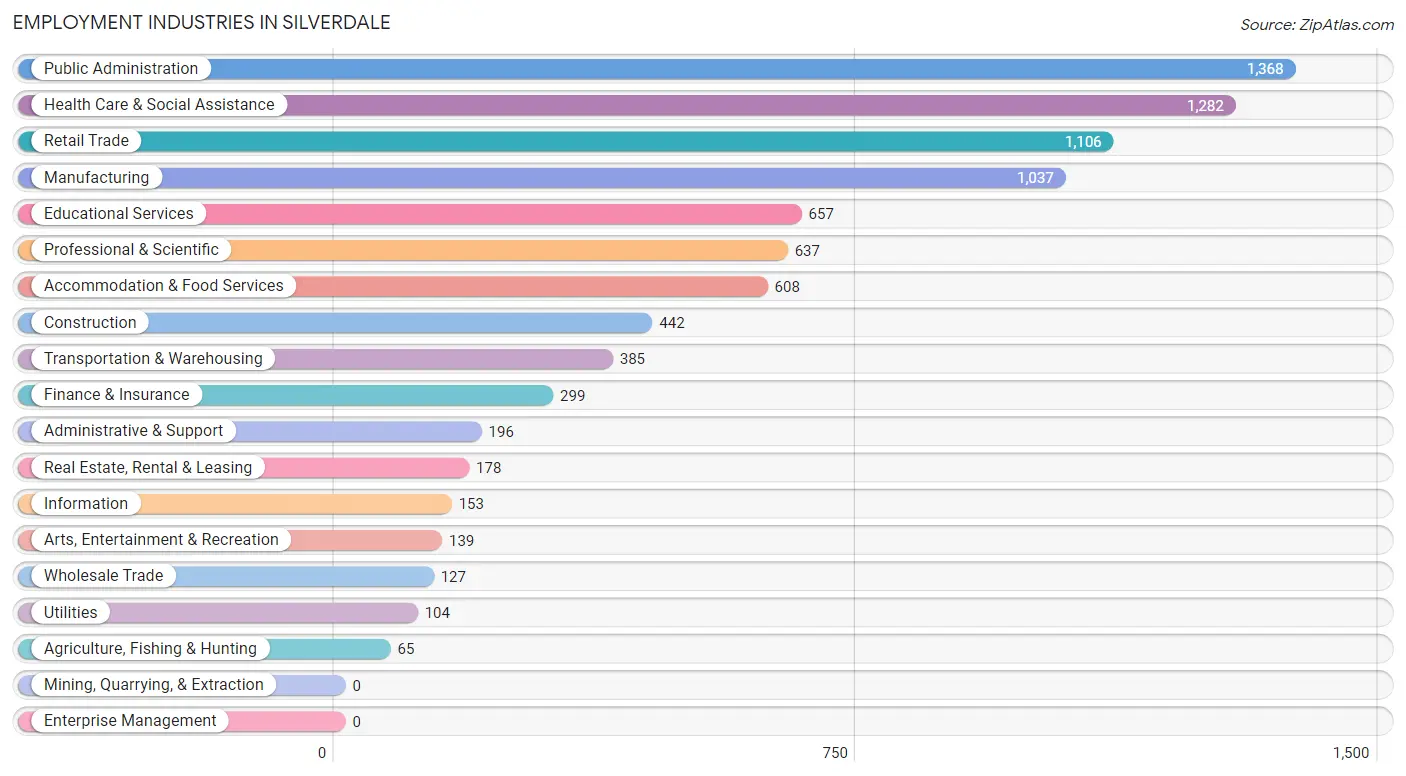
Employment Industries in Silverdale
The major employment industries in Silverdale include Public Administration (1,368 | 15.0%), Health Care & Social Assistance (1,282 | 14.0%), Retail Trade (1,106 | 12.1%), Manufacturing (1,037 | 11.4%), and Educational Services (657 | 7.2%).
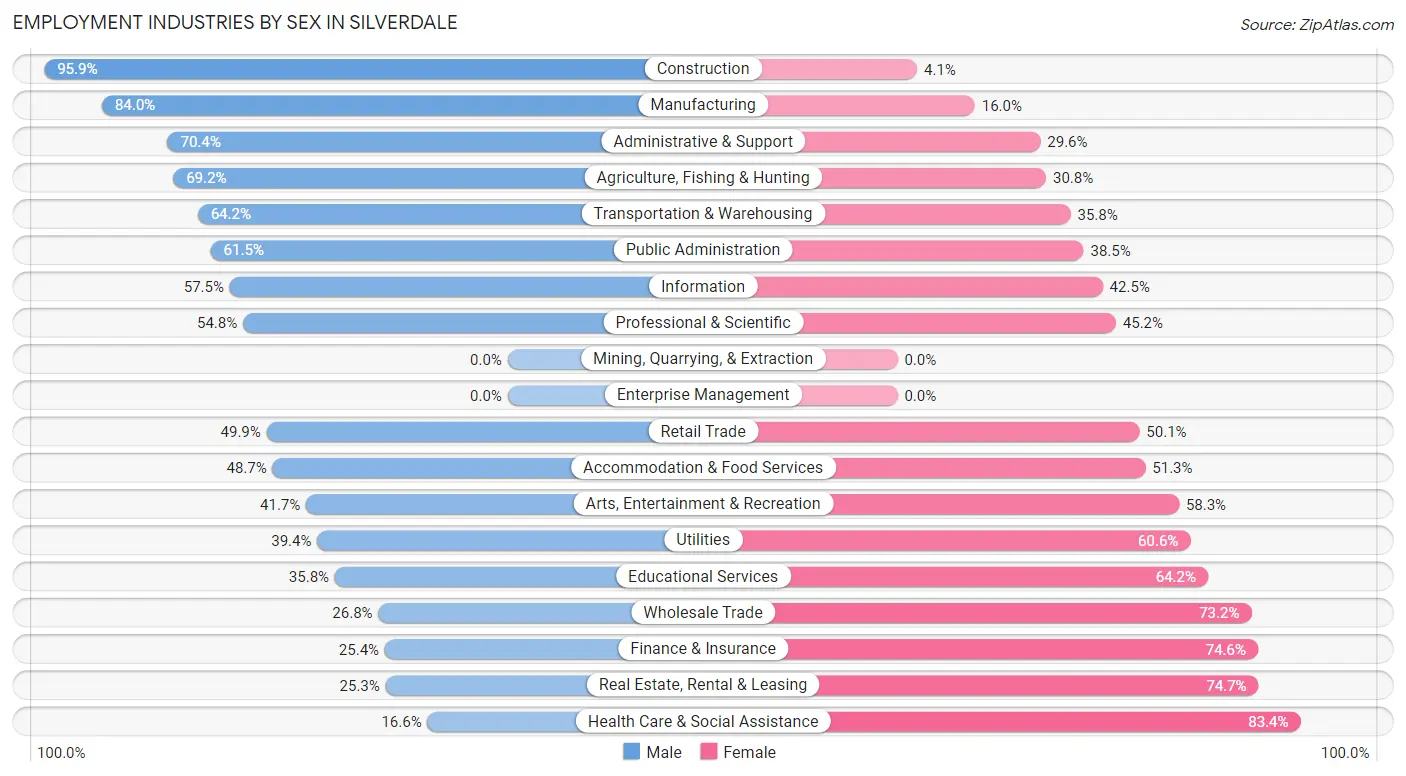
Employment Industries by Sex in Silverdale
The Silverdale industries that see more men than women are Construction (95.9%), Manufacturing (84.0%), and Administrative & Support (70.4%), whereas the industries that tend to have a higher number of women are Health Care & Social Assistance (83.4%), Real Estate, Rental & Leasing (74.7%), and Finance & Insurance (74.6%).
| Industry | Male | Female |
| Agriculture, Fishing & Hunting | 45 (69.2%) | 20 (30.8%) |
| Mining, Quarrying, & Extraction | 0 (0.0%) | 0 (0.0%) |
| Construction | 424 (95.9%) | 18 (4.1%) |
| Manufacturing | 871 (84.0%) | 166 (16.0%) |
| Wholesale Trade | 34 (26.8%) | 93 (73.2%) |
| Retail Trade | 552 (49.9%) | 554 (50.1%) |
| Transportation & Warehousing | 247 (64.2%) | 138 (35.8%) |
| Utilities | 41 (39.4%) | 63 (60.6%) |
| Information | 88 (57.5%) | 65 (42.5%) |
| Finance & Insurance | 76 (25.4%) | 223 (74.6%) |
| Real Estate, Rental & Leasing | 45 (25.3%) | 133 (74.7%) |
| Professional & Scientific | 349 (54.8%) | 288 (45.2%) |
| Enterprise Management | 0 (0.0%) | 0 (0.0%) |
| Administrative & Support | 138 (70.4%) | 58 (29.6%) |
| Educational Services | 235 (35.8%) | 422 (64.2%) |
| Health Care & Social Assistance | 213 (16.6%) | 1,069 (83.4%) |
| Arts, Entertainment & Recreation | 58 (41.7%) | 81 (58.3%) |
| Accommodation & Food Services | 296 (48.7%) | 312 (51.3%) |
| Public Administration | 841 (61.5%) | 527 (38.5%) |
| Total | 4,653 (51.0%) | 4,478 (49.0%) |
Education in Silverdale
School Enrollment in Silverdale
The most common levels of schooling among the 4,935 students in Silverdale are elementary school (1,083 | 22.0%), college / undergraduate (1,061 | 21.5%), and middle school (1,001 | 20.3%).
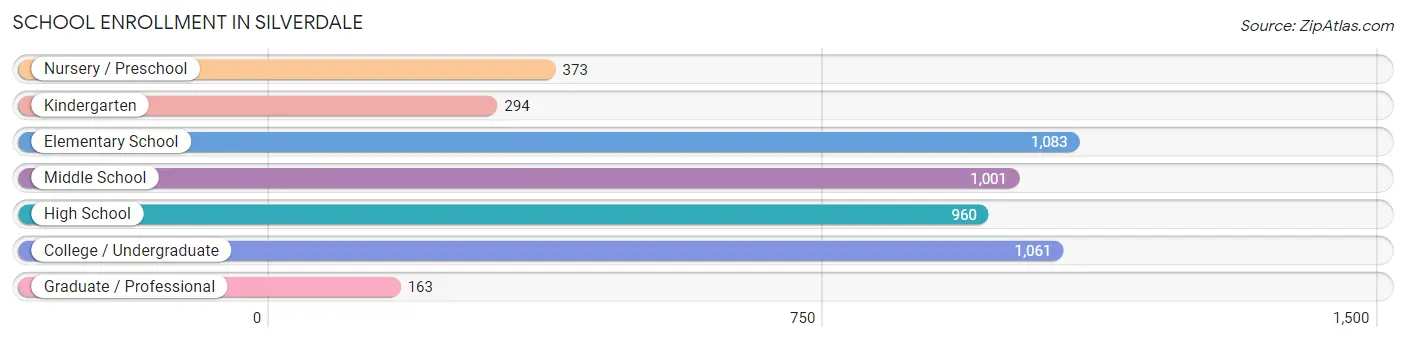
| School Level | # Students | % Students |
| Nursery / Preschool | 373 | 7.6% |
| Kindergarten | 294 | 6.0% |
| Elementary School | 1,083 | 22.0% |
| Middle School | 1,001 | 20.3% |
| High School | 960 | 19.5% |
| College / Undergraduate | 1,061 | 21.5% |
| Graduate / Professional | 163 | 3.3% |
| Total | 4,935 | 100.0% |
School Enrollment by Age by Funding Source in Silverdale
Out of a total of 4,935 students who are enrolled in schools in Silverdale, 494 (10.0%) attend a private institution, while the remaining 4,442 (90.0%) are enrolled in public schools. The age group of 3 to 4 year olds has the highest likelihood of being enrolled in private schools, with 134 (39.4% in the age bracket) enrolled. Conversely, the age group of 15 to 17 year olds has the lowest likelihood of being enrolled in a private school, with 639 (98.9% in the age bracket) attending a public institution.
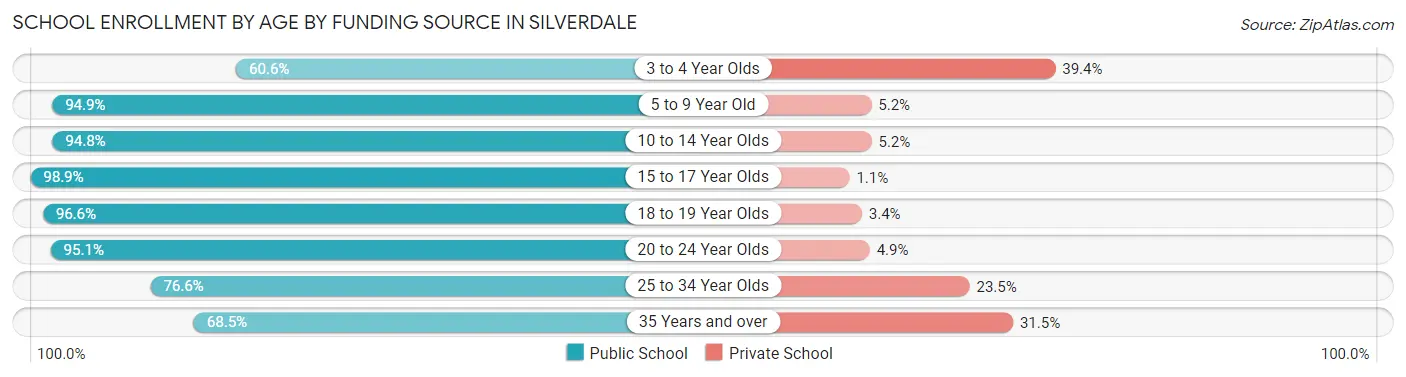
| Age Bracket | Public School | Private School |
| 3 to 4 Year Olds | 206 (60.6%) | 134 (39.4%) |
| 5 to 9 Year Old | 1,104 (94.9%) | 60 (5.1%) |
| 10 to 14 Year Olds | 1,297 (94.8%) | 71 (5.2%) |
| 15 to 17 Year Olds | 639 (98.9%) | 7 (1.1%) |
| 18 to 19 Year Olds | 285 (96.6%) | 10 (3.4%) |
| 20 to 24 Year Olds | 372 (95.1%) | 19 (4.9%) |
| 25 to 34 Year Olds | 346 (76.5%) | 106 (23.4%) |
| 35 Years and over | 191 (68.5%) | 88 (31.5%) |
| Total | 4,442 (90.0%) | 494 (10.0%) |
Educational Attainment by Field of Study in Silverdale
Business (861 | 15.3%), science & technology (684 | 12.1%), education (670 | 11.9%), engineering (661 | 11.7%), and social sciences (380 | 6.7%) are the most common fields of study among 5,644 individuals in Silverdale who have obtained a bachelor's degree or higher.
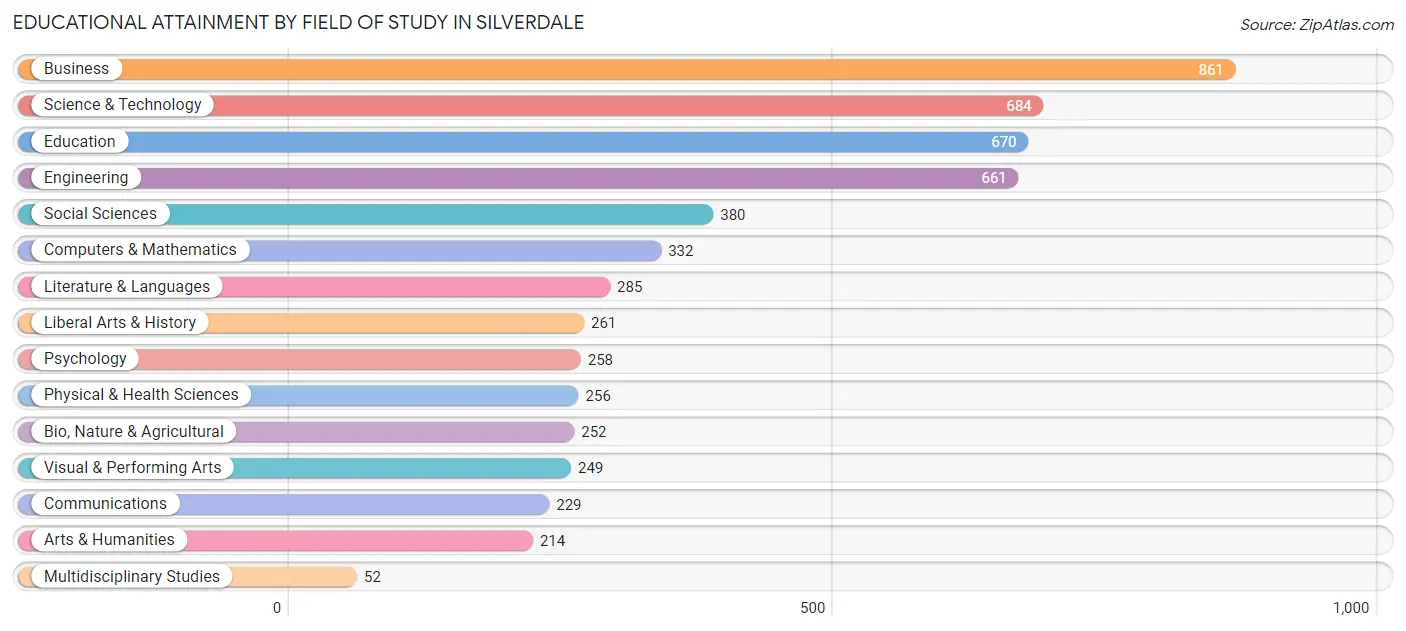
| Field of Study | # Graduates | % Graduates |
| Computers & Mathematics | 332 | 5.9% |
| Bio, Nature & Agricultural | 252 | 4.5% |
| Physical & Health Sciences | 256 | 4.5% |
| Psychology | 258 | 4.6% |
| Social Sciences | 380 | 6.7% |
| Engineering | 661 | 11.7% |
| Multidisciplinary Studies | 52 | 0.9% |
| Science & Technology | 684 | 12.1% |
| Business | 861 | 15.3% |
| Education | 670 | 11.9% |
| Literature & Languages | 285 | 5.1% |
| Liberal Arts & History | 261 | 4.6% |
| Visual & Performing Arts | 249 | 4.4% |
| Communications | 229 | 4.1% |
| Arts & Humanities | 214 | 3.8% |
| Total | 5,644 | 100.0% |
Transportation & Commute in Silverdale
Vehicle Availability by Sex in Silverdale
The most prevalent vehicle ownership categories in Silverdale are males with 2 vehicles (2,804, accounting for 46.8%) and females with 2 vehicles (2,208, making up 60.2%).
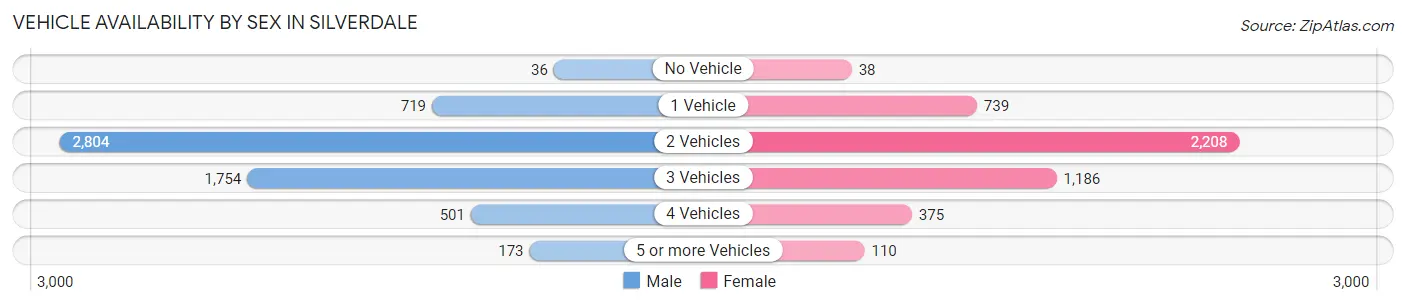
| Vehicles Available | Male | Female |
| No Vehicle | 36 (0.6%) | 38 (0.8%) |
| 1 Vehicle | 719 (12.0%) | 739 (15.9%) |
| 2 Vehicles | 2,804 (46.8%) | 2,208 (47.4%) |
| 3 Vehicles | 1,754 (29.3%) | 1,186 (25.5%) |
| 4 Vehicles | 501 (8.4%) | 375 (8.1%) |
| 5 or more Vehicles | 173 (2.9%) | 110 (2.4%) |
| Total | 5,987 (100.0%) | 4,656 (100.0%) |
Commute Time in Silverdale
The most frequently occuring commute durations in Silverdale are 15 to 19 minutes (2,006 commuters, 20.3%), 20 to 24 minutes (1,791 commuters, 18.2%), and 30 to 34 minutes (1,372 commuters, 13.9%).
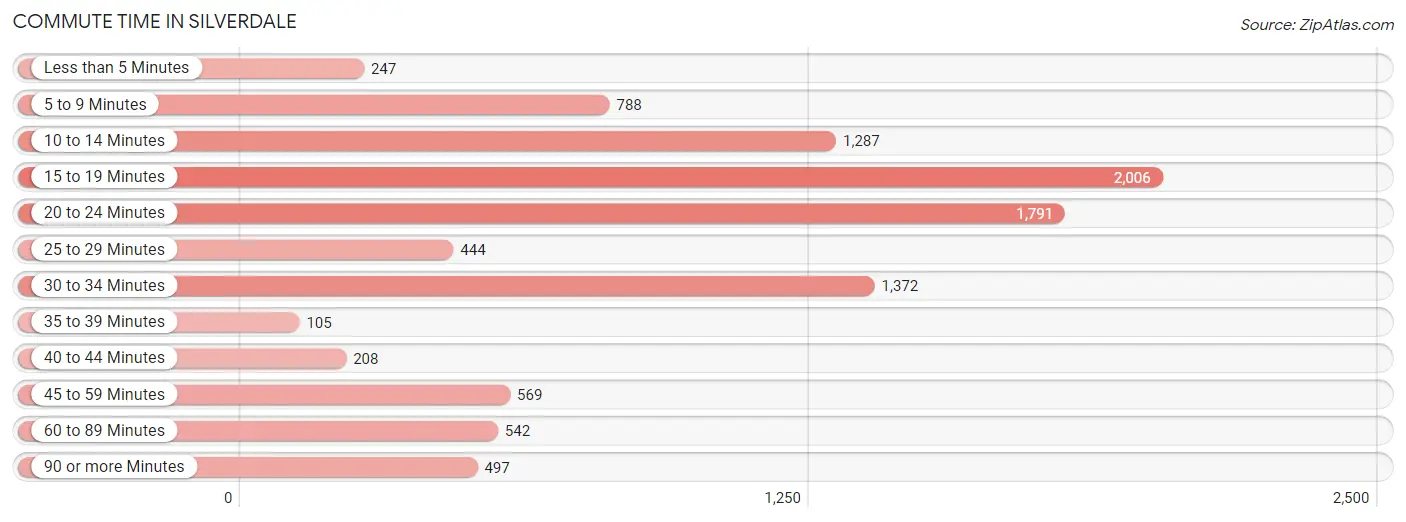
| Commute Time | # Commuters | % Commuters |
| Less than 5 Minutes | 247 | 2.5% |
| 5 to 9 Minutes | 788 | 8.0% |
| 10 to 14 Minutes | 1,287 | 13.1% |
| 15 to 19 Minutes | 2,006 | 20.3% |
| 20 to 24 Minutes | 1,791 | 18.2% |
| 25 to 29 Minutes | 444 | 4.5% |
| 30 to 34 Minutes | 1,372 | 13.9% |
| 35 to 39 Minutes | 105 | 1.1% |
| 40 to 44 Minutes | 208 | 2.1% |
| 45 to 59 Minutes | 569 | 5.8% |
| 60 to 89 Minutes | 542 | 5.5% |
| 90 or more Minutes | 497 | 5.0% |
Commute Time by Sex in Silverdale
The most common commute times in Silverdale are 15 to 19 minutes (1,164 commuters, 20.5%) for males and 15 to 19 minutes (842 commuters, 20.1%) for females.
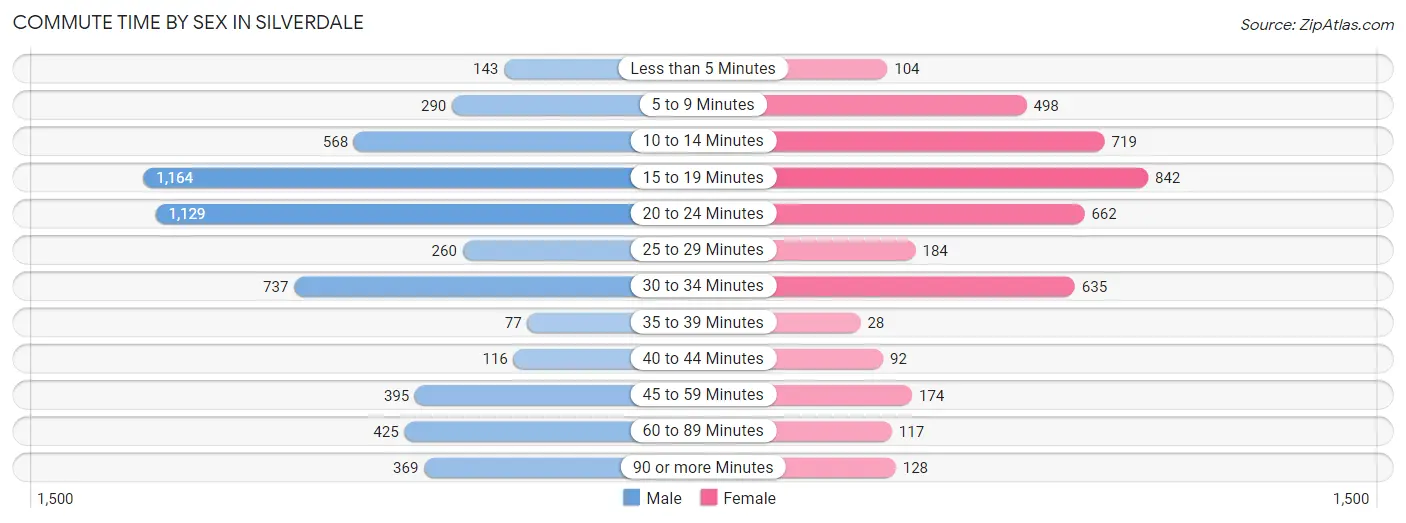
| Commute Time | Male | Female |
| Less than 5 Minutes | 143 (2.5%) | 104 (2.5%) |
| 5 to 9 Minutes | 290 (5.1%) | 498 (11.9%) |
| 10 to 14 Minutes | 568 (10.0%) | 719 (17.2%) |
| 15 to 19 Minutes | 1,164 (20.5%) | 842 (20.1%) |
| 20 to 24 Minutes | 1,129 (19.9%) | 662 (15.8%) |
| 25 to 29 Minutes | 260 (4.6%) | 184 (4.4%) |
| 30 to 34 Minutes | 737 (13.0%) | 635 (15.2%) |
| 35 to 39 Minutes | 77 (1.4%) | 28 (0.7%) |
| 40 to 44 Minutes | 116 (2.0%) | 92 (2.2%) |
| 45 to 59 Minutes | 395 (7.0%) | 174 (4.2%) |
| 60 to 89 Minutes | 425 (7.5%) | 117 (2.8%) |
| 90 or more Minutes | 369 (6.5%) | 128 (3.1%) |
Time of Departure to Work by Sex in Silverdale
The most frequent times of departure to work in Silverdale are 6:00 AM to 6:29 AM (1,072, 18.9%) for males and 6:30 AM to 6:59 AM (603, 14.4%) for females.
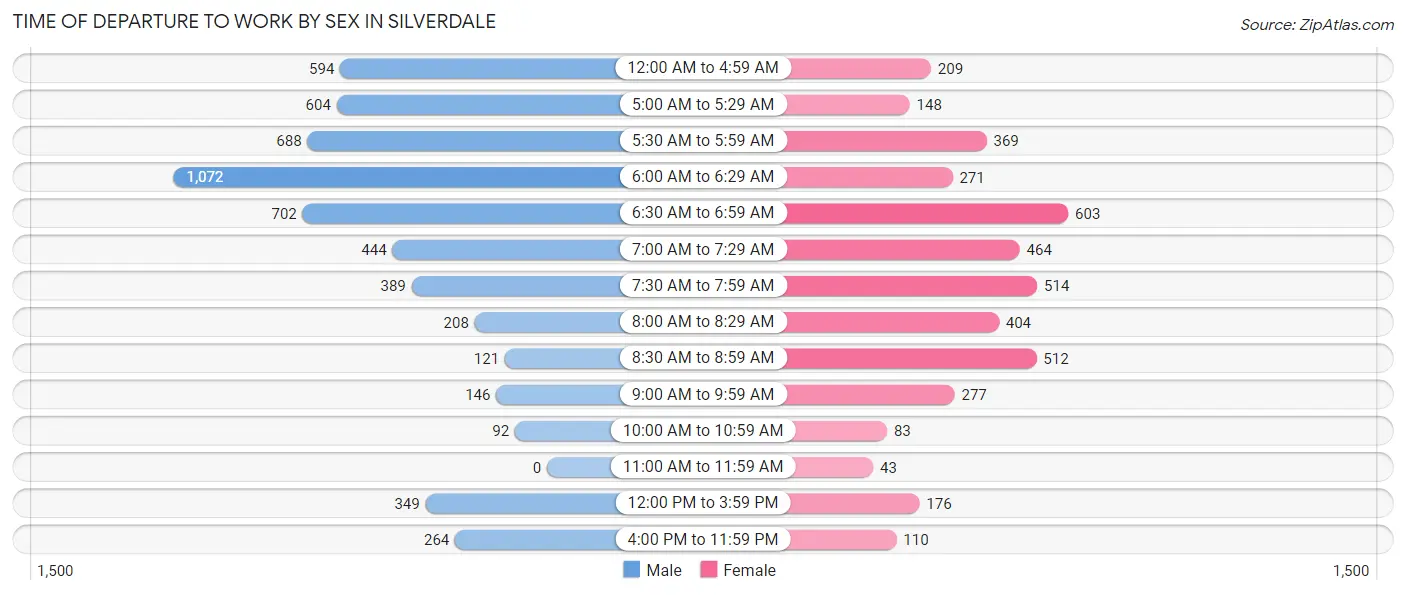
| Time of Departure | Male | Female |
| 12:00 AM to 4:59 AM | 594 (10.5%) | 209 (5.0%) |
| 5:00 AM to 5:29 AM | 604 (10.6%) | 148 (3.5%) |
| 5:30 AM to 5:59 AM | 688 (12.1%) | 369 (8.8%) |
| 6:00 AM to 6:29 AM | 1,072 (18.9%) | 271 (6.5%) |
| 6:30 AM to 6:59 AM | 702 (12.4%) | 603 (14.4%) |
| 7:00 AM to 7:29 AM | 444 (7.8%) | 464 (11.1%) |
| 7:30 AM to 7:59 AM | 389 (6.9%) | 514 (12.3%) |
| 8:00 AM to 8:29 AM | 208 (3.7%) | 404 (9.7%) |
| 8:30 AM to 8:59 AM | 121 (2.1%) | 512 (12.2%) |
| 9:00 AM to 9:59 AM | 146 (2.6%) | 277 (6.6%) |
| 10:00 AM to 10:59 AM | 92 (1.6%) | 83 (2.0%) |
| 11:00 AM to 11:59 AM | 0 (0.0%) | 43 (1.0%) |
| 12:00 PM to 3:59 PM | 349 (6.1%) | 176 (4.2%) |
| 4:00 PM to 11:59 PM | 264 (4.6%) | 110 (2.6%) |
| Total | 5,673 (100.0%) | 4,183 (100.0%) |
Housing Occupancy in Silverdale
Occupancy by Ownership in Silverdale
Of the total 8,465 dwellings in Silverdale, owner-occupied units account for 4,436 (52.4%), while renter-occupied units make up 4,029 (47.6%).
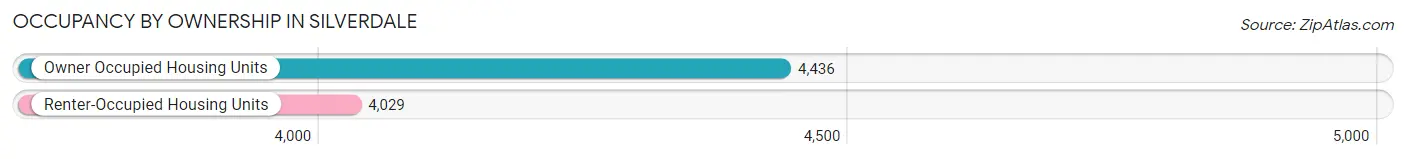
| Occupancy | # Housing Units | % Housing Units |
| Owner Occupied Housing Units | 4,436 | 52.4% |
| Renter-Occupied Housing Units | 4,029 | 47.6% |
| Total Occupied Housing Units | 8,465 | 100.0% |
Occupancy by Household Size in Silverdale
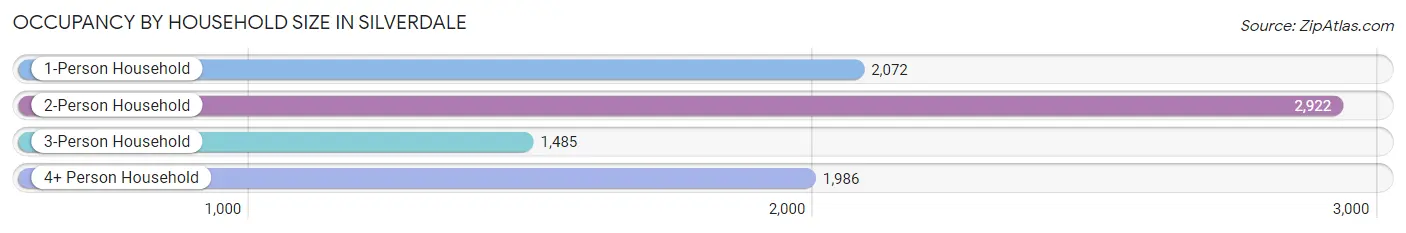
| Household Size | # Housing Units | % Housing Units |
| 1-Person Household | 2,072 | 24.5% |
| 2-Person Household | 2,922 | 34.5% |
| 3-Person Household | 1,485 | 17.5% |
| 4+ Person Household | 1,986 | 23.5% |
| Total Housing Units | 8,465 | 100.0% |
Occupancy by Ownership by Household Size in Silverdale
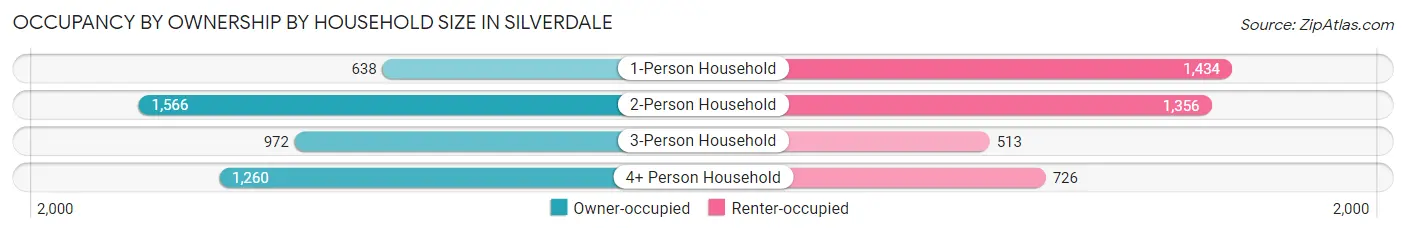
| Household Size | Owner-occupied | Renter-occupied |
| 1-Person Household | 638 (30.8%) | 1,434 (69.2%) |
| 2-Person Household | 1,566 (53.6%) | 1,356 (46.4%) |
| 3-Person Household | 972 (65.4%) | 513 (34.5%) |
| 4+ Person Household | 1,260 (63.4%) | 726 (36.6%) |
| Total Housing Units | 4,436 (52.4%) | 4,029 (47.6%) |
Occupancy by Educational Attainment in Silverdale
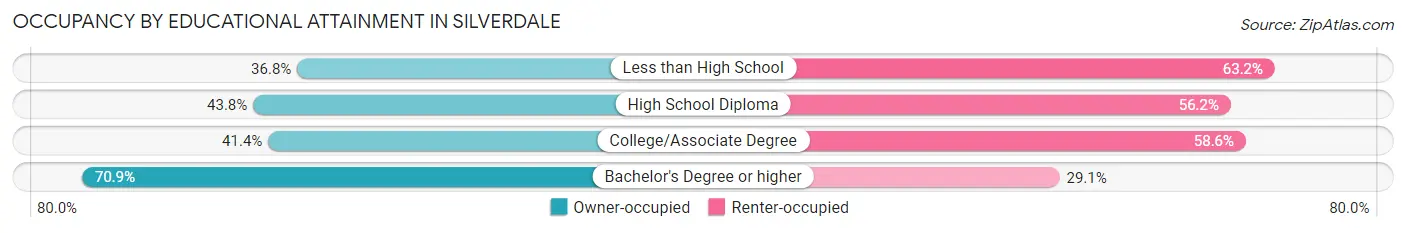
| Household Size | Owner-occupied | Renter-occupied |
| Less than High School | 82 (36.8%) | 141 (63.2%) |
| High School Diploma | 638 (43.8%) | 820 (56.2%) |
| College/Associate Degree | 1,533 (41.4%) | 2,173 (58.6%) |
| Bachelor's Degree or higher | 2,183 (70.9%) | 895 (29.1%) |
Occupancy by Age of Householder in Silverdale
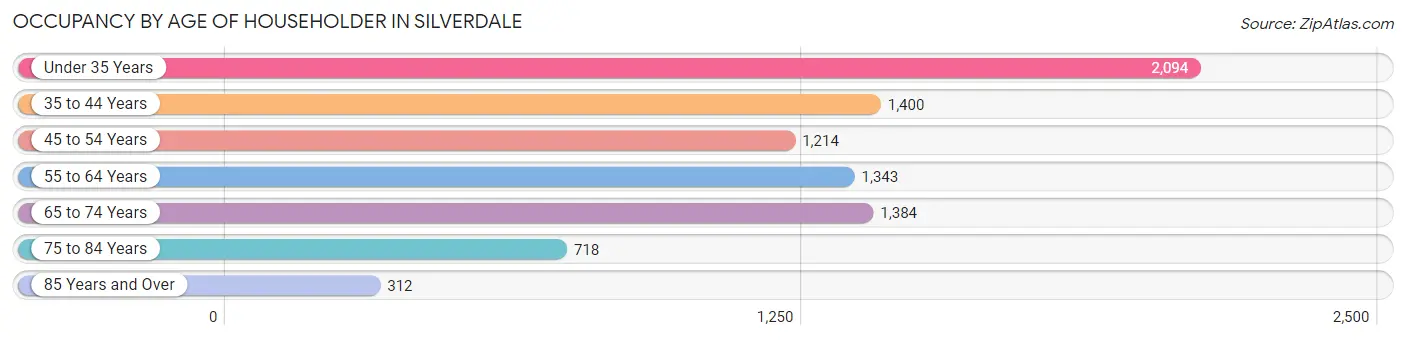
| Age Bracket | # Households | % Households |
| Under 35 Years | 2,094 | 24.7% |
| 35 to 44 Years | 1,400 | 16.5% |
| 45 to 54 Years | 1,214 | 14.3% |
| 55 to 64 Years | 1,343 | 15.9% |
| 65 to 74 Years | 1,384 | 16.4% |
| 75 to 84 Years | 718 | 8.5% |
| 85 Years and Over | 312 | 3.7% |
| Total | 8,465 | 100.0% |
Housing Finances in Silverdale
Median Income by Occupancy in Silverdale
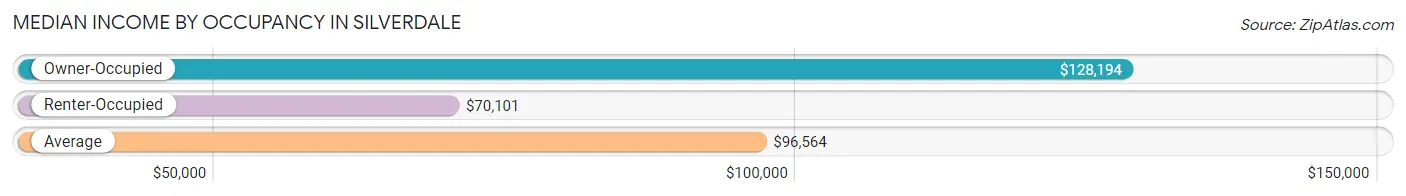
| Occupancy Type | # Households | Median Income |
| Owner-Occupied | 4,436 (52.4%) | $128,194 |
| Renter-Occupied | 4,029 (47.6%) | $70,101 |
| Average | 8,465 (100.0%) | $96,564 |
Occupancy by Householder Income Bracket in Silverdale
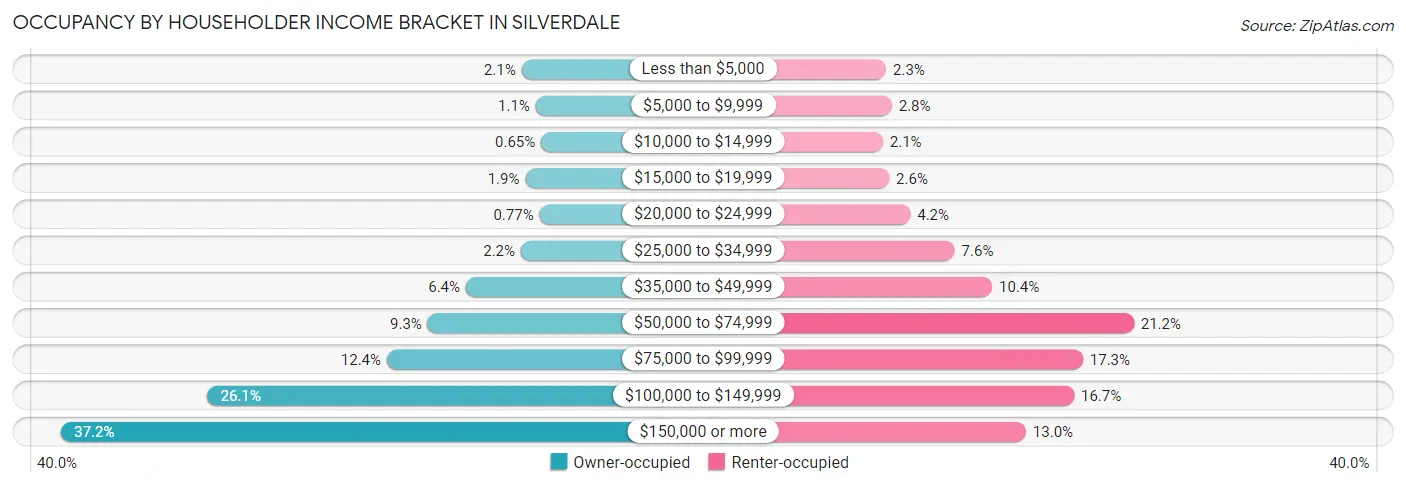
| Income Bracket | Owner-occupied | Renter-occupied |
| Less than $5,000 | 95 (2.1%) | 94 (2.3%) |
| $5,000 to $9,999 | 47 (1.1%) | 111 (2.8%) |
| $10,000 to $14,999 | 29 (0.6%) | 84 (2.1%) |
| $15,000 to $19,999 | 82 (1.8%) | 103 (2.6%) |
| $20,000 to $24,999 | 34 (0.8%) | 168 (4.2%) |
| $25,000 to $34,999 | 97 (2.2%) | 304 (7.5%) |
| $35,000 to $49,999 | 283 (6.4%) | 419 (10.4%) |
| $50,000 to $74,999 | 412 (9.3%) | 854 (21.2%) |
| $75,000 to $99,999 | 550 (12.4%) | 698 (17.3%) |
| $100,000 to $149,999 | 1,156 (26.1%) | 671 (16.7%) |
| $150,000 or more | 1,651 (37.2%) | 523 (13.0%) |
| Total | 4,436 (100.0%) | 4,029 (100.0%) |
Monthly Housing Cost Tiers in Silverdale
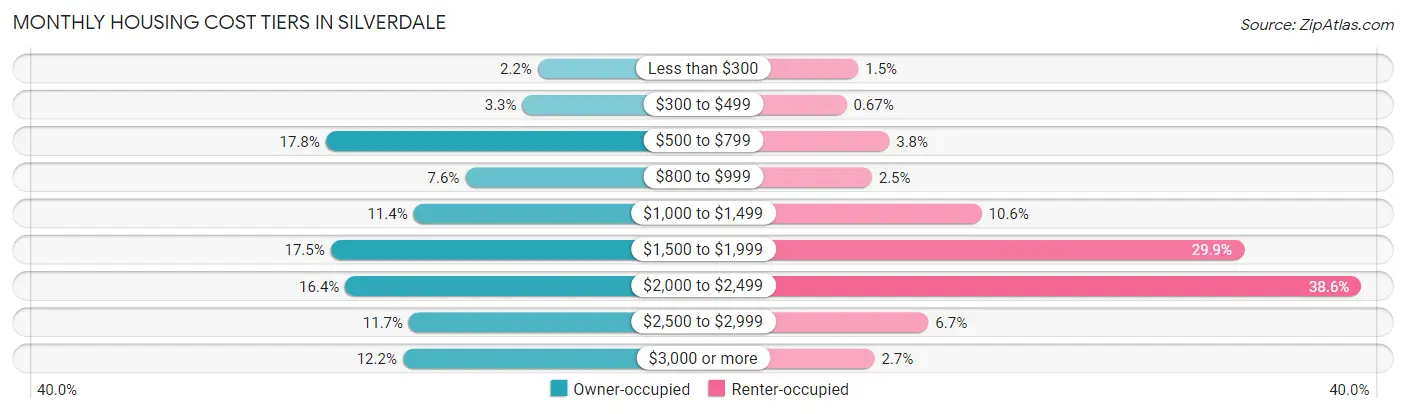
| Monthly Cost | Owner-occupied | Renter-occupied |
| Less than $300 | 98 (2.2%) | 62 (1.5%) |
| $300 to $499 | 148 (3.3%) | 27 (0.7%) |
| $500 to $799 | 791 (17.8%) | 154 (3.8%) |
| $800 to $999 | 335 (7.5%) | 102 (2.5%) |
| $1,000 to $1,499 | 504 (11.4%) | 428 (10.6%) |
| $1,500 to $1,999 | 775 (17.5%) | 1,206 (29.9%) |
| $2,000 to $2,499 | 727 (16.4%) | 1,554 (38.6%) |
| $2,500 to $2,999 | 519 (11.7%) | 270 (6.7%) |
| $3,000 or more | 539 (12.1%) | 110 (2.7%) |
| Total | 4,436 (100.0%) | 4,029 (100.0%) |
Physical Housing Characteristics in Silverdale
Housing Structures in Silverdale
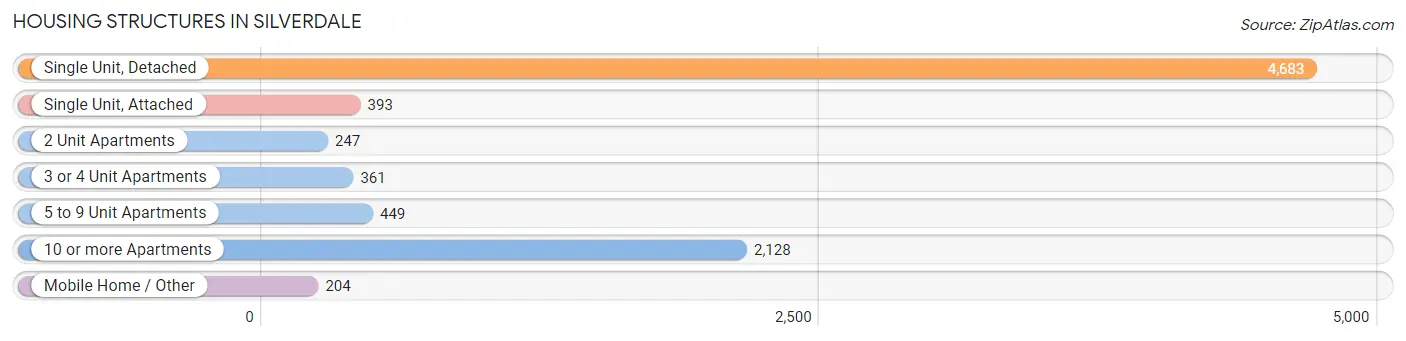
| Structure Type | # Housing Units | % Housing Units |
| Single Unit, Detached | 4,683 | 55.3% |
| Single Unit, Attached | 393 | 4.6% |
| 2 Unit Apartments | 247 | 2.9% |
| 3 or 4 Unit Apartments | 361 | 4.3% |
| 5 to 9 Unit Apartments | 449 | 5.3% |
| 10 or more Apartments | 2,128 | 25.1% |
| Mobile Home / Other | 204 | 2.4% |
| Total | 8,465 | 100.0% |
Housing Structures by Occupancy in Silverdale
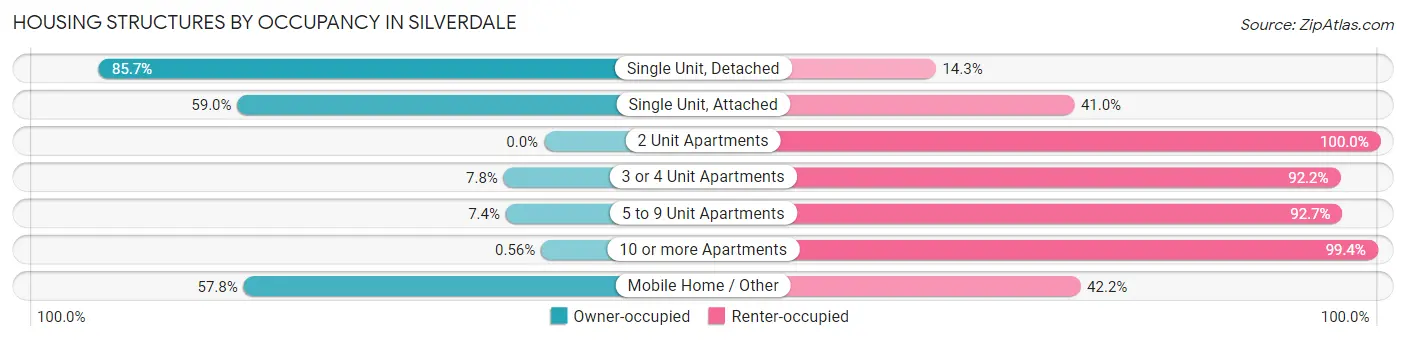
| Structure Type | Owner-occupied | Renter-occupied |
| Single Unit, Detached | 4,013 (85.7%) | 670 (14.3%) |
| Single Unit, Attached | 232 (59.0%) | 161 (41.0%) |
| 2 Unit Apartments | 0 (0.0%) | 247 (100.0%) |
| 3 or 4 Unit Apartments | 28 (7.8%) | 333 (92.2%) |
| 5 to 9 Unit Apartments | 33 (7.3%) | 416 (92.6%) |
| 10 or more Apartments | 12 (0.6%) | 2,116 (99.4%) |
| Mobile Home / Other | 118 (57.8%) | 86 (42.2%) |
| Total | 4,436 (52.4%) | 4,029 (47.6%) |
Housing Structures by Number of Rooms in Silverdale
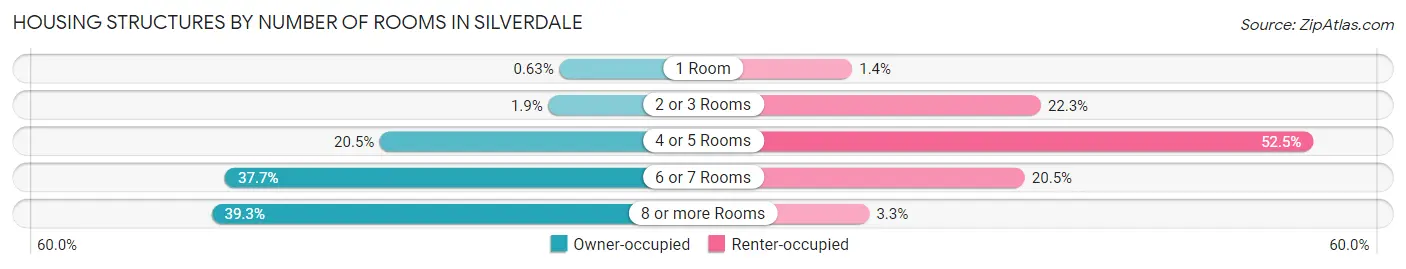
| Number of Rooms | Owner-occupied | Renter-occupied |
| 1 Room | 28 (0.6%) | 55 (1.4%) |
| 2 or 3 Rooms | 82 (1.8%) | 899 (22.3%) |
| 4 or 5 Rooms | 911 (20.5%) | 2,116 (52.5%) |
| 6 or 7 Rooms | 1,674 (37.7%) | 827 (20.5%) |
| 8 or more Rooms | 1,741 (39.3%) | 132 (3.3%) |
| Total | 4,436 (100.0%) | 4,029 (100.0%) |
Housing Structure by Heating Type in Silverdale
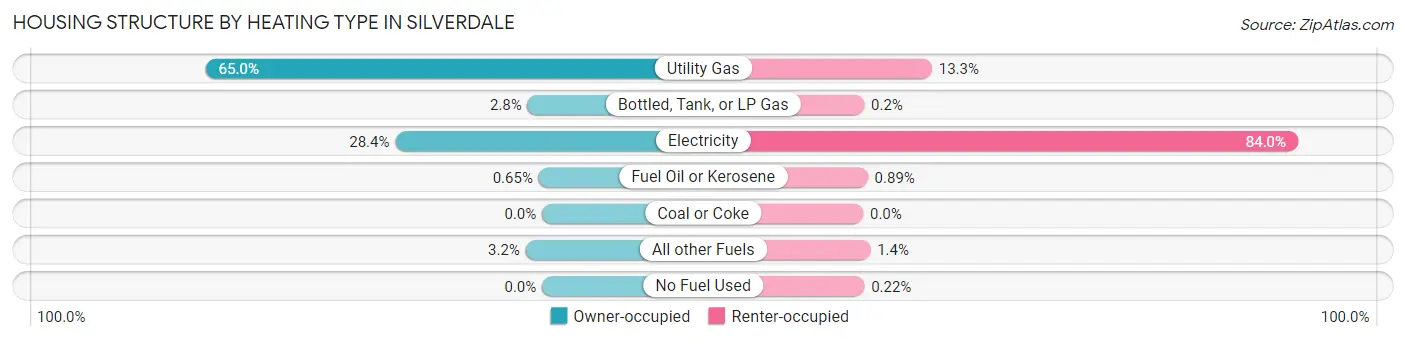
| Heating Type | Owner-occupied | Renter-occupied |
| Utility Gas | 2,884 (65.0%) | 535 (13.3%) |
| Bottled, Tank, or LP Gas | 124 (2.8%) | 8 (0.2%) |
| Electricity | 1,258 (28.4%) | 3,385 (84.0%) |
| Fuel Oil or Kerosene | 29 (0.6%) | 36 (0.9%) |
| Coal or Coke | 0 (0.0%) | 0 (0.0%) |
| All other Fuels | 141 (3.2%) | 56 (1.4%) |
| No Fuel Used | 0 (0.0%) | 9 (0.2%) |
| Total | 4,436 (100.0%) | 4,029 (100.0%) |
Household Vehicle Usage in Silverdale
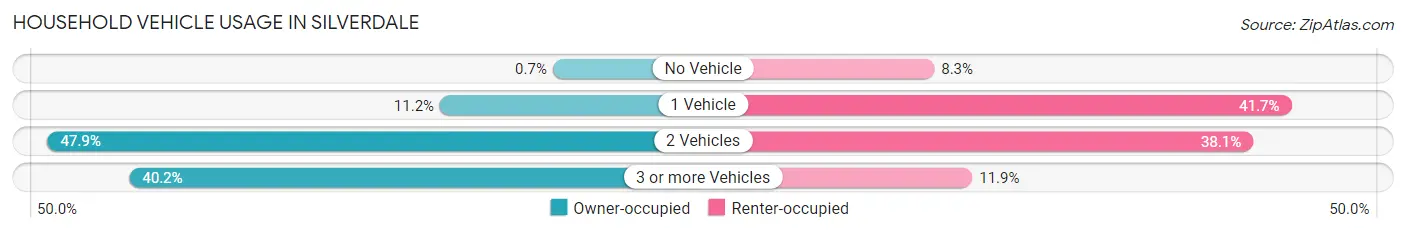
| Vehicles per Household | Owner-occupied | Renter-occupied |
| No Vehicle | 31 (0.7%) | 336 (8.3%) |
| 1 Vehicle | 498 (11.2%) | 1,679 (41.7%) |
| 2 Vehicles | 2,123 (47.9%) | 1,535 (38.1%) |
| 3 or more Vehicles | 1,784 (40.2%) | 479 (11.9%) |
| Total | 4,436 (100.0%) | 4,029 (100.0%) |
Real Estate & Mortgages in Silverdale
Real Estate and Mortgage Overview in Silverdale
| Characteristic | Without Mortgage | With Mortgage |
| Housing Units | 1,380 | 3,056 |
| Median Property Value | $438,700 | $467,400 |
| Median Household Income | $113,591 | $1,128 |
| Monthly Housing Costs | $704 | $539 |
| Real Estate Taxes | $4,265 | $54 |
Property Value by Mortgage Status in Silverdale
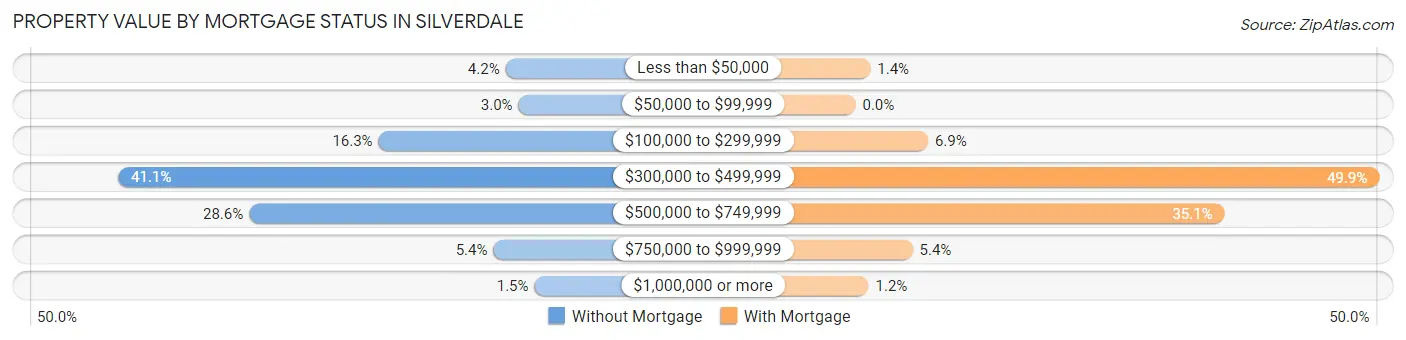
| Property Value | Without Mortgage | With Mortgage |
| Less than $50,000 | 58 (4.2%) | 43 (1.4%) |
| $50,000 to $99,999 | 41 (3.0%) | 0 (0.0%) |
| $100,000 to $299,999 | 225 (16.3%) | 211 (6.9%) |
| $300,000 to $499,999 | 567 (41.1%) | 1,524 (49.9%) |
| $500,000 to $749,999 | 395 (28.6%) | 1,074 (35.1%) |
| $750,000 to $999,999 | 74 (5.4%) | 166 (5.4%) |
| $1,000,000 or more | 20 (1.5%) | 38 (1.2%) |
| Total | 1,380 (100.0%) | 3,056 (100.0%) |
Household Income by Mortgage Status in Silverdale
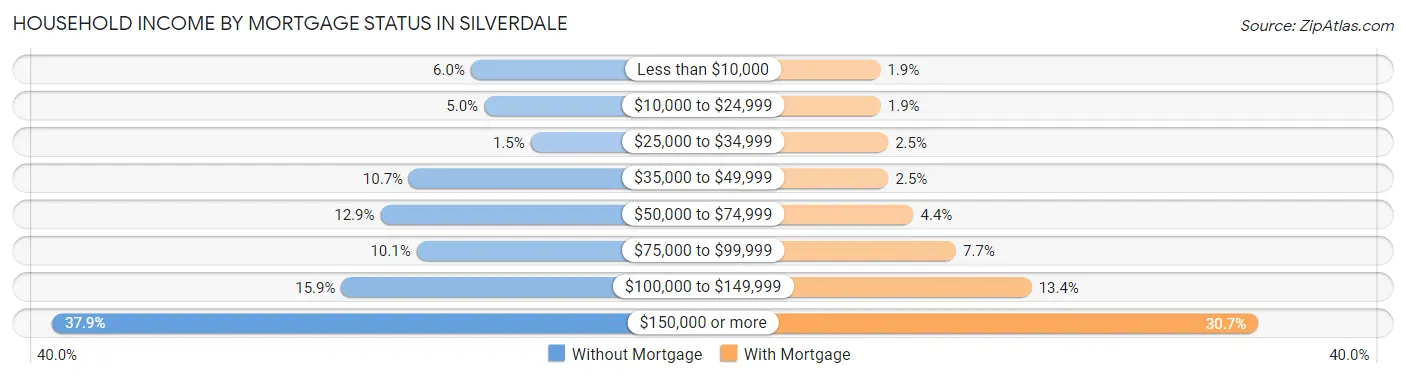
| Household Income | Without Mortgage | With Mortgage |
| Less than $10,000 | 83 (6.0%) | 58 (1.9%) |
| $10,000 to $24,999 | 69 (5.0%) | 59 (1.9%) |
| $25,000 to $34,999 | 20 (1.5%) | 76 (2.5%) |
| $35,000 to $49,999 | 148 (10.7%) | 77 (2.5%) |
| $50,000 to $74,999 | 178 (12.9%) | 135 (4.4%) |
| $75,000 to $99,999 | 140 (10.1%) | 234 (7.7%) |
| $100,000 to $149,999 | 219 (15.9%) | 410 (13.4%) |
| $150,000 or more | 523 (37.9%) | 937 (30.7%) |
| Total | 1,380 (100.0%) | 3,056 (100.0%) |
Property Value to Household Income Ratio in Silverdale
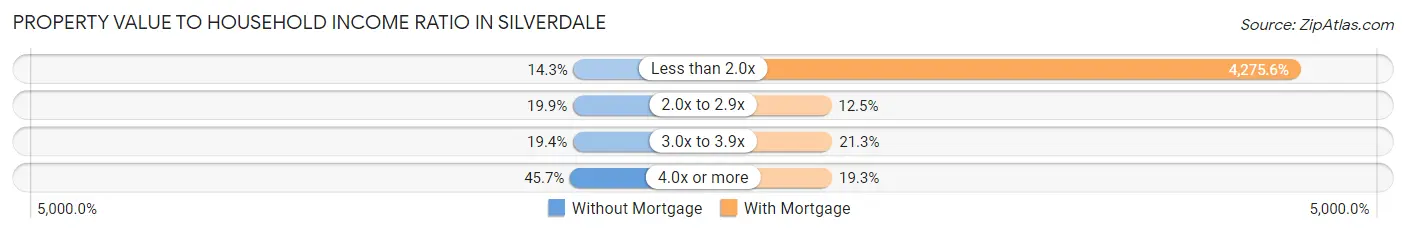
| Value-to-Income Ratio | Without Mortgage | With Mortgage |
| Less than 2.0x | 197 (14.3%) | 130,661 (4,275.6%) |
| 2.0x to 2.9x | 275 (19.9%) | 382 (12.5%) |
| 3.0x to 3.9x | 268 (19.4%) | 652 (21.3%) |
| 4.0x or more | 630 (45.7%) | 591 (19.3%) |
| Total | 1,380 (100.0%) | 3,056 (100.0%) |
Real Estate Taxes by Mortgage Status in Silverdale
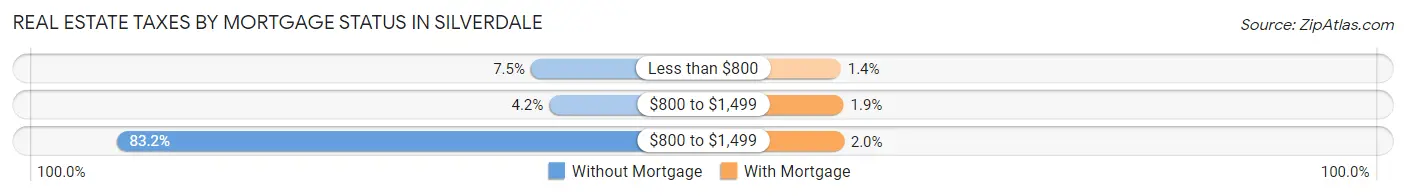
| Property Taxes | Without Mortgage | With Mortgage |
| Less than $800 | 104 (7.5%) | 43 (1.4%) |
| $800 to $1,499 | 58 (4.2%) | 59 (1.9%) |
| $800 to $1,499 | 1,148 (83.2%) | 60 (2.0%) |
| Total | 1,380 (100.0%) | 3,056 (100.0%) |
Health & Disability in Silverdale
Health Insurance Coverage by Age in Silverdale
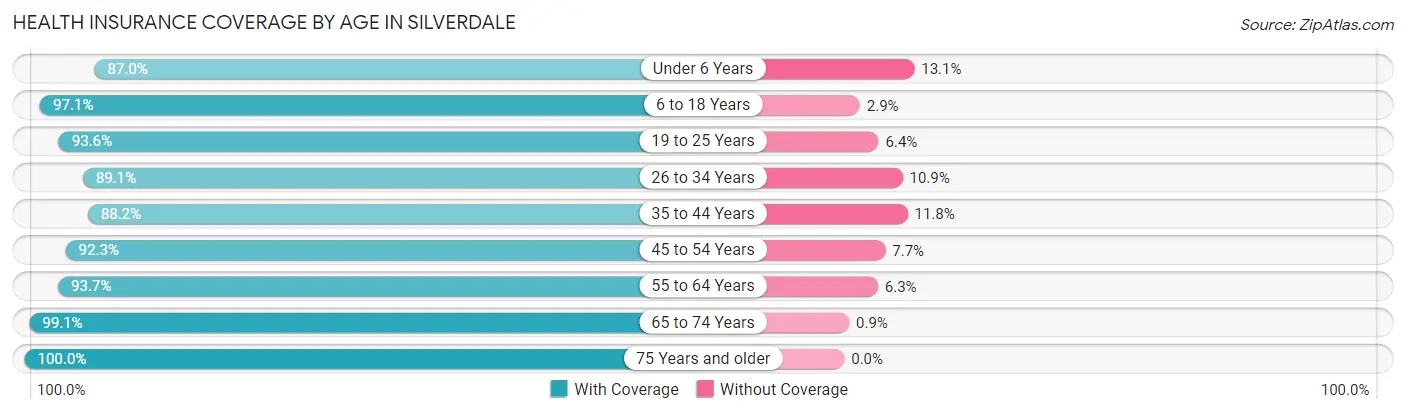
| Age Bracket | With Coverage | Without Coverage |
| Under 6 Years | 1,306 (87.0%) | 196 (13.1%) |
| 6 to 18 Years | 3,148 (97.1%) | 94 (2.9%) |
| 19 to 25 Years | 1,743 (93.6%) | 119 (6.4%) |
| 26 to 34 Years | 2,102 (89.1%) | 256 (10.9%) |
| 35 to 44 Years | 2,049 (88.2%) | 274 (11.8%) |
| 45 to 54 Years | 2,327 (92.3%) | 193 (7.7%) |
| 55 to 64 Years | 2,140 (93.7%) | 143 (6.3%) |
| 65 to 74 Years | 2,318 (99.1%) | 21 (0.9%) |
| 75 Years and older | 1,546 (100.0%) | 0 (0.0%) |
| Total | 18,679 (93.5%) | 1,296 (6.5%) |
Health Insurance Coverage by Citizenship Status in Silverdale
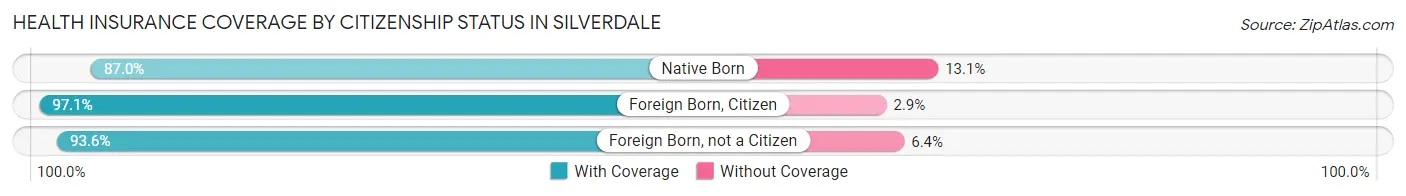
| Citizenship Status | With Coverage | Without Coverage |
| Native Born | 1,306 (87.0%) | 196 (13.1%) |
| Foreign Born, Citizen | 3,148 (97.1%) | 94 (2.9%) |
| Foreign Born, not a Citizen | 1,743 (93.6%) | 119 (6.4%) |
Health Insurance Coverage by Household Income in Silverdale
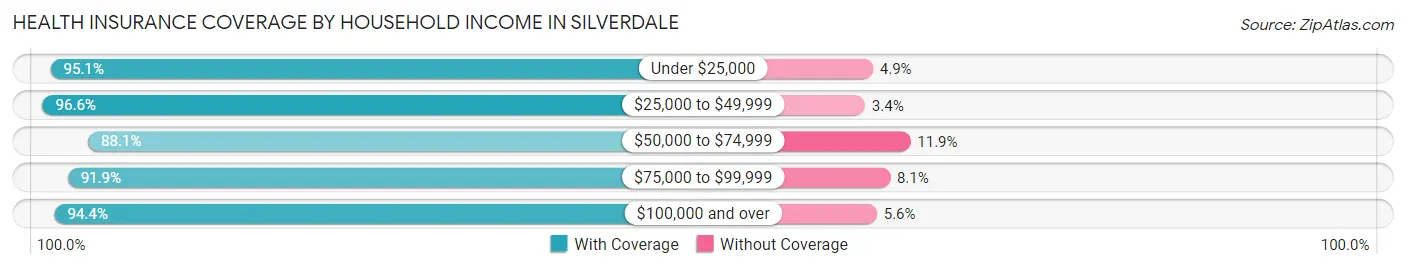
| Household Income | With Coverage | Without Coverage |
| Under $25,000 | 1,229 (95.1%) | 63 (4.9%) |
| $25,000 to $49,999 | 1,651 (96.6%) | 58 (3.4%) |
| $50,000 to $74,999 | 2,175 (88.1%) | 294 (11.9%) |
| $75,000 to $99,999 | 2,659 (91.9%) | 234 (8.1%) |
| $100,000 and over | 10,804 (94.4%) | 643 (5.6%) |
Public vs Private Health Insurance Coverage by Age in Silverdale
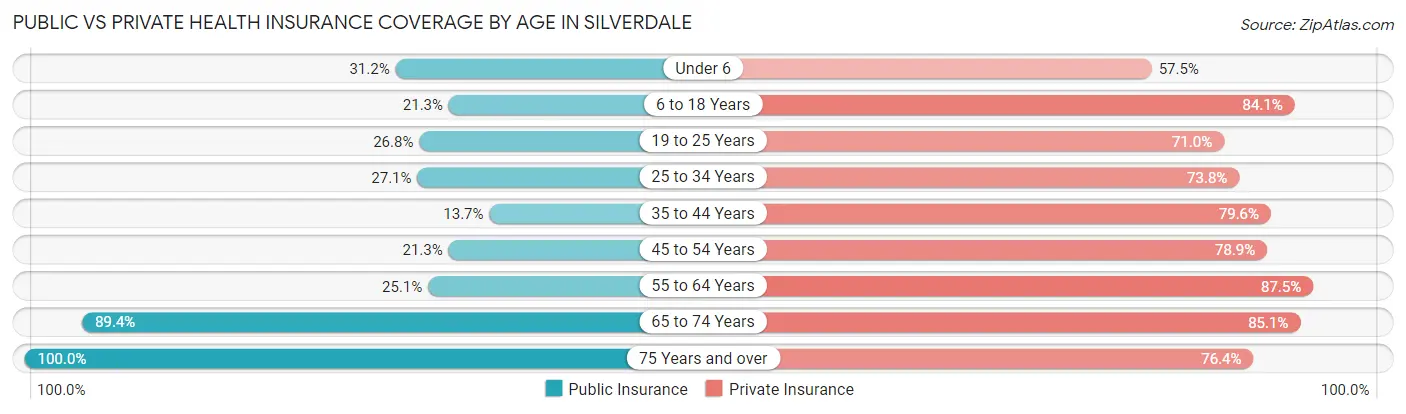
| Age Bracket | Public Insurance | Private Insurance |
| Under 6 | 468 (31.2%) | 864 (57.5%) |
| 6 to 18 Years | 689 (21.2%) | 2,725 (84.1%) |
| 19 to 25 Years | 498 (26.8%) | 1,321 (71.0%) |
| 25 to 34 Years | 639 (27.1%) | 1,739 (73.8%) |
| 35 to 44 Years | 319 (13.7%) | 1,850 (79.6%) |
| 45 to 54 Years | 537 (21.3%) | 1,989 (78.9%) |
| 55 to 64 Years | 573 (25.1%) | 1,997 (87.5%) |
| 65 to 74 Years | 2,090 (89.3%) | 1,990 (85.1%) |
| 75 Years and over | 1,546 (100.0%) | 1,181 (76.4%) |
| Total | 7,359 (36.8%) | 15,656 (78.4%) |
Disability Status by Sex by Age in Silverdale
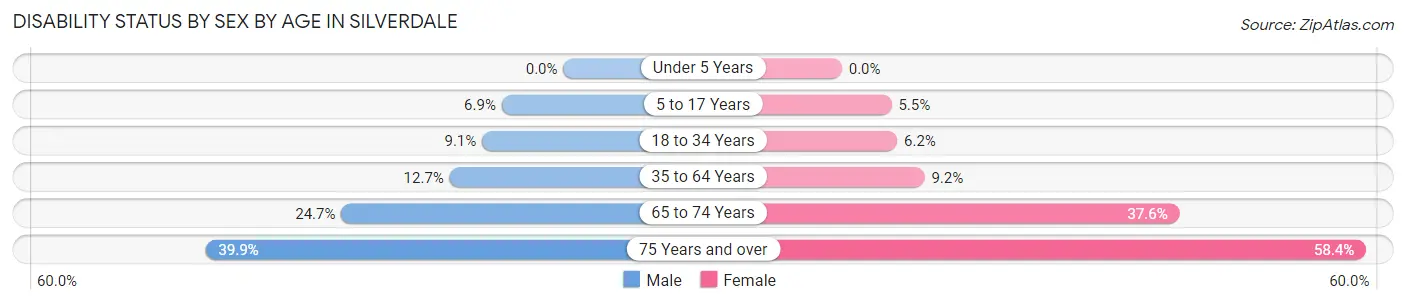
| Age Bracket | Male | Female |
| Under 5 Years | 0 (0.0%) | 0 (0.0%) |
| 5 to 17 Years | 117 (6.9%) | 87 (5.5%) |
| 18 to 34 Years | 183 (9.0%) | 149 (6.2%) |
| 35 to 64 Years | 451 (12.7%) | 328 (9.2%) |
| 65 to 74 Years | 251 (24.7%) | 498 (37.6%) |
| 75 Years and over | 236 (39.9%) | 557 (58.4%) |
Disability Class by Sex by Age in Silverdale
Disability Class: Hearing Difficulty
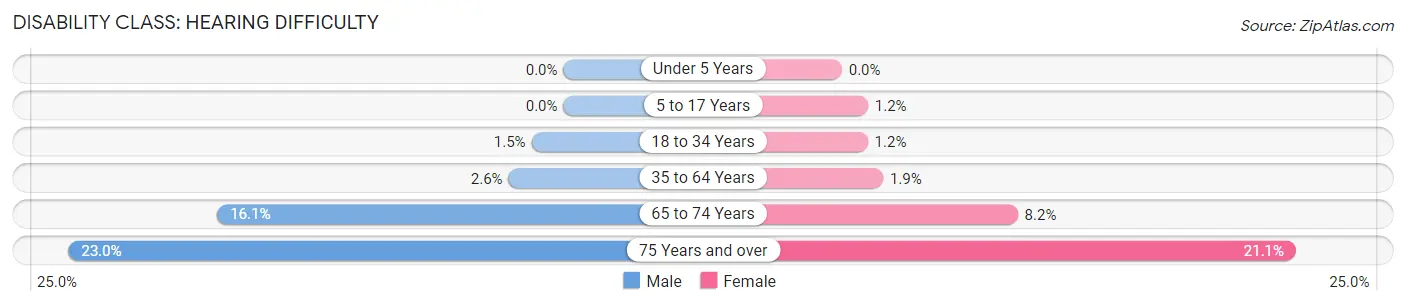
| Age Bracket | Male | Female |
| Under 5 Years | 0 (0.0%) | 0 (0.0%) |
| 5 to 17 Years | 0 (0.0%) | 19 (1.2%) |
| 18 to 34 Years | 30 (1.5%) | 29 (1.2%) |
| 35 to 64 Years | 91 (2.5%) | 68 (1.9%) |
| 65 to 74 Years | 163 (16.1%) | 108 (8.2%) |
| 75 Years and over | 136 (23.0%) | 201 (21.1%) |
Disability Class: Vision Difficulty
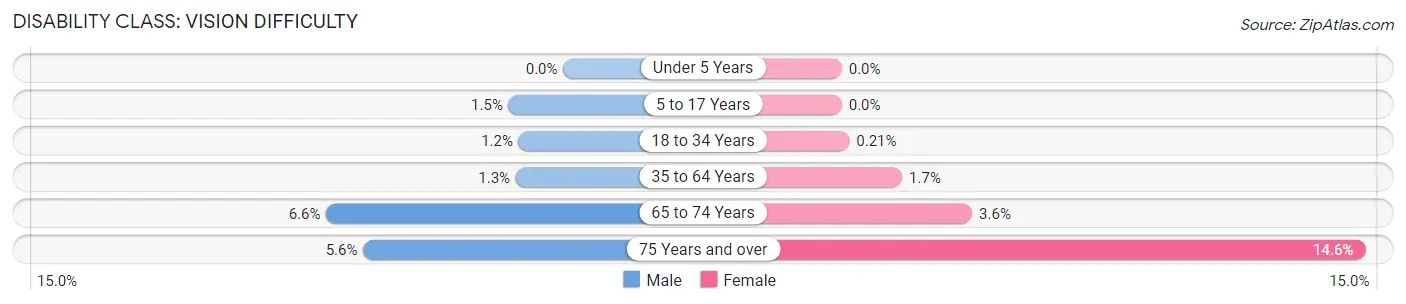
| Age Bracket | Male | Female |
| Under 5 Years | 0 (0.0%) | 0 (0.0%) |
| 5 to 17 Years | 26 (1.5%) | 0 (0.0%) |
| 18 to 34 Years | 25 (1.2%) | 5 (0.2%) |
| 35 to 64 Years | 47 (1.3%) | 60 (1.7%) |
| 65 to 74 Years | 67 (6.6%) | 48 (3.6%) |
| 75 Years and over | 33 (5.6%) | 139 (14.6%) |
Disability Class: Cognitive Difficulty
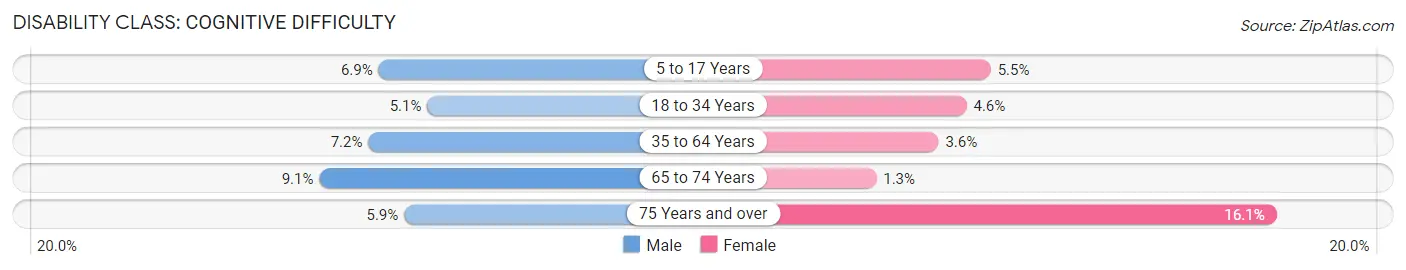
| Age Bracket | Male | Female |
| 5 to 17 Years | 117 (6.9%) | 87 (5.5%) |
| 18 to 34 Years | 102 (5.1%) | 112 (4.6%) |
| 35 to 64 Years | 258 (7.2%) | 128 (3.6%) |
| 65 to 74 Years | 92 (9.1%) | 17 (1.3%) |
| 75 Years and over | 35 (5.9%) | 154 (16.1%) |
Disability Class: Ambulatory Difficulty
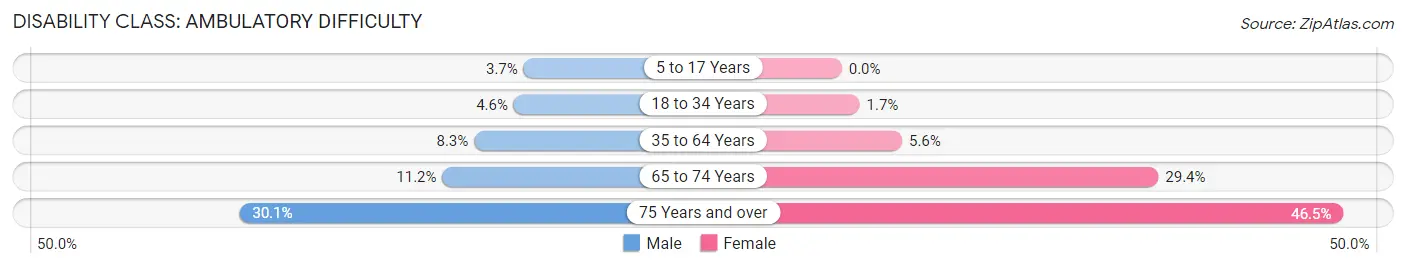
| Age Bracket | Male | Female |
| 5 to 17 Years | 63 (3.7%) | 0 (0.0%) |
| 18 to 34 Years | 93 (4.6%) | 40 (1.7%) |
| 35 to 64 Years | 295 (8.3%) | 199 (5.6%) |
| 65 to 74 Years | 114 (11.2%) | 389 (29.4%) |
| 75 Years and over | 178 (30.1%) | 444 (46.5%) |
Disability Class: Self-Care Difficulty
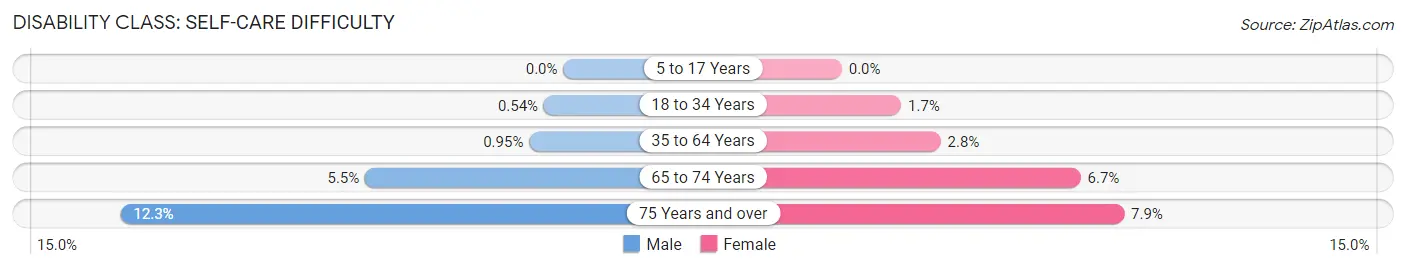
| Age Bracket | Male | Female |
| 5 to 17 Years | 0 (0.0%) | 0 (0.0%) |
| 18 to 34 Years | 11 (0.5%) | 40 (1.7%) |
| 35 to 64 Years | 34 (0.9%) | 98 (2.8%) |
| 65 to 74 Years | 56 (5.5%) | 88 (6.7%) |
| 75 Years and over | 73 (12.3%) | 75 (7.9%) |
Technology Access in Silverdale
Computing Device Access in Silverdale
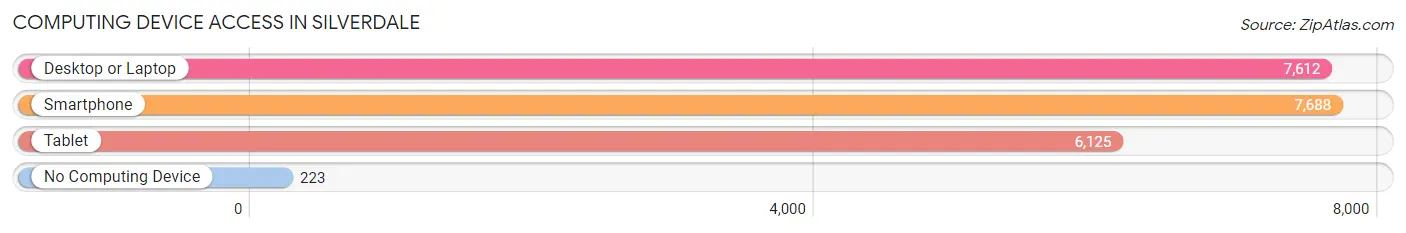
| Device Type | # Households | % Households |
| Desktop or Laptop | 7,612 | 89.9% |
| Smartphone | 7,688 | 90.8% |
| Tablet | 6,125 | 72.4% |
| No Computing Device | 223 | 2.6% |
| Total | 8,465 | 100.0% |
Internet Access in Silverdale
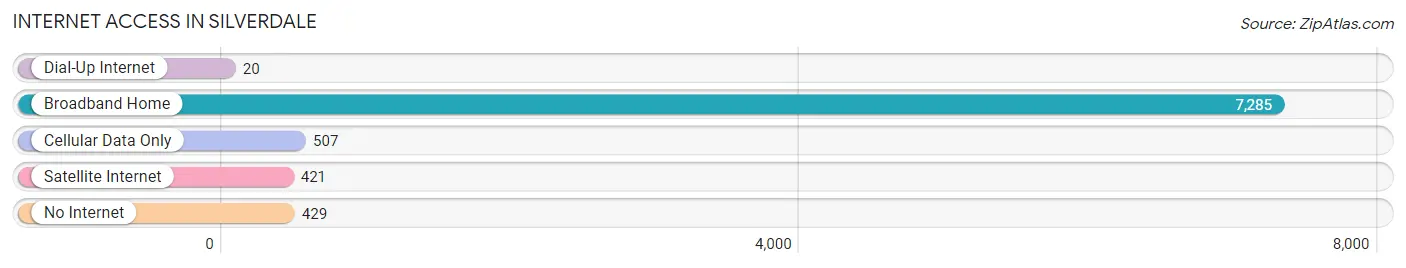
| Internet Type | # Households | % Households |
| Dial-Up Internet | 20 | 0.2% |
| Broadband Home | 7,285 | 86.1% |
| Cellular Data Only | 507 | 6.0% |
| Satellite Internet | 421 | 5.0% |
| No Internet | 429 | 5.1% |
| Total | 8,465 | 100.0% |
Silverdale Summary
History
Silverdale, Washington is a small town located in Kitsap County, Washington, United States. It is situated on the Kitsap Peninsula, across the Puget Sound from Seattle. The town was first settled in the late 1800s by homesteaders, and was officially incorporated in 1951.
The area was originally inhabited by the Suquamish Tribe, who had lived in the area for thousands of years. The first European settlers arrived in the area in the late 1800s, and the town was officially incorporated in 1951.
The town was named after a local settler, William Silverdale, who had a homestead in the area. The town grew slowly over the years, and by the 1970s, it had become a popular destination for tourists and retirees.
Geography
Silverdale is located in Kitsap County, Washington, United States. It is situated on the Kitsap Peninsula, across the Puget Sound from Seattle. The town is located on the Kitsap Peninsula, which is bordered by the Hood Canal to the west and the Puget Sound to the east. The town is located at the northern end of the Kitsap Peninsula, and is approximately 25 miles northwest of Seattle.
The town is located in a temperate climate, with mild winters and warm summers. The average annual temperature is around 50 degrees Fahrenheit. The town receives an average of 37 inches of precipitation per year, with most of it falling in the winter months.
Economy
Silverdale’s economy is largely based on tourism and retail. The town is home to several large retail stores, including Walmart, Target, and Kohl’s. The town also has several restaurants, bars, and cafes.
The town is also home to several large employers, including the Naval Undersea Warfare Center, the Puget Sound Naval Shipyard, and the Naval Base Kitsap. These employers provide jobs for many of the town’s residents.
Demographics
As of the 2010 census, the population of Silverdale was 10,259. The racial makeup of the town was 87.3% White, 4.2% Hispanic or Latino, 2.2% Asian, 1.7% African American, and 0.7% Native American.
The median household income in Silverdale was $60,945, and the median family income was $71,945. The per capita income was $27,945. The town’s poverty rate was 8.3%.
Conclusion
Silverdale, Washington is a small town located in Kitsap County, Washington, United States. It is situated on the Kitsap Peninsula, across the Puget Sound from Seattle. The town was first settled in the late 1800s by homesteaders, and was officially incorporated in 1951. The town’s economy is largely based on tourism and retail, and it is home to several large employers, including the Naval Undersea Warfare Center, the Puget Sound Naval Shipyard, and the Naval Base Kitsap. As of the 2010 census, the population of Silverdale was 10,259, with a median household income of $60,945 and a median family income of $71,945.
Common Questions
What is Per Capita Income in Silverdale?
Per Capita income in Silverdale is $45,400.
What is the Median Family Income in Silverdale?
Median Family Income in Silverdale is $120,512.
What is the Median Household income in Silverdale?
Median Household Income in Silverdale is $96,564.
What is Income or Wage Gap in Silverdale?
Income or Wage Gap in Silverdale is 34.0%.
Women in Silverdale earn 66.0 cents for every dollar earned by a man.
What is Inequality or Gini Index in Silverdale?
Inequality or Gini Index in Silverdale is 0.40.
What is the Total Population of Silverdale?
Total Population of Silverdale is 21,774.
What is the Total Male Population of Silverdale?
Total Male Population of Silverdale is 10,869.
What is the Total Female Population of Silverdale?
Total Female Population of Silverdale is 10,905.
What is the Ratio of Males per 100 Females in Silverdale?
There are 99.67 Males per 100 Females in Silverdale.
What is the Ratio of Females per 100 Males in Silverdale?
There are 100.33 Females per 100 Males in Silverdale.
What is the Median Population Age in Silverdale?
Median Population Age in Silverdale is 37.7 Years.
What is the Average Family Size in Silverdale
Average Family Size in Silverdale is 3.0 People.
What is the Average Household Size in Silverdale
Average Household Size in Silverdale is 2.5 People.
How Large is the Labor Force in Silverdale?
There are 11,376 People in the Labor Forcein in Silverdale.
What is the Percentage of People in the Labor Force in Silverdale?
64.1% of People are in the Labor Force in Silverdale.
What is the Unemployment Rate in Silverdale?
Unemployment Rate in Silverdale is 5.1%.