Salmon Creek, WA Map & Demographics
Salmon Creek Map
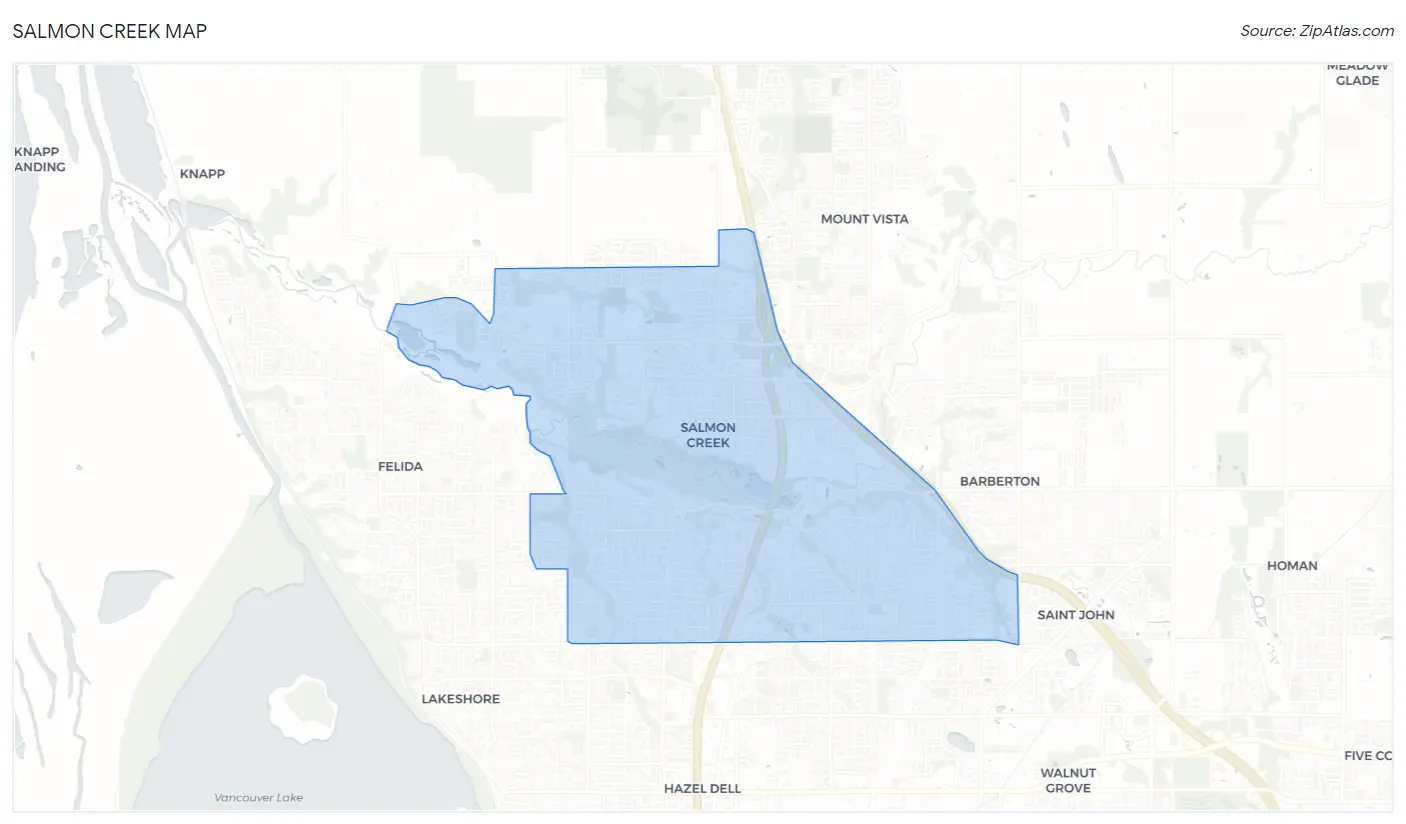
Salmon Creek Overview
$44,912
PER CAPITA INCOME
$111,088
AVG FAMILY INCOME
$93,015
AVG HOUSEHOLD INCOME
35.4%
WAGE / INCOME GAP [ % ]
64.6¢/ $1
WAGE / INCOME GAP [ $ ]
0.41
INEQUALITY / GINI INDEX
20,312
TOTAL POPULATION
9,994
MALE POPULATION
10,318
FEMALE POPULATION
96.86
MALES / 100 FEMALES
103.24
FEMALES / 100 MALES
44.1
MEDIAN AGE
2.9
AVG FAMILY SIZE
2.5
AVG HOUSEHOLD SIZE
9,827
LABOR FORCE [ PEOPLE ]
59.1%
PERCENT IN LABOR FORCE
2.9%
UNEMPLOYMENT RATE
Income in Salmon Creek
Income Overview in Salmon Creek
Per Capita Income in Salmon Creek is $44,912, while median incomes of families and households are $111,088 and $93,015 respectively.
| Characteristic | Number | Measure |
| Per Capita Income | 20,312 | $44,912 |
| Median Family Income | 5,572 | $111,088 |
| Mean Family Income | 5,572 | $127,509 |
| Median Household Income | 7,970 | $93,015 |
| Mean Household Income | 7,970 | $113,369 |
| Income Deficit | 5,572 | $0 |
| Wage / Income Gap (%) | 20,312 | 35.37% |
| Wage / Income Gap ($) | 20,312 | 64.63¢ per $1 |
| Gini / Inequality Index | 20,312 | 0.41 |
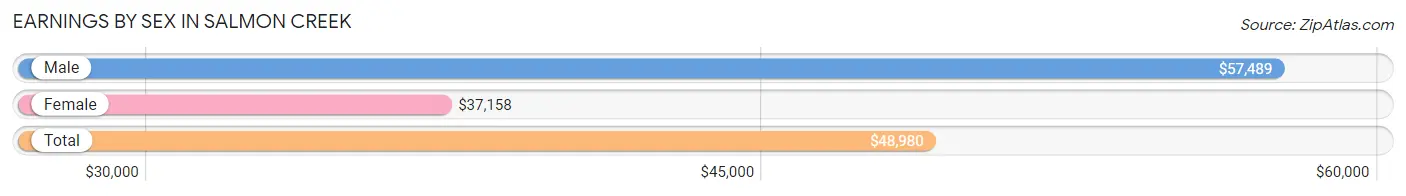
Earnings by Sex in Salmon Creek
Average Earnings in Salmon Creek are $48,980, $57,489 for men and $37,158 for women, a difference of 35.4%.
| Sex | Number | Average Earnings |
| Male | 5,705 (54.4%) | $57,489 |
| Female | 4,788 (45.6%) | $37,158 |
| Total | 10,493 (100.0%) | $48,980 |
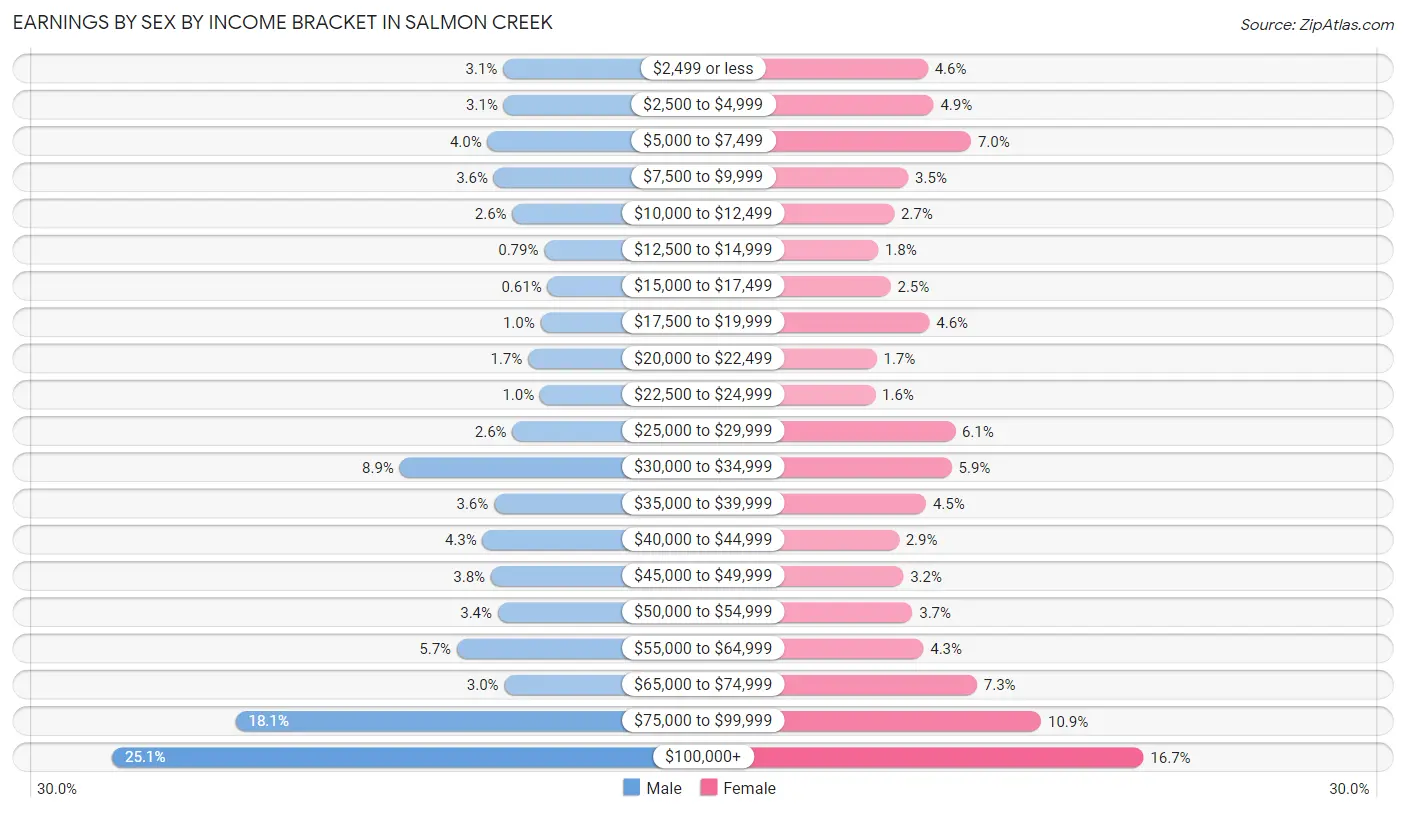
Earnings by Sex by Income Bracket in Salmon Creek
The most common earnings brackets in Salmon Creek are $100,000+ for men (1,431 | 25.1%) and $100,000+ for women (798 | 16.7%).
| Income | Male | Female |
| $2,499 or less | 177 (3.1%) | 218 (4.5%) |
| $2,500 to $4,999 | 175 (3.1%) | 233 (4.9%) |
| $5,000 to $7,499 | 227 (4.0%) | 334 (7.0%) |
| $7,500 to $9,999 | 207 (3.6%) | 165 (3.5%) |
| $10,000 to $12,499 | 147 (2.6%) | 127 (2.6%) |
| $12,500 to $14,999 | 45 (0.8%) | 84 (1.8%) |
| $15,000 to $17,499 | 35 (0.6%) | 118 (2.5%) |
| $17,500 to $19,999 | 57 (1.0%) | 222 (4.6%) |
| $20,000 to $22,499 | 97 (1.7%) | 80 (1.7%) |
| $22,500 to $24,999 | 59 (1.0%) | 76 (1.6%) |
| $25,000 to $29,999 | 147 (2.6%) | 291 (6.1%) |
| $30,000 to $34,999 | 509 (8.9%) | 282 (5.9%) |
| $35,000 to $39,999 | 206 (3.6%) | 213 (4.4%) |
| $40,000 to $44,999 | 243 (4.3%) | 140 (2.9%) |
| $45,000 to $49,999 | 216 (3.8%) | 152 (3.2%) |
| $50,000 to $54,999 | 194 (3.4%) | 176 (3.7%) |
| $55,000 to $64,999 | 325 (5.7%) | 206 (4.3%) |
| $65,000 to $74,999 | 173 (3.0%) | 350 (7.3%) |
| $75,000 to $99,999 | 1,035 (18.1%) | 523 (10.9%) |
| $100,000+ | 1,431 (25.1%) | 798 (16.7%) |
| Total | 5,705 (100.0%) | 4,788 (100.0%) |
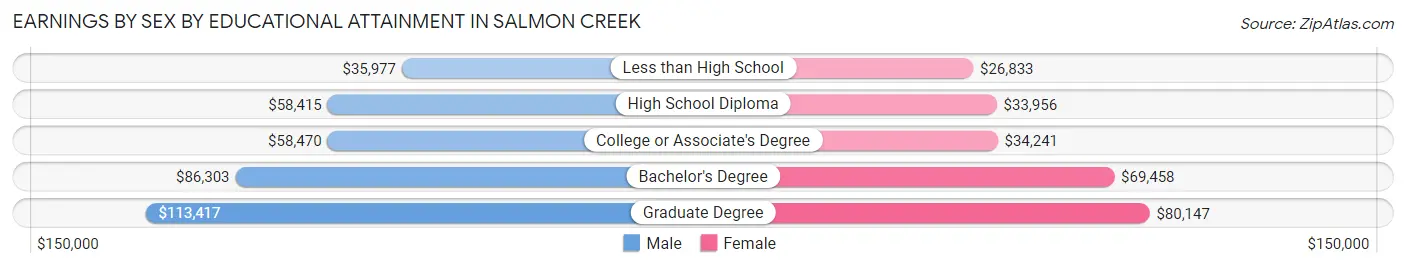
Earnings by Sex by Educational Attainment in Salmon Creek
Average earnings in Salmon Creek are $75,174 for men and $47,188 for women, a difference of 37.2%. Men with an educational attainment of graduate degree enjoy the highest average annual earnings of $113,417, while those with less than high school education earn the least with $35,977. Women with an educational attainment of graduate degree earn the most with the average annual earnings of $80,147, while those with less than high school education have the smallest earnings of $26,833.
| Educational Attainment | Male Income | Female Income |
| Less than High School | $35,977 | $26,833 |
| High School Diploma | $58,415 | $33,956 |
| College or Associate's Degree | $58,470 | $34,241 |
| Bachelor's Degree | $86,303 | $69,458 |
| Graduate Degree | $113,417 | $80,147 |
| Total | $75,174 | $47,188 |
Family Income in Salmon Creek
Family Income Brackets in Salmon Creek
According to the Salmon Creek family income data, there are 1,393 families falling into the $100,000 to $149,999 income range, which is the most common income bracket and makes up 25.0% of all families.
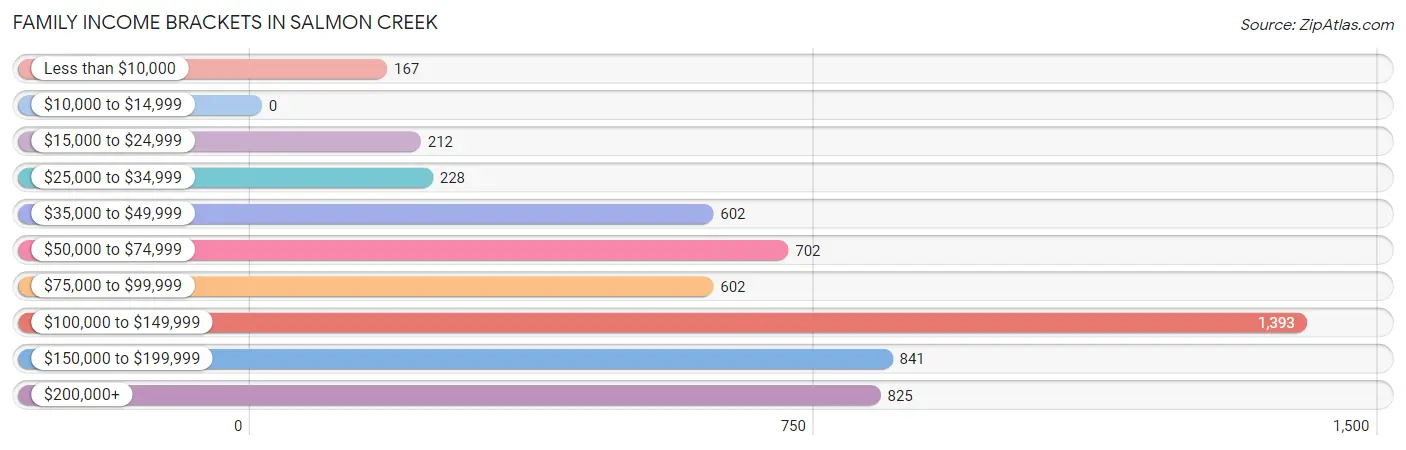
| Income Bracket | # Families | % Families |
| Less than $10,000 | 167 | 3.0% |
| $10,000 to $14,999 | 0 | 0.0% |
| $15,000 to $24,999 | 212 | 3.8% |
| $25,000 to $34,999 | 228 | 4.1% |
| $35,000 to $49,999 | 602 | 10.8% |
| $50,000 to $74,999 | 702 | 12.6% |
| $75,000 to $99,999 | 602 | 10.8% |
| $100,000 to $149,999 | 1,393 | 25.0% |
| $150,000 to $199,999 | 841 | 15.1% |
| $200,000+ | 825 | 14.8% |
Family Income by Famaliy Size in Salmon Creek
5-person families (355 | 6.4%) account for the highest median family income in Salmon Creek with $145,545 per family, while 2-person families (2,865 | 51.4%) have the highest median income of $45,914 per family member.
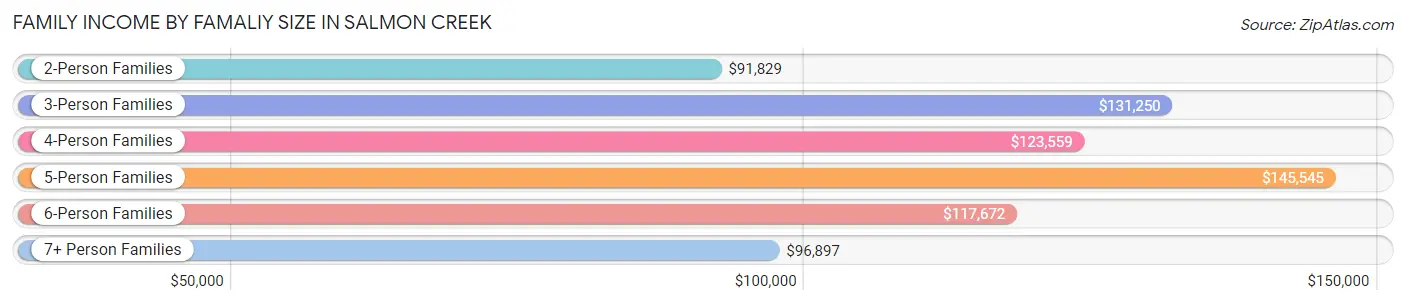
| Income Bracket | # Families | Median Income |
| 2-Person Families | 2,865 (51.4%) | $91,829 |
| 3-Person Families | 1,122 (20.1%) | $131,250 |
| 4-Person Families | 1,082 (19.4%) | $123,559 |
| 5-Person Families | 355 (6.4%) | $145,545 |
| 6-Person Families | 74 (1.3%) | $117,672 |
| 7+ Person Families | 74 (1.3%) | $96,897 |
| Total | 5,572 (100.0%) | $111,088 |
Family Income by Number of Earners in Salmon Creek
The median family income in Salmon Creek is $111,088, with families comprising 3+ earners (557) having the highest median family income of $160,250, while families with no earners (978) have the lowest median family income of $60,526, accounting for 10.0% and 17.5% of families, respectively.
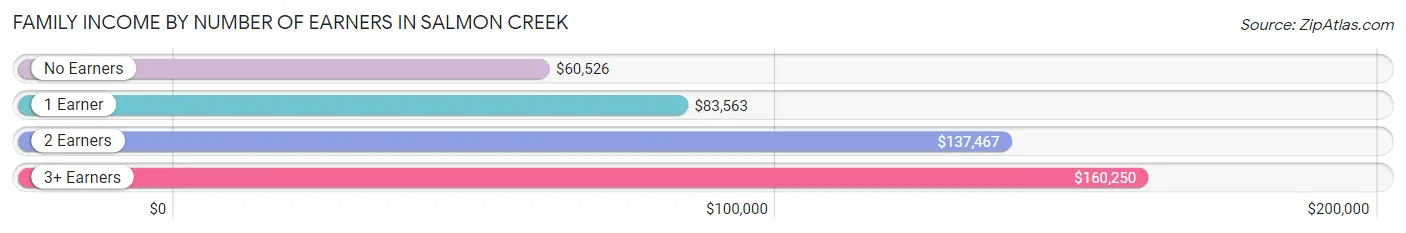
| Number of Earners | # Families | Median Income |
| No Earners | 978 (17.5%) | $60,526 |
| 1 Earner | 1,926 (34.6%) | $83,563 |
| 2 Earners | 2,111 (37.9%) | $137,467 |
| 3+ Earners | 557 (10.0%) | $160,250 |
| Total | 5,572 (100.0%) | $111,088 |
Household Income in Salmon Creek
Household Income Brackets in Salmon Creek
With 1,722 households falling in the category, the $100,000 to $149,999 income range is the most frequent in Salmon Creek, accounting for 21.6% of all households. In contrast, only 112 households (1.4%) fall into the $10,000 to $14,999 income bracket, making it the least populous group.
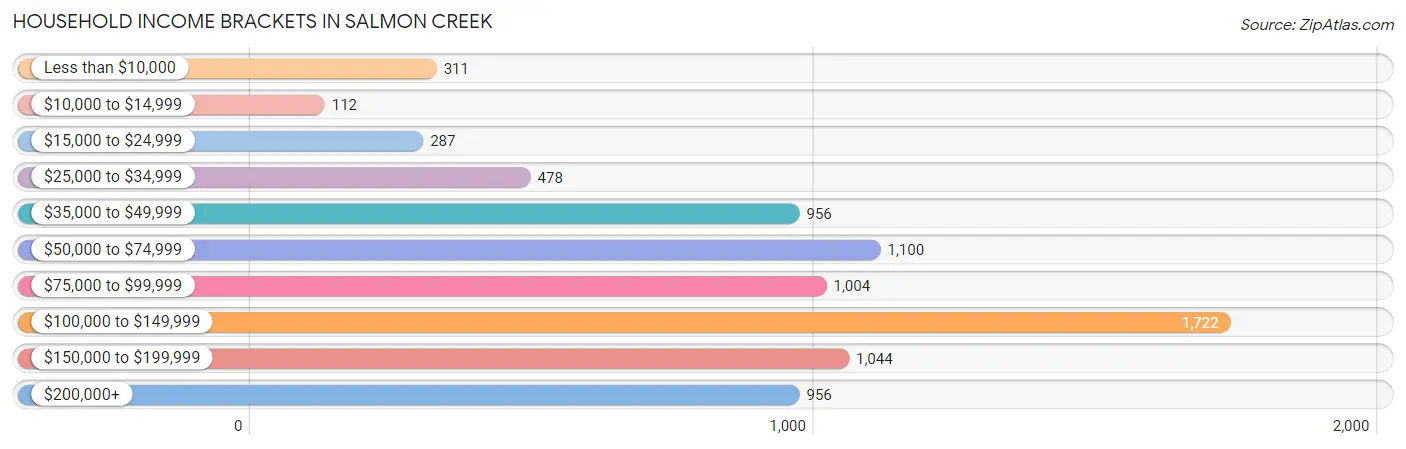
| Income Bracket | # Households | % Households |
| Less than $10,000 | 311 | 3.9% |
| $10,000 to $14,999 | 112 | 1.4% |
| $15,000 to $24,999 | 287 | 3.6% |
| $25,000 to $34,999 | 478 | 6.0% |
| $35,000 to $49,999 | 956 | 12.0% |
| $50,000 to $74,999 | 1,100 | 13.8% |
| $75,000 to $99,999 | 1,004 | 12.6% |
| $100,000 to $149,999 | 1,722 | 21.6% |
| $150,000 to $199,999 | 1,044 | 13.1% |
| $200,000+ | 956 | 12.0% |
Household Income by Householder Age in Salmon Creek
The median household income in Salmon Creek is $93,015, with the highest median household income of $133,142 found in the 45 to 64 years age bracket for the primary householder. A total of 2,749 households (34.5%) fall into this category. Meanwhile, the 15 to 24 years age bracket for the primary householder has the lowest median household income of $25,000, with 200 households (2.5%) in this group.
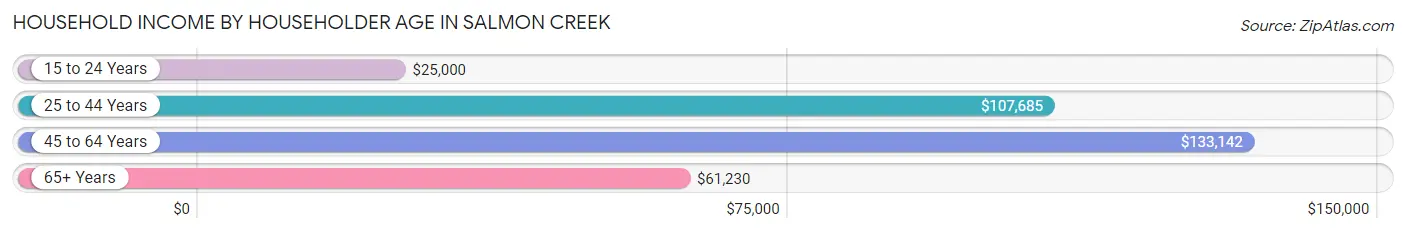
| Income Bracket | # Households | Median Income |
| 15 to 24 Years | 200 (2.5%) | $25,000 |
| 25 to 44 Years | 2,200 (27.6%) | $107,685 |
| 45 to 64 Years | 2,749 (34.5%) | $133,142 |
| 65+ Years | 2,821 (35.4%) | $61,230 |
| Total | 7,970 (100.0%) | $93,015 |
Poverty in Salmon Creek
Income Below Poverty by Sex and Age in Salmon Creek
With 5.6% poverty level for males and 10.5% for females among the residents of Salmon Creek, 18 to 24 year old males and 18 to 24 year old females are the most vulnerable to poverty, with 151 males (17.6%) and 168 females (25.8%) in their respective age groups living below the poverty level.

| Age Bracket | Male | Female |
| Under 5 Years | 46 (9.6%) | 90 (14.6%) |
| 5 Years | 0 (0.0%) | 0 (0.0%) |
| 6 to 11 Years | 69 (9.2%) | 77 (13.6%) |
| 12 to 14 Years | 19 (5.4%) | 15 (3.7%) |
| 15 Years | 0 (0.0%) | 0 (0.0%) |
| 16 and 17 Years | 0 (0.0%) | 22 (12.1%) |
| 18 to 24 Years | 151 (17.6%) | 168 (25.8%) |
| 25 to 34 Years | 39 (3.4%) | 192 (17.8%) |
| 35 to 44 Years | 117 (11.1%) | 132 (9.2%) |
| 45 to 54 Years | 24 (2.0%) | 161 (11.3%) |
| 55 to 64 Years | 21 (1.5%) | 93 (6.8%) |
| 65 to 74 Years | 49 (3.8%) | 42 (3.1%) |
| 75 Years and over | 25 (2.8%) | 81 (8.3%) |
| Total | 560 (5.6%) | 1,073 (10.5%) |
Income Above Poverty by Sex and Age in Salmon Creek
According to the poverty statistics in Salmon Creek, males aged 5 years and females aged 5 years are the age groups that are most secure financially, with 100.0% of males and 100.0% of females in these age groups living above the poverty line.
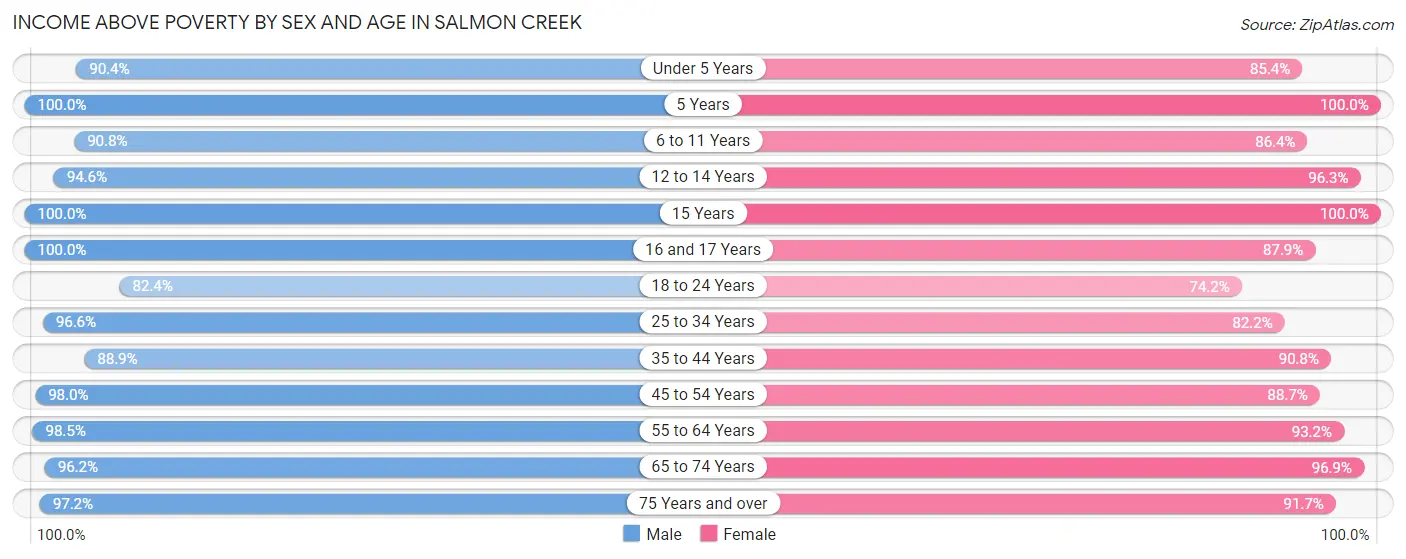
| Age Bracket | Male | Female |
| Under 5 Years | 433 (90.4%) | 528 (85.4%) |
| 5 Years | 122 (100.0%) | 96 (100.0%) |
| 6 to 11 Years | 680 (90.8%) | 490 (86.4%) |
| 12 to 14 Years | 331 (94.6%) | 385 (96.3%) |
| 15 Years | 100 (100.0%) | 92 (100.0%) |
| 16 and 17 Years | 307 (100.0%) | 159 (87.8%) |
| 18 to 24 Years | 706 (82.4%) | 483 (74.2%) |
| 25 to 34 Years | 1,108 (96.6%) | 885 (82.2%) |
| 35 to 44 Years | 937 (88.9%) | 1,296 (90.8%) |
| 45 to 54 Years | 1,197 (98.0%) | 1,263 (88.7%) |
| 55 to 64 Years | 1,388 (98.5%) | 1,268 (93.2%) |
| 65 to 74 Years | 1,253 (96.2%) | 1,308 (96.9%) |
| 75 Years and over | 855 (97.2%) | 890 (91.7%) |
| Total | 9,417 (94.4%) | 9,143 (89.5%) |
Income Below Poverty Among Married-Couple Families in Salmon Creek
The poverty statistics for married-couple families in Salmon Creek show that 1.7% or 75 of the total 4,378 families live below the poverty line. Families with 1 or 2 children have the highest poverty rate of 2.0%, comprising of 25 families. On the other hand, families with 3 or 4 children have the lowest poverty rate of 0.0%, which includes 0 families.
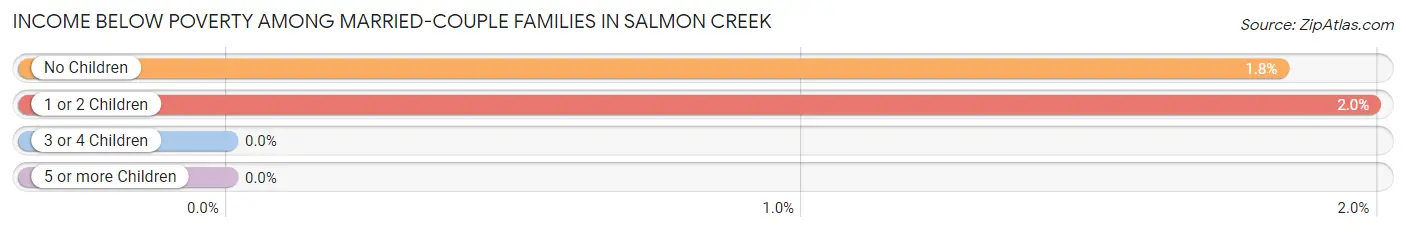
| Children | Above Poverty | Below Poverty |
| No Children | 2,684 (98.2%) | 50 (1.8%) |
| 1 or 2 Children | 1,234 (98.0%) | 25 (2.0%) |
| 3 or 4 Children | 346 (100.0%) | 0 (0.0%) |
| 5 or more Children | 39 (100.0%) | 0 (0.0%) |
| Total | 4,303 (98.3%) | 75 (1.7%) |
Income Below Poverty Among Single-Parent Households in Salmon Creek
According to the poverty data in Salmon Creek, 3.4% or 15 single-father households and 27.0% or 202 single-mother households are living below the poverty line. Among single-father households, those with 3 or 4 children have the highest poverty rate, with 15 households (100.0%) experiencing poverty. Likewise, among single-mother households, those with 1 or 2 children have the highest poverty rate, with 202 households (51.8%) falling below the poverty line.
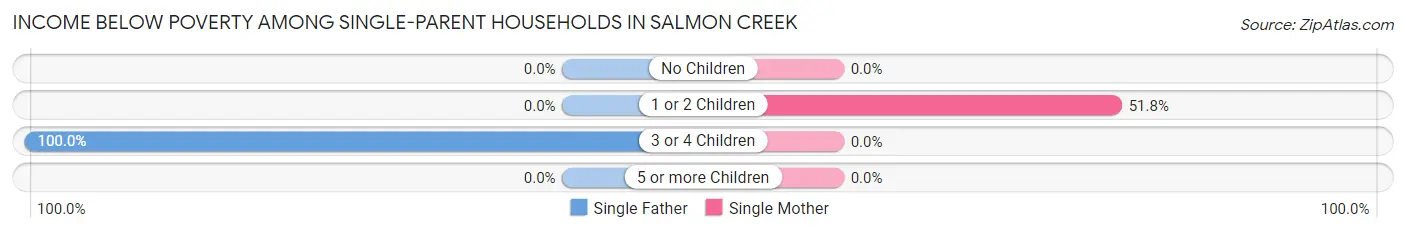
| Children | Single Father | Single Mother |
| No Children | 0 (0.0%) | 0 (0.0%) |
| 1 or 2 Children | 0 (0.0%) | 202 (51.8%) |
| 3 or 4 Children | 15 (100.0%) | 0 (0.0%) |
| 5 or more Children | 0 (0.0%) | 0 (0.0%) |
| Total | 15 (3.4%) | 202 (27.0%) |
Income Below Poverty Among Married-Couple vs Single-Parent Households in Salmon Creek
The poverty data for Salmon Creek shows that 75 of the married-couple family households (1.7%) and 217 of the single-parent households (18.2%) are living below the poverty level. Within the married-couple family households, those with 1 or 2 children have the highest poverty rate, with 25 households (2.0%) falling below the poverty line. Among the single-parent households, those with 3 or 4 children have the highest poverty rate, with 15 household (100.0%) living below poverty.
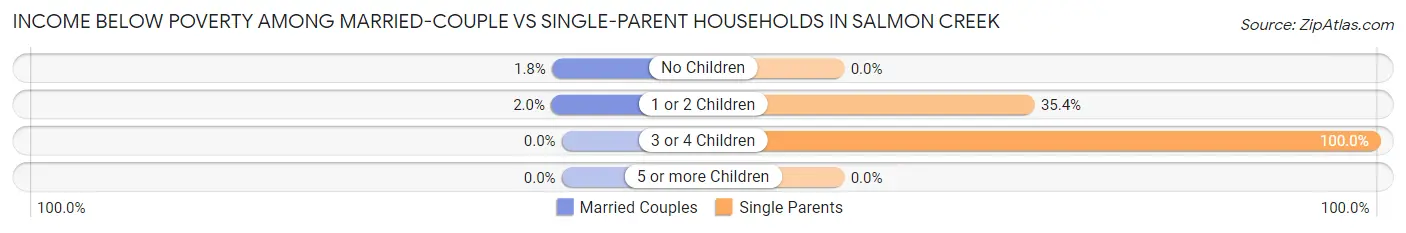
| Children | Married-Couple Families | Single-Parent Households |
| No Children | 50 (1.8%) | 0 (0.0%) |
| 1 or 2 Children | 25 (2.0%) | 202 (35.4%) |
| 3 or 4 Children | 0 (0.0%) | 15 (100.0%) |
| 5 or more Children | 0 (0.0%) | 0 (0.0%) |
| Total | 75 (1.7%) | 217 (18.2%) |
Race in Salmon Creek
The most populous races in Salmon Creek are White / Caucasian (16,073 | 79.1%), Two or more Races (2,031 | 10.0%), and Hispanic or Latino (2,026 | 10.0%).
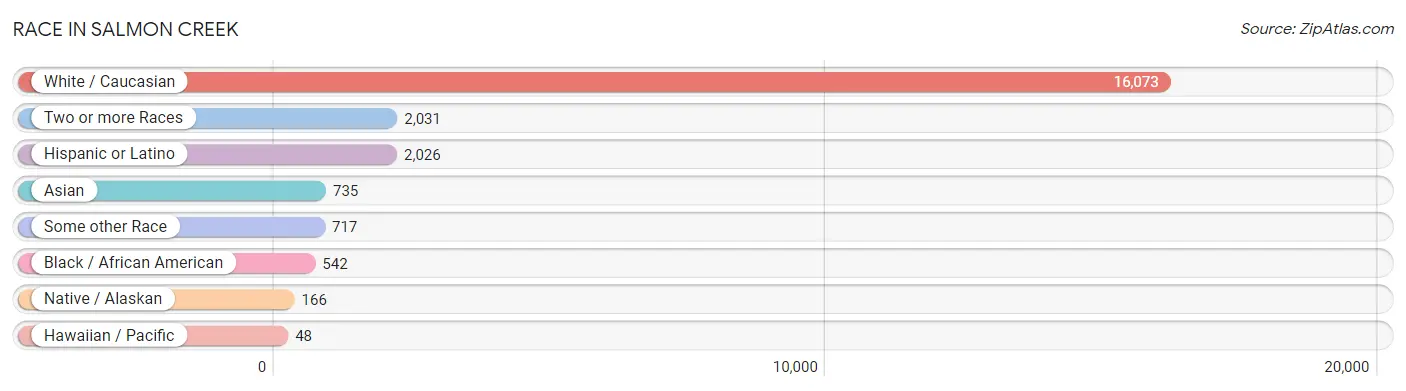
| Race | # Population | % Population |
| Asian | 735 | 3.6% |
| Black / African American | 542 | 2.7% |
| Hawaiian / Pacific | 48 | 0.2% |
| Hispanic or Latino | 2,026 | 10.0% |
| Native / Alaskan | 166 | 0.8% |
| White / Caucasian | 16,073 | 79.1% |
| Two or more Races | 2,031 | 10.0% |
| Some other Race | 717 | 3.5% |
| Total | 20,312 | 100.0% |
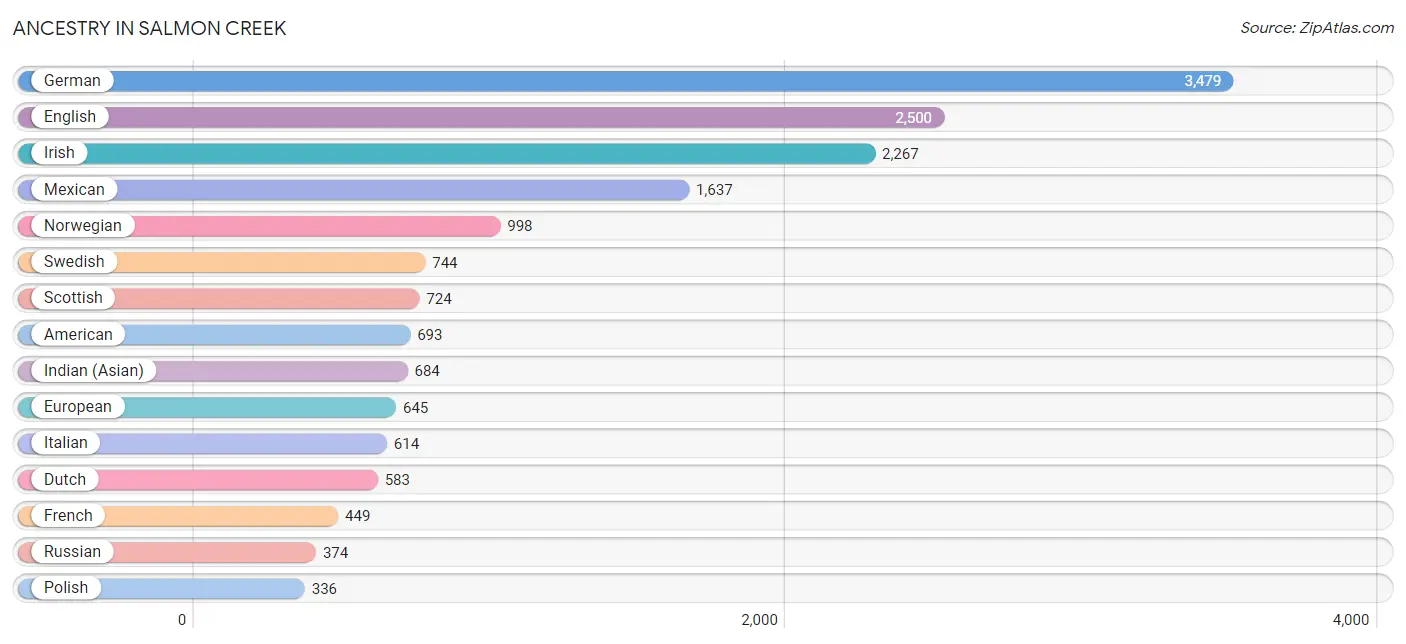
Ancestry in Salmon Creek
The most populous ancestries reported in Salmon Creek are German (3,479 | 17.1%), English (2,500 | 12.3%), Irish (2,267 | 11.2%), Mexican (1,637 | 8.1%), and Norwegian (998 | 4.9%), together accounting for 53.6% of all Salmon Creek residents.
| Ancestry | # Population | % Population |
| African | 36 | 0.2% |
| Aleut | 1 | 0.0% |
| American | 693 | 3.4% |
| Apache | 9 | 0.0% |
| Arab | 27 | 0.1% |
| Austrian | 10 | 0.1% |
| Bhutanese | 95 | 0.5% |
| Blackfeet | 19 | 0.1% |
| British | 205 | 1.0% |
| Burmese | 87 | 0.4% |
| Canadian | 63 | 0.3% |
| Central American | 104 | 0.5% |
| Cherokee | 109 | 0.5% |
| Colombian | 12 | 0.1% |
| Croatian | 44 | 0.2% |
| Czech | 52 | 0.3% |
| Czechoslovakian | 44 | 0.2% |
| Danish | 180 | 0.9% |
| Dutch | 583 | 2.9% |
| Eastern European | 43 | 0.2% |
| English | 2,500 | 12.3% |
| European | 645 | 3.2% |
| Finnish | 163 | 0.8% |
| French | 449 | 2.2% |
| French Canadian | 169 | 0.8% |
| German | 3,479 | 17.1% |
| Greek | 65 | 0.3% |
| Guatemalan | 43 | 0.2% |
| Hopi | 70 | 0.3% |
| Hungarian | 72 | 0.4% |
| Indian (Asian) | 684 | 3.4% |
| Irish | 2,267 | 11.2% |
| Italian | 614 | 3.0% |
| Jamaican | 18 | 0.1% |
| Japanese | 124 | 0.6% |
| Korean | 314 | 1.5% |
| Latvian | 12 | 0.1% |
| Lebanese | 27 | 0.1% |
| Lithuanian | 16 | 0.1% |
| Mexican | 1,637 | 8.1% |
| Mexican American Indian | 156 | 0.8% |
| Native Hawaiian | 146 | 0.7% |
| Nigerian | 103 | 0.5% |
| Northern European | 18 | 0.1% |
| Norwegian | 998 | 4.9% |
| Pakistani | 126 | 0.6% |
| Pennsylvania German | 2 | 0.0% |
| Peruvian | 11 | 0.1% |
| Polish | 336 | 1.7% |
| Portuguese | 17 | 0.1% |
| Puerto Rican | 106 | 0.5% |
| Romanian | 60 | 0.3% |
| Russian | 374 | 1.8% |
| Salvadoran | 61 | 0.3% |
| Samoan | 46 | 0.2% |
| Scandinavian | 216 | 1.1% |
| Scotch-Irish | 262 | 1.3% |
| Scottish | 724 | 3.6% |
| Sioux | 37 | 0.2% |
| Slavic | 7 | 0.0% |
| Slovak | 13 | 0.1% |
| Slovene | 8 | 0.0% |
| South American | 69 | 0.3% |
| South American Indian | 11 | 0.1% |
| Spaniard | 69 | 0.3% |
| Spanish | 32 | 0.2% |
| Sri Lankan | 167 | 0.8% |
| Subsaharan African | 139 | 0.7% |
| Swedish | 744 | 3.7% |
| Swiss | 84 | 0.4% |
| Thai | 48 | 0.2% |
| Tongan | 81 | 0.4% |
| Ukrainian | 227 | 1.1% |
| Uruguayan | 46 | 0.2% |
| Welsh | 205 | 1.0% |
| Yakama | 17 | 0.1% |
| Yugoslavian | 35 | 0.2% | View All 77 Rows |
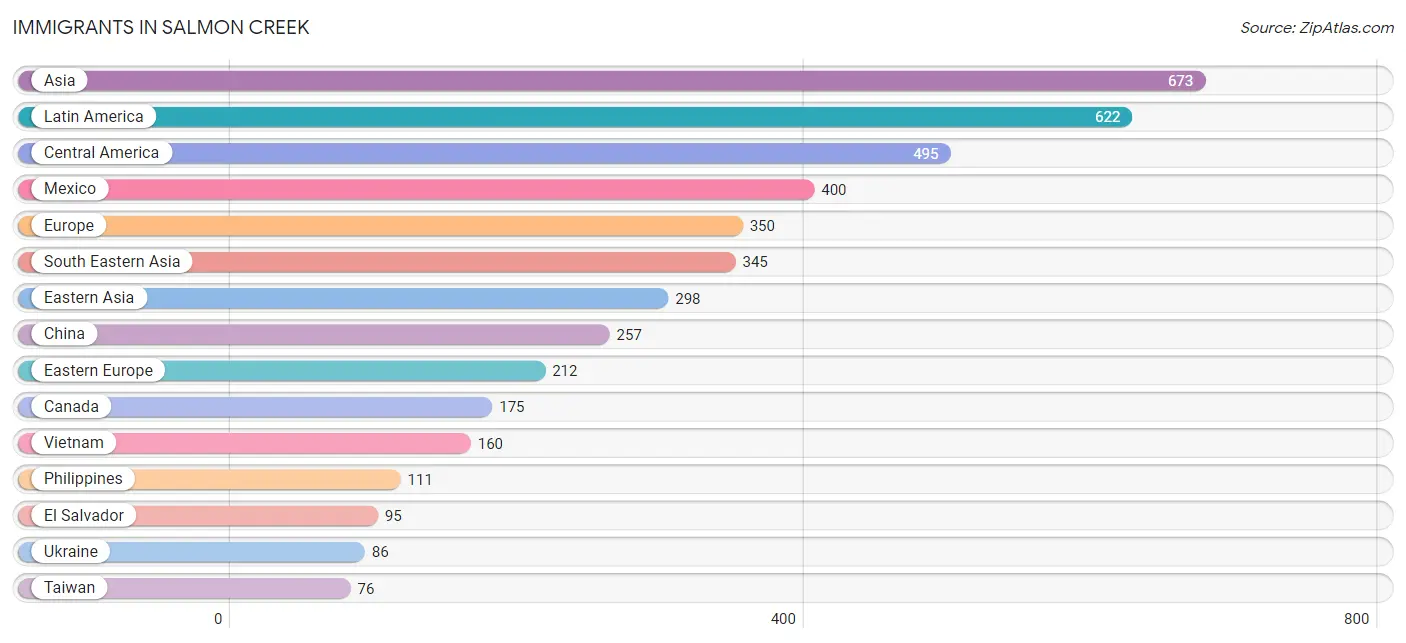
Immigrants in Salmon Creek
The most numerous immigrant groups reported in Salmon Creek came from Asia (673 | 3.3%), Latin America (622 | 3.1%), Central America (495 | 2.4%), Mexico (400 | 2.0%), and Europe (350 | 1.7%), together accounting for 12.5% of all Salmon Creek residents.
| Immigration Origin | # Population | % Population |
| Africa | 45 | 0.2% |
| Asia | 673 | 3.3% |
| Australia | 11 | 0.1% |
| Bahamas | 58 | 0.3% |
| Bosnia and Herzegovina | 16 | 0.1% |
| Cambodia | 59 | 0.3% |
| Canada | 175 | 0.9% |
| Caribbean | 58 | 0.3% |
| Central America | 495 | 2.4% |
| China | 257 | 1.3% |
| Colombia | 12 | 0.1% |
| Denmark | 33 | 0.2% |
| Eastern Asia | 298 | 1.5% |
| Eastern Europe | 212 | 1.0% |
| El Salvador | 95 | 0.5% |
| England | 16 | 0.1% |
| Europe | 350 | 1.7% |
| Fiji | 9 | 0.0% |
| France | 4 | 0.0% |
| Germany | 45 | 0.2% |
| Japan | 12 | 0.1% |
| Korea | 29 | 0.1% |
| Latin America | 622 | 3.1% |
| Mexico | 400 | 2.0% |
| Netherlands | 15 | 0.1% |
| Nigeria | 16 | 0.1% |
| Northern Africa | 29 | 0.1% |
| Northern Europe | 62 | 0.3% |
| Oceania | 20 | 0.1% |
| Peru | 11 | 0.1% |
| Philippines | 111 | 0.5% |
| Poland | 5 | 0.0% |
| Romania | 28 | 0.1% |
| Russia | 65 | 0.3% |
| South America | 69 | 0.3% |
| South Central Asia | 23 | 0.1% |
| South Eastern Asia | 345 | 1.7% |
| Southern Europe | 12 | 0.1% |
| Spain | 12 | 0.1% |
| Sudan | 29 | 0.1% |
| Taiwan | 76 | 0.4% |
| Thailand | 2 | 0.0% |
| Ukraine | 86 | 0.4% |
| Uruguay | 46 | 0.2% |
| Vietnam | 160 | 0.8% |
| Western Africa | 16 | 0.1% |
| Western Asia | 7 | 0.0% |
| Western Europe | 64 | 0.3% | View All 48 Rows |
Sex and Age in Salmon Creek
Sex and Age in Salmon Creek
The most populous age groups in Salmon Creek are 65 to 69 Years (727 | 7.3%) for men and 50 to 54 Years (855 | 8.3%) for women.
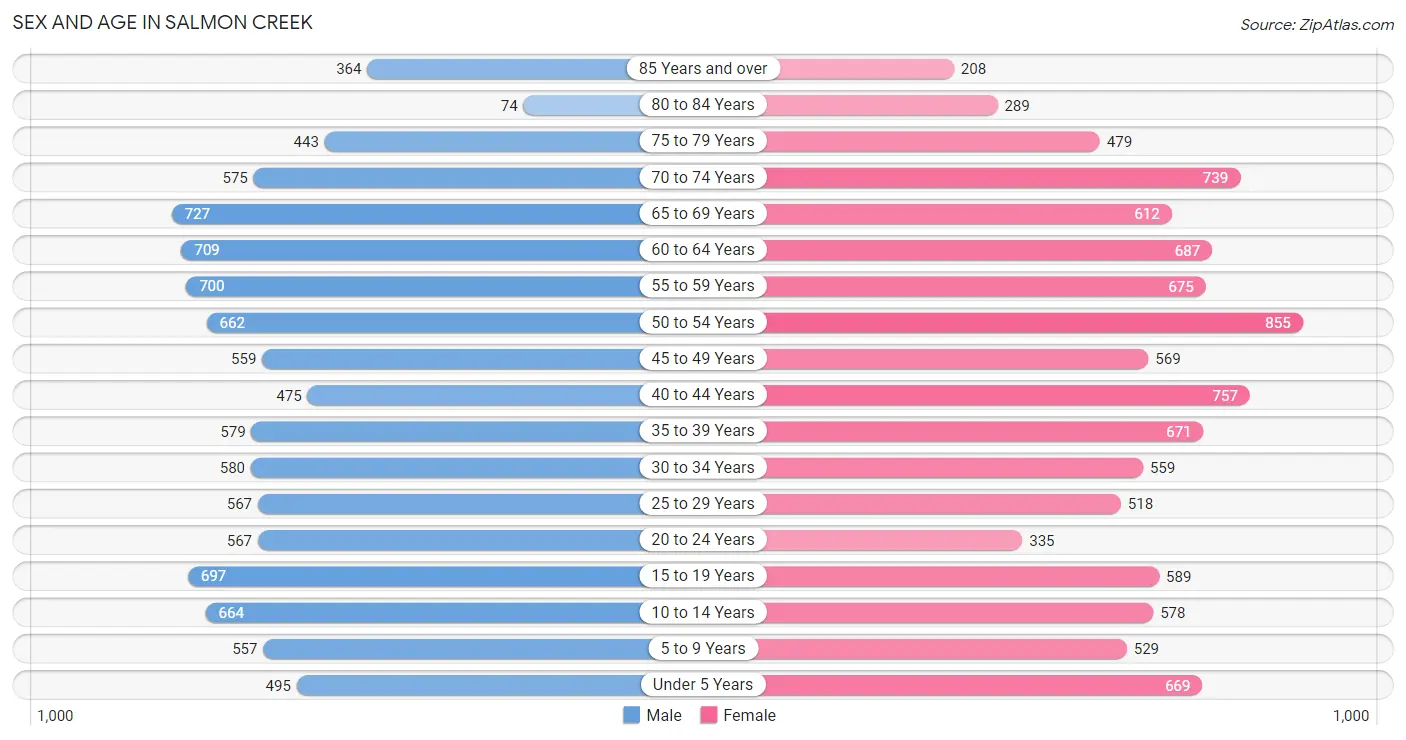
| Age Bracket | Male | Female |
| Under 5 Years | 495 (5.0%) | 669 (6.5%) |
| 5 to 9 Years | 557 (5.6%) | 529 (5.1%) |
| 10 to 14 Years | 664 (6.6%) | 578 (5.6%) |
| 15 to 19 Years | 697 (7.0%) | 589 (5.7%) |
| 20 to 24 Years | 567 (5.7%) | 335 (3.3%) |
| 25 to 29 Years | 567 (5.7%) | 518 (5.0%) |
| 30 to 34 Years | 580 (5.8%) | 559 (5.4%) |
| 35 to 39 Years | 579 (5.8%) | 671 (6.5%) |
| 40 to 44 Years | 475 (4.8%) | 757 (7.3%) |
| 45 to 49 Years | 559 (5.6%) | 569 (5.5%) |
| 50 to 54 Years | 662 (6.6%) | 855 (8.3%) |
| 55 to 59 Years | 700 (7.0%) | 675 (6.5%) |
| 60 to 64 Years | 709 (7.1%) | 687 (6.7%) |
| 65 to 69 Years | 727 (7.3%) | 612 (5.9%) |
| 70 to 74 Years | 575 (5.8%) | 739 (7.2%) |
| 75 to 79 Years | 443 (4.4%) | 479 (4.6%) |
| 80 to 84 Years | 74 (0.7%) | 289 (2.8%) |
| 85 Years and over | 364 (3.6%) | 208 (2.0%) |
| Total | 9,994 (100.0%) | 10,318 (100.0%) |
Families and Households in Salmon Creek
Median Family Size in Salmon Creek
The median family size in Salmon Creek is 2.94 persons per family, with married-couple families (4,378 | 78.6%) accounting for the largest median family size of 3.06 persons per family. On the other hand, single male/father families (447 | 8.0%) represent the smallest median family size with 2.50 persons per family.
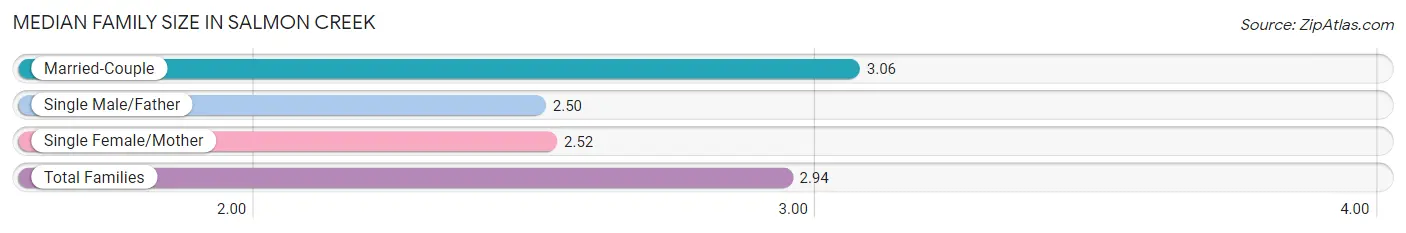
| Family Type | # Families | Family Size |
| Married-Couple | 4,378 (78.6%) | 3.06 |
| Single Male/Father | 447 (8.0%) | 2.50 |
| Single Female/Mother | 747 (13.4%) | 2.52 |
| Total Families | 5,572 (100.0%) | 2.94 |
Median Household Size in Salmon Creek
The median household size in Salmon Creek is 2.54 persons per household, with single male/father households (447 | 5.6%) accounting for the largest median household size of 3.23 persons per household. non-family households (2,398 | 30.1%) represent the smallest median household size with 1.32 persons per household.
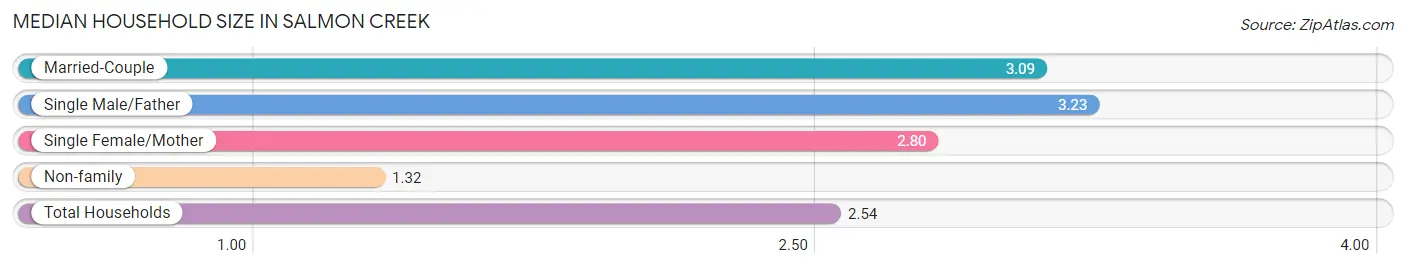
| Household Type | # Households | Household Size |
| Married-Couple | 4,378 (54.9%) | 3.09 |
| Single Male/Father | 447 (5.6%) | 3.23 |
| Single Female/Mother | 747 (9.4%) | 2.80 |
| Non-family | 2,398 (30.1%) | 1.32 |
| Total Households | 7,970 (100.0%) | 2.54 |
Household Size by Marriage Status in Salmon Creek
Out of a total of 7,970 households in Salmon Creek, 5,572 (69.9%) are family households, while 2,398 (30.1%) are nonfamily households. The most numerous type of family households are 2-person households, comprising 2,664, and the most common type of nonfamily households are 1-person households, comprising 1,878.
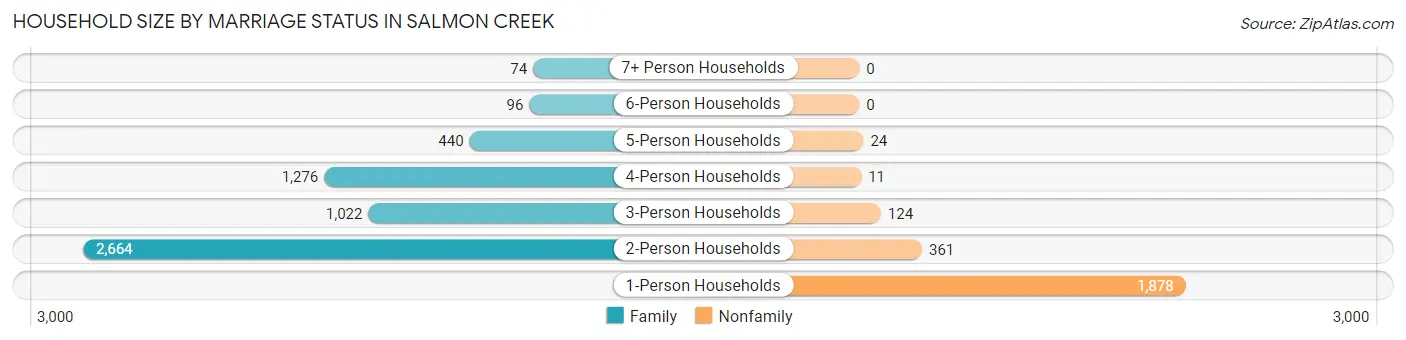
| Household Size | Family Households | Nonfamily Households |
| 1-Person Households | - | 1,878 (23.6%) |
| 2-Person Households | 2,664 (33.4%) | 361 (4.5%) |
| 3-Person Households | 1,022 (12.8%) | 124 (1.6%) |
| 4-Person Households | 1,276 (16.0%) | 11 (0.1%) |
| 5-Person Households | 440 (5.5%) | 24 (0.3%) |
| 6-Person Households | 96 (1.2%) | 0 (0.0%) |
| 7+ Person Households | 74 (0.9%) | 0 (0.0%) |
| Total | 5,572 (69.9%) | 2,398 (30.1%) |
Female Fertility in Salmon Creek
Fertility by Age in Salmon Creek
Average fertility rate in Salmon Creek is 67.0 births per 1,000 women. Women in the age bracket of 20 to 34 years have the highest fertility rate with 109.0 births per 1,000 women. Women in the age bracket of 20 to 34 years acount for 54.0% of all women with births.
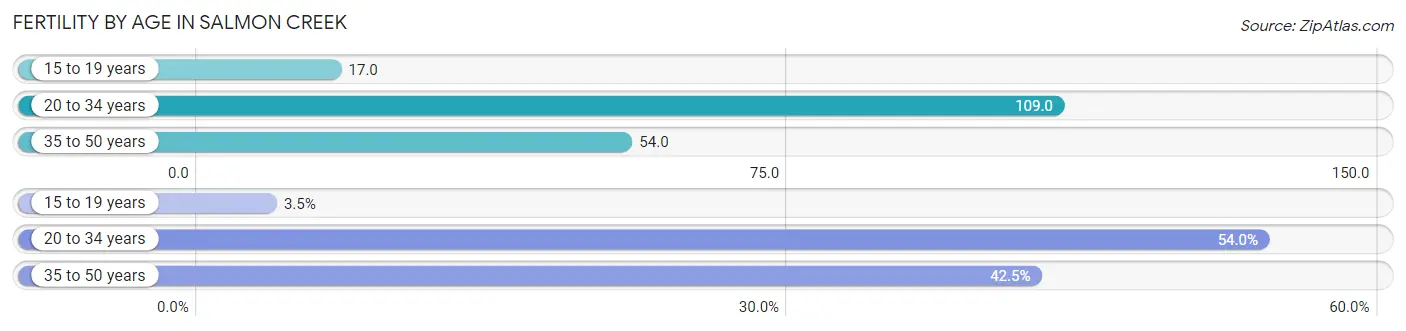
| Age Bracket | Women with Births | Births / 1,000 Women |
| 15 to 19 years | 10 (3.5%) | 17.0 |
| 20 to 34 years | 154 (54.0%) | 109.0 |
| 35 to 50 years | 121 (42.5%) | 54.0 |
| Total | 285 (100.0%) | 67.0 |
Fertility by Age by Marriage Status in Salmon Creek
63.9% of women with births (285) in Salmon Creek are married. The highest percentage of unmarried women with births falls into 15 to 19 years age bracket with 100.0% of them unmarried at the time of birth, while the lowest percentage of unmarried women with births belong to 35 to 50 years age bracket with 0.0% of them unmarried.
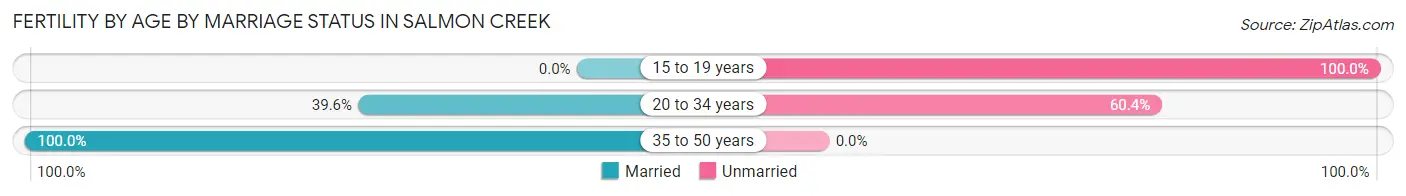
| Age Bracket | Married | Unmarried |
| 15 to 19 years | 0 (0.0%) | 10 (100.0%) |
| 20 to 34 years | 61 (39.6%) | 93 (60.4%) |
| 35 to 50 years | 121 (100.0%) | 0 (0.0%) |
| Total | 182 (63.9%) | 103 (36.1%) |
Fertility by Education in Salmon Creek
Average fertility rate in Salmon Creek is 67.0 births per 1,000 women. Women with the education attainment of graduate degree have the highest fertility rate of 153.0 births per 1,000 women, while women with the education attainment of bachelor's degree have the lowest fertility at 41.0 births per 1,000 women. Women with the education attainment of college or associate's degree represent 29.1% of all women with births.
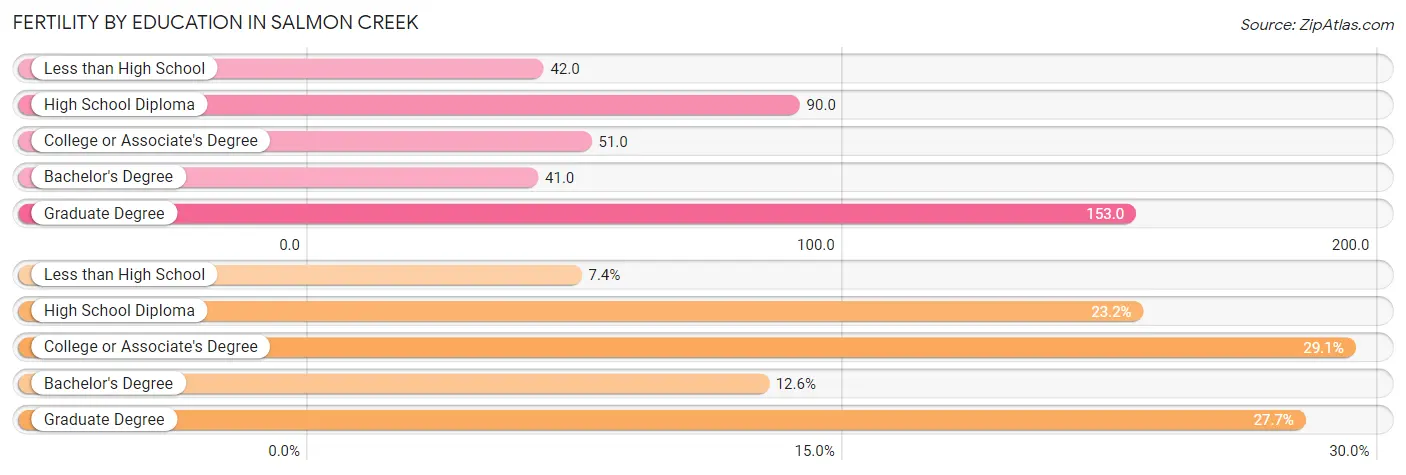
| Educational Attainment | Women with Births | Births / 1,000 Women |
| Less than High School | 21 (7.4%) | 42.0 |
| High School Diploma | 66 (23.2%) | 90.0 |
| College or Associate's Degree | 83 (29.1%) | 51.0 |
| Bachelor's Degree | 36 (12.6%) | 41.0 |
| Graduate Degree | 79 (27.7%) | 153.0 |
| Total | 285 (100.0%) | 67.0 |
Fertility by Education by Marriage Status in Salmon Creek
36.1% of women with births in Salmon Creek are unmarried. Women with the educational attainment of bachelor's degree are most likely to be married with 100.0% of them married at childbirth, while women with the educational attainment of college or associate's degree are least likely to be married with 75.9% of them unmarried at childbirth.
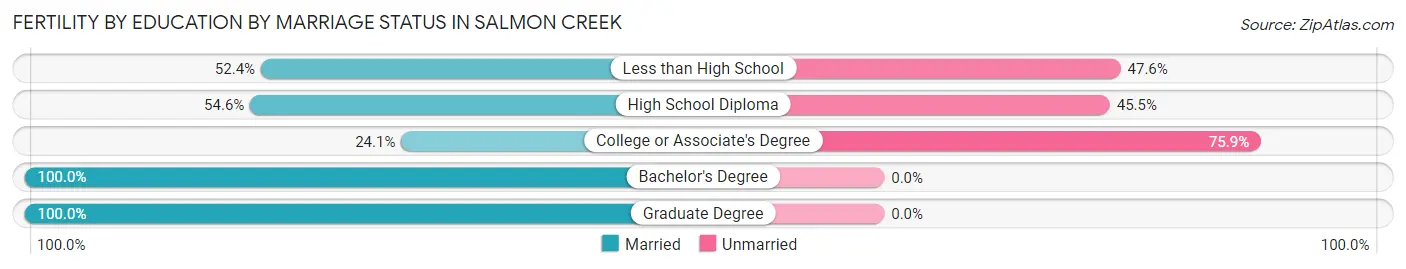
| Educational Attainment | Married | Unmarried |
| Less than High School | 11 (52.4%) | 10 (47.6%) |
| High School Diploma | 36 (54.5%) | 30 (45.5%) |
| College or Associate's Degree | 20 (24.1%) | 63 (75.9%) |
| Bachelor's Degree | 36 (100.0%) | 0 (0.0%) |
| Graduate Degree | 79 (100.0%) | 0 (0.0%) |
| Total | 182 (63.9%) | 103 (36.1%) |
Employment Characteristics in Salmon Creek
Employment by Class of Employer in Salmon Creek
Among the 9,307 employed individuals in Salmon Creek, private company employees (5,883 | 63.2%), not-for-profit organizations (900 | 9.7%), and self-employed (not incorporated) (702 | 7.5%) make up the most common classes of employment.
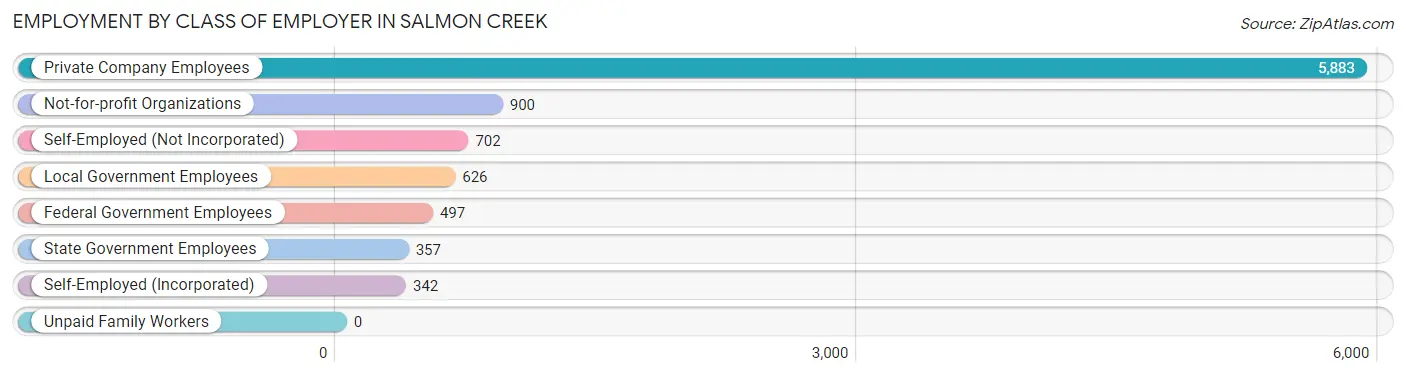
| Employer Class | # Employees | % Employees |
| Private Company Employees | 5,883 | 63.2% |
| Self-Employed (Incorporated) | 342 | 3.7% |
| Self-Employed (Not Incorporated) | 702 | 7.5% |
| Not-for-profit Organizations | 900 | 9.7% |
| Local Government Employees | 626 | 6.7% |
| State Government Employees | 357 | 3.8% |
| Federal Government Employees | 497 | 5.3% |
| Unpaid Family Workers | 0 | 0.0% |
| Total | 9,307 | 100.0% |
Employment Status by Age in Salmon Creek
According to the labor force statistics for Salmon Creek, out of the total population over 16 years of age (16,628), 59.1% or 9,827 individuals are in the labor force, with 2.9% or 285 of them unemployed. The age group with the highest labor force participation rate is 45 to 54 years, with 84.6% or 2,238 individuals in the labor force. Within the labor force, the 16 to 19 years age range has the highest percentage of unemployed individuals, with 14.9% or 71 of them being unemployed.
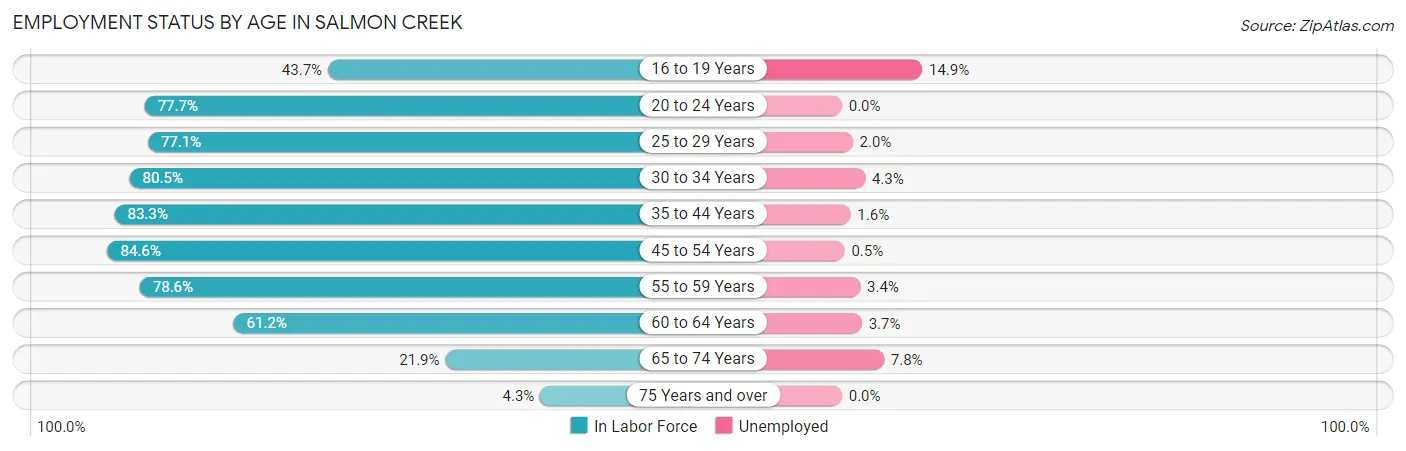
| Age Bracket | In Labor Force | Unemployed |
| 16 to 19 Years | 478 (43.7%) | 71 (14.9%) |
| 20 to 24 Years | 701 (77.7%) | 0 (0.0%) |
| 25 to 29 Years | 837 (77.1%) | 17 (2.0%) |
| 30 to 34 Years | 917 (80.5%) | 39 (4.3%) |
| 35 to 44 Years | 2,068 (83.3%) | 33 (1.6%) |
| 45 to 54 Years | 2,238 (84.6%) | 11 (0.5%) |
| 55 to 59 Years | 1,081 (78.6%) | 37 (3.4%) |
| 60 to 64 Years | 854 (61.2%) | 32 (3.7%) |
| 65 to 74 Years | 581 (21.9%) | 45 (7.8%) |
| 75 Years and over | 80 (4.3%) | 0 (0.0%) |
| Total | 9,827 (59.1%) | 285 (2.9%) |
Employment Status by Educational Attainment in Salmon Creek
According to labor force statistics for Salmon Creek, 79.0% of individuals (7,996) out of the total population between 25 and 64 years of age (10,122) are in the labor force, with 2.1% or 168 of them being unemployed. The group with the highest labor force participation rate are those with the educational attainment of bachelor's degree or higher, with 88.4% or 3,144 individuals in the labor force. Within the labor force, individuals with less than high school education have the highest percentage of unemployment, with 5.7% or 24 of them being unemployed.
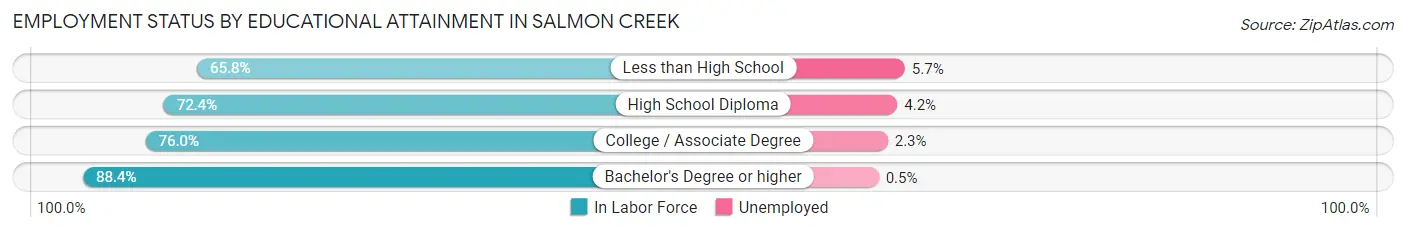
| Educational Attainment | In Labor Force | Unemployed |
| Less than High School | 421 (65.8%) | 36 (5.7%) |
| High School Diploma | 1,486 (72.4%) | 86 (4.2%) |
| College / Associate Degree | 2,944 (76.0%) | 89 (2.3%) |
| Bachelor's Degree or higher | 3,144 (88.4%) | 18 (0.5%) |
| Total | 7,996 (79.0%) | 213 (2.1%) |
Employment Occupations by Sex in Salmon Creek
Management, Business, Science and Arts Occupations
The most common Management, Business, Science and Arts occupations in Salmon Creek are Community & Social Service (967 | 10.1%), Computers, Engineering & Science (752 | 7.9%), Management (738 | 7.7%), Business & Financial (730 | 7.6%), and Health Diagnosing & Treating (618 | 6.5%).
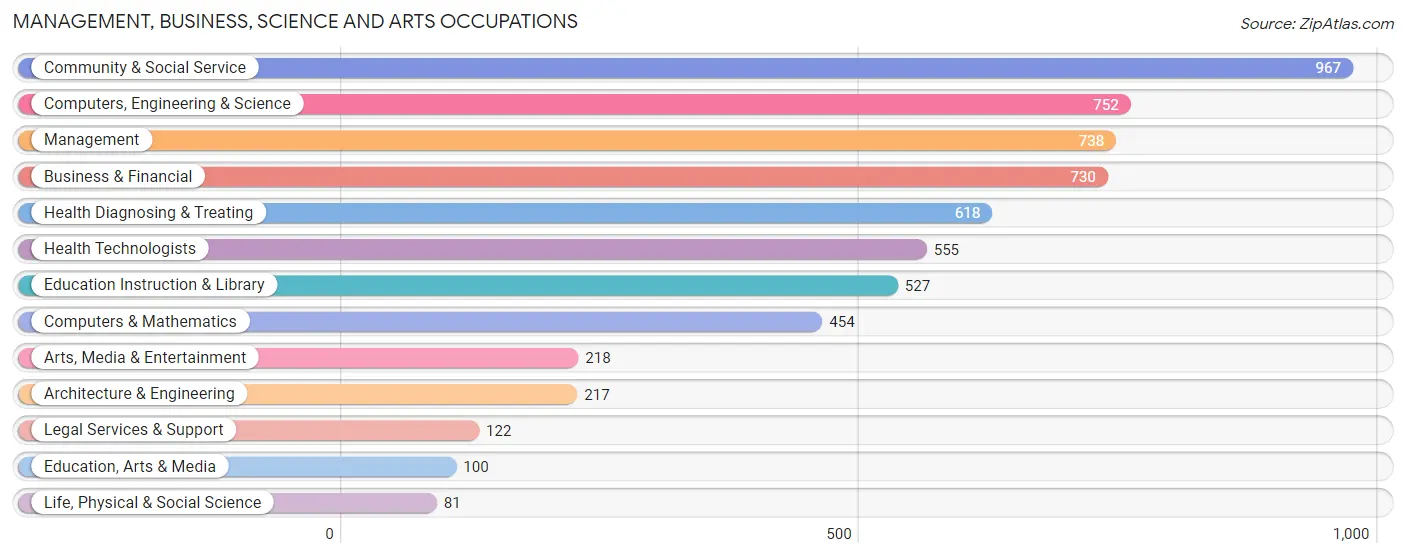
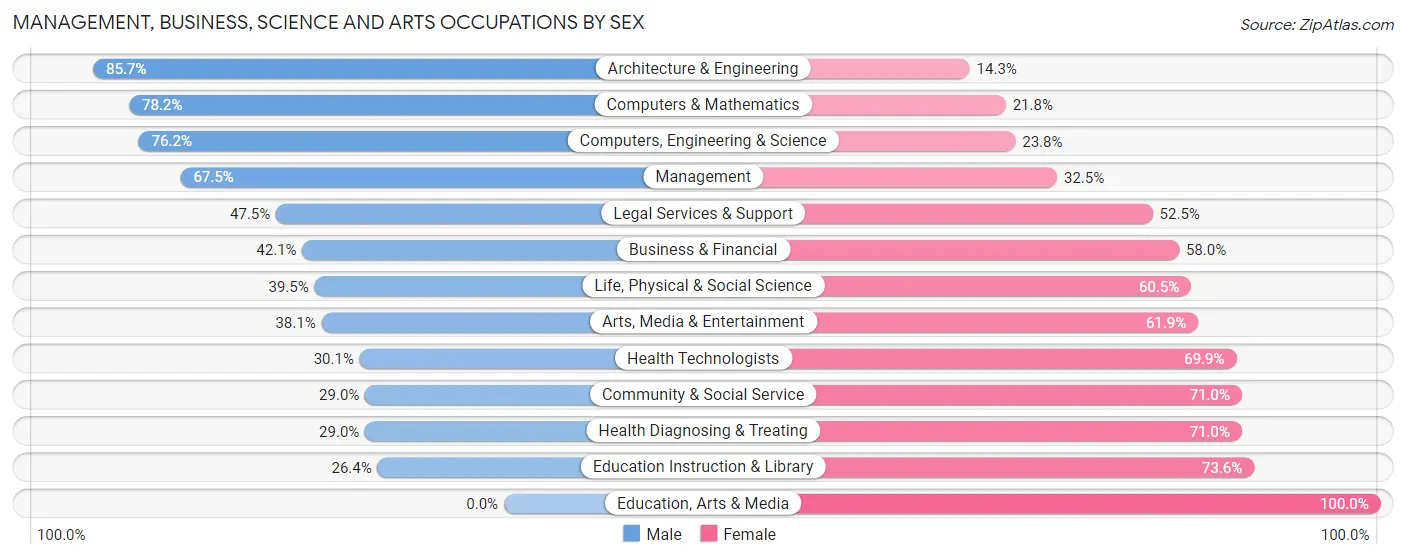
Management, Business, Science and Arts Occupations by Sex
Within the Management, Business, Science and Arts occupations in Salmon Creek, the most male-oriented occupations are Architecture & Engineering (85.7%), Computers & Mathematics (78.2%), and Computers, Engineering & Science (76.2%), while the most female-oriented occupations are Education, Arts & Media (100.0%), Education Instruction & Library (73.6%), and Community & Social Service (71.0%).
| Occupation | Male | Female |
| Management | 498 (67.5%) | 240 (32.5%) |
| Business & Financial | 307 (42.0%) | 423 (58.0%) |
| Computers, Engineering & Science | 573 (76.2%) | 179 (23.8%) |
| Computers & Mathematics | 355 (78.2%) | 99 (21.8%) |
| Architecture & Engineering | 186 (85.7%) | 31 (14.3%) |
| Life, Physical & Social Science | 32 (39.5%) | 49 (60.5%) |
| Community & Social Service | 280 (29.0%) | 687 (71.0%) |
| Education, Arts & Media | 0 (0.0%) | 100 (100.0%) |
| Legal Services & Support | 58 (47.5%) | 64 (52.5%) |
| Education Instruction & Library | 139 (26.4%) | 388 (73.6%) |
| Arts, Media & Entertainment | 83 (38.1%) | 135 (61.9%) |
| Health Diagnosing & Treating | 179 (29.0%) | 439 (71.0%) |
| Health Technologists | 167 (30.1%) | 388 (69.9%) |
| Total (Category) | 1,837 (48.3%) | 1,968 (51.7%) |
| Total (Overall) | 5,263 (55.1%) | 4,283 (44.9%) |
Services Occupations
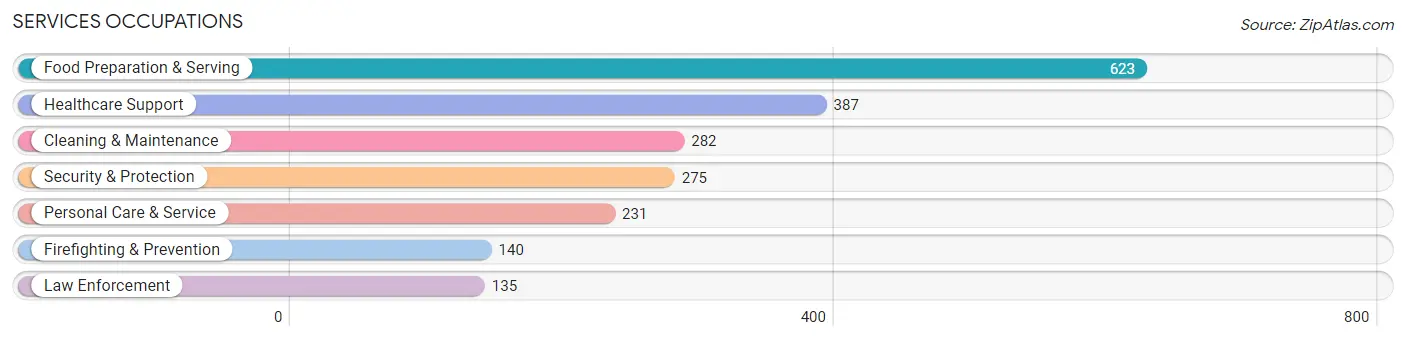
The most common Services occupations in Salmon Creek are Food Preparation & Serving (623 | 6.5%), Healthcare Support (387 | 4.1%), Cleaning & Maintenance (282 | 2.9%), Security & Protection (275 | 2.9%), and Personal Care & Service (231 | 2.4%).
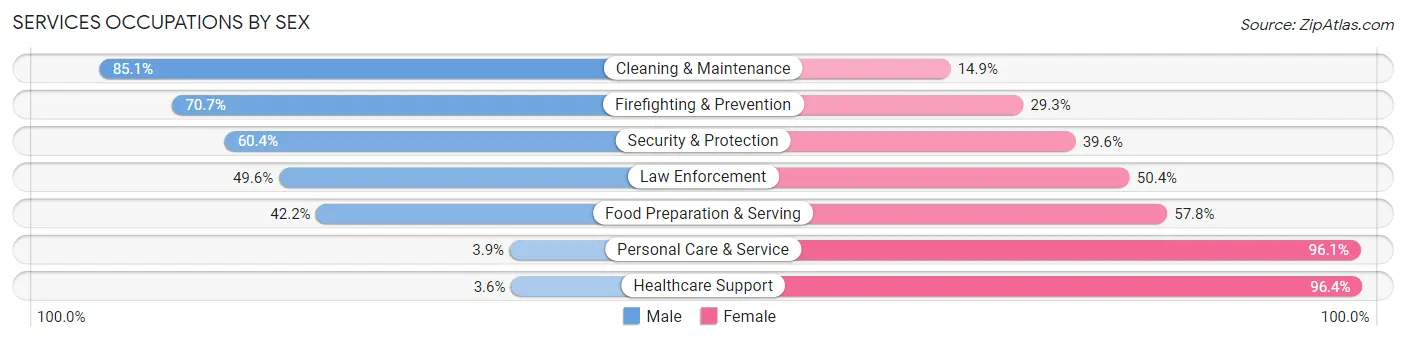
Services Occupations by Sex
Within the Services occupations in Salmon Creek, the most male-oriented occupations are Cleaning & Maintenance (85.1%), Firefighting & Prevention (70.7%), and Security & Protection (60.4%), while the most female-oriented occupations are Healthcare Support (96.4%), Personal Care & Service (96.1%), and Food Preparation & Serving (57.8%).
| Occupation | Male | Female |
| Healthcare Support | 14 (3.6%) | 373 (96.4%) |
| Security & Protection | 166 (60.4%) | 109 (39.6%) |
| Firefighting & Prevention | 99 (70.7%) | 41 (29.3%) |
| Law Enforcement | 67 (49.6%) | 68 (50.4%) |
| Food Preparation & Serving | 263 (42.2%) | 360 (57.8%) |
| Cleaning & Maintenance | 240 (85.1%) | 42 (14.9%) |
| Personal Care & Service | 9 (3.9%) | 222 (96.1%) |
| Total (Category) | 692 (38.5%) | 1,106 (61.5%) |
| Total (Overall) | 5,263 (55.1%) | 4,283 (44.9%) |
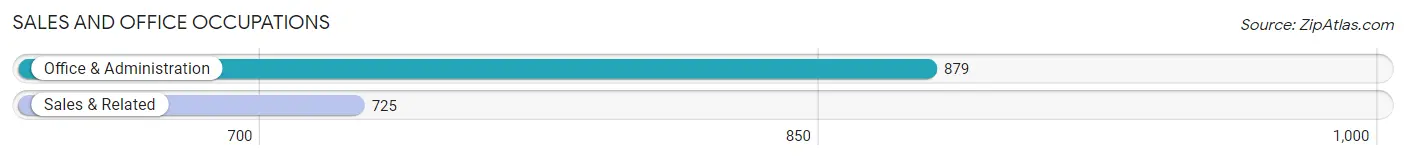
Sales and Office Occupations
The most common Sales and Office occupations in Salmon Creek are Office & Administration (879 | 9.2%), and Sales & Related (725 | 7.6%).
Sales and Office Occupations by Sex
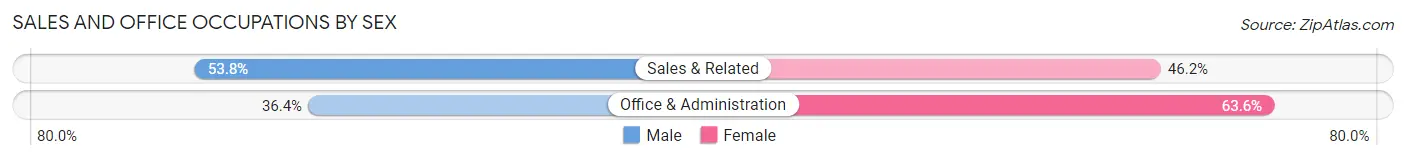
| Occupation | Male | Female |
| Sales & Related | 390 (53.8%) | 335 (46.2%) |
| Office & Administration | 320 (36.4%) | 559 (63.6%) |
| Total (Category) | 710 (44.3%) | 894 (55.7%) |
| Total (Overall) | 5,263 (55.1%) | 4,283 (44.9%) |
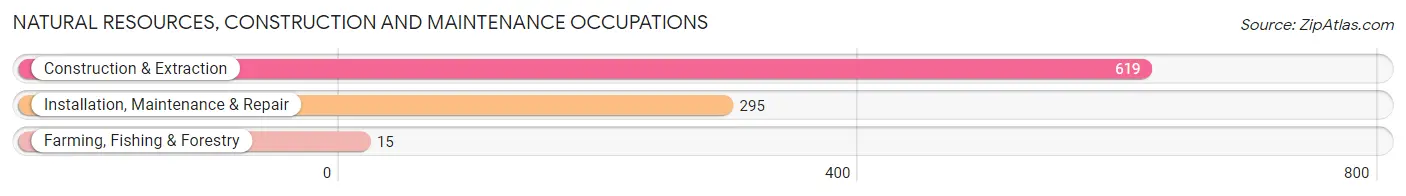
Natural Resources, Construction and Maintenance Occupations
The most common Natural Resources, Construction and Maintenance occupations in Salmon Creek are Construction & Extraction (619 | 6.5%), Installation, Maintenance & Repair (295 | 3.1%), and Farming, Fishing & Forestry (15 | 0.2%).
Natural Resources, Construction and Maintenance Occupations by Sex
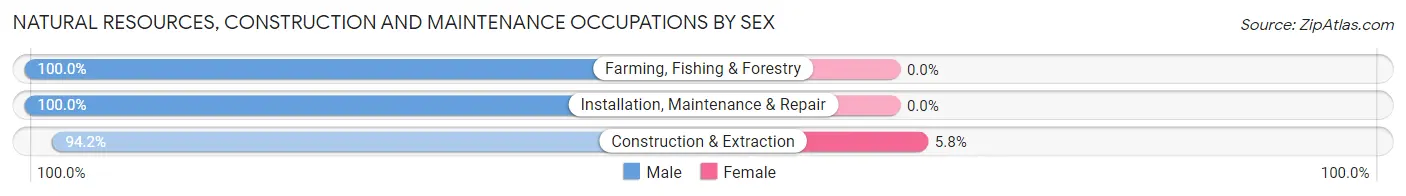
| Occupation | Male | Female |
| Farming, Fishing & Forestry | 15 (100.0%) | 0 (0.0%) |
| Construction & Extraction | 583 (94.2%) | 36 (5.8%) |
| Installation, Maintenance & Repair | 295 (100.0%) | 0 (0.0%) |
| Total (Category) | 893 (96.1%) | 36 (3.9%) |
| Total (Overall) | 5,263 (55.1%) | 4,283 (44.9%) |
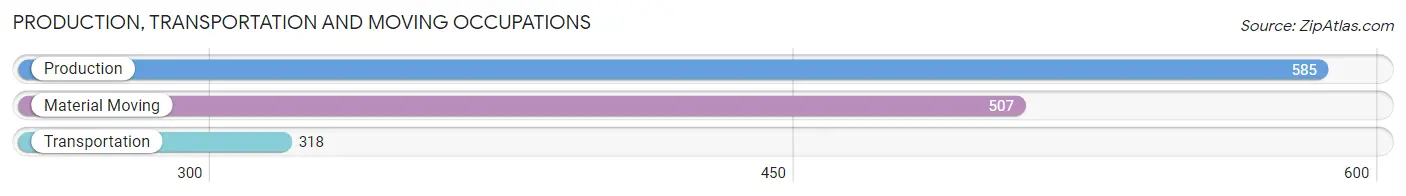
Production, Transportation and Moving Occupations
The most common Production, Transportation and Moving occupations in Salmon Creek are Production (585 | 6.1%), Material Moving (507 | 5.3%), and Transportation (318 | 3.3%).
Production, Transportation and Moving Occupations by Sex
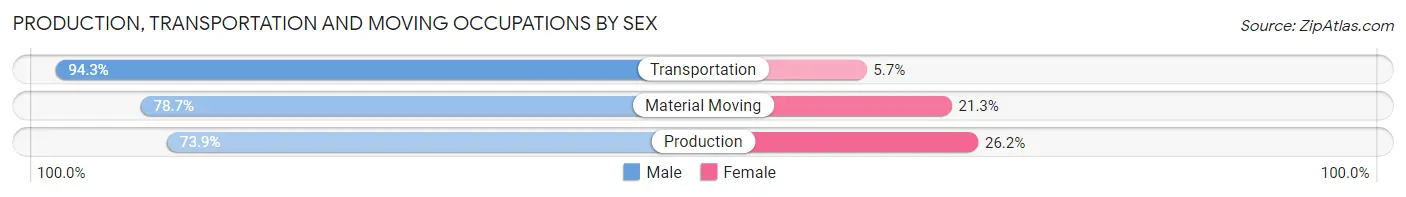
| Occupation | Male | Female |
| Production | 432 (73.9%) | 153 (26.2%) |
| Transportation | 300 (94.3%) | 18 (5.7%) |
| Material Moving | 399 (78.7%) | 108 (21.3%) |
| Total (Category) | 1,131 (80.2%) | 279 (19.8%) |
| Total (Overall) | 5,263 (55.1%) | 4,283 (44.9%) |
Employment Industries by Sex in Salmon Creek
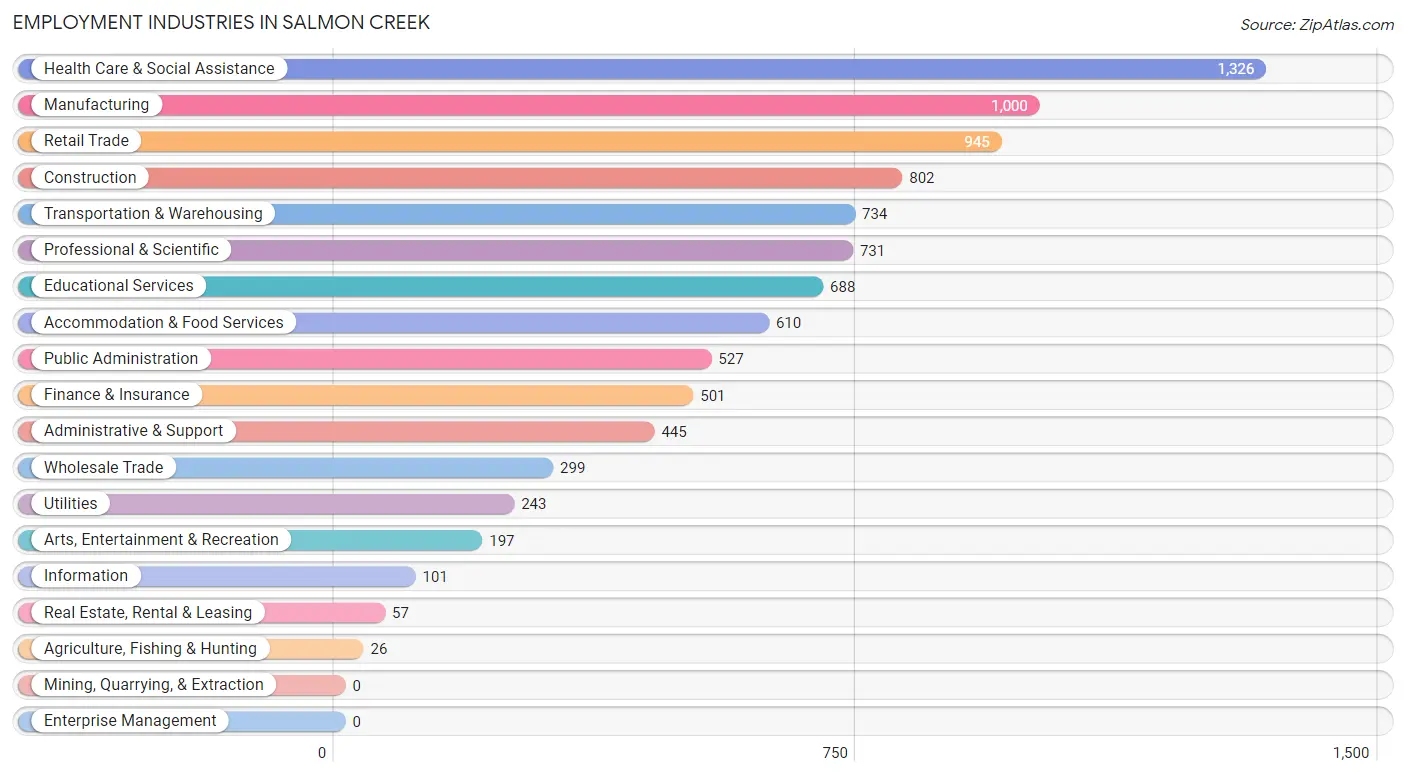
Employment Industries in Salmon Creek
The major employment industries in Salmon Creek include Health Care & Social Assistance (1,326 | 13.9%), Manufacturing (1,000 | 10.5%), Retail Trade (945 | 9.9%), Construction (802 | 8.4%), and Transportation & Warehousing (734 | 7.7%).
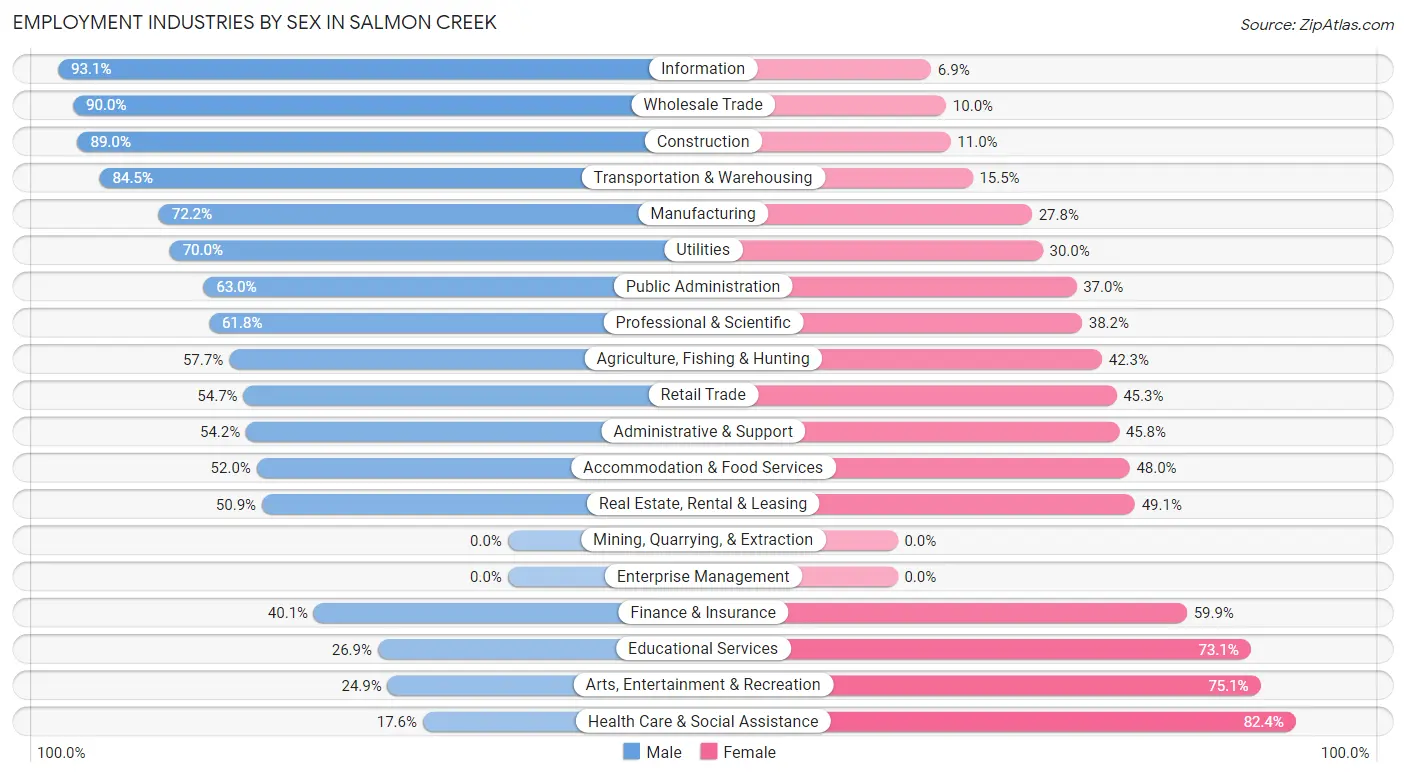
Employment Industries by Sex in Salmon Creek
The Salmon Creek industries that see more men than women are Information (93.1%), Wholesale Trade (90.0%), and Construction (89.0%), whereas the industries that tend to have a higher number of women are Health Care & Social Assistance (82.4%), Arts, Entertainment & Recreation (75.1%), and Educational Services (73.1%).
| Industry | Male | Female |
| Agriculture, Fishing & Hunting | 15 (57.7%) | 11 (42.3%) |
| Mining, Quarrying, & Extraction | 0 (0.0%) | 0 (0.0%) |
| Construction | 714 (89.0%) | 88 (11.0%) |
| Manufacturing | 722 (72.2%) | 278 (27.8%) |
| Wholesale Trade | 269 (90.0%) | 30 (10.0%) |
| Retail Trade | 517 (54.7%) | 428 (45.3%) |
| Transportation & Warehousing | 620 (84.5%) | 114 (15.5%) |
| Utilities | 170 (70.0%) | 73 (30.0%) |
| Information | 94 (93.1%) | 7 (6.9%) |
| Finance & Insurance | 201 (40.1%) | 300 (59.9%) |
| Real Estate, Rental & Leasing | 29 (50.9%) | 28 (49.1%) |
| Professional & Scientific | 452 (61.8%) | 279 (38.2%) |
| Enterprise Management | 0 (0.0%) | 0 (0.0%) |
| Administrative & Support | 241 (54.2%) | 204 (45.8%) |
| Educational Services | 185 (26.9%) | 503 (73.1%) |
| Health Care & Social Assistance | 233 (17.6%) | 1,093 (82.4%) |
| Arts, Entertainment & Recreation | 49 (24.9%) | 148 (75.1%) |
| Accommodation & Food Services | 317 (52.0%) | 293 (48.0%) |
| Public Administration | 332 (63.0%) | 195 (37.0%) |
| Total | 5,263 (55.1%) | 4,283 (44.9%) |
Education in Salmon Creek
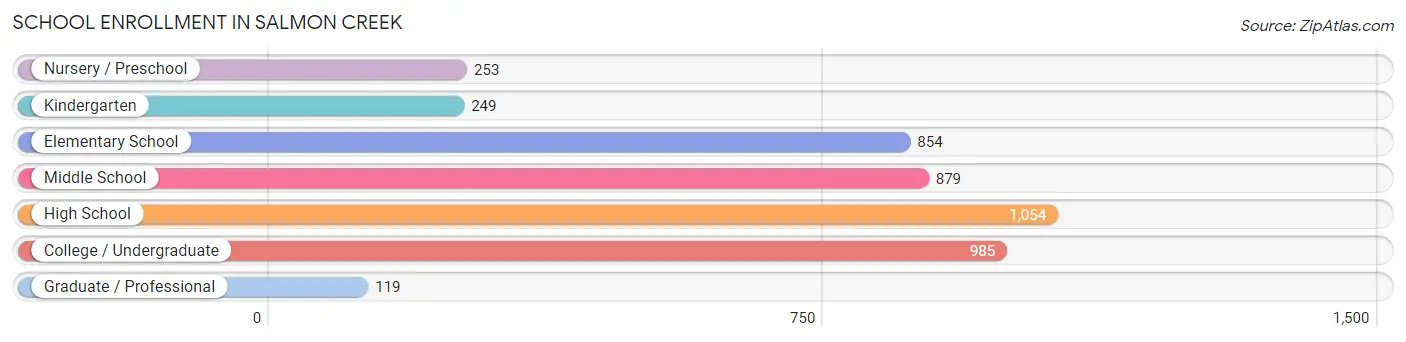
School Enrollment in Salmon Creek
The most common levels of schooling among the 4,393 students in Salmon Creek are high school (1,054 | 24.0%), college / undergraduate (985 | 22.4%), and middle school (879 | 20.0%).
| School Level | # Students | % Students |
| Nursery / Preschool | 253 | 5.8% |
| Kindergarten | 249 | 5.7% |
| Elementary School | 854 | 19.4% |
| Middle School | 879 | 20.0% |
| High School | 1,054 | 24.0% |
| College / Undergraduate | 985 | 22.4% |
| Graduate / Professional | 119 | 2.7% |
| Total | 4,393 | 100.0% |
School Enrollment by Age by Funding Source in Salmon Creek
Out of a total of 4,393 students who are enrolled in schools in Salmon Creek, 650 (14.8%) attend a private institution, while the remaining 3,743 (85.2%) are enrolled in public schools. The age group of 35 years and over has the highest likelihood of being enrolled in private schools, with 214 (53.6% in the age bracket) enrolled. Conversely, the age group of 20 to 24 year olds has the lowest likelihood of being enrolled in a private school, with 288 (100.0% in the age bracket) attending a public institution.
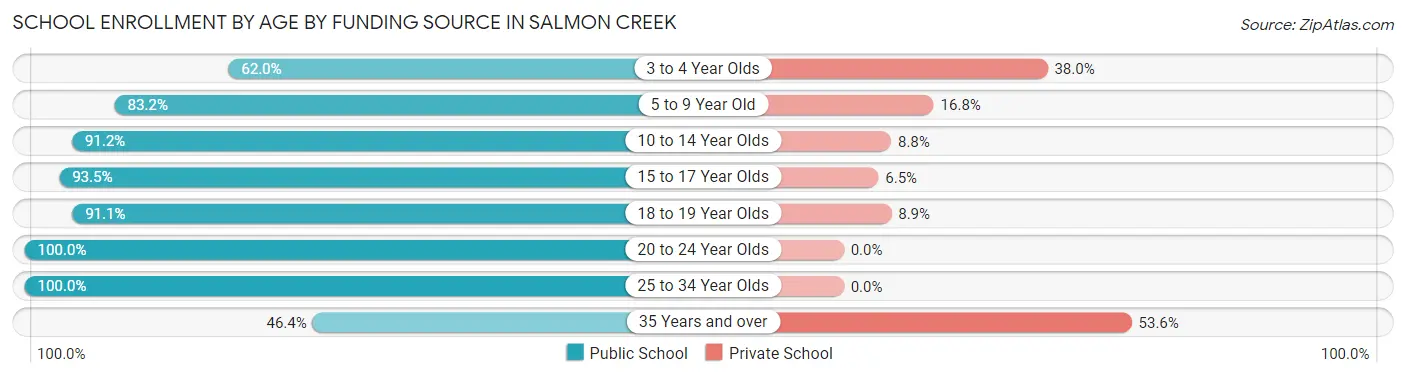
| Age Bracket | Public School | Private School |
| 3 to 4 Year Olds | 134 (62.0%) | 82 (38.0%) |
| 5 to 9 Year Old | 849 (83.2%) | 171 (16.8%) |
| 10 to 14 Year Olds | 1,054 (91.2%) | 102 (8.8%) |
| 15 to 17 Year Olds | 608 (93.5%) | 42 (6.5%) |
| 18 to 19 Year Olds | 380 (91.1%) | 37 (8.9%) |
| 20 to 24 Year Olds | 288 (100.0%) | 0 (0.0%) |
| 25 to 34 Year Olds | 247 (100.0%) | 0 (0.0%) |
| 35 Years and over | 185 (46.4%) | 214 (53.6%) |
| Total | 3,743 (85.2%) | 650 (14.8%) |
Educational Attainment by Field of Study in Salmon Creek
Business (890 | 15.6%), science & technology (754 | 13.2%), education (725 | 12.7%), engineering (639 | 11.2%), and social sciences (579 | 10.2%) are the most common fields of study among 5,697 individuals in Salmon Creek who have obtained a bachelor's degree or higher.
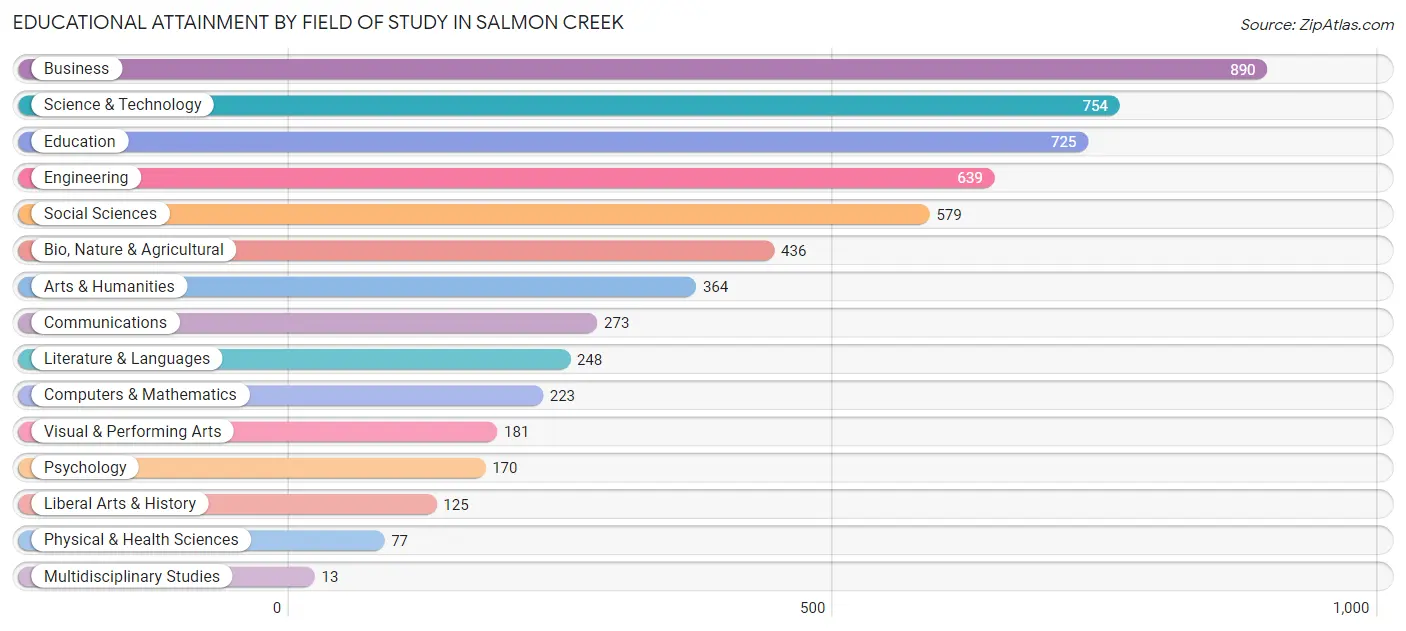
| Field of Study | # Graduates | % Graduates |
| Computers & Mathematics | 223 | 3.9% |
| Bio, Nature & Agricultural | 436 | 7.6% |
| Physical & Health Sciences | 77 | 1.3% |
| Psychology | 170 | 3.0% |
| Social Sciences | 579 | 10.2% |
| Engineering | 639 | 11.2% |
| Multidisciplinary Studies | 13 | 0.2% |
| Science & Technology | 754 | 13.2% |
| Business | 890 | 15.6% |
| Education | 725 | 12.7% |
| Literature & Languages | 248 | 4.3% |
| Liberal Arts & History | 125 | 2.2% |
| Visual & Performing Arts | 181 | 3.2% |
| Communications | 273 | 4.8% |
| Arts & Humanities | 364 | 6.4% |
| Total | 5,697 | 100.0% |
Transportation & Commute in Salmon Creek
Vehicle Availability by Sex in Salmon Creek
The most prevalent vehicle ownership categories in Salmon Creek are males with 2 vehicles (2,094, accounting for 40.6%) and females with 2 vehicles (1,845, making up 50.5%).
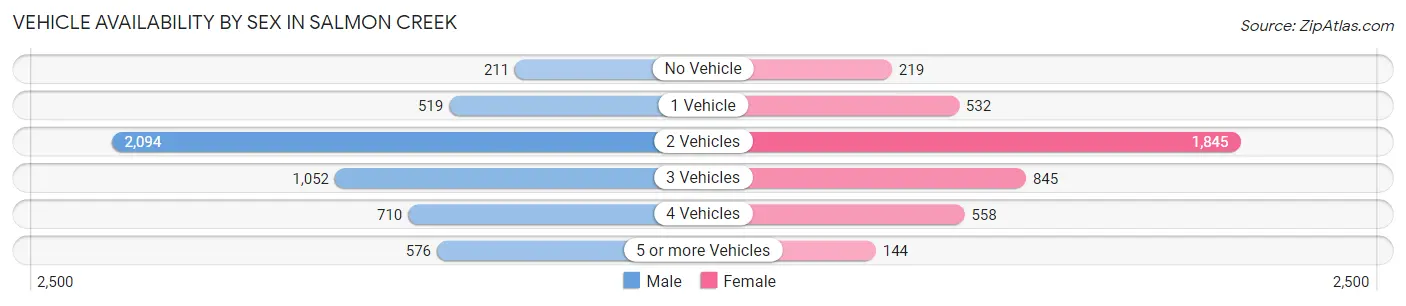
| Vehicles Available | Male | Female |
| No Vehicle | 211 (4.1%) | 219 (5.3%) |
| 1 Vehicle | 519 (10.1%) | 532 (12.8%) |
| 2 Vehicles | 2,094 (40.6%) | 1,845 (44.5%) |
| 3 Vehicles | 1,052 (20.4%) | 845 (20.4%) |
| 4 Vehicles | 710 (13.8%) | 558 (13.5%) |
| 5 or more Vehicles | 576 (11.2%) | 144 (3.5%) |
| Total | 5,162 (100.0%) | 4,143 (100.0%) |
Commute Time in Salmon Creek
The most frequently occuring commute durations in Salmon Creek are 15 to 19 minutes (1,318 commuters, 17.5%), 30 to 34 minutes (1,153 commuters, 15.3%), and 10 to 14 minutes (1,128 commuters, 15.0%).
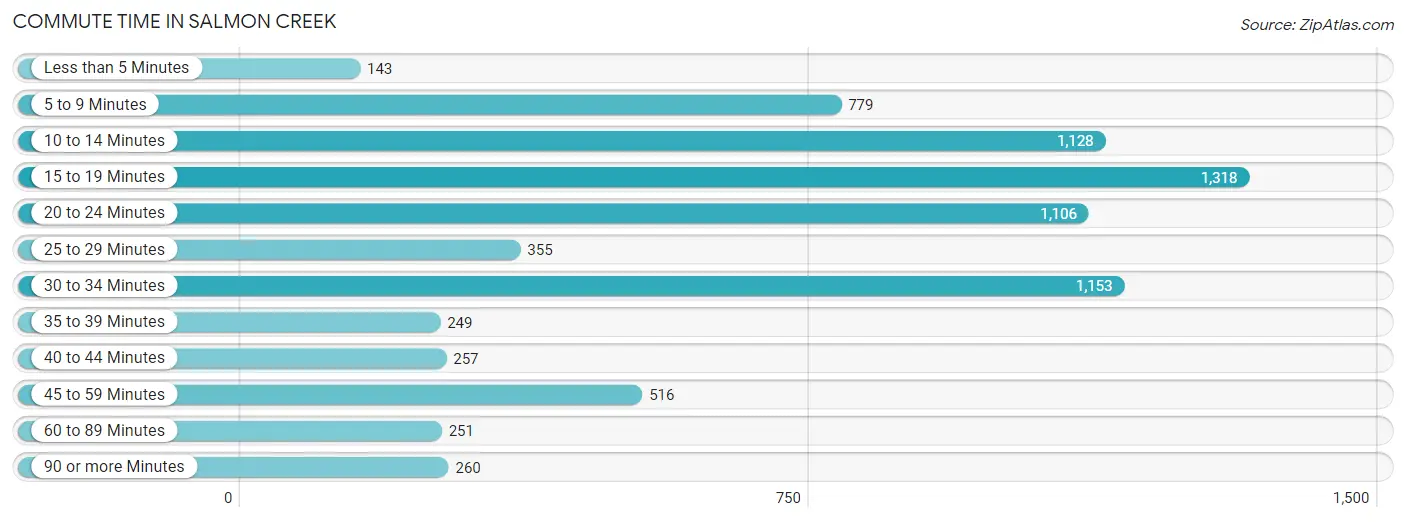
| Commute Time | # Commuters | % Commuters |
| Less than 5 Minutes | 143 | 1.9% |
| 5 to 9 Minutes | 779 | 10.4% |
| 10 to 14 Minutes | 1,128 | 15.0% |
| 15 to 19 Minutes | 1,318 | 17.5% |
| 20 to 24 Minutes | 1,106 | 14.7% |
| 25 to 29 Minutes | 355 | 4.7% |
| 30 to 34 Minutes | 1,153 | 15.3% |
| 35 to 39 Minutes | 249 | 3.3% |
| 40 to 44 Minutes | 257 | 3.4% |
| 45 to 59 Minutes | 516 | 6.9% |
| 60 to 89 Minutes | 251 | 3.3% |
| 90 or more Minutes | 260 | 3.5% |
Commute Time by Sex in Salmon Creek
The most common commute times in Salmon Creek are 15 to 19 minutes (816 commuters, 19.2%) for males and 10 to 14 minutes (607 commuters, 18.6%) for females.
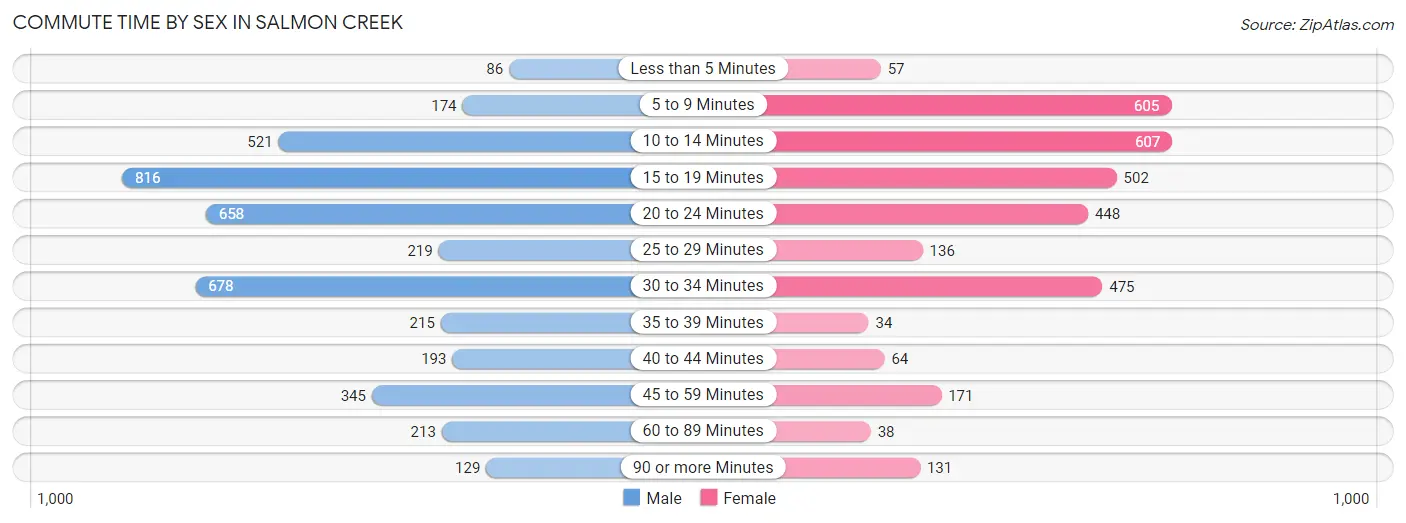
| Commute Time | Male | Female |
| Less than 5 Minutes | 86 (2.0%) | 57 (1.7%) |
| 5 to 9 Minutes | 174 (4.1%) | 605 (18.5%) |
| 10 to 14 Minutes | 521 (12.3%) | 607 (18.6%) |
| 15 to 19 Minutes | 816 (19.2%) | 502 (15.4%) |
| 20 to 24 Minutes | 658 (15.5%) | 448 (13.7%) |
| 25 to 29 Minutes | 219 (5.2%) | 136 (4.2%) |
| 30 to 34 Minutes | 678 (16.0%) | 475 (14.5%) |
| 35 to 39 Minutes | 215 (5.1%) | 34 (1.0%) |
| 40 to 44 Minutes | 193 (4.5%) | 64 (2.0%) |
| 45 to 59 Minutes | 345 (8.1%) | 171 (5.2%) |
| 60 to 89 Minutes | 213 (5.0%) | 38 (1.2%) |
| 90 or more Minutes | 129 (3.0%) | 131 (4.0%) |
Time of Departure to Work by Sex in Salmon Creek
The most frequent times of departure to work in Salmon Creek are 7:00 AM to 7:29 AM (548, 12.9%) for males and 6:30 AM to 6:59 AM (410, 12.6%) for females.
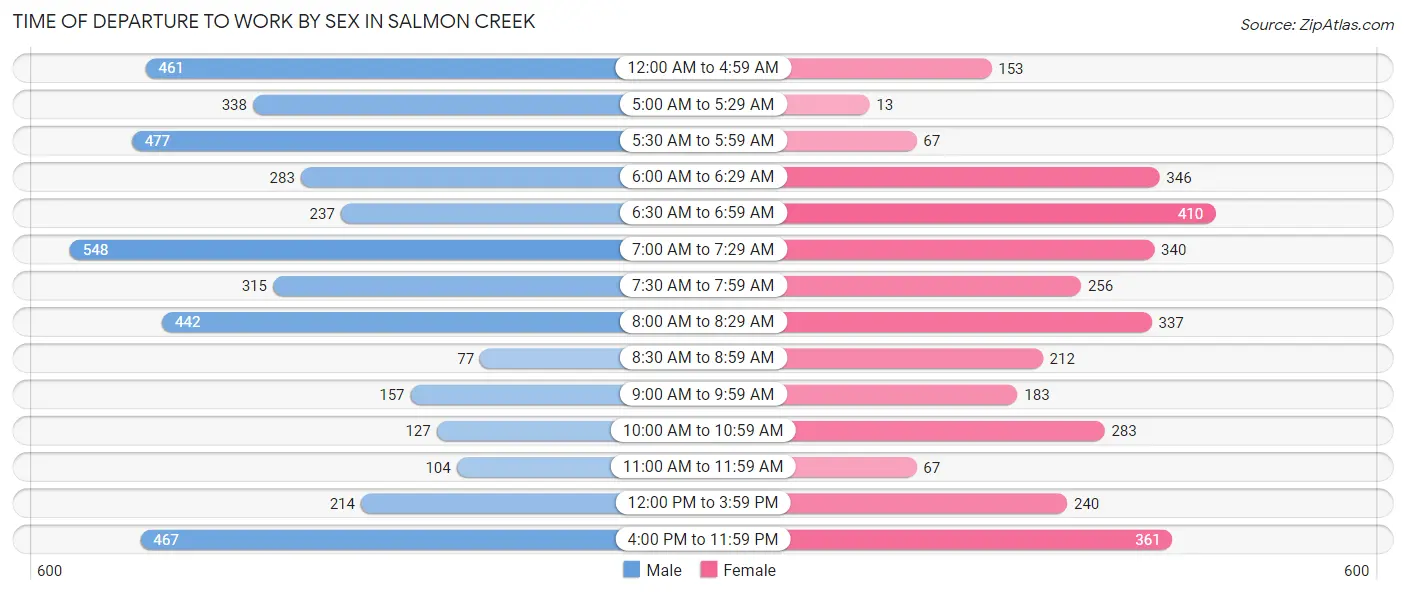
| Time of Departure | Male | Female |
| 12:00 AM to 4:59 AM | 461 (10.8%) | 153 (4.7%) |
| 5:00 AM to 5:29 AM | 338 (8.0%) | 13 (0.4%) |
| 5:30 AM to 5:59 AM | 477 (11.2%) | 67 (2.1%) |
| 6:00 AM to 6:29 AM | 283 (6.7%) | 346 (10.6%) |
| 6:30 AM to 6:59 AM | 237 (5.6%) | 410 (12.6%) |
| 7:00 AM to 7:29 AM | 548 (12.9%) | 340 (10.4%) |
| 7:30 AM to 7:59 AM | 315 (7.4%) | 256 (7.8%) |
| 8:00 AM to 8:29 AM | 442 (10.4%) | 337 (10.3%) |
| 8:30 AM to 8:59 AM | 77 (1.8%) | 212 (6.5%) |
| 9:00 AM to 9:59 AM | 157 (3.7%) | 183 (5.6%) |
| 10:00 AM to 10:59 AM | 127 (3.0%) | 283 (8.7%) |
| 11:00 AM to 11:59 AM | 104 (2.5%) | 67 (2.1%) |
| 12:00 PM to 3:59 PM | 214 (5.0%) | 240 (7.3%) |
| 4:00 PM to 11:59 PM | 467 (11.0%) | 361 (11.1%) |
| Total | 4,247 (100.0%) | 3,268 (100.0%) |
Housing Occupancy in Salmon Creek
Occupancy by Ownership in Salmon Creek
Of the total 7,970 dwellings in Salmon Creek, owner-occupied units account for 5,899 (74.0%), while renter-occupied units make up 2,071 (26.0%).
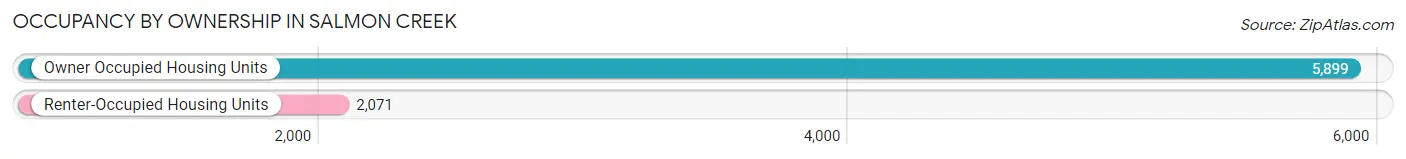
| Occupancy | # Housing Units | % Housing Units |
| Owner Occupied Housing Units | 5,899 | 74.0% |
| Renter-Occupied Housing Units | 2,071 | 26.0% |
| Total Occupied Housing Units | 7,970 | 100.0% |
Occupancy by Household Size in Salmon Creek
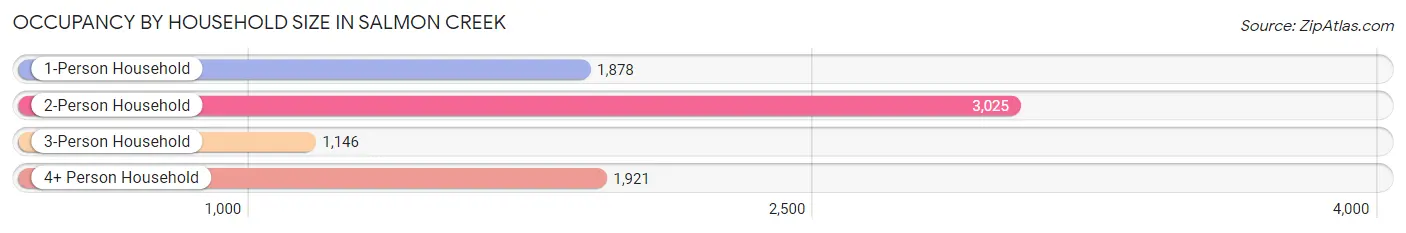
| Household Size | # Housing Units | % Housing Units |
| 1-Person Household | 1,878 | 23.6% |
| 2-Person Household | 3,025 | 38.0% |
| 3-Person Household | 1,146 | 14.4% |
| 4+ Person Household | 1,921 | 24.1% |
| Total Housing Units | 7,970 | 100.0% |
Occupancy by Ownership by Household Size in Salmon Creek
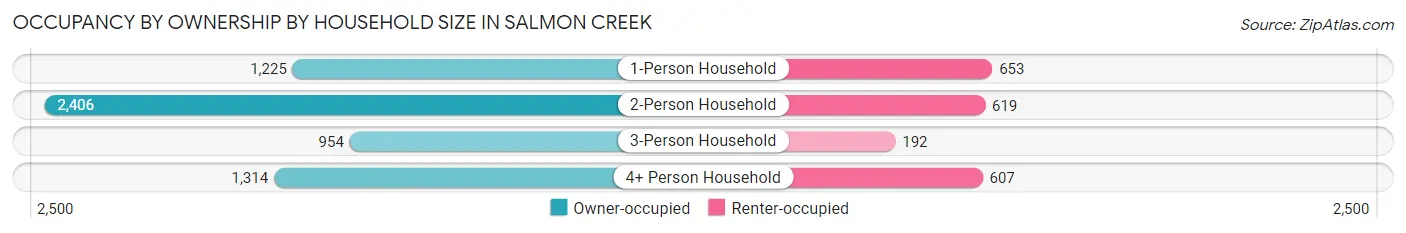
| Household Size | Owner-occupied | Renter-occupied |
| 1-Person Household | 1,225 (65.2%) | 653 (34.8%) |
| 2-Person Household | 2,406 (79.5%) | 619 (20.5%) |
| 3-Person Household | 954 (83.3%) | 192 (16.8%) |
| 4+ Person Household | 1,314 (68.4%) | 607 (31.6%) |
| Total Housing Units | 5,899 (74.0%) | 2,071 (26.0%) |
Occupancy by Educational Attainment in Salmon Creek
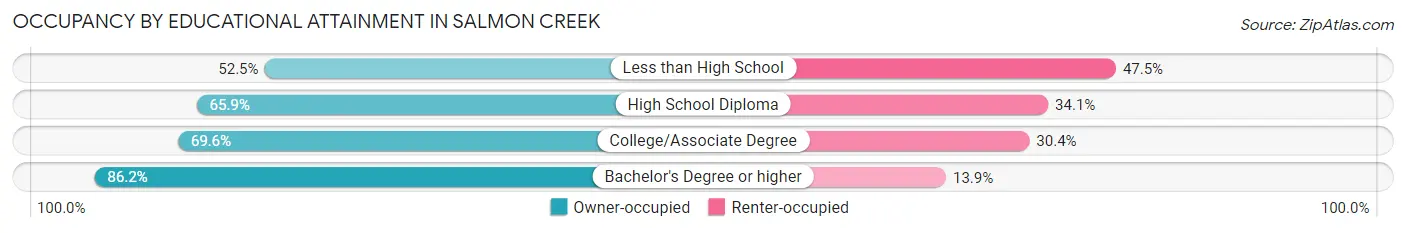
| Household Size | Owner-occupied | Renter-occupied |
| Less than High School | 245 (52.5%) | 222 (47.5%) |
| High School Diploma | 891 (65.9%) | 461 (34.1%) |
| College/Associate Degree | 2,257 (69.6%) | 985 (30.4%) |
| Bachelor's Degree or higher | 2,506 (86.2%) | 403 (13.9%) |
Occupancy by Age of Householder in Salmon Creek
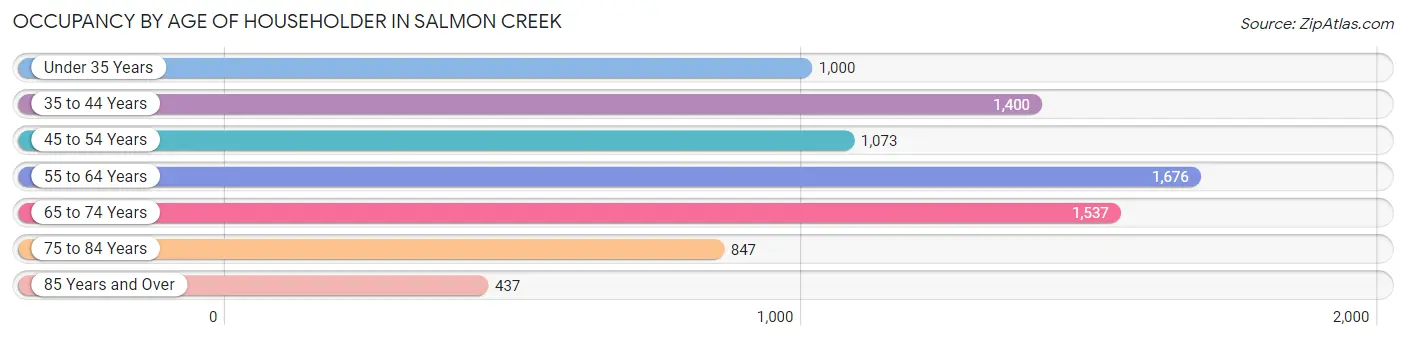
| Age Bracket | # Households | % Households |
| Under 35 Years | 1,000 | 12.6% |
| 35 to 44 Years | 1,400 | 17.6% |
| 45 to 54 Years | 1,073 | 13.5% |
| 55 to 64 Years | 1,676 | 21.0% |
| 65 to 74 Years | 1,537 | 19.3% |
| 75 to 84 Years | 847 | 10.6% |
| 85 Years and Over | 437 | 5.5% |
| Total | 7,970 | 100.0% |
Housing Finances in Salmon Creek
Median Income by Occupancy in Salmon Creek
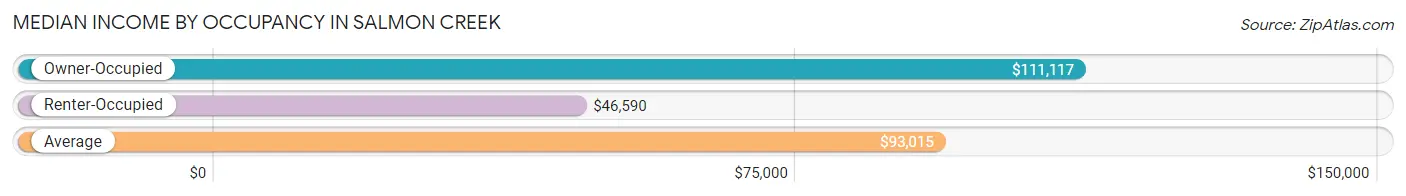
| Occupancy Type | # Households | Median Income |
| Owner-Occupied | 5,899 (74.0%) | $111,117 |
| Renter-Occupied | 2,071 (26.0%) | $46,590 |
| Average | 7,970 (100.0%) | $93,015 |
Occupancy by Householder Income Bracket in Salmon Creek
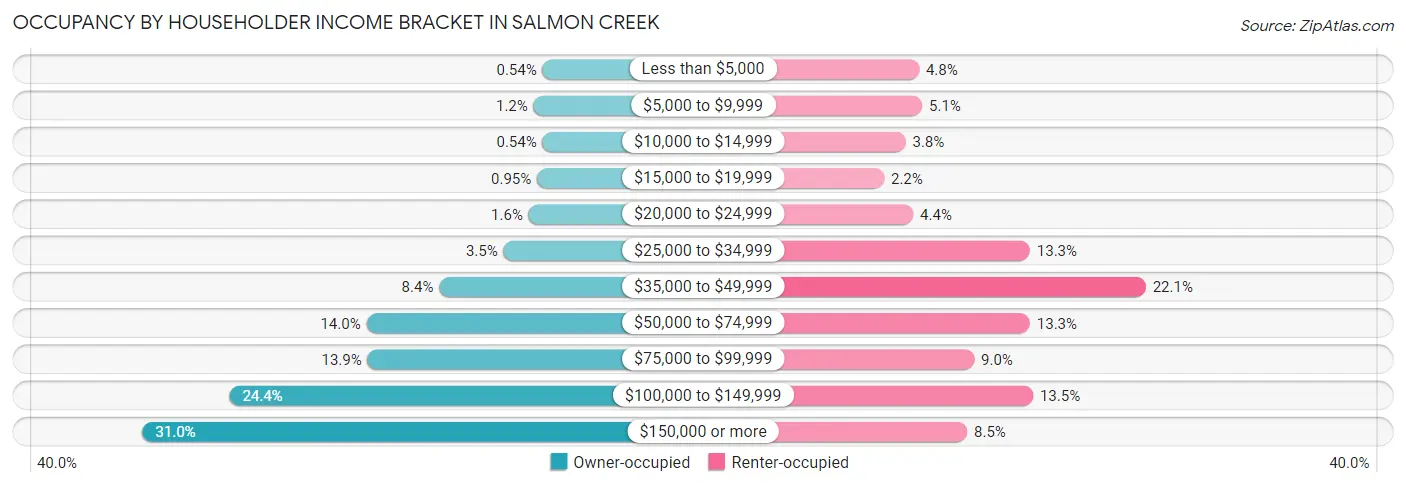
| Income Bracket | Owner-occupied | Renter-occupied |
| Less than $5,000 | 32 (0.5%) | 100 (4.8%) |
| $5,000 to $9,999 | 72 (1.2%) | 105 (5.1%) |
| $10,000 to $14,999 | 32 (0.5%) | 79 (3.8%) |
| $15,000 to $19,999 | 56 (0.9%) | 45 (2.2%) |
| $20,000 to $24,999 | 94 (1.6%) | 91 (4.4%) |
| $25,000 to $34,999 | 207 (3.5%) | 275 (13.3%) |
| $35,000 to $49,999 | 496 (8.4%) | 458 (22.1%) |
| $50,000 to $74,999 | 823 (14.0%) | 275 (13.3%) |
| $75,000 to $99,999 | 818 (13.9%) | 187 (9.0%) |
| $100,000 to $149,999 | 1,439 (24.4%) | 280 (13.5%) |
| $150,000 or more | 1,830 (31.0%) | 176 (8.5%) |
| Total | 5,899 (100.0%) | 2,071 (100.0%) |
Monthly Housing Cost Tiers in Salmon Creek
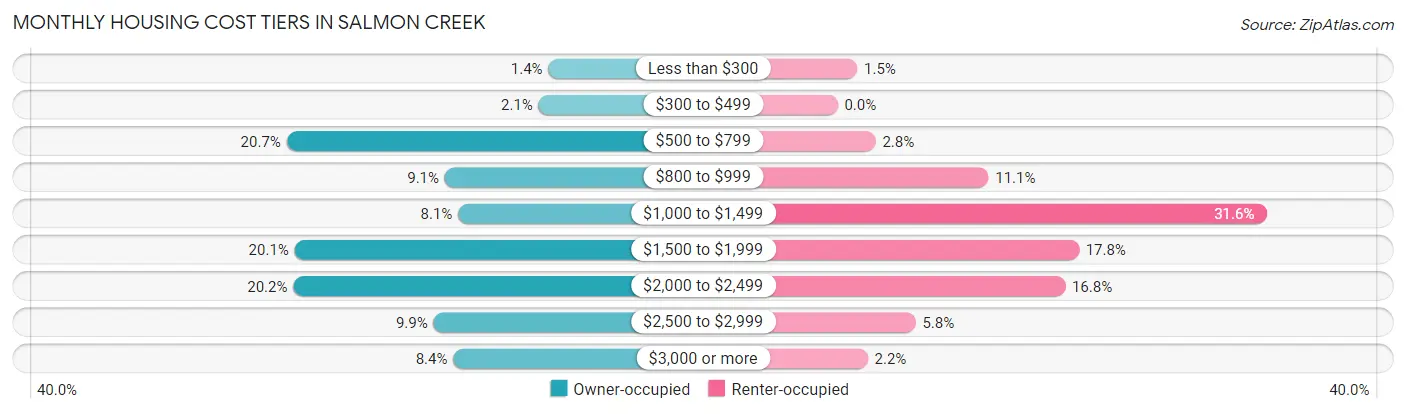
| Monthly Cost | Owner-occupied | Renter-occupied |
| Less than $300 | 84 (1.4%) | 30 (1.5%) |
| $300 to $499 | 126 (2.1%) | 0 (0.0%) |
| $500 to $799 | 1,221 (20.7%) | 58 (2.8%) |
| $800 to $999 | 534 (9.0%) | 230 (11.1%) |
| $1,000 to $1,499 | 476 (8.1%) | 654 (31.6%) |
| $1,500 to $1,999 | 1,186 (20.1%) | 368 (17.8%) |
| $2,000 to $2,499 | 1,192 (20.2%) | 347 (16.8%) |
| $2,500 to $2,999 | 583 (9.9%) | 119 (5.8%) |
| $3,000 or more | 497 (8.4%) | 46 (2.2%) |
| Total | 5,899 (100.0%) | 2,071 (100.0%) |
Physical Housing Characteristics in Salmon Creek
Housing Structures in Salmon Creek
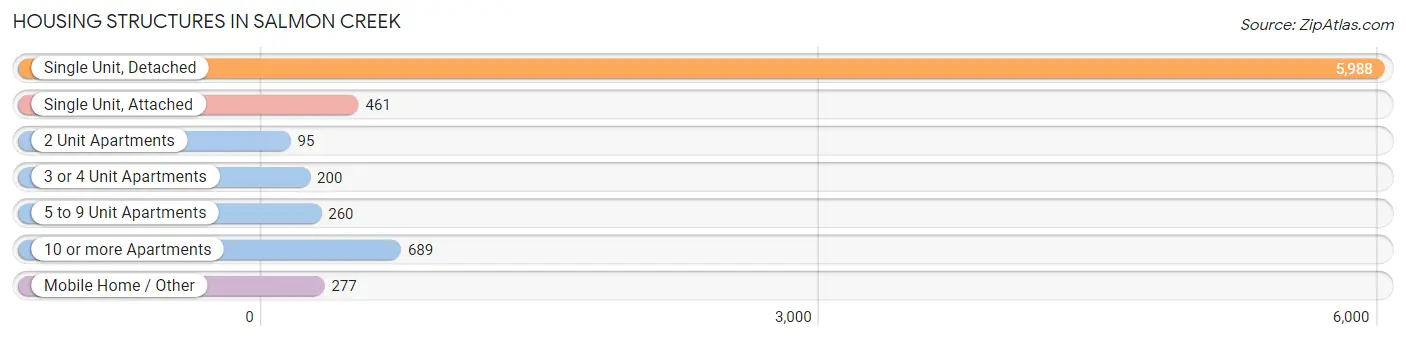
| Structure Type | # Housing Units | % Housing Units |
| Single Unit, Detached | 5,988 | 75.1% |
| Single Unit, Attached | 461 | 5.8% |
| 2 Unit Apartments | 95 | 1.2% |
| 3 or 4 Unit Apartments | 200 | 2.5% |
| 5 to 9 Unit Apartments | 260 | 3.3% |
| 10 or more Apartments | 689 | 8.6% |
| Mobile Home / Other | 277 | 3.5% |
| Total | 7,970 | 100.0% |
Housing Structures by Occupancy in Salmon Creek
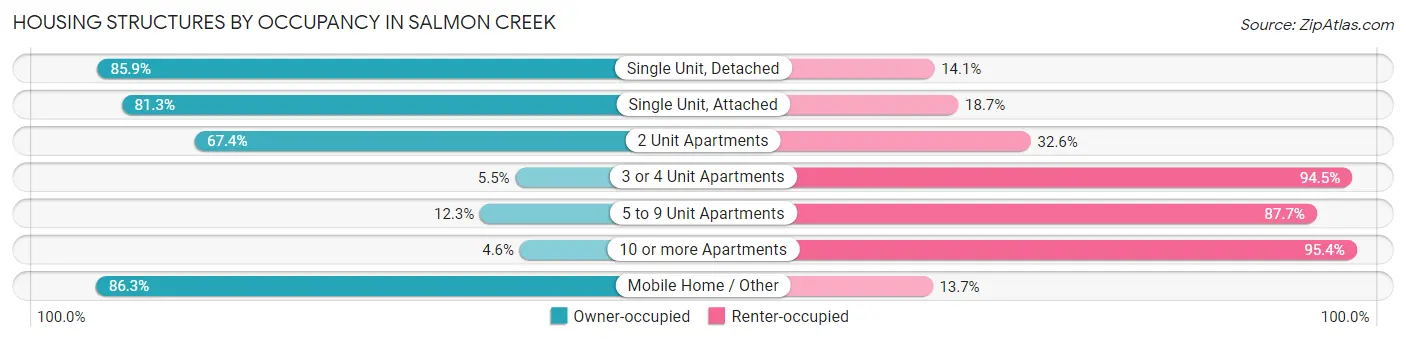
| Structure Type | Owner-occupied | Renter-occupied |
| Single Unit, Detached | 5,146 (85.9%) | 842 (14.1%) |
| Single Unit, Attached | 375 (81.3%) | 86 (18.7%) |
| 2 Unit Apartments | 64 (67.4%) | 31 (32.6%) |
| 3 or 4 Unit Apartments | 11 (5.5%) | 189 (94.5%) |
| 5 to 9 Unit Apartments | 32 (12.3%) | 228 (87.7%) |
| 10 or more Apartments | 32 (4.6%) | 657 (95.4%) |
| Mobile Home / Other | 239 (86.3%) | 38 (13.7%) |
| Total | 5,899 (74.0%) | 2,071 (26.0%) |
Housing Structures by Number of Rooms in Salmon Creek
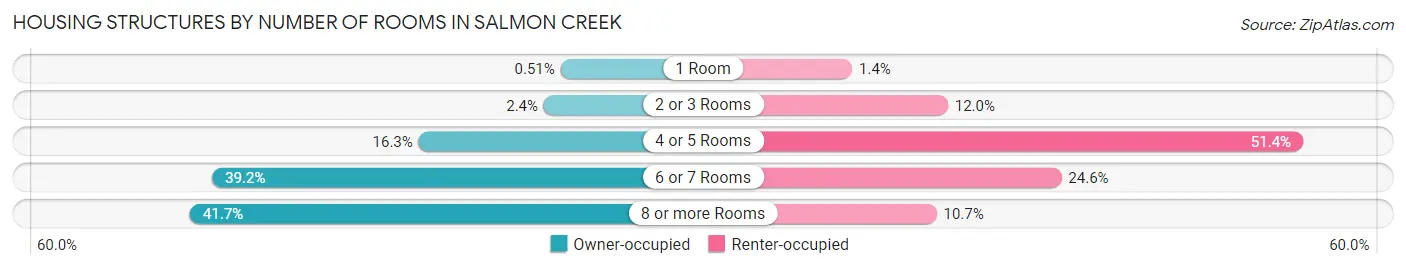
| Number of Rooms | Owner-occupied | Renter-occupied |
| 1 Room | 30 (0.5%) | 28 (1.3%) |
| 2 or 3 Rooms | 140 (2.4%) | 248 (12.0%) |
| 4 or 5 Rooms | 960 (16.3%) | 1,064 (51.4%) |
| 6 or 7 Rooms | 2,312 (39.2%) | 509 (24.6%) |
| 8 or more Rooms | 2,457 (41.6%) | 222 (10.7%) |
| Total | 5,899 (100.0%) | 2,071 (100.0%) |
Housing Structure by Heating Type in Salmon Creek
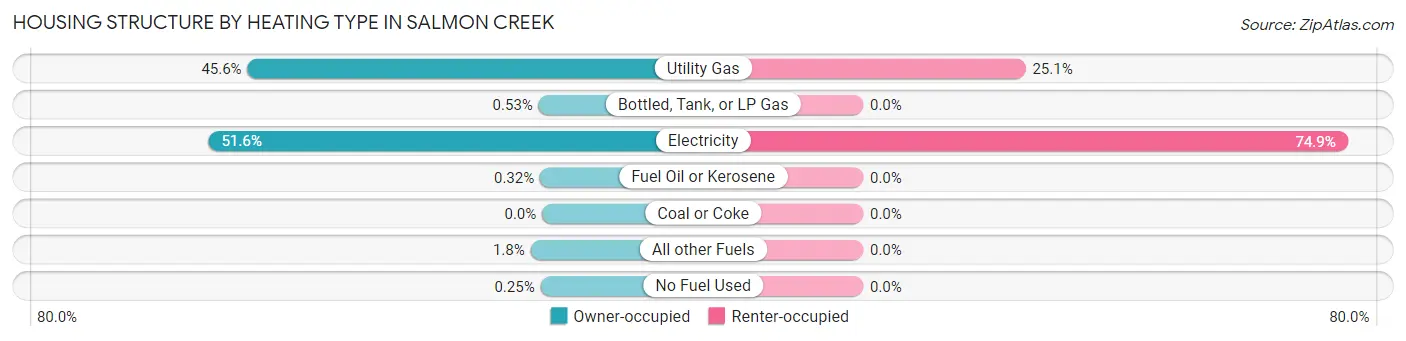
| Heating Type | Owner-occupied | Renter-occupied |
| Utility Gas | 2,687 (45.6%) | 520 (25.1%) |
| Bottled, Tank, or LP Gas | 31 (0.5%) | 0 (0.0%) |
| Electricity | 3,042 (51.6%) | 1,551 (74.9%) |
| Fuel Oil or Kerosene | 19 (0.3%) | 0 (0.0%) |
| Coal or Coke | 0 (0.0%) | 0 (0.0%) |
| All other Fuels | 105 (1.8%) | 0 (0.0%) |
| No Fuel Used | 15 (0.3%) | 0 (0.0%) |
| Total | 5,899 (100.0%) | 2,071 (100.0%) |
Household Vehicle Usage in Salmon Creek
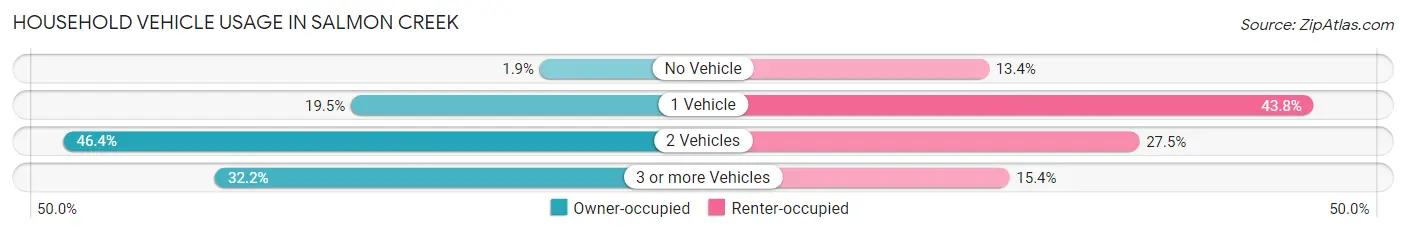
| Vehicles per Household | Owner-occupied | Renter-occupied |
| No Vehicle | 112 (1.9%) | 278 (13.4%) |
| 1 Vehicle | 1,152 (19.5%) | 906 (43.8%) |
| 2 Vehicles | 2,735 (46.4%) | 569 (27.5%) |
| 3 or more Vehicles | 1,900 (32.2%) | 318 (15.3%) |
| Total | 5,899 (100.0%) | 2,071 (100.0%) |
Real Estate & Mortgages in Salmon Creek
Real Estate and Mortgage Overview in Salmon Creek
| Characteristic | Without Mortgage | With Mortgage |
| Housing Units | 1,814 | 4,085 |
| Median Property Value | $439,900 | $465,500 |
| Median Household Income | $77,250 | $1,497 |
| Monthly Housing Costs | $701 | $474 |
| Real Estate Taxes | $4,190 | $43 |
Property Value by Mortgage Status in Salmon Creek
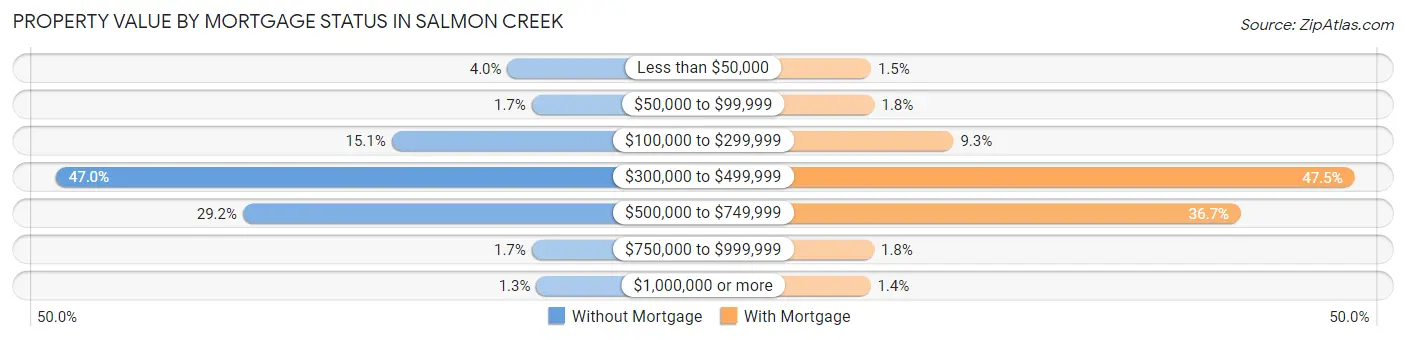
| Property Value | Without Mortgage | With Mortgage |
| Less than $50,000 | 73 (4.0%) | 60 (1.5%) |
| $50,000 to $99,999 | 31 (1.7%) | 74 (1.8%) |
| $100,000 to $299,999 | 273 (15.0%) | 381 (9.3%) |
| $300,000 to $499,999 | 853 (47.0%) | 1,941 (47.5%) |
| $500,000 to $749,999 | 530 (29.2%) | 1,499 (36.7%) |
| $750,000 to $999,999 | 31 (1.7%) | 72 (1.8%) |
| $1,000,000 or more | 23 (1.3%) | 58 (1.4%) |
| Total | 1,814 (100.0%) | 4,085 (100.0%) |
Household Income by Mortgage Status in Salmon Creek
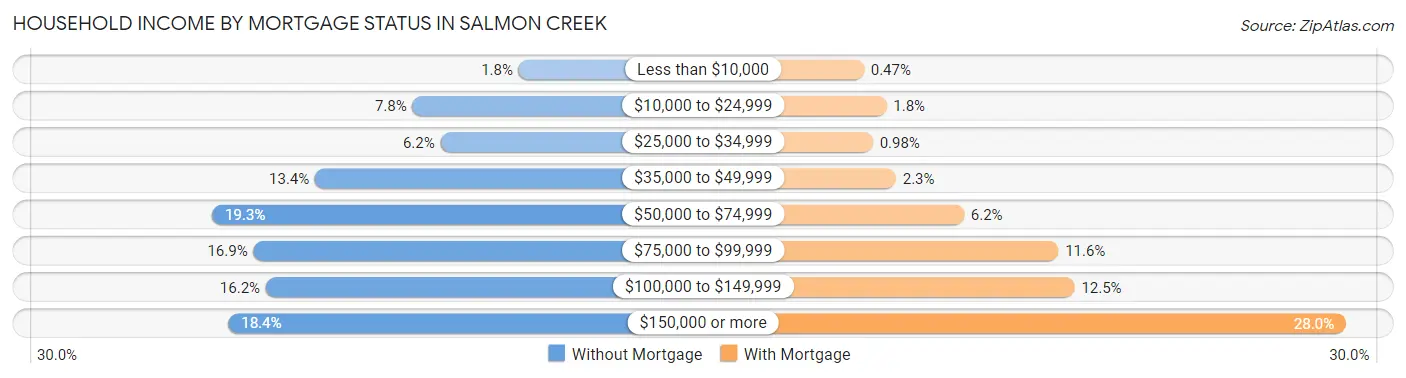
| Household Income | Without Mortgage | With Mortgage |
| Less than $10,000 | 32 (1.8%) | 19 (0.5%) |
| $10,000 to $24,999 | 142 (7.8%) | 72 (1.8%) |
| $25,000 to $34,999 | 113 (6.2%) | 40 (1.0%) |
| $35,000 to $49,999 | 243 (13.4%) | 94 (2.3%) |
| $50,000 to $74,999 | 350 (19.3%) | 253 (6.2%) |
| $75,000 to $99,999 | 307 (16.9%) | 473 (11.6%) |
| $100,000 to $149,999 | 294 (16.2%) | 511 (12.5%) |
| $150,000 or more | 333 (18.4%) | 1,145 (28.0%) |
| Total | 1,814 (100.0%) | 4,085 (100.0%) |
Property Value to Household Income Ratio in Salmon Creek
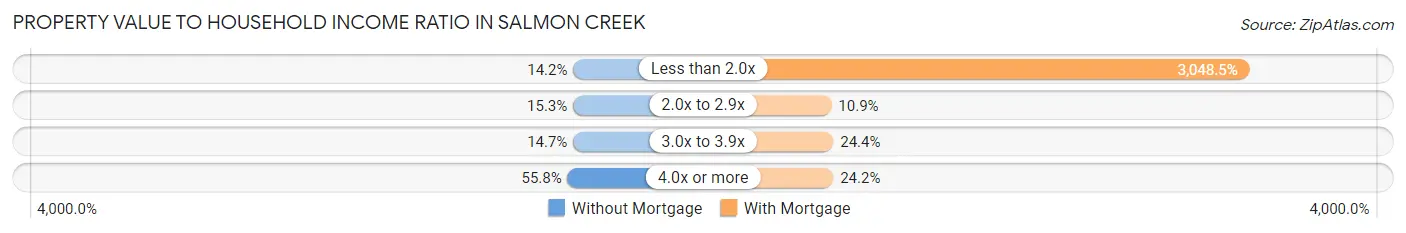
| Value-to-Income Ratio | Without Mortgage | With Mortgage |
| Less than 2.0x | 257 (14.2%) | 124,530 (3,048.5%) |
| 2.0x to 2.9x | 278 (15.3%) | 446 (10.9%) |
| 3.0x to 3.9x | 266 (14.7%) | 996 (24.4%) |
| 4.0x or more | 1,013 (55.8%) | 989 (24.2%) |
| Total | 1,814 (100.0%) | 4,085 (100.0%) |
Real Estate Taxes by Mortgage Status in Salmon Creek
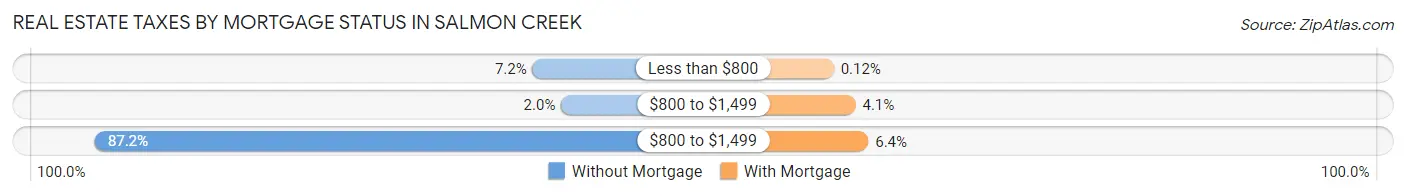
| Property Taxes | Without Mortgage | With Mortgage |
| Less than $800 | 131 (7.2%) | 5 (0.1%) |
| $800 to $1,499 | 36 (2.0%) | 168 (4.1%) |
| $800 to $1,499 | 1,581 (87.2%) | 263 (6.4%) |
| Total | 1,814 (100.0%) | 4,085 (100.0%) |
Health & Disability in Salmon Creek
Health Insurance Coverage by Age in Salmon Creek
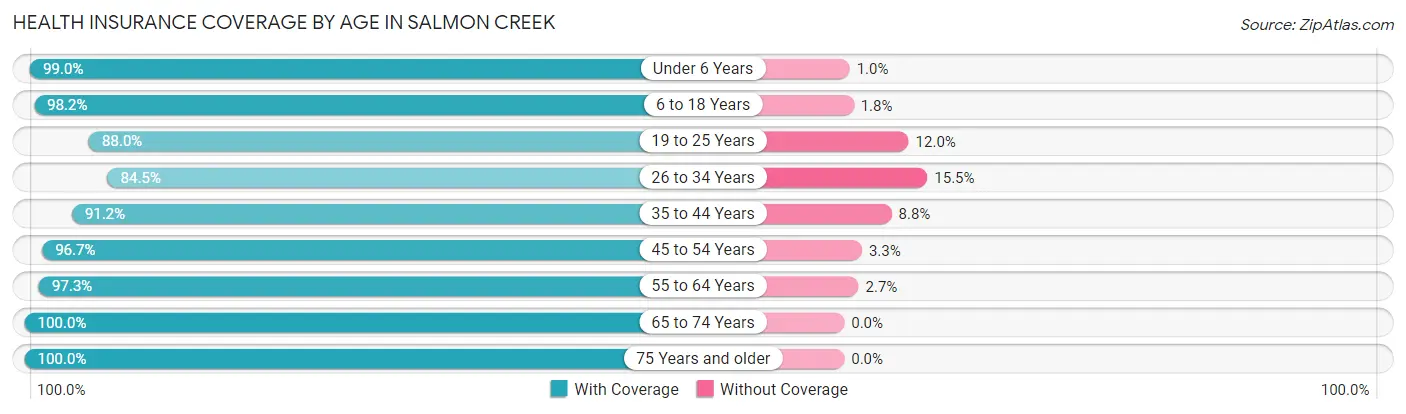
| Age Bracket | With Coverage | Without Coverage |
| Under 6 Years | 1,368 (99.0%) | 14 (1.0%) |
| 6 to 18 Years | 3,066 (98.2%) | 55 (1.8%) |
| 19 to 25 Years | 1,283 (88.0%) | 175 (12.0%) |
| 26 to 34 Years | 1,642 (84.5%) | 301 (15.5%) |
| 35 to 44 Years | 2,263 (91.2%) | 219 (8.8%) |
| 45 to 54 Years | 2,558 (96.7%) | 87 (3.3%) |
| 55 to 64 Years | 2,696 (97.3%) | 74 (2.7%) |
| 65 to 74 Years | 2,652 (100.0%) | 0 (0.0%) |
| 75 Years and older | 1,851 (100.0%) | 0 (0.0%) |
| Total | 19,379 (95.4%) | 925 (4.6%) |
Health Insurance Coverage by Citizenship Status in Salmon Creek
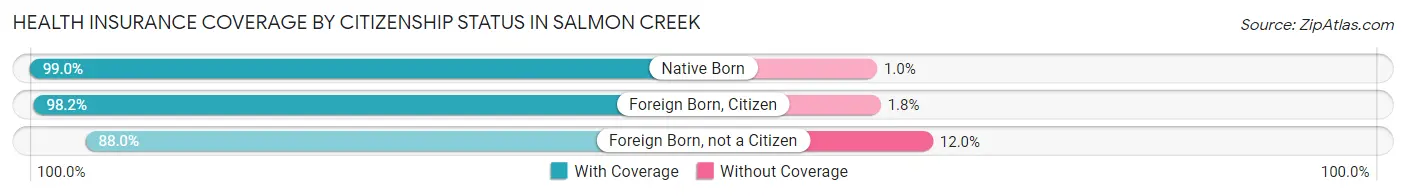
| Citizenship Status | With Coverage | Without Coverage |
| Native Born | 1,368 (99.0%) | 14 (1.0%) |
| Foreign Born, Citizen | 3,066 (98.2%) | 55 (1.8%) |
| Foreign Born, not a Citizen | 1,283 (88.0%) | 175 (12.0%) |
Health Insurance Coverage by Household Income in Salmon Creek
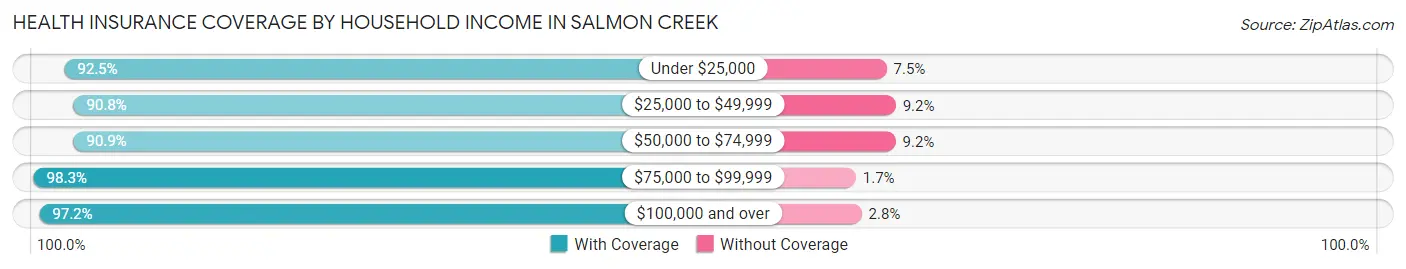
| Household Income | With Coverage | Without Coverage |
| Under $25,000 | 1,005 (92.5%) | 81 (7.5%) |
| $25,000 to $49,999 | 2,647 (90.8%) | 267 (9.2%) |
| $50,000 to $74,999 | 2,255 (90.8%) | 227 (9.1%) |
| $75,000 to $99,999 | 2,839 (98.3%) | 49 (1.7%) |
| $100,000 and over | 10,553 (97.2%) | 301 (2.8%) |
Public vs Private Health Insurance Coverage by Age in Salmon Creek
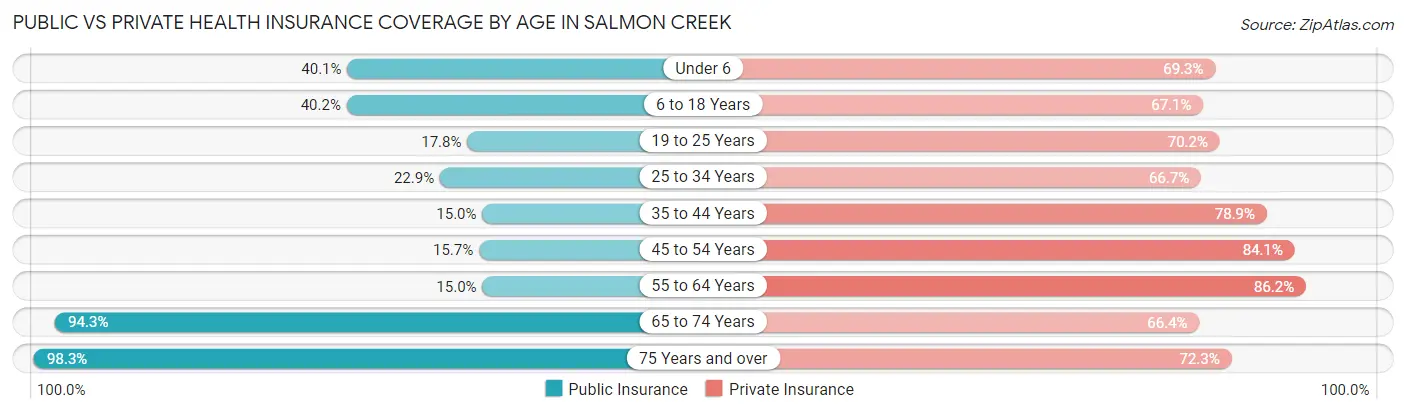
| Age Bracket | Public Insurance | Private Insurance |
| Under 6 | 554 (40.1%) | 958 (69.3%) |
| 6 to 18 Years | 1,255 (40.2%) | 2,094 (67.1%) |
| 19 to 25 Years | 260 (17.8%) | 1,023 (70.2%) |
| 25 to 34 Years | 445 (22.9%) | 1,296 (66.7%) |
| 35 to 44 Years | 373 (15.0%) | 1,958 (78.9%) |
| 45 to 54 Years | 414 (15.7%) | 2,224 (84.1%) |
| 55 to 64 Years | 416 (15.0%) | 2,387 (86.2%) |
| 65 to 74 Years | 2,502 (94.3%) | 1,760 (66.4%) |
| 75 Years and over | 1,819 (98.3%) | 1,339 (72.3%) |
| Total | 8,038 (39.6%) | 15,039 (74.1%) |
Disability Status by Sex by Age in Salmon Creek
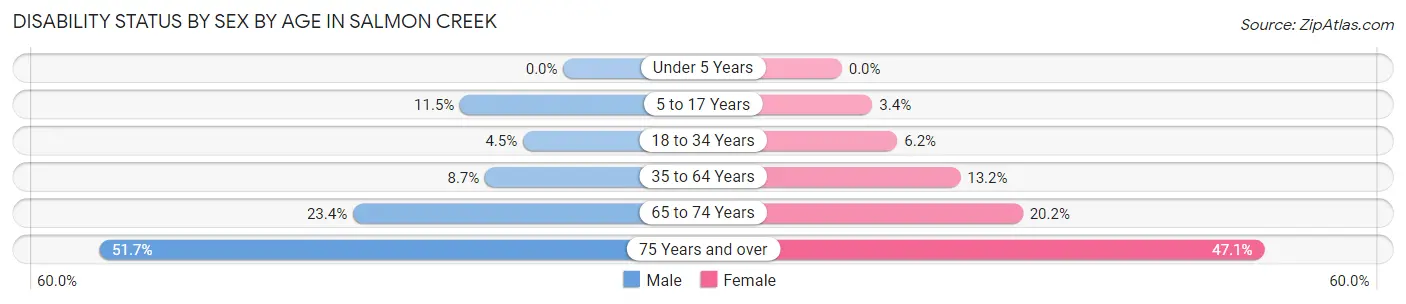
| Age Bracket | Male | Female |
| Under 5 Years | 0 (0.0%) | 0 (0.0%) |
| 5 to 17 Years | 187 (11.5%) | 47 (3.4%) |
| 18 to 34 Years | 90 (4.5%) | 107 (6.2%) |
| 35 to 64 Years | 321 (8.7%) | 556 (13.2%) |
| 65 to 74 Years | 305 (23.4%) | 272 (20.2%) |
| 75 Years and over | 455 (51.7%) | 457 (47.1%) |
Disability Class by Sex by Age in Salmon Creek
Disability Class: Hearing Difficulty
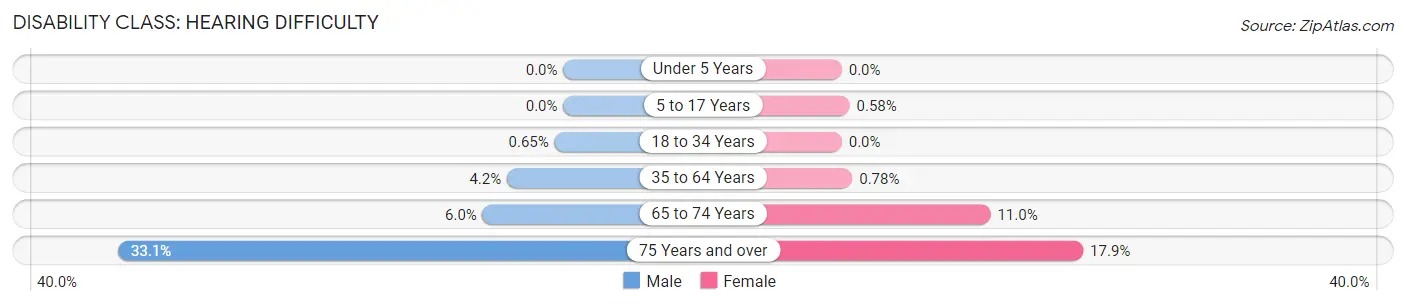
| Age Bracket | Male | Female |
| Under 5 Years | 0 (0.0%) | 0 (0.0%) |
| 5 to 17 Years | 0 (0.0%) | 8 (0.6%) |
| 18 to 34 Years | 13 (0.6%) | 0 (0.0%) |
| 35 to 64 Years | 154 (4.2%) | 33 (0.8%) |
| 65 to 74 Years | 78 (6.0%) | 149 (11.0%) |
| 75 Years and over | 291 (33.1%) | 174 (17.9%) |
Disability Class: Vision Difficulty
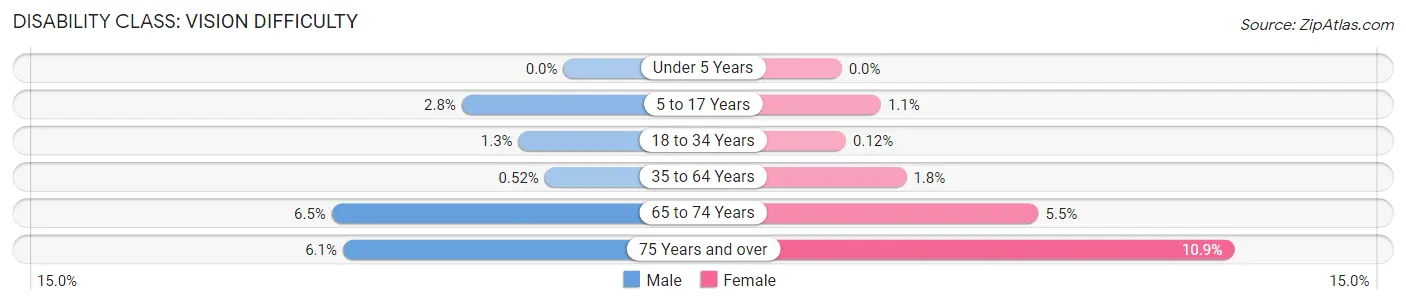
| Age Bracket | Male | Female |
| Under 5 Years | 0 (0.0%) | 0 (0.0%) |
| 5 to 17 Years | 46 (2.8%) | 15 (1.1%) |
| 18 to 34 Years | 25 (1.3%) | 2 (0.1%) |
| 35 to 64 Years | 19 (0.5%) | 76 (1.8%) |
| 65 to 74 Years | 84 (6.5%) | 74 (5.5%) |
| 75 Years and over | 54 (6.1%) | 106 (10.9%) |
Disability Class: Cognitive Difficulty
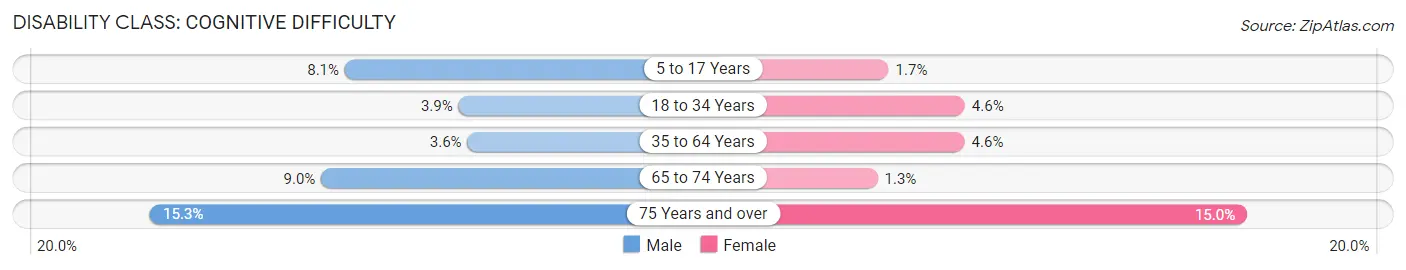
| Age Bracket | Male | Female |
| 5 to 17 Years | 132 (8.1%) | 24 (1.7%) |
| 18 to 34 Years | 78 (3.9%) | 79 (4.6%) |
| 35 to 64 Years | 131 (3.6%) | 192 (4.6%) |
| 65 to 74 Years | 117 (9.0%) | 18 (1.3%) |
| 75 Years and over | 135 (15.3%) | 146 (15.0%) |
Disability Class: Ambulatory Difficulty
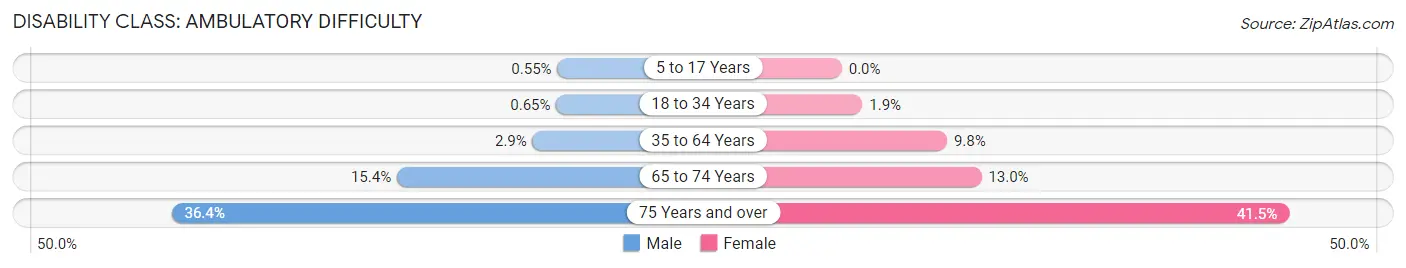
| Age Bracket | Male | Female |
| 5 to 17 Years | 9 (0.5%) | 0 (0.0%) |
| 18 to 34 Years | 13 (0.6%) | 33 (1.9%) |
| 35 to 64 Years | 105 (2.9%) | 411 (9.8%) |
| 65 to 74 Years | 201 (15.4%) | 175 (13.0%) |
| 75 Years and over | 320 (36.4%) | 403 (41.5%) |
Disability Class: Self-Care Difficulty
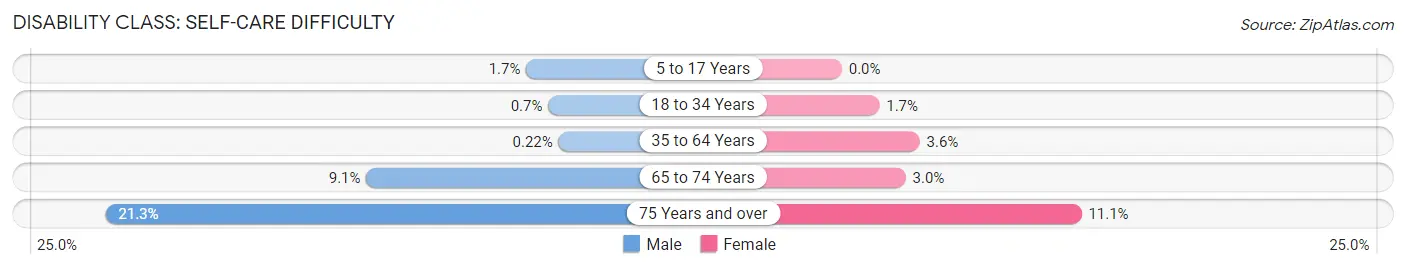
| Age Bracket | Male | Female |
| 5 to 17 Years | 28 (1.7%) | 0 (0.0%) |
| 18 to 34 Years | 14 (0.7%) | 30 (1.7%) |
| 35 to 64 Years | 8 (0.2%) | 152 (3.6%) |
| 65 to 74 Years | 119 (9.1%) | 40 (3.0%) |
| 75 Years and over | 187 (21.2%) | 108 (11.1%) |
Technology Access in Salmon Creek
Computing Device Access in Salmon Creek
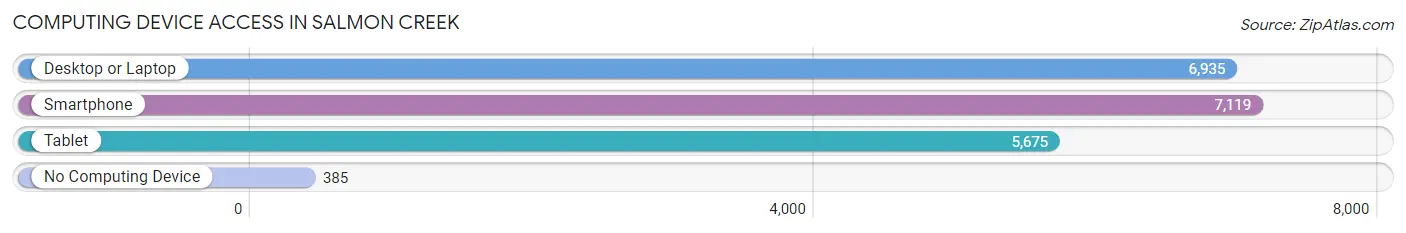
| Device Type | # Households | % Households |
| Desktop or Laptop | 6,935 | 87.0% |
| Smartphone | 7,119 | 89.3% |
| Tablet | 5,675 | 71.2% |
| No Computing Device | 385 | 4.8% |
| Total | 7,970 | 100.0% |
Internet Access in Salmon Creek
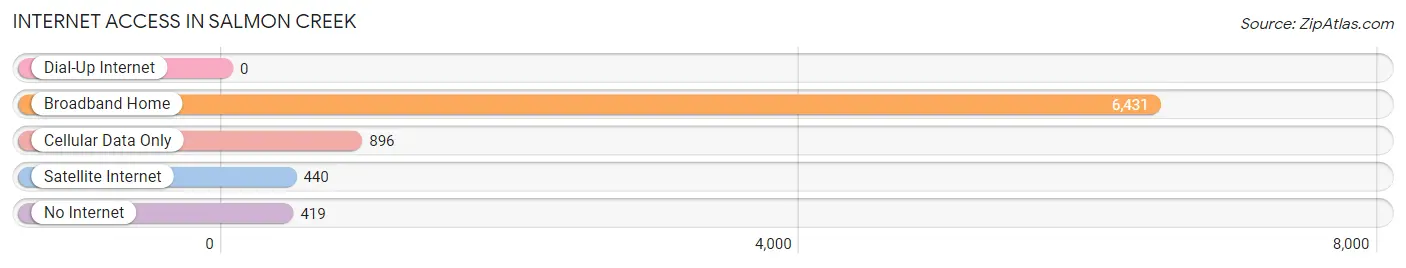
| Internet Type | # Households | % Households |
| Dial-Up Internet | 0 | 0.0% |
| Broadband Home | 6,431 | 80.7% |
| Cellular Data Only | 896 | 11.2% |
| Satellite Internet | 440 | 5.5% |
| No Internet | 419 | 5.3% |
| Total | 7,970 | 100.0% |
Salmon Creek Summary
Salmon Creek is a census-designated place (CDP) located in Clark County, Washington, United States. The population was estimated to be 22,845 in 2019. It is located in the northern part of the county, just north of Vancouver.
History
The area that is now Salmon Creek was originally inhabited by the Chinook and Klickitat tribes. The first European settlers arrived in the area in the late 1800s, and the area was officially incorporated as a town in 1891. The town was named after the nearby Salmon Creek, which was named for the abundance of salmon that used to swim up the creek to spawn.
The area was primarily agricultural until the 1950s, when the population began to grow rapidly due to the influx of people from the nearby cities of Vancouver and Portland. The area was annexed by the city of Vancouver in 1965, and the population continued to grow.
Geography
Salmon Creek is located in northern Clark County, just north of Vancouver. It is bordered to the north by the Columbia River, to the east by the city of Vancouver, to the south by Hazel Dell, and to the west by the city of Battle Ground. The area is mostly flat, with an elevation of about 200 feet above sea level.
The climate in Salmon Creek is mild and temperate, with warm summers and cool winters. The average annual temperature is around 50°F, and the average annual precipitation is around 40 inches.
Economy
The economy of Salmon Creek is largely based on retail and services. The area is home to several large shopping centers, including the Salmon Creek Town Center and the Salmon Creek Plaza. There are also several restaurants, banks, and other businesses located in the area.
The area is also home to several large employers, including PeaceHealth Southwest Medical Center, Fred Meyer, and Walmart. The area is also home to several educational institutions, including Washington State University Vancouver and Clark College.
Demographics
As of the 2019 census, the population of Salmon Creek was estimated to be 22,845. The racial makeup of the area was 79.3% White, 8.2% Hispanic or Latino, 6.2% Asian, 3.2% African American, and 2.9% Native American. The median household income was $60,945, and the median home value was $310,000.
Conclusion
Salmon Creek is a census-designated place located in Clark County, Washington. The area was originally inhabited by the Chinook and Klickitat tribes, and was officially incorporated as a town in 1891. The area is mostly flat, with an elevation of about 200 feet above sea level, and has a mild and temperate climate. The economy of Salmon Creek is largely based on retail and services, and the area is home to several large employers. As of the 2019 census, the population of Salmon Creek was estimated to be 22,845, with a median household income of $60,945 and a median home value of $310,000.
Common Questions
What is Per Capita Income in Salmon Creek?
Per Capita income in Salmon Creek is $44,912.
What is the Median Family Income in Salmon Creek?
Median Family Income in Salmon Creek is $111,088.
What is the Median Household income in Salmon Creek?
Median Household Income in Salmon Creek is $93,015.
What is Income or Wage Gap in Salmon Creek?
Income or Wage Gap in Salmon Creek is 35.4%.
Women in Salmon Creek earn 64.6 cents for every dollar earned by a man.
What is Inequality or Gini Index in Salmon Creek?
Inequality or Gini Index in Salmon Creek is 0.41.
What is the Total Population of Salmon Creek?
Total Population of Salmon Creek is 20,312.
What is the Total Male Population of Salmon Creek?
Total Male Population of Salmon Creek is 9,994.
What is the Total Female Population of Salmon Creek?
Total Female Population of Salmon Creek is 10,318.
What is the Ratio of Males per 100 Females in Salmon Creek?
There are 96.86 Males per 100 Females in Salmon Creek.
What is the Ratio of Females per 100 Males in Salmon Creek?
There are 103.24 Females per 100 Males in Salmon Creek.
What is the Median Population Age in Salmon Creek?
Median Population Age in Salmon Creek is 44.1 Years.
What is the Average Family Size in Salmon Creek
Average Family Size in Salmon Creek is 2.9 People.
What is the Average Household Size in Salmon Creek
Average Household Size in Salmon Creek is 2.5 People.
How Large is the Labor Force in Salmon Creek?
There are 9,827 People in the Labor Forcein in Salmon Creek.
What is the Percentage of People in the Labor Force in Salmon Creek?
59.1% of People are in the Labor Force in Salmon Creek.
What is the Unemployment Rate in Salmon Creek?
Unemployment Rate in Salmon Creek is 2.9%.