Rainier, WA Map & Demographics
Rainier Map
Rainier Overview
$31,000
PER CAPITA INCOME
$89,389
AVG FAMILY INCOME
$89,659
AVG HOUSEHOLD INCOME
44.8%
WAGE / INCOME GAP [ % ]
55.2¢/ $1
WAGE / INCOME GAP [ $ ]
0.32
INEQUALITY / GINI INDEX
2,707
TOTAL POPULATION
1,315
MALE POPULATION
1,392
FEMALE POPULATION
94.47
MALES / 100 FEMALES
105.86
FEMALES / 100 MALES
38.2
MEDIAN AGE
3.1
AVG FAMILY SIZE
3.2
AVG HOUSEHOLD SIZE
1,214
LABOR FORCE [ PEOPLE ]
57.5%
PERCENT IN LABOR FORCE
7.5%
UNEMPLOYMENT RATE
Rainier Zip Codes
Rainier Area Codes
Income in Rainier
Income Overview in Rainier
Per Capita Income in Rainier is $31,000, while median incomes of families and households are $89,389 and $89,659 respectively.
| Characteristic | Number | Measure |
| Per Capita Income | 2,707 | $31,000 |
| Median Family Income | 694 | $89,389 |
| Mean Family Income | 694 | $93,276 |
| Median Household Income | 856 | $89,659 |
| Mean Household Income | 856 | $94,699 |
| Income Deficit | 694 | $0 |
| Wage / Income Gap (%) | 2,707 | 44.76% |
| Wage / Income Gap ($) | 2,707 | 55.24¢ per $1 |
| Gini / Inequality Index | 2,707 | 0.32 |
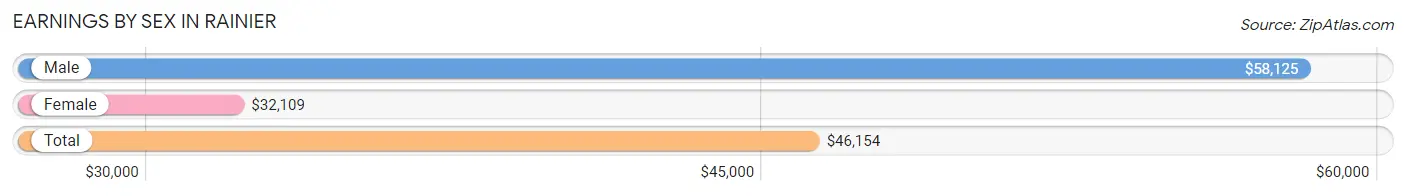
Earnings by Sex in Rainier
Average Earnings in Rainier are $46,154, $58,125 for men and $32,109 for women, a difference of 44.8%.
| Sex | Number | Average Earnings |
| Male | 656 (56.6%) | $58,125 |
| Female | 504 (43.4%) | $32,109 |
| Total | 1,160 (100.0%) | $46,154 |
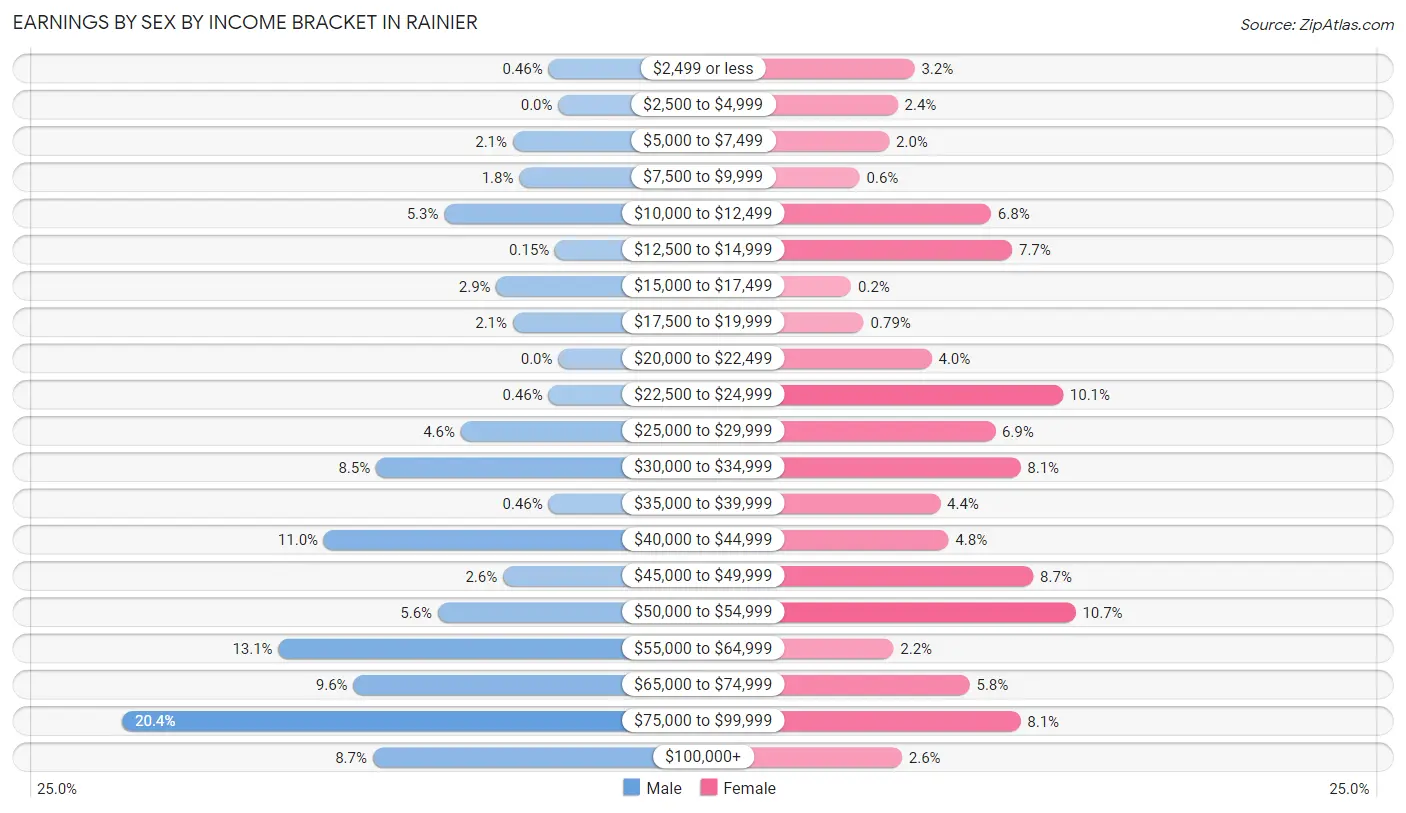
Earnings by Sex by Income Bracket in Rainier
The most common earnings brackets in Rainier are $75,000 to $99,999 for men (134 | 20.4%) and $50,000 to $54,999 for women (54 | 10.7%).
| Income | Male | Female |
| $2,499 or less | 3 (0.5%) | 16 (3.2%) |
| $2,500 to $4,999 | 0 (0.0%) | 12 (2.4%) |
| $5,000 to $7,499 | 14 (2.1%) | 10 (2.0%) |
| $7,500 to $9,999 | 12 (1.8%) | 3 (0.6%) |
| $10,000 to $12,499 | 35 (5.3%) | 34 (6.8%) |
| $12,500 to $14,999 | 1 (0.2%) | 39 (7.7%) |
| $15,000 to $17,499 | 19 (2.9%) | 1 (0.2%) |
| $17,500 to $19,999 | 14 (2.1%) | 4 (0.8%) |
| $20,000 to $22,499 | 0 (0.0%) | 20 (4.0%) |
| $22,500 to $24,999 | 3 (0.5%) | 51 (10.1%) |
| $25,000 to $29,999 | 30 (4.6%) | 35 (6.9%) |
| $30,000 to $34,999 | 56 (8.5%) | 41 (8.1%) |
| $35,000 to $39,999 | 3 (0.5%) | 22 (4.4%) |
| $40,000 to $44,999 | 72 (11.0%) | 24 (4.8%) |
| $45,000 to $49,999 | 17 (2.6%) | 44 (8.7%) |
| $50,000 to $54,999 | 37 (5.6%) | 54 (10.7%) |
| $55,000 to $64,999 | 86 (13.1%) | 11 (2.2%) |
| $65,000 to $74,999 | 63 (9.6%) | 29 (5.8%) |
| $75,000 to $99,999 | 134 (20.4%) | 41 (8.1%) |
| $100,000+ | 57 (8.7%) | 13 (2.6%) |
| Total | 656 (100.0%) | 504 (100.0%) |
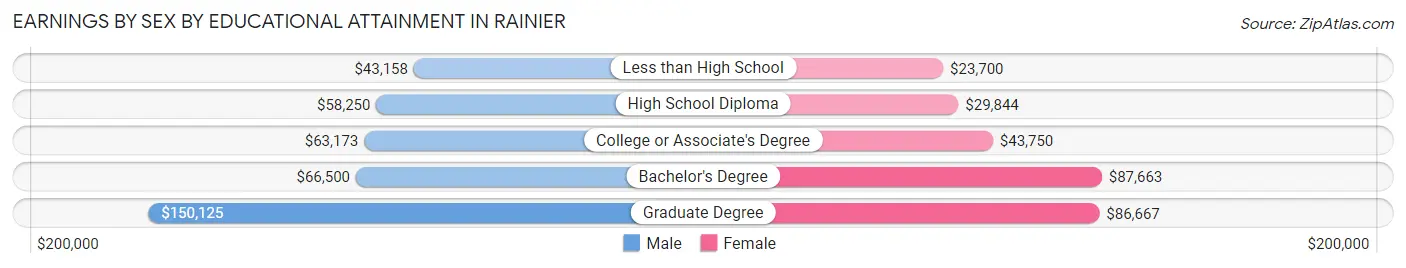
Earnings by Sex by Educational Attainment in Rainier
Average earnings in Rainier are $62,552 for men and $32,305 for women, a difference of 48.3%. Men with an educational attainment of graduate degree enjoy the highest average annual earnings of $150,125, while those with less than high school education earn the least with $43,158. Women with an educational attainment of bachelor's degree earn the most with the average annual earnings of $87,663, while those with less than high school education have the smallest earnings of $23,700.
| Educational Attainment | Male Income | Female Income |
| Less than High School | $43,158 | $23,700 |
| High School Diploma | $58,250 | $29,844 |
| College or Associate's Degree | $63,173 | $43,750 |
| Bachelor's Degree | $66,500 | $87,663 |
| Graduate Degree | $150,125 | $86,667 |
| Total | $62,552 | $32,305 |
Family Income in Rainier
Family Income Brackets in Rainier
According to the Rainier family income data, there are 210 families falling into the $75,000 to $99,999 income range, which is the most common income bracket and makes up 30.3% of all families. Conversely, the $10,000 to $14,999 income bracket is the least frequent group with only 5 families (0.7%) belonging to this category.
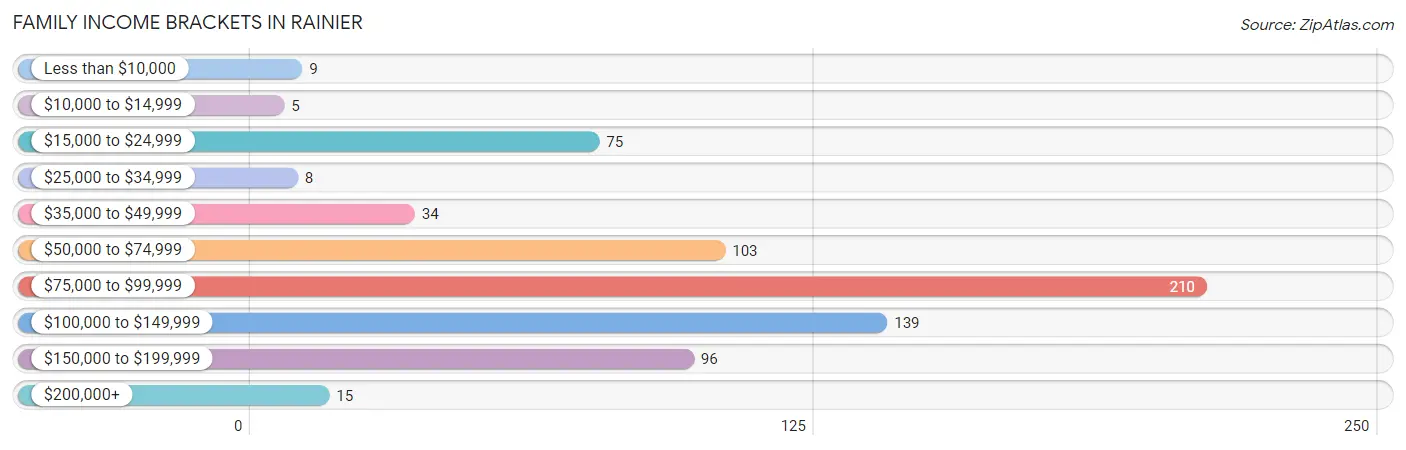
| Income Bracket | # Families | % Families |
| Less than $10,000 | 9 | 1.3% |
| $10,000 to $14,999 | 5 | 0.7% |
| $15,000 to $24,999 | 75 | 10.8% |
| $25,000 to $34,999 | 8 | 1.2% |
| $35,000 to $49,999 | 34 | 4.9% |
| $50,000 to $74,999 | 103 | 14.8% |
| $75,000 to $99,999 | 210 | 30.3% |
| $100,000 to $149,999 | 139 | 20.0% |
| $150,000 to $199,999 | 96 | 13.8% |
| $200,000+ | 15 | 2.2% |
Family Income by Famaliy Size in Rainier
5-person families (46 | 6.6%) account for the highest median family income in Rainier with $123,036 per family, while 2-person families (374 | 53.9%) have the highest median income of $43,906 per family member.
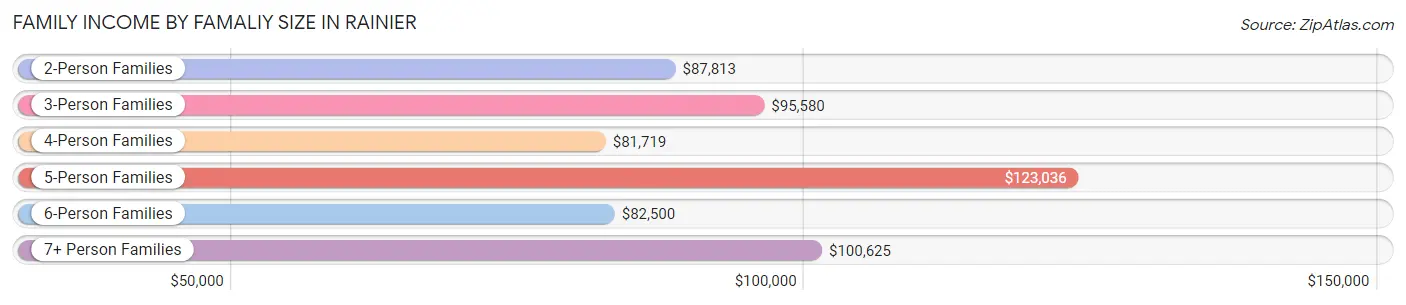
| Income Bracket | # Families | Median Income |
| 2-Person Families | 374 (53.9%) | $87,813 |
| 3-Person Families | 123 (17.7%) | $95,580 |
| 4-Person Families | 113 (16.3%) | $81,719 |
| 5-Person Families | 46 (6.6%) | $123,036 |
| 6-Person Families | 14 (2.0%) | $82,500 |
| 7+ Person Families | 24 (3.5%) | $100,625 |
| Total | 694 (100.0%) | $89,389 |
Family Income by Number of Earners in Rainier
The median family income in Rainier is $89,389, with families comprising 3+ earners (30) having the highest median family income of $185,385, while families with 1 earner (270) have the lowest median family income of $70,625, accounting for 4.3% and 38.9% of families, respectively.
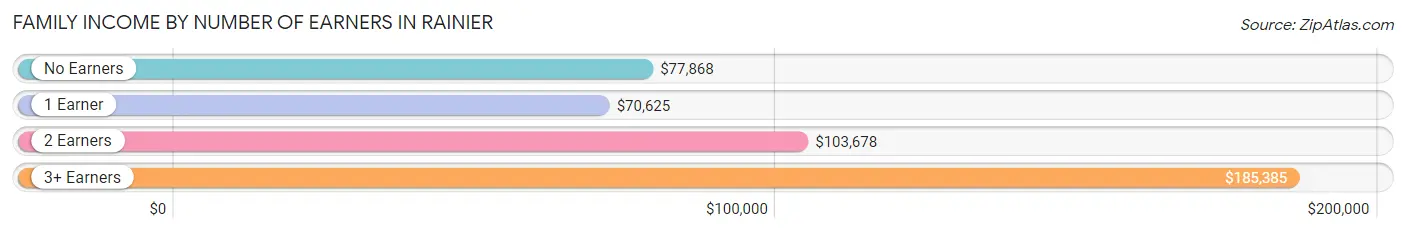
| Number of Earners | # Families | Median Income |
| No Earners | 153 (22.1%) | $77,868 |
| 1 Earner | 270 (38.9%) | $70,625 |
| 2 Earners | 241 (34.7%) | $103,678 |
| 3+ Earners | 30 (4.3%) | $185,385 |
| Total | 694 (100.0%) | $89,389 |
Household Income in Rainier
Household Income Brackets in Rainier
With 210 households falling in the category, the $75,000 to $99,999 income range is the most frequent in Rainier, accounting for 24.5% of all households. In contrast, only 5 households (0.6%) fall into the $10,000 to $14,999 income bracket, making it the least populous group.
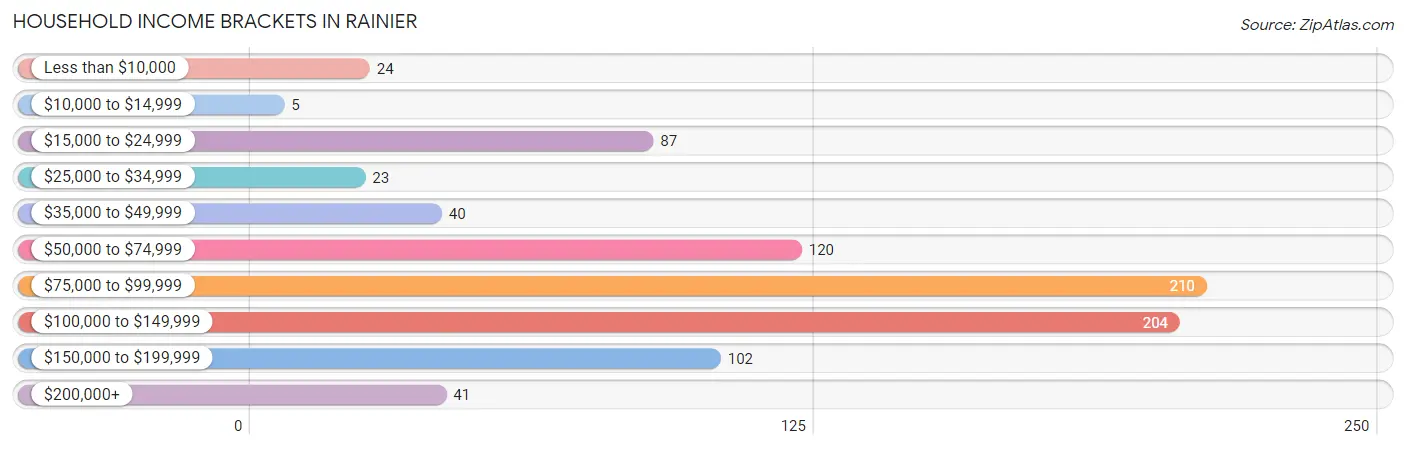
| Income Bracket | # Households | % Households |
| Less than $10,000 | 24 | 2.8% |
| $10,000 to $14,999 | 5 | 0.6% |
| $15,000 to $24,999 | 87 | 10.2% |
| $25,000 to $34,999 | 23 | 2.7% |
| $35,000 to $49,999 | 40 | 4.7% |
| $50,000 to $74,999 | 120 | 14.0% |
| $75,000 to $99,999 | 210 | 24.5% |
| $100,000 to $149,999 | 204 | 23.8% |
| $150,000 to $199,999 | 102 | 11.9% |
| $200,000+ | 41 | 4.8% |
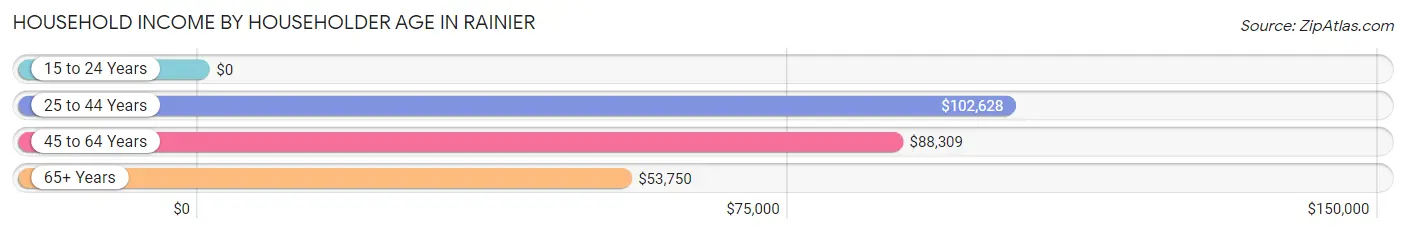
Household Income by Householder Age in Rainier
The median household income in Rainier is $89,659, with the highest median household income of $102,628 found in the 25 to 44 years age bracket for the primary householder. A total of 311 households (36.3%) fall into this category.
| Income Bracket | # Households | Median Income |
| 15 to 24 Years | 0 (0.0%) | $0 |
| 25 to 44 Years | 311 (36.3%) | $102,628 |
| 45 to 64 Years | 363 (42.4%) | $88,309 |
| 65+ Years | 182 (21.3%) | $53,750 |
| Total | 856 (100.0%) | $89,659 |
Poverty in Rainier
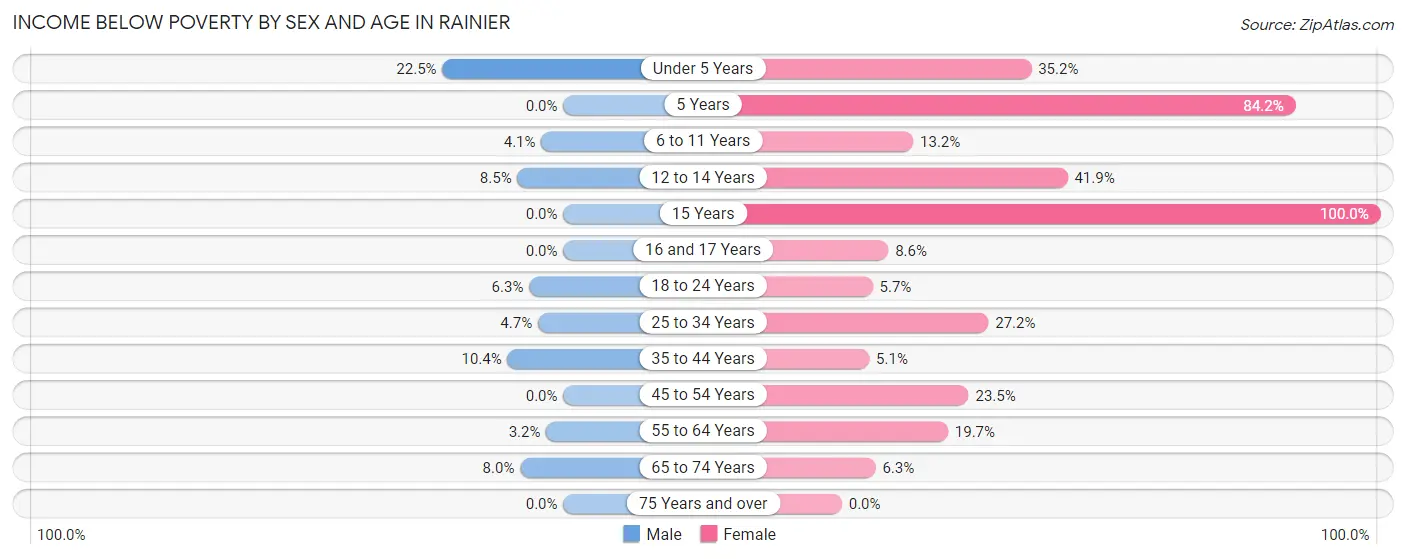
Income Below Poverty by Sex and Age in Rainier
With 5.6% poverty level for males and 19.8% for females among the residents of Rainier, under 5 year old males and 15 year old females are the most vulnerable to poverty, with 11 males (22.5%) and 5 females (100.0%) in their respective age groups living below the poverty level.
| Age Bracket | Male | Female |
| Under 5 Years | 11 (22.5%) | 32 (35.2%) |
| 5 Years | 0 (0.0%) | 16 (84.2%) |
| 6 to 11 Years | 4 (4.1%) | 9 (13.2%) |
| 12 to 14 Years | 4 (8.5%) | 31 (41.9%) |
| 15 Years | 0 (0.0%) | 5 (100.0%) |
| 16 and 17 Years | 0 (0.0%) | 5 (8.6%) |
| 18 to 24 Years | 5 (6.3%) | 2 (5.7%) |
| 25 to 34 Years | 9 (4.7%) | 68 (27.2%) |
| 35 to 44 Years | 20 (10.4%) | 9 (5.1%) |
| 45 to 54 Years | 0 (0.0%) | 44 (23.5%) |
| 55 to 64 Years | 6 (3.2%) | 38 (19.7%) |
| 65 to 74 Years | 10 (8.0%) | 9 (6.2%) |
| 75 Years and over | 0 (0.0%) | 0 (0.0%) |
| Total | 69 (5.6%) | 268 (19.8%) |
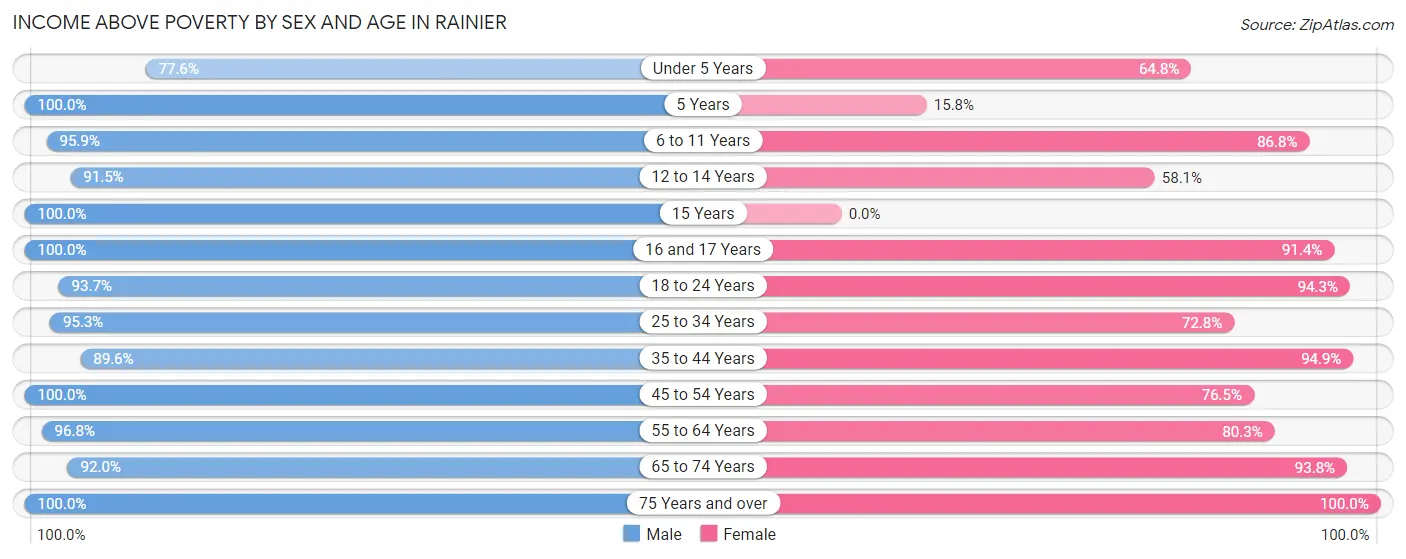
Income Above Poverty by Sex and Age in Rainier
According to the poverty statistics in Rainier, males aged 5 years and females aged 75 years and over are the age groups that are most secure financially, with 100.0% of males and 100.0% of females in these age groups living above the poverty line.
| Age Bracket | Male | Female |
| Under 5 Years | 38 (77.5%) | 59 (64.8%) |
| 5 Years | 16 (100.0%) | 3 (15.8%) |
| 6 to 11 Years | 94 (95.9%) | 59 (86.8%) |
| 12 to 14 Years | 43 (91.5%) | 43 (58.1%) |
| 15 Years | 6 (100.0%) | 0 (0.0%) |
| 16 and 17 Years | 22 (100.0%) | 53 (91.4%) |
| 18 to 24 Years | 74 (93.7%) | 33 (94.3%) |
| 25 to 34 Years | 182 (95.3%) | 182 (72.8%) |
| 35 to 44 Years | 173 (89.6%) | 168 (94.9%) |
| 45 to 54 Years | 161 (100.0%) | 143 (76.5%) |
| 55 to 64 Years | 183 (96.8%) | 155 (80.3%) |
| 65 to 74 Years | 115 (92.0%) | 135 (93.8%) |
| 75 Years and over | 57 (100.0%) | 51 (100.0%) |
| Total | 1,164 (94.4%) | 1,084 (80.2%) |
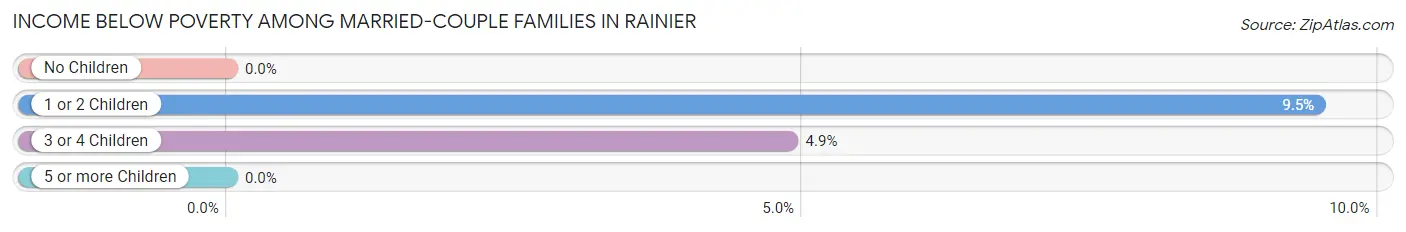
Income Below Poverty Among Married-Couple Families in Rainier
The poverty statistics for married-couple families in Rainier show that 2.2% or 11 of the total 507 families live below the poverty line. Families with 1 or 2 children have the highest poverty rate of 9.5%, comprising of 9 families. On the other hand, families with no children have the lowest poverty rate of 0.0%, which includes 0 families.
| Children | Above Poverty | Below Poverty |
| No Children | 358 (100.0%) | 0 (0.0%) |
| 1 or 2 Children | 86 (90.5%) | 9 (9.5%) |
| 3 or 4 Children | 39 (95.1%) | 2 (4.9%) |
| 5 or more Children | 13 (100.0%) | 0 (0.0%) |
| Total | 496 (97.8%) | 11 (2.2%) |
Income Below Poverty Among Single-Parent Households in Rainier
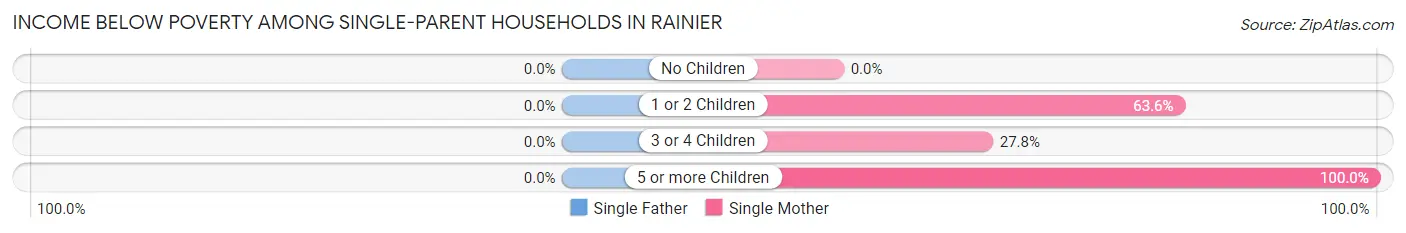
| Children | Single Father | Single Mother |
| No Children | 0 (0.0%) | 0 (0.0%) |
| 1 or 2 Children | 0 (0.0%) | 28 (63.6%) |
| 3 or 4 Children | 0 (0.0%) | 5 (27.8%) |
| 5 or more Children | 0 (0.0%) | 4 (100.0%) |
| Total | 0 (0.0%) | 37 (28.5%) |
Income Below Poverty Among Married-Couple vs Single-Parent Households in Rainier
The poverty data for Rainier shows that 11 of the married-couple family households (2.2%) and 37 of the single-parent households (19.8%) are living below the poverty level. Within the married-couple family households, those with 1 or 2 children have the highest poverty rate, with 9 households (9.5%) falling below the poverty line. Among the single-parent households, those with 5 or more children have the highest poverty rate, with 4 household (100.0%) living below poverty.
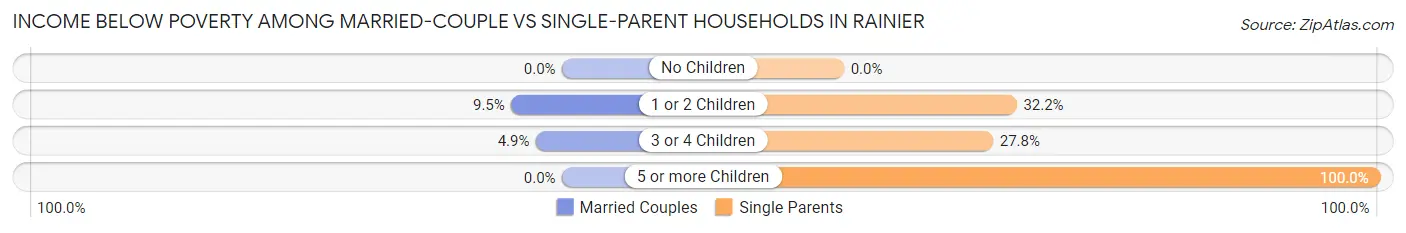
| Children | Married-Couple Families | Single-Parent Households |
| No Children | 0 (0.0%) | 0 (0.0%) |
| 1 or 2 Children | 9 (9.5%) | 28 (32.2%) |
| 3 or 4 Children | 2 (4.9%) | 5 (27.8%) |
| 5 or more Children | 0 (0.0%) | 4 (100.0%) |
| Total | 11 (2.2%) | 37 (19.8%) |
Race in Rainier
The most populous races in Rainier are White / Caucasian (2,377 | 87.8%), Two or more Races (256 | 9.5%), and Hispanic or Latino (146 | 5.4%).
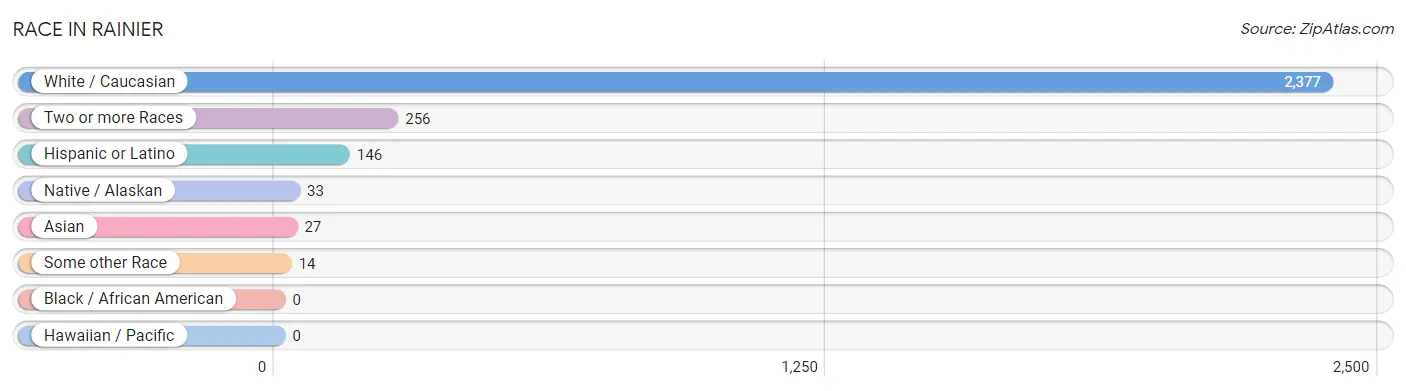
| Race | # Population | % Population |
| Asian | 27 | 1.0% |
| Black / African American | 0 | 0.0% |
| Hawaiian / Pacific | 0 | 0.0% |
| Hispanic or Latino | 146 | 5.4% |
| Native / Alaskan | 33 | 1.2% |
| White / Caucasian | 2,377 | 87.8% |
| Two or more Races | 256 | 9.5% |
| Some other Race | 14 | 0.5% |
| Total | 2,707 | 100.0% |
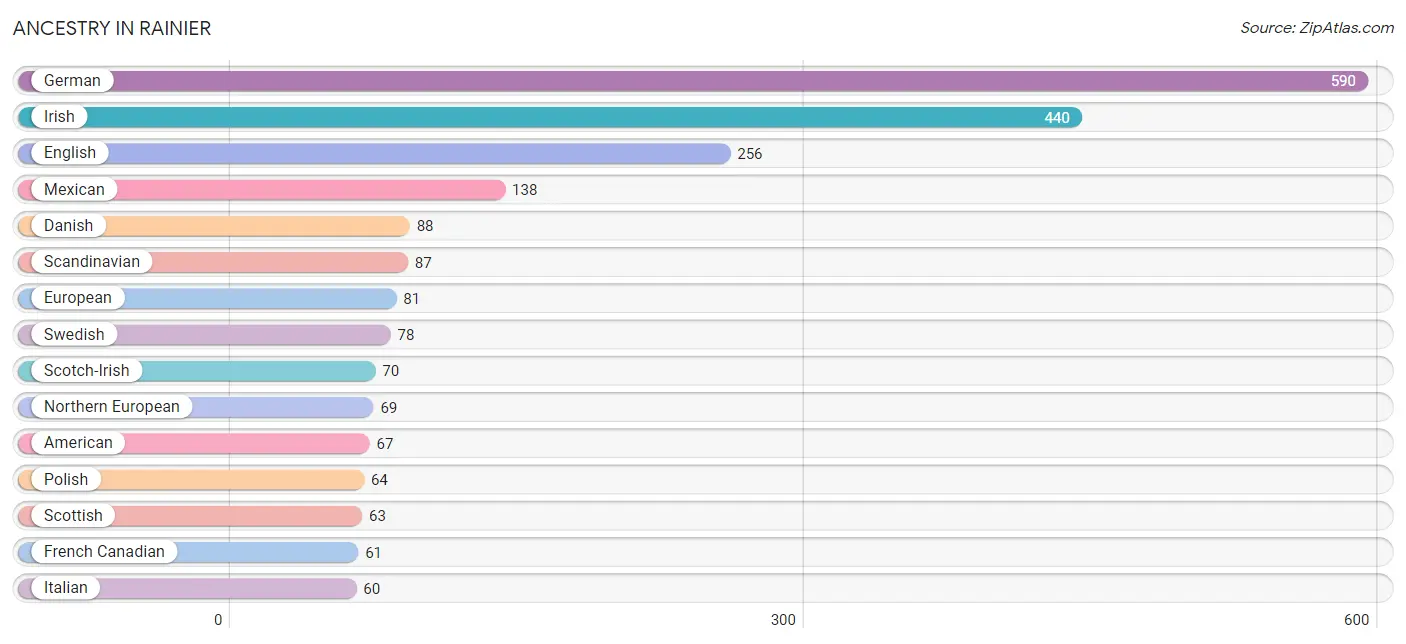
Ancestry in Rainier
The most populous ancestries reported in Rainier are German (590 | 21.8%), Irish (440 | 16.3%), English (256 | 9.5%), Mexican (138 | 5.1%), and Danish (88 | 3.3%), together accounting for 55.9% of all Rainier residents.
| Ancestry | # Population | % Population |
| Aleut | 4 | 0.2% |
| American | 67 | 2.5% |
| Arab | 10 | 0.4% |
| Australian | 18 | 0.7% |
| Bhutanese | 31 | 1.1% |
| British | 5 | 0.2% |
| Burmese | 16 | 0.6% |
| Canadian | 11 | 0.4% |
| Cherokee | 45 | 1.7% |
| Chickasaw | 4 | 0.2% |
| Danish | 88 | 3.3% |
| Dutch | 29 | 1.1% |
| Eastern European | 3 | 0.1% |
| English | 256 | 9.5% |
| European | 81 | 3.0% |
| Finnish | 5 | 0.2% |
| French | 41 | 1.5% |
| French Canadian | 61 | 2.2% |
| German | 590 | 21.8% |
| Guamanian / Chamorro | 8 | 0.3% |
| Hungarian | 5 | 0.2% |
| Indian (Asian) | 23 | 0.9% |
| Irish | 440 | 16.3% |
| Italian | 60 | 2.2% |
| Korean | 36 | 1.3% |
| Lebanese | 10 | 0.4% |
| Mexican | 138 | 5.1% |
| Native Hawaiian | 5 | 0.2% |
| Navajo | 5 | 0.2% |
| Northern European | 69 | 2.5% |
| Norwegian | 59 | 2.2% |
| Pennsylvania German | 2 | 0.1% |
| Polish | 64 | 2.4% |
| Portuguese | 32 | 1.2% |
| Puget Sound Salish | 26 | 1.0% |
| Russian | 4 | 0.2% |
| Scandinavian | 87 | 3.2% |
| Scotch-Irish | 70 | 2.6% |
| Scottish | 63 | 2.3% |
| Shoshone | 21 | 0.8% |
| Spaniard | 4 | 0.2% |
| Spanish | 4 | 0.2% |
| Swedish | 78 | 2.9% |
| Swiss | 19 | 0.7% |
| Welsh | 6 | 0.2% | View All 45 Rows |
Immigrants in Rainier
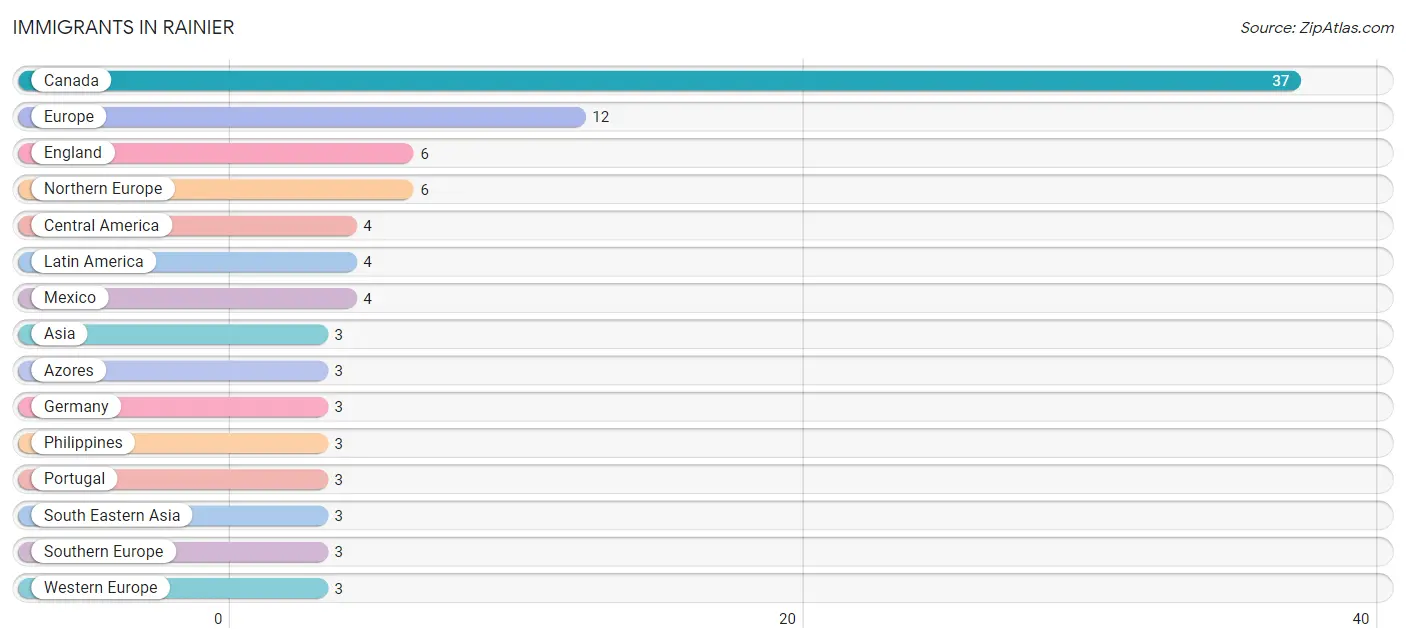
The most numerous immigrant groups reported in Rainier came from Canada (37 | 1.4%), Europe (12 | 0.4%), England (6 | 0.2%), Northern Europe (6 | 0.2%), and Central America (4 | 0.2%), together accounting for 2.4% of all Rainier residents.
| Immigration Origin | # Population | % Population |
| Asia | 3 | 0.1% |
| Azores | 3 | 0.1% |
| Canada | 37 | 1.4% |
| Central America | 4 | 0.2% |
| England | 6 | 0.2% |
| Europe | 12 | 0.4% |
| Germany | 3 | 0.1% |
| Latin America | 4 | 0.2% |
| Mexico | 4 | 0.2% |
| Northern Europe | 6 | 0.2% |
| Philippines | 3 | 0.1% |
| Portugal | 3 | 0.1% |
| South Eastern Asia | 3 | 0.1% |
| Southern Europe | 3 | 0.1% |
| Western Europe | 3 | 0.1% | View All 15 Rows |
Sex and Age in Rainier
Sex and Age in Rainier
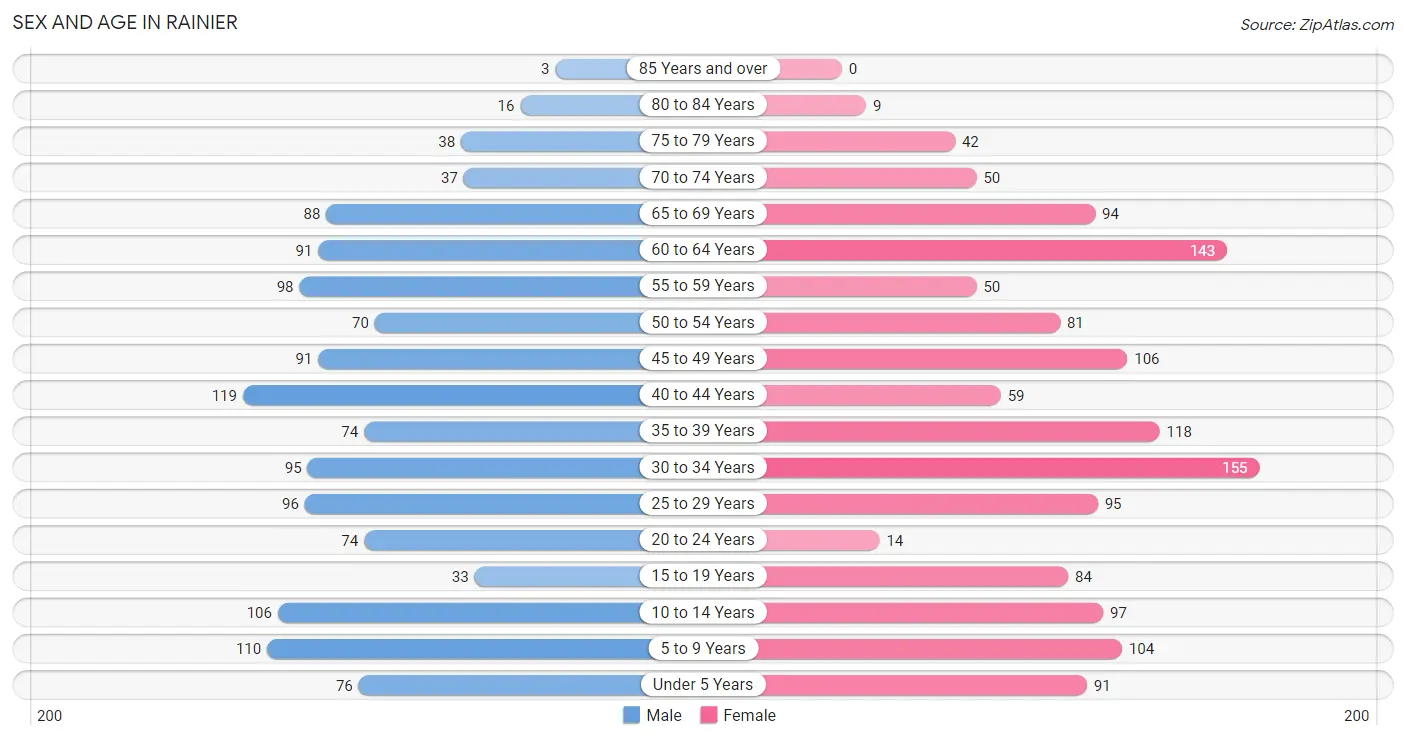
The most populous age groups in Rainier are 40 to 44 Years (119 | 9.0%) for men and 30 to 34 Years (155 | 11.1%) for women.
| Age Bracket | Male | Female |
| Under 5 Years | 76 (5.8%) | 91 (6.5%) |
| 5 to 9 Years | 110 (8.4%) | 104 (7.5%) |
| 10 to 14 Years | 106 (8.1%) | 97 (7.0%) |
| 15 to 19 Years | 33 (2.5%) | 84 (6.0%) |
| 20 to 24 Years | 74 (5.6%) | 14 (1.0%) |
| 25 to 29 Years | 96 (7.3%) | 95 (6.8%) |
| 30 to 34 Years | 95 (7.2%) | 155 (11.1%) |
| 35 to 39 Years | 74 (5.6%) | 118 (8.5%) |
| 40 to 44 Years | 119 (9.0%) | 59 (4.2%) |
| 45 to 49 Years | 91 (6.9%) | 106 (7.6%) |
| 50 to 54 Years | 70 (5.3%) | 81 (5.8%) |
| 55 to 59 Years | 98 (7.4%) | 50 (3.6%) |
| 60 to 64 Years | 91 (6.9%) | 143 (10.3%) |
| 65 to 69 Years | 88 (6.7%) | 94 (6.8%) |
| 70 to 74 Years | 37 (2.8%) | 50 (3.6%) |
| 75 to 79 Years | 38 (2.9%) | 42 (3.0%) |
| 80 to 84 Years | 16 (1.2%) | 9 (0.6%) |
| 85 Years and over | 3 (0.2%) | 0 (0.0%) |
| Total | 1,315 (100.0%) | 1,392 (100.0%) |
Families and Households in Rainier
Median Family Size in Rainier
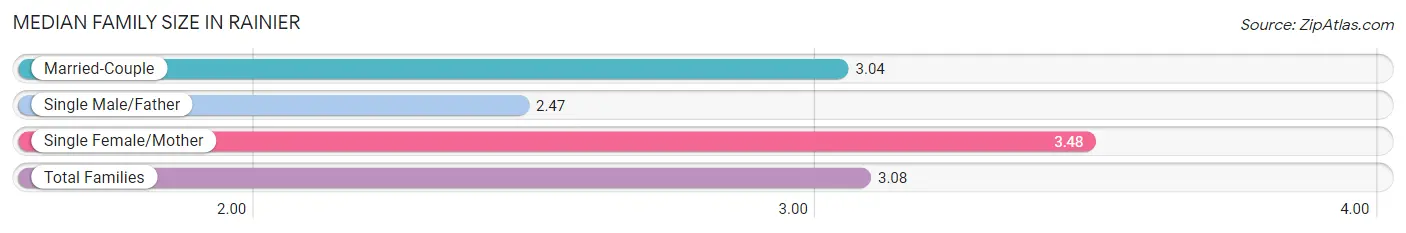
The median family size in Rainier is 3.08 persons per family, with single female/mother families (130 | 18.7%) accounting for the largest median family size of 3.48 persons per family. On the other hand, single male/father families (57 | 8.2%) represent the smallest median family size with 2.47 persons per family.
| Family Type | # Families | Family Size |
| Married-Couple | 507 (73.1%) | 3.04 |
| Single Male/Father | 57 (8.2%) | 2.47 |
| Single Female/Mother | 130 (18.7%) | 3.48 |
| Total Families | 694 (100.0%) | 3.08 |
Median Household Size in Rainier
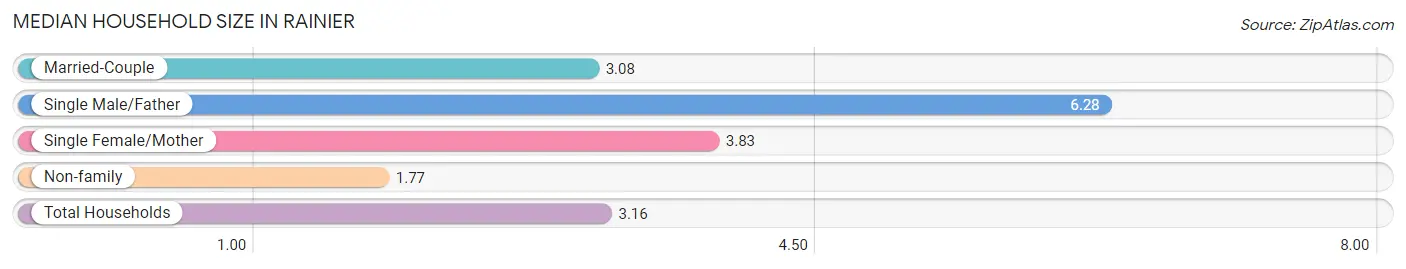
The median household size in Rainier is 3.16 persons per household, with single male/father households (57 | 6.7%) accounting for the largest median household size of 6.28 persons per household. non-family households (162 | 18.9%) represent the smallest median household size with 1.77 persons per household.
| Household Type | # Households | Household Size |
| Married-Couple | 507 (59.2%) | 3.08 |
| Single Male/Father | 57 (6.7%) | 6.28 |
| Single Female/Mother | 130 (15.2%) | 3.83 |
| Non-family | 162 (18.9%) | 1.77 |
| Total Households | 856 (100.0%) | 3.16 |
Household Size by Marriage Status in Rainier
Out of a total of 856 households in Rainier, 694 (81.1%) are family households, while 162 (18.9%) are nonfamily households. The most numerous type of family households are 2-person households, comprising 340, and the most common type of nonfamily households are 1-person households, comprising 105.
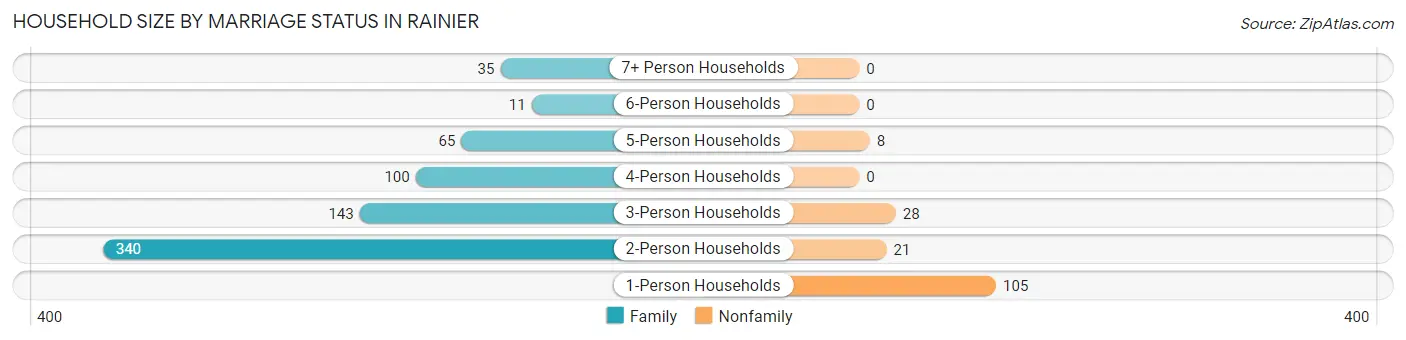
| Household Size | Family Households | Nonfamily Households |
| 1-Person Households | - | 105 (12.3%) |
| 2-Person Households | 340 (39.7%) | 21 (2.5%) |
| 3-Person Households | 143 (16.7%) | 28 (3.3%) |
| 4-Person Households | 100 (11.7%) | 0 (0.0%) |
| 5-Person Households | 65 (7.6%) | 8 (0.9%) |
| 6-Person Households | 11 (1.3%) | 0 (0.0%) |
| 7+ Person Households | 35 (4.1%) | 0 (0.0%) |
| Total | 694 (81.1%) | 162 (18.9%) |
Female Fertility in Rainier
Fertility by Age in Rainier
Average fertility rate in Rainier is 31.0 births per 1,000 women. Women in the age bracket of 35 to 50 years have the highest fertility rate with 46.0 births per 1,000 women. Women in the age bracket of 35 to 50 years acount for 70.0% of all women with births.
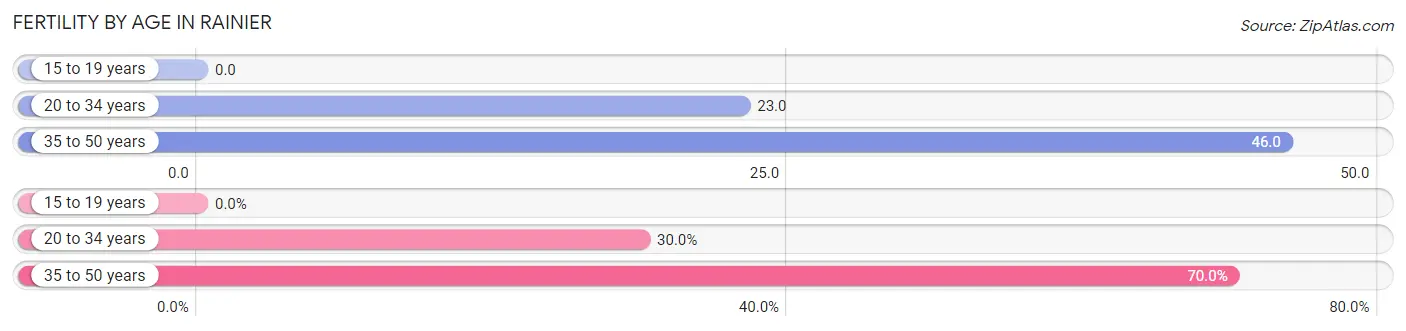
| Age Bracket | Women with Births | Births / 1,000 Women |
| 15 to 19 years | 0 (0.0%) | 0.0 |
| 20 to 34 years | 6 (30.0%) | 23.0 |
| 35 to 50 years | 14 (70.0%) | 46.0 |
| Total | 20 (100.0%) | 31.0 |
Fertility by Age by Marriage Status in Rainier
70.0% of women with births (20) in Rainier are married. The highest percentage of unmarried women with births falls into 20 to 34 years age bracket with 100.0% of them unmarried at the time of birth, while the lowest percentage of unmarried women with births belong to 35 to 50 years age bracket with 0.0% of them unmarried.
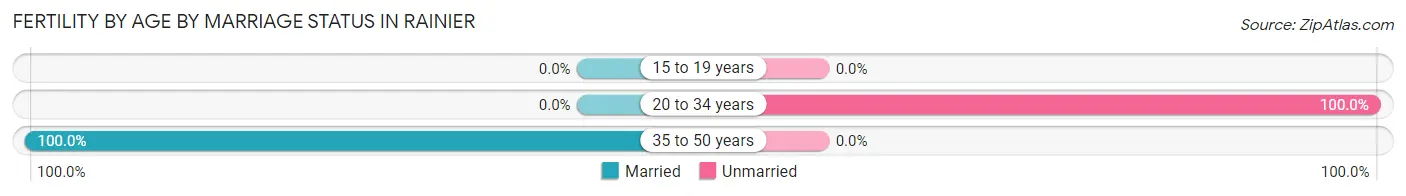
| Age Bracket | Married | Unmarried |
| 15 to 19 years | 0 (0.0%) | 0 (0.0%) |
| 20 to 34 years | 0 (0.0%) | 6 (100.0%) |
| 35 to 50 years | 14 (100.0%) | 0 (0.0%) |
| Total | 14 (70.0%) | 6 (30.0%) |
Fertility by Education in Rainier
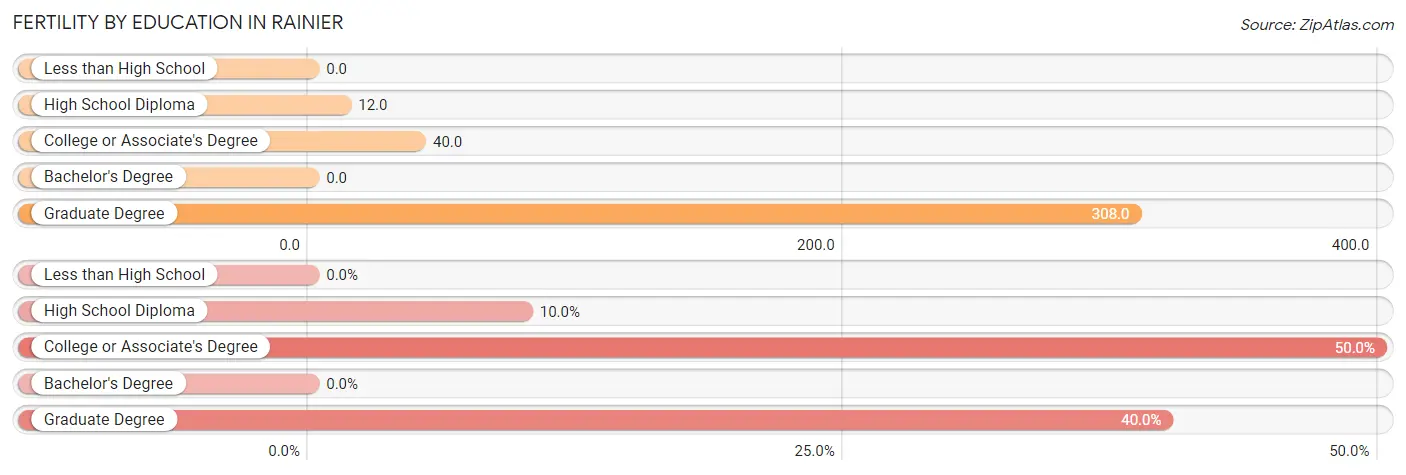
| Educational Attainment | Women with Births | Births / 1,000 Women |
| Less than High School | 0 (0.0%) | 0.0 |
| High School Diploma | 2 (10.0%) | 12.0 |
| College or Associate's Degree | 10 (50.0%) | 40.0 |
| Bachelor's Degree | 0 (0.0%) | 0.0 |
| Graduate Degree | 8 (40.0%) | 308.0 |
| Total | 20 (100.0%) | 31.0 |
Fertility by Education by Marriage Status in Rainier
30.0% of women with births in Rainier are unmarried. Women with the educational attainment of college or associate's degree are most likely to be married with 100.0% of them married at childbirth, while women with the educational attainment of high school diploma are least likely to be married with 100.0% of them unmarried at childbirth.
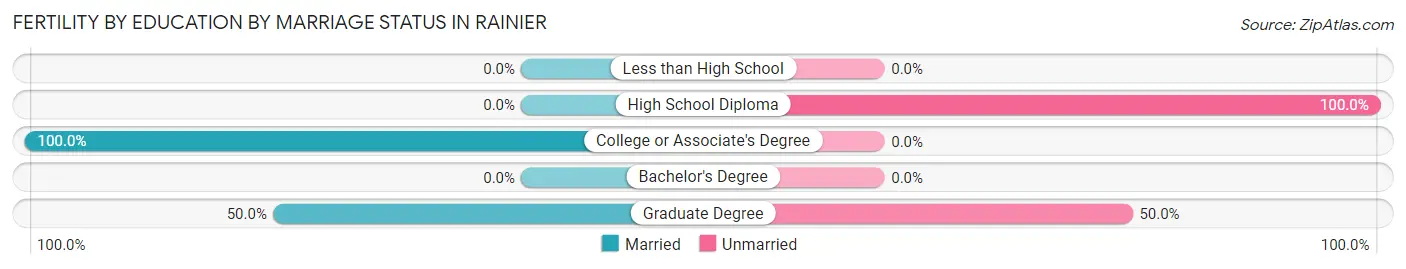
| Educational Attainment | Married | Unmarried |
| Less than High School | 0 (0.0%) | 0 (0.0%) |
| High School Diploma | 0 (0.0%) | 2 (100.0%) |
| College or Associate's Degree | 10 (100.0%) | 0 (0.0%) |
| Bachelor's Degree | 0 (0.0%) | 0 (0.0%) |
| Graduate Degree | 4 (50.0%) | 4 (50.0%) |
| Total | 14 (70.0%) | 6 (30.0%) |
Employment Characteristics in Rainier
Employment by Class of Employer in Rainier
Among the 1,092 employed individuals in Rainier, private company employees (622 | 57.0%), state government employees (266 | 24.4%), and not-for-profit organizations (52 | 4.8%) make up the most common classes of employment.
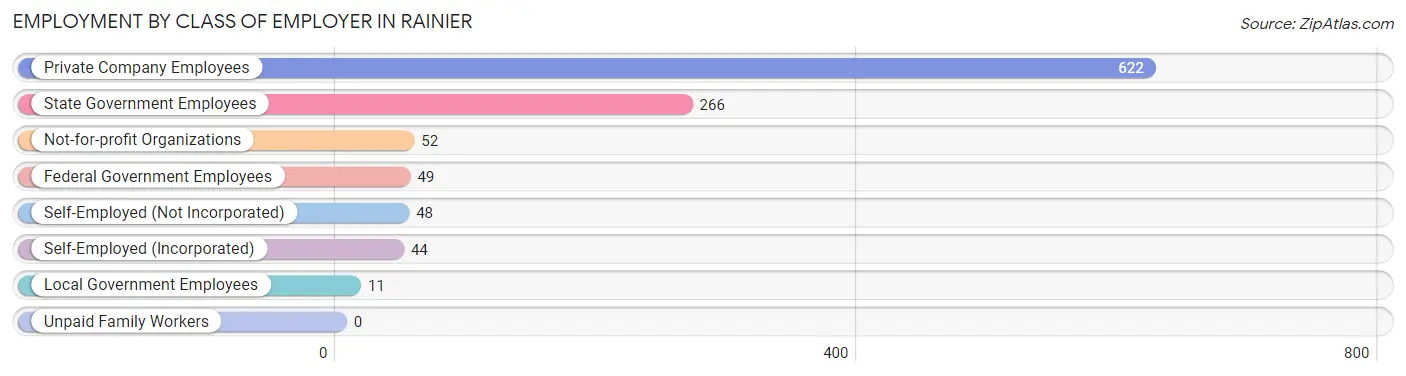
| Employer Class | # Employees | % Employees |
| Private Company Employees | 622 | 57.0% |
| Self-Employed (Incorporated) | 44 | 4.0% |
| Self-Employed (Not Incorporated) | 48 | 4.4% |
| Not-for-profit Organizations | 52 | 4.8% |
| Local Government Employees | 11 | 1.0% |
| State Government Employees | 266 | 24.4% |
| Federal Government Employees | 49 | 4.5% |
| Unpaid Family Workers | 0 | 0.0% |
| Total | 1,092 | 100.0% |
Employment Status by Age in Rainier
According to the labor force statistics for Rainier, out of the total population over 16 years of age (2,112), 57.5% or 1,214 individuals are in the labor force, with 7.5% or 91 of them unemployed. The age group with the highest labor force participation rate is 25 to 29 years, with 93.7% or 179 individuals in the labor force. Within the labor force, the 16 to 19 years age range has the highest percentage of unemployed individuals, with 50.0% or 5 of them being unemployed.
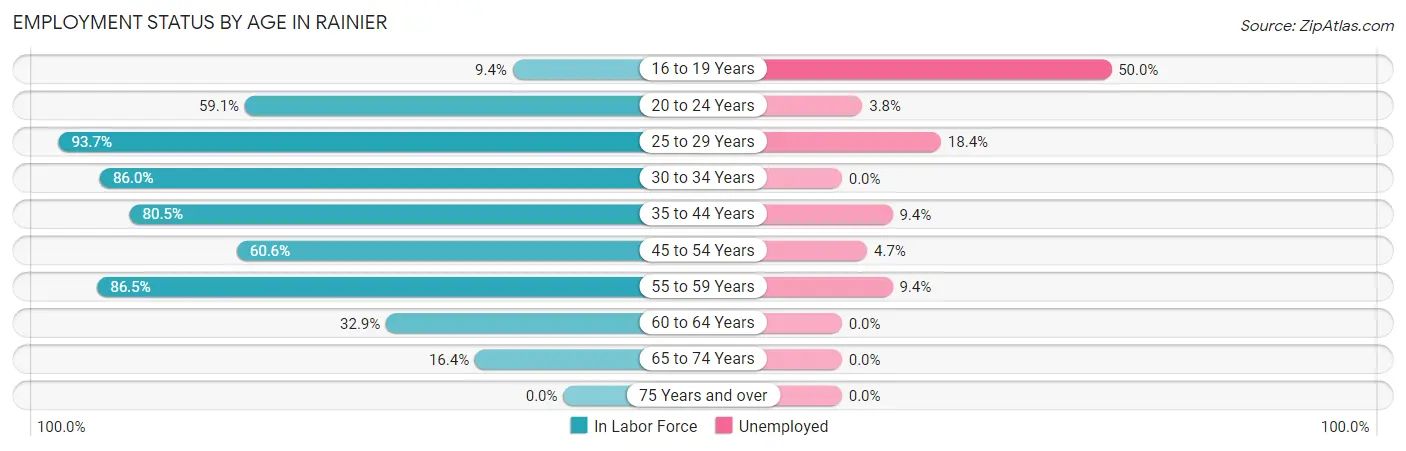
| Age Bracket | In Labor Force | Unemployed |
| 16 to 19 Years | 10 (9.4%) | 5 (50.0%) |
| 20 to 24 Years | 52 (59.1%) | 2 (3.8%) |
| 25 to 29 Years | 179 (93.7%) | 33 (18.4%) |
| 30 to 34 Years | 215 (86.0%) | 0 (0.0%) |
| 35 to 44 Years | 298 (80.5%) | 28 (9.4%) |
| 45 to 54 Years | 211 (60.6%) | 10 (4.7%) |
| 55 to 59 Years | 128 (86.5%) | 12 (9.4%) |
| 60 to 64 Years | 77 (32.9%) | 0 (0.0%) |
| 65 to 74 Years | 44 (16.4%) | 0 (0.0%) |
| 75 Years and over | 0 (0.0%) | 0 (0.0%) |
| Total | 1,214 (57.5%) | 91 (7.5%) |
Employment Status by Educational Attainment in Rainier
According to labor force statistics for Rainier, 71.9% of individuals (1,108) out of the total population between 25 and 64 years of age (1,541) are in the labor force, with 7.5% or 83 of them being unemployed. The group with the highest labor force participation rate are those with the educational attainment of college / associate degree, with 76.2% or 477 individuals in the labor force. Within the labor force, individuals with less than high school education have the highest percentage of unemployment, with 15.5% or 11 of them being unemployed.
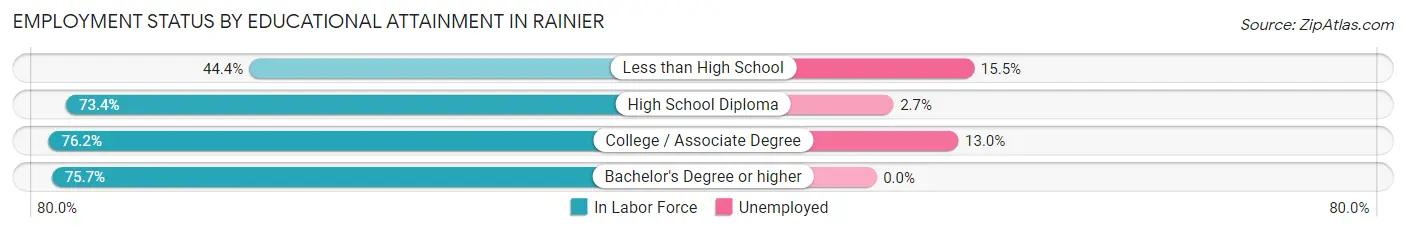
| Educational Attainment | In Labor Force | Unemployed |
| Less than High School | 71 (44.4%) | 25 (15.5%) |
| High School Diploma | 373 (73.4%) | 14 (2.7%) |
| College / Associate Degree | 477 (76.2%) | 81 (13.0%) |
| Bachelor's Degree or higher | 187 (75.7%) | 0 (0.0%) |
| Total | 1,108 (71.9%) | 116 (7.5%) |
Employment Occupations by Sex in Rainier
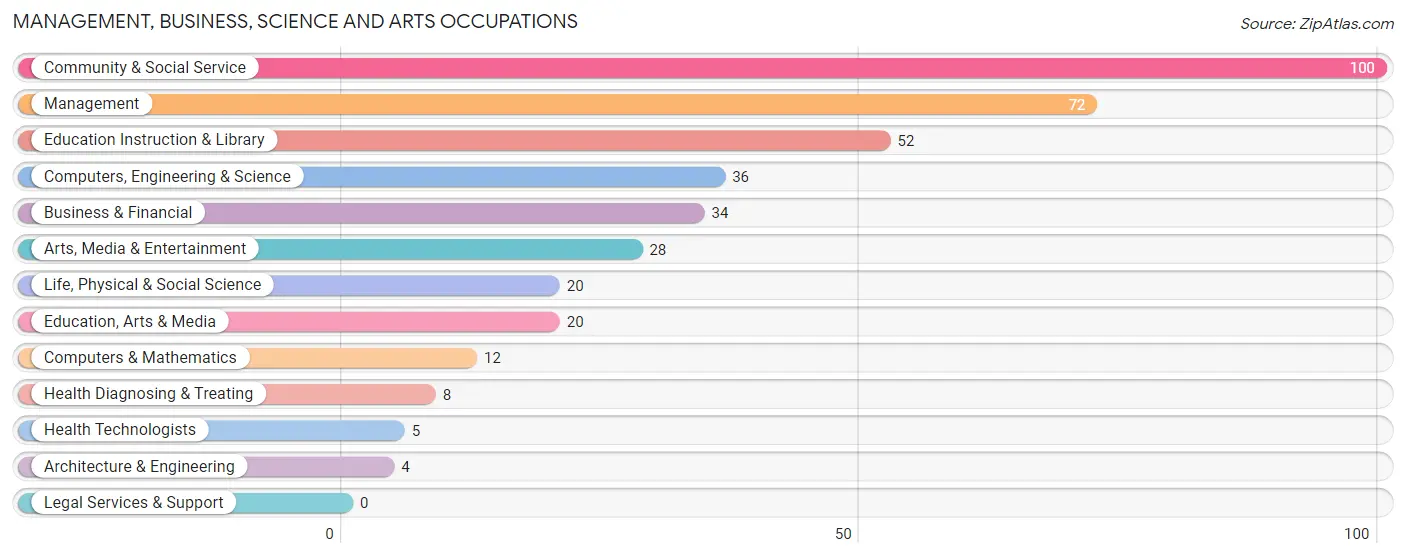
Management, Business, Science and Arts Occupations
The most common Management, Business, Science and Arts occupations in Rainier are Community & Social Service (100 | 9.0%), Management (72 | 6.5%), Education Instruction & Library (52 | 4.7%), Computers, Engineering & Science (36 | 3.3%), and Business & Financial (34 | 3.1%).
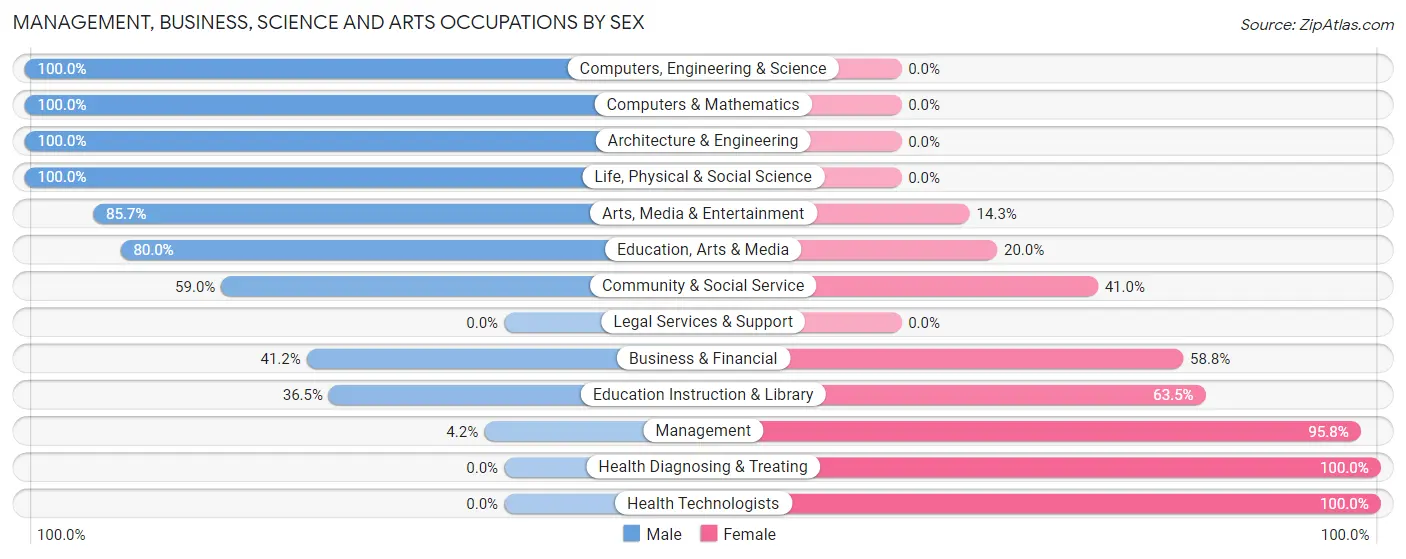
Management, Business, Science and Arts Occupations by Sex
Within the Management, Business, Science and Arts occupations in Rainier, the most male-oriented occupations are Computers, Engineering & Science (100.0%), Computers & Mathematics (100.0%), and Architecture & Engineering (100.0%), while the most female-oriented occupations are Health Diagnosing & Treating (100.0%), Health Technologists (100.0%), and Management (95.8%).
| Occupation | Male | Female |
| Management | 3 (4.2%) | 69 (95.8%) |
| Business & Financial | 14 (41.2%) | 20 (58.8%) |
| Computers, Engineering & Science | 36 (100.0%) | 0 (0.0%) |
| Computers & Mathematics | 12 (100.0%) | 0 (0.0%) |
| Architecture & Engineering | 4 (100.0%) | 0 (0.0%) |
| Life, Physical & Social Science | 20 (100.0%) | 0 (0.0%) |
| Community & Social Service | 59 (59.0%) | 41 (41.0%) |
| Education, Arts & Media | 16 (80.0%) | 4 (20.0%) |
| Legal Services & Support | 0 (0.0%) | 0 (0.0%) |
| Education Instruction & Library | 19 (36.5%) | 33 (63.5%) |
| Arts, Media & Entertainment | 24 (85.7%) | 4 (14.3%) |
| Health Diagnosing & Treating | 0 (0.0%) | 8 (100.0%) |
| Health Technologists | 0 (0.0%) | 5 (100.0%) |
| Total (Category) | 112 (44.8%) | 138 (55.2%) |
| Total (Overall) | 630 (57.0%) | 475 (43.0%) |
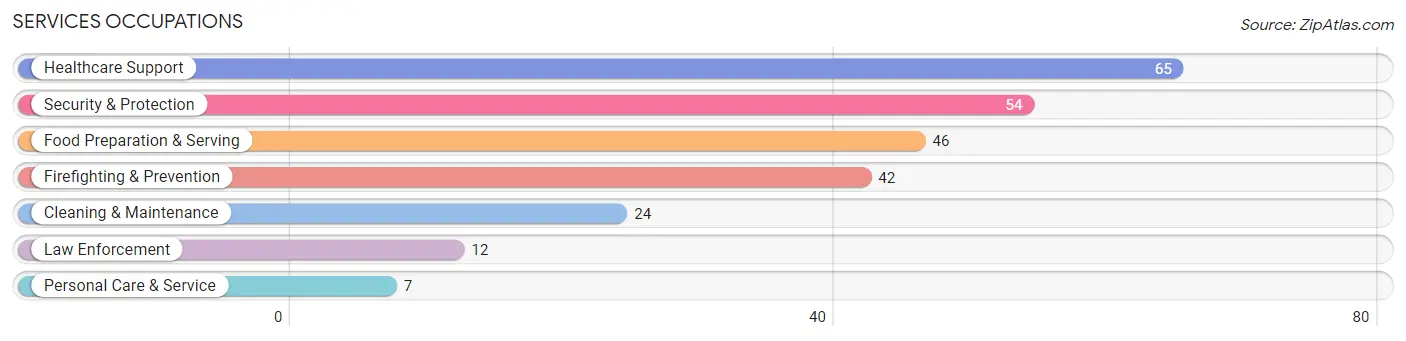
Services Occupations
The most common Services occupations in Rainier are Healthcare Support (65 | 5.9%), Security & Protection (54 | 4.9%), Food Preparation & Serving (46 | 4.2%), Firefighting & Prevention (42 | 3.8%), and Cleaning & Maintenance (24 | 2.2%).
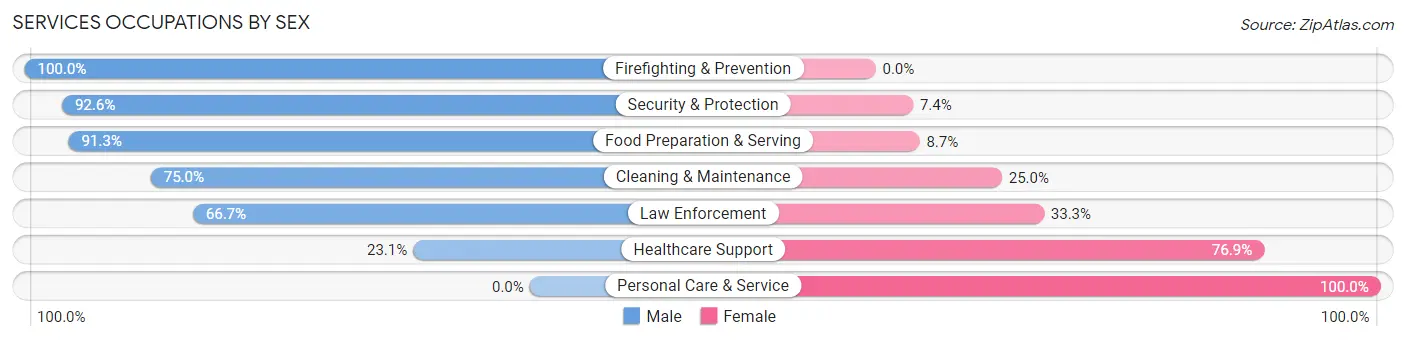
Services Occupations by Sex
Within the Services occupations in Rainier, the most male-oriented occupations are Firefighting & Prevention (100.0%), Security & Protection (92.6%), and Food Preparation & Serving (91.3%), while the most female-oriented occupations are Personal Care & Service (100.0%), Healthcare Support (76.9%), and Law Enforcement (33.3%).
| Occupation | Male | Female |
| Healthcare Support | 15 (23.1%) | 50 (76.9%) |
| Security & Protection | 50 (92.6%) | 4 (7.4%) |
| Firefighting & Prevention | 42 (100.0%) | 0 (0.0%) |
| Law Enforcement | 8 (66.7%) | 4 (33.3%) |
| Food Preparation & Serving | 42 (91.3%) | 4 (8.7%) |
| Cleaning & Maintenance | 18 (75.0%) | 6 (25.0%) |
| Personal Care & Service | 0 (0.0%) | 7 (100.0%) |
| Total (Category) | 125 (63.8%) | 71 (36.2%) |
| Total (Overall) | 630 (57.0%) | 475 (43.0%) |
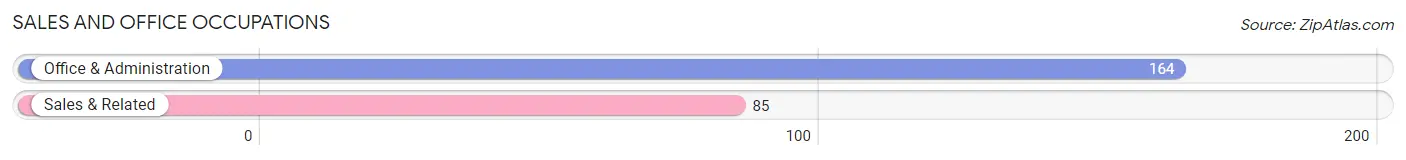
Sales and Office Occupations
The most common Sales and Office occupations in Rainier are Office & Administration (164 | 14.8%), and Sales & Related (85 | 7.7%).
Sales and Office Occupations by Sex
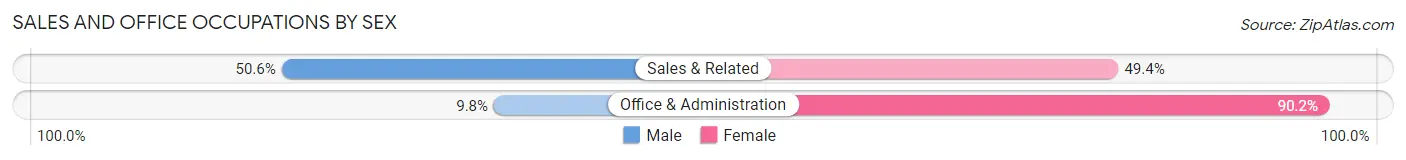
| Occupation | Male | Female |
| Sales & Related | 43 (50.6%) | 42 (49.4%) |
| Office & Administration | 16 (9.8%) | 148 (90.2%) |
| Total (Category) | 59 (23.7%) | 190 (76.3%) |
| Total (Overall) | 630 (57.0%) | 475 (43.0%) |
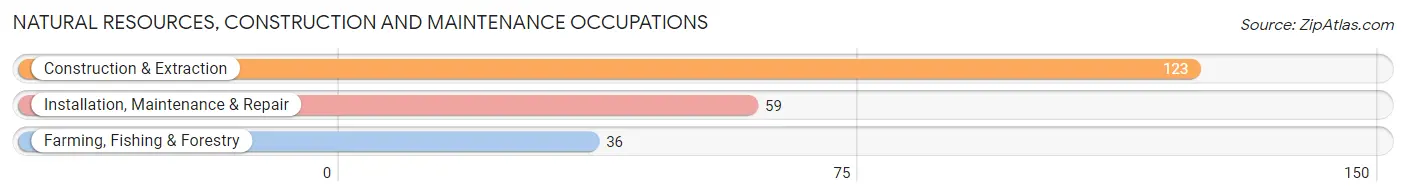
Natural Resources, Construction and Maintenance Occupations
The most common Natural Resources, Construction and Maintenance occupations in Rainier are Construction & Extraction (123 | 11.1%), Installation, Maintenance & Repair (59 | 5.3%), and Farming, Fishing & Forestry (36 | 3.3%).
Natural Resources, Construction and Maintenance Occupations by Sex
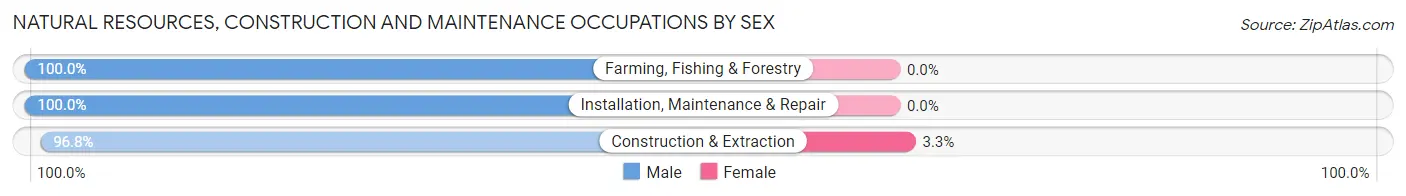
| Occupation | Male | Female |
| Farming, Fishing & Forestry | 36 (100.0%) | 0 (0.0%) |
| Construction & Extraction | 119 (96.8%) | 4 (3.3%) |
| Installation, Maintenance & Repair | 59 (100.0%) | 0 (0.0%) |
| Total (Category) | 214 (98.2%) | 4 (1.8%) |
| Total (Overall) | 630 (57.0%) | 475 (43.0%) |
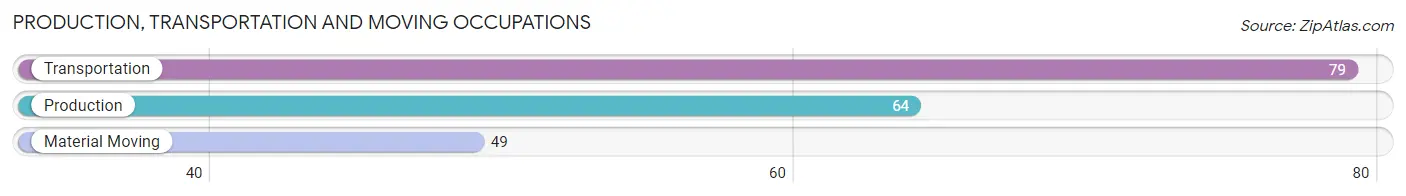
Production, Transportation and Moving Occupations
The most common Production, Transportation and Moving occupations in Rainier are Transportation (79 | 7.1%), Production (64 | 5.8%), and Material Moving (49 | 4.4%).
Production, Transportation and Moving Occupations by Sex
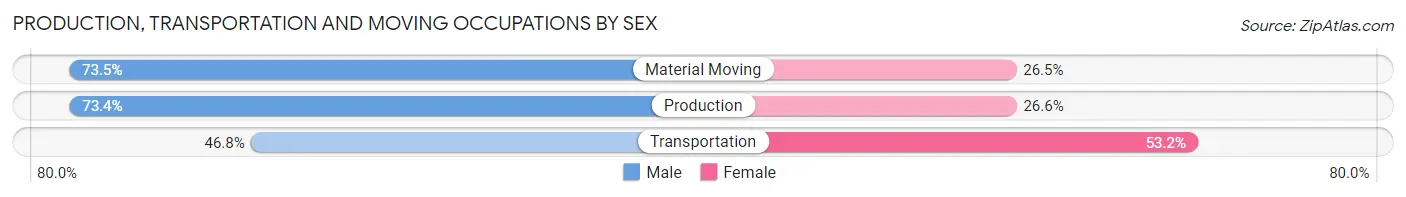
| Occupation | Male | Female |
| Production | 47 (73.4%) | 17 (26.6%) |
| Transportation | 37 (46.8%) | 42 (53.2%) |
| Material Moving | 36 (73.5%) | 13 (26.5%) |
| Total (Category) | 120 (62.5%) | 72 (37.5%) |
| Total (Overall) | 630 (57.0%) | 475 (43.0%) |
Employment Industries by Sex in Rainier
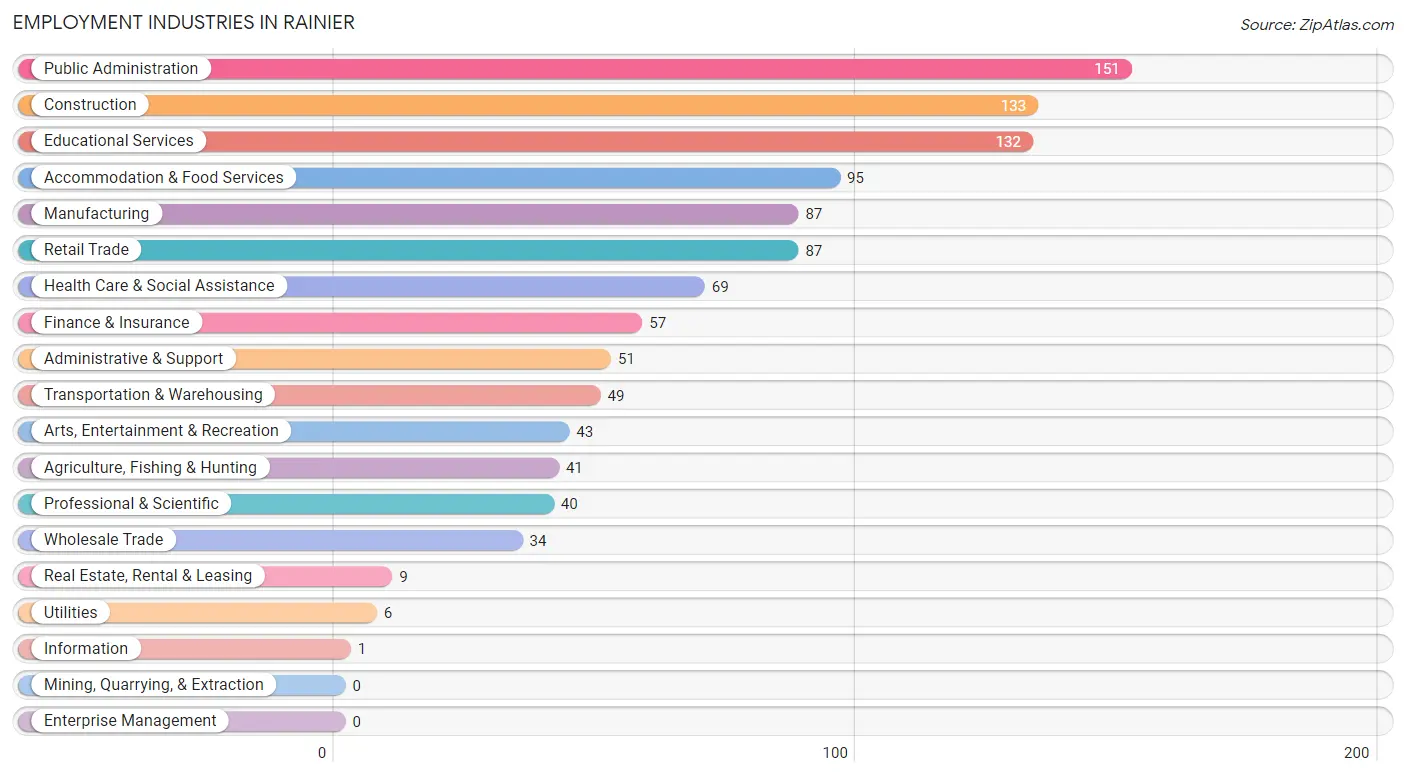
Employment Industries in Rainier
The major employment industries in Rainier include Public Administration (151 | 13.7%), Construction (133 | 12.0%), Educational Services (132 | 11.9%), Accommodation & Food Services (95 | 8.6%), and Manufacturing (87 | 7.9%).
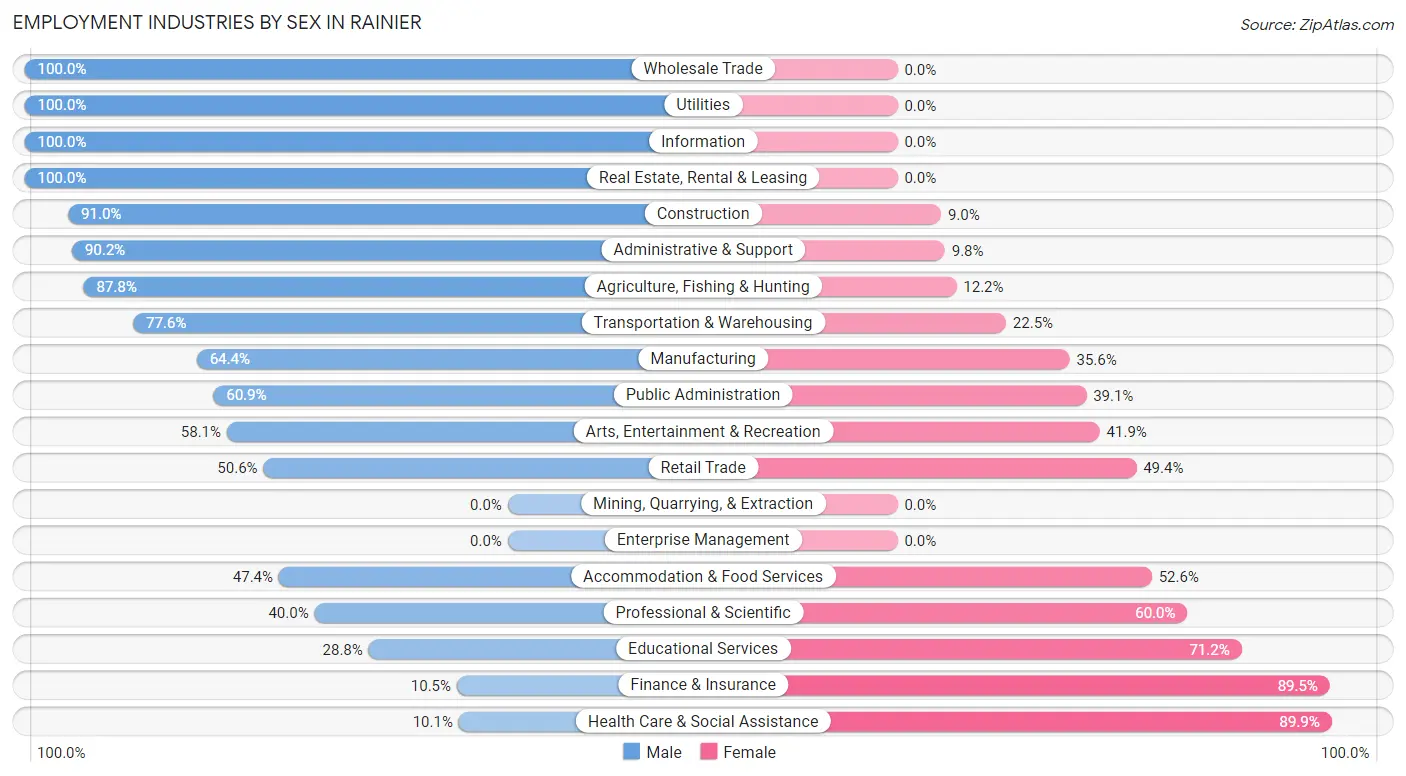
Employment Industries by Sex in Rainier
The Rainier industries that see more men than women are Wholesale Trade (100.0%), Utilities (100.0%), and Information (100.0%), whereas the industries that tend to have a higher number of women are Health Care & Social Assistance (89.9%), Finance & Insurance (89.5%), and Educational Services (71.2%).
| Industry | Male | Female |
| Agriculture, Fishing & Hunting | 36 (87.8%) | 5 (12.2%) |
| Mining, Quarrying, & Extraction | 0 (0.0%) | 0 (0.0%) |
| Construction | 121 (91.0%) | 12 (9.0%) |
| Manufacturing | 56 (64.4%) | 31 (35.6%) |
| Wholesale Trade | 34 (100.0%) | 0 (0.0%) |
| Retail Trade | 44 (50.6%) | 43 (49.4%) |
| Transportation & Warehousing | 38 (77.5%) | 11 (22.5%) |
| Utilities | 6 (100.0%) | 0 (0.0%) |
| Information | 1 (100.0%) | 0 (0.0%) |
| Finance & Insurance | 6 (10.5%) | 51 (89.5%) |
| Real Estate, Rental & Leasing | 9 (100.0%) | 0 (0.0%) |
| Professional & Scientific | 16 (40.0%) | 24 (60.0%) |
| Enterprise Management | 0 (0.0%) | 0 (0.0%) |
| Administrative & Support | 46 (90.2%) | 5 (9.8%) |
| Educational Services | 38 (28.8%) | 94 (71.2%) |
| Health Care & Social Assistance | 7 (10.1%) | 62 (89.9%) |
| Arts, Entertainment & Recreation | 25 (58.1%) | 18 (41.9%) |
| Accommodation & Food Services | 45 (47.4%) | 50 (52.6%) |
| Public Administration | 92 (60.9%) | 59 (39.1%) |
| Total | 630 (57.0%) | 475 (43.0%) |
Education in Rainier
School Enrollment in Rainier
The most common levels of schooling among the 639 students in Rainier are elementary school (174 | 27.2%), middle school (168 | 26.3%), and high school (123 | 19.3%).
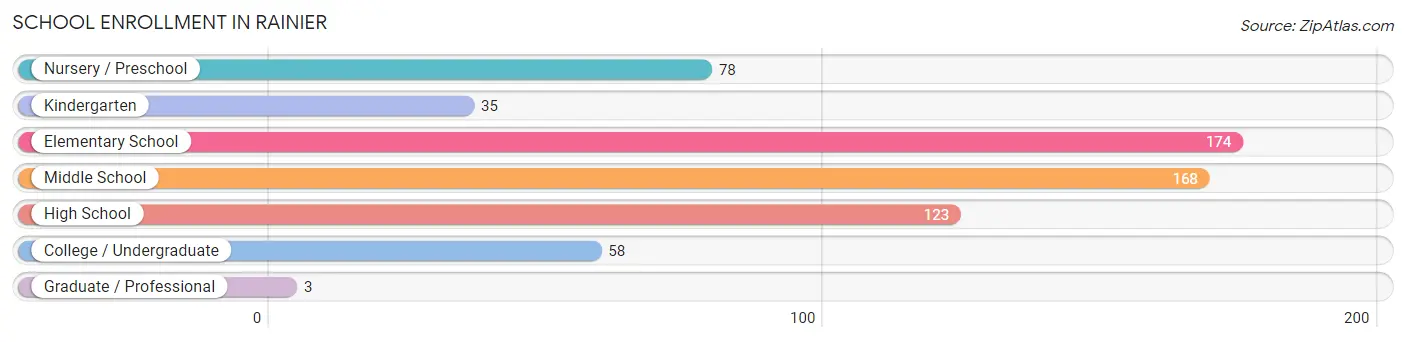
| School Level | # Students | % Students |
| Nursery / Preschool | 78 | 12.2% |
| Kindergarten | 35 | 5.5% |
| Elementary School | 174 | 27.2% |
| Middle School | 168 | 26.3% |
| High School | 123 | 19.3% |
| College / Undergraduate | 58 | 9.1% |
| Graduate / Professional | 3 | 0.5% |
| Total | 639 | 100.0% |
School Enrollment by Age by Funding Source in Rainier
Out of a total of 639 students who are enrolled in schools in Rainier, 168 (26.3%) attend a private institution, while the remaining 471 (73.7%) are enrolled in public schools. The age group of 35 years and over has the highest likelihood of being enrolled in private schools, with 18 (66.7% in the age bracket) enrolled. Conversely, the age group of 18 to 19 year olds has the lowest likelihood of being enrolled in a private school, with 21 (100.0% in the age bracket) attending a public institution.
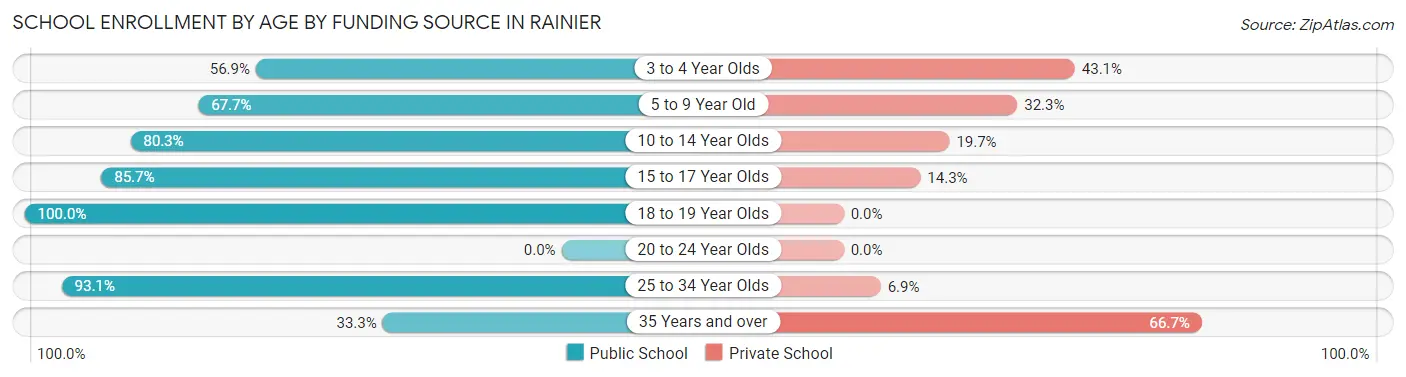
| Age Bracket | Public School | Private School |
| 3 to 4 Year Olds | 41 (56.9%) | 31 (43.1%) |
| 5 to 9 Year Old | 136 (67.7%) | 65 (32.3%) |
| 10 to 14 Year Olds | 159 (80.3%) | 39 (19.7%) |
| 15 to 17 Year Olds | 78 (85.7%) | 13 (14.3%) |
| 18 to 19 Year Olds | 21 (100.0%) | 0 (0.0%) |
| 20 to 24 Year Olds | 0 (0.0%) | 0 (0.0%) |
| 25 to 34 Year Olds | 27 (93.1%) | 2 (6.9%) |
| 35 Years and over | 9 (33.3%) | 18 (66.7%) |
| Total | 471 (73.7%) | 168 (26.3%) |
Educational Attainment by Field of Study in Rainier
Business (66 | 20.4%), arts & humanities (50 | 15.5%), education (41 | 12.7%), computers & mathematics (34 | 10.5%), and psychology (34 | 10.5%) are the most common fields of study among 323 individuals in Rainier who have obtained a bachelor's degree or higher.
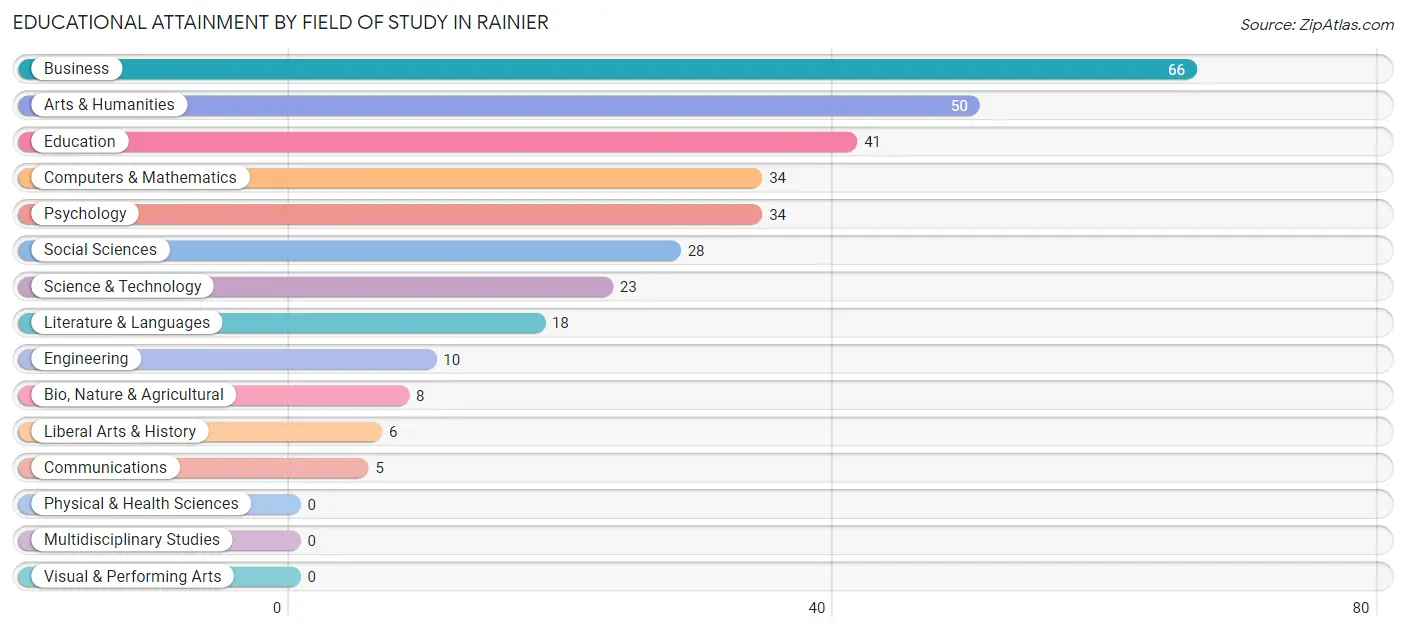
| Field of Study | # Graduates | % Graduates |
| Computers & Mathematics | 34 | 10.5% |
| Bio, Nature & Agricultural | 8 | 2.5% |
| Physical & Health Sciences | 0 | 0.0% |
| Psychology | 34 | 10.5% |
| Social Sciences | 28 | 8.7% |
| Engineering | 10 | 3.1% |
| Multidisciplinary Studies | 0 | 0.0% |
| Science & Technology | 23 | 7.1% |
| Business | 66 | 20.4% |
| Education | 41 | 12.7% |
| Literature & Languages | 18 | 5.6% |
| Liberal Arts & History | 6 | 1.9% |
| Visual & Performing Arts | 0 | 0.0% |
| Communications | 5 | 1.5% |
| Arts & Humanities | 50 | 15.5% |
| Total | 323 | 100.0% |
Transportation & Commute in Rainier
Vehicle Availability by Sex in Rainier
The most prevalent vehicle ownership categories in Rainier are males with 2 vehicles (212, accounting for 33.8%) and females with 2 vehicles (186, making up 45.6%).
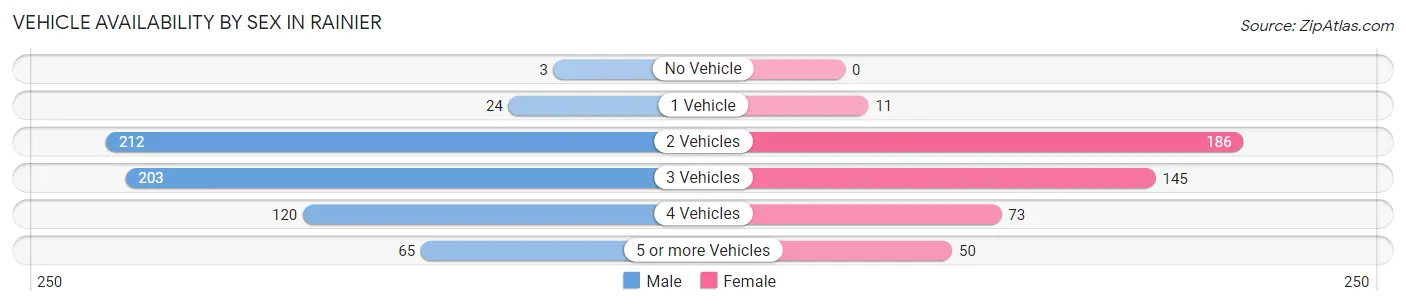
| Vehicles Available | Male | Female |
| No Vehicle | 3 (0.5%) | 0 (0.0%) |
| 1 Vehicle | 24 (3.8%) | 11 (2.4%) |
| 2 Vehicles | 212 (33.8%) | 186 (40.0%) |
| 3 Vehicles | 203 (32.4%) | 145 (31.2%) |
| 4 Vehicles | 120 (19.1%) | 73 (15.7%) |
| 5 or more Vehicles | 65 (10.4%) | 50 (10.7%) |
| Total | 627 (100.0%) | 465 (100.0%) |
Commute Time in Rainier
The most frequently occuring commute durations in Rainier are 30 to 34 minutes (237 commuters, 26.2%), 60 to 89 minutes (122 commuters, 13.5%), and 25 to 29 minutes (87 commuters, 9.6%).
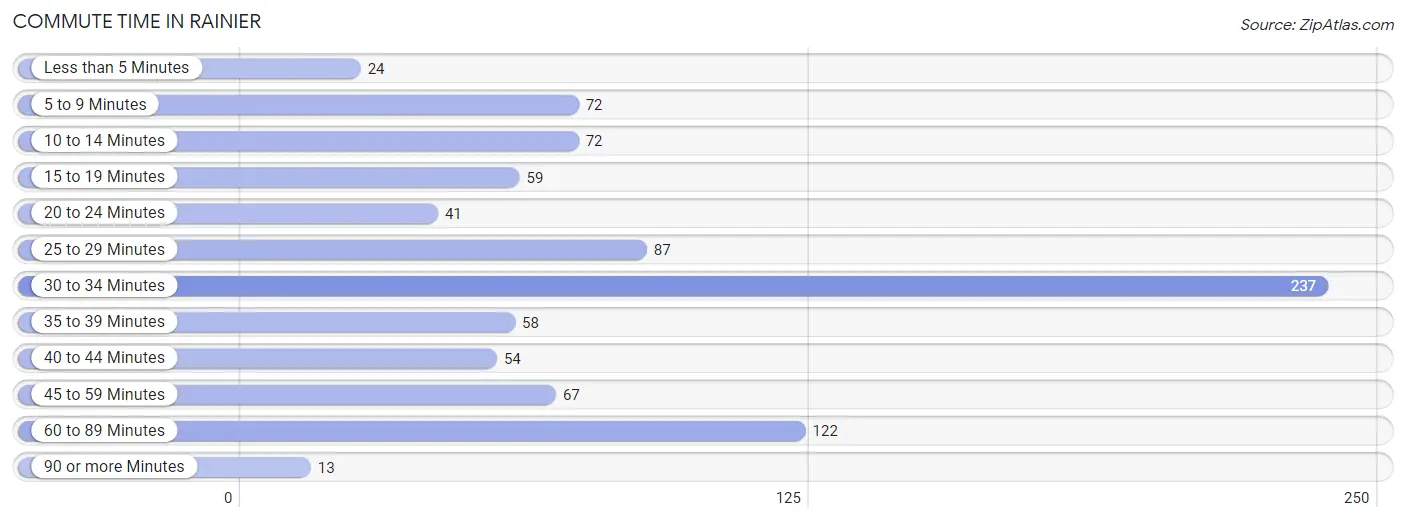
| Commute Time | # Commuters | % Commuters |
| Less than 5 Minutes | 24 | 2.6% |
| 5 to 9 Minutes | 72 | 8.0% |
| 10 to 14 Minutes | 72 | 8.0% |
| 15 to 19 Minutes | 59 | 6.5% |
| 20 to 24 Minutes | 41 | 4.5% |
| 25 to 29 Minutes | 87 | 9.6% |
| 30 to 34 Minutes | 237 | 26.2% |
| 35 to 39 Minutes | 58 | 6.4% |
| 40 to 44 Minutes | 54 | 6.0% |
| 45 to 59 Minutes | 67 | 7.4% |
| 60 to 89 Minutes | 122 | 13.5% |
| 90 or more Minutes | 13 | 1.4% |
Commute Time by Sex in Rainier
The most common commute times in Rainier are 30 to 34 minutes (158 commuters, 31.1%) for males and 30 to 34 minutes (79 commuters, 19.9%) for females.
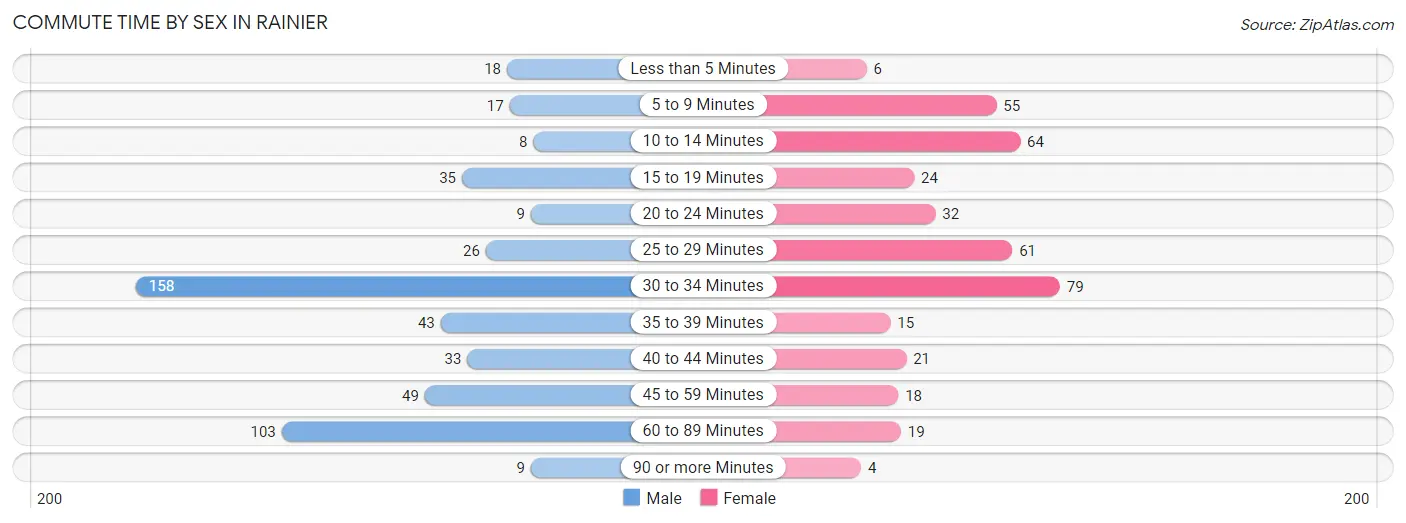
| Commute Time | Male | Female |
| Less than 5 Minutes | 18 (3.5%) | 6 (1.5%) |
| 5 to 9 Minutes | 17 (3.4%) | 55 (13.8%) |
| 10 to 14 Minutes | 8 (1.6%) | 64 (16.1%) |
| 15 to 19 Minutes | 35 (6.9%) | 24 (6.0%) |
| 20 to 24 Minutes | 9 (1.8%) | 32 (8.0%) |
| 25 to 29 Minutes | 26 (5.1%) | 61 (15.3%) |
| 30 to 34 Minutes | 158 (31.1%) | 79 (19.9%) |
| 35 to 39 Minutes | 43 (8.5%) | 15 (3.8%) |
| 40 to 44 Minutes | 33 (6.5%) | 21 (5.3%) |
| 45 to 59 Minutes | 49 (9.7%) | 18 (4.5%) |
| 60 to 89 Minutes | 103 (20.3%) | 19 (4.8%) |
| 90 or more Minutes | 9 (1.8%) | 4 (1.0%) |
Time of Departure to Work by Sex in Rainier
The most frequent times of departure to work in Rainier are 12:00 AM to 4:59 AM (80, 15.8%) for males and 6:00 AM to 6:29 AM (55, 13.8%) for females.
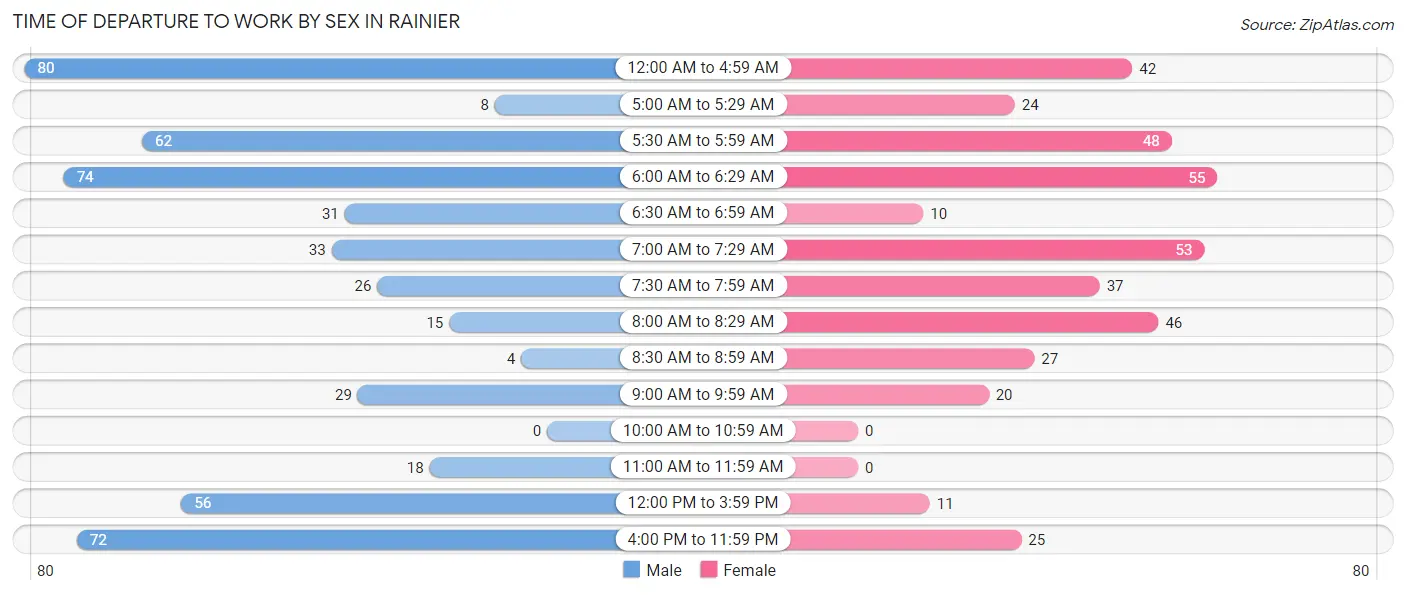
| Time of Departure | Male | Female |
| 12:00 AM to 4:59 AM | 80 (15.8%) | 42 (10.5%) |
| 5:00 AM to 5:29 AM | 8 (1.6%) | 24 (6.0%) |
| 5:30 AM to 5:59 AM | 62 (12.2%) | 48 (12.1%) |
| 6:00 AM to 6:29 AM | 74 (14.6%) | 55 (13.8%) |
| 6:30 AM to 6:59 AM | 31 (6.1%) | 10 (2.5%) |
| 7:00 AM to 7:29 AM | 33 (6.5%) | 53 (13.3%) |
| 7:30 AM to 7:59 AM | 26 (5.1%) | 37 (9.3%) |
| 8:00 AM to 8:29 AM | 15 (2.9%) | 46 (11.6%) |
| 8:30 AM to 8:59 AM | 4 (0.8%) | 27 (6.8%) |
| 9:00 AM to 9:59 AM | 29 (5.7%) | 20 (5.0%) |
| 10:00 AM to 10:59 AM | 0 (0.0%) | 0 (0.0%) |
| 11:00 AM to 11:59 AM | 18 (3.5%) | 0 (0.0%) |
| 12:00 PM to 3:59 PM | 56 (11.0%) | 11 (2.8%) |
| 4:00 PM to 11:59 PM | 72 (14.2%) | 25 (6.3%) |
| Total | 508 (100.0%) | 398 (100.0%) |
Housing Occupancy in Rainier
Occupancy by Ownership in Rainier
Of the total 856 dwellings in Rainier, owner-occupied units account for 723 (84.5%), while renter-occupied units make up 133 (15.5%).
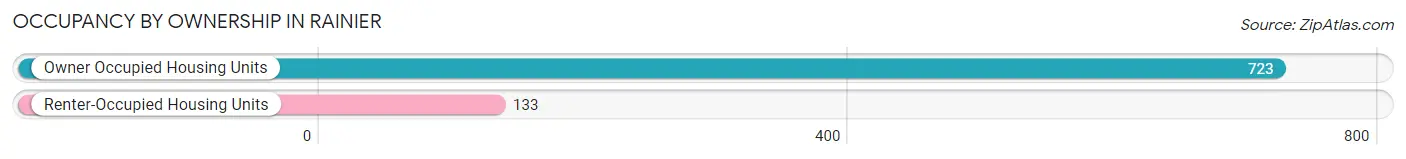
| Occupancy | # Housing Units | % Housing Units |
| Owner Occupied Housing Units | 723 | 84.5% |
| Renter-Occupied Housing Units | 133 | 15.5% |
| Total Occupied Housing Units | 856 | 100.0% |
Occupancy by Household Size in Rainier
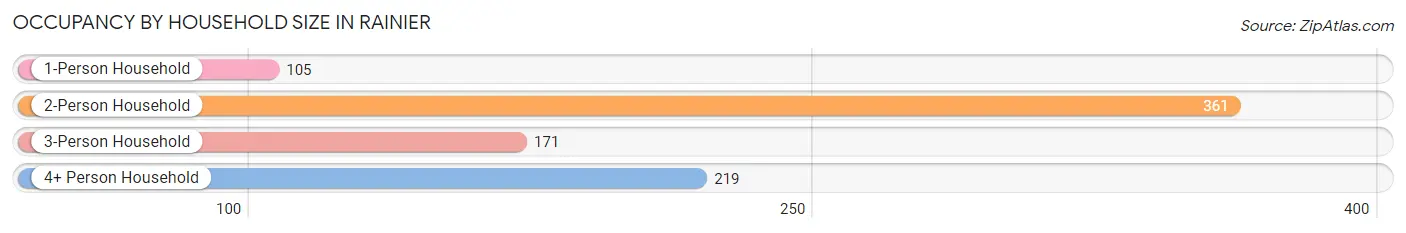
| Household Size | # Housing Units | % Housing Units |
| 1-Person Household | 105 | 12.3% |
| 2-Person Household | 361 | 42.2% |
| 3-Person Household | 171 | 20.0% |
| 4+ Person Household | 219 | 25.6% |
| Total Housing Units | 856 | 100.0% |
Occupancy by Ownership by Household Size in Rainier
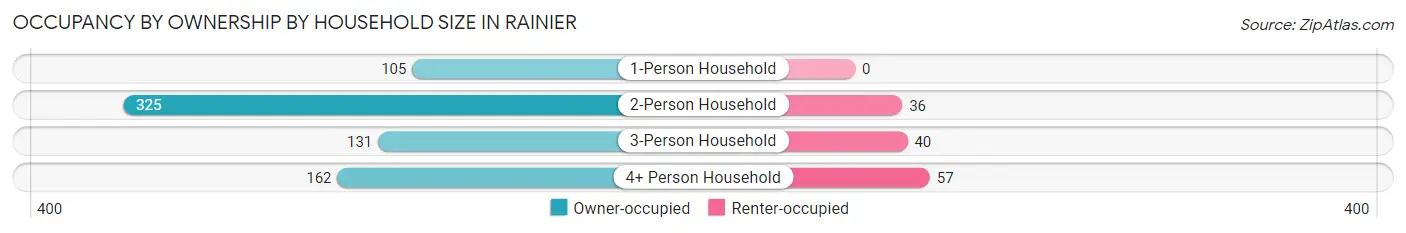
| Household Size | Owner-occupied | Renter-occupied |
| 1-Person Household | 105 (100.0%) | 0 (0.0%) |
| 2-Person Household | 325 (90.0%) | 36 (10.0%) |
| 3-Person Household | 131 (76.6%) | 40 (23.4%) |
| 4+ Person Household | 162 (74.0%) | 57 (26.0%) |
| Total Housing Units | 723 (84.5%) | 133 (15.5%) |
Occupancy by Educational Attainment in Rainier
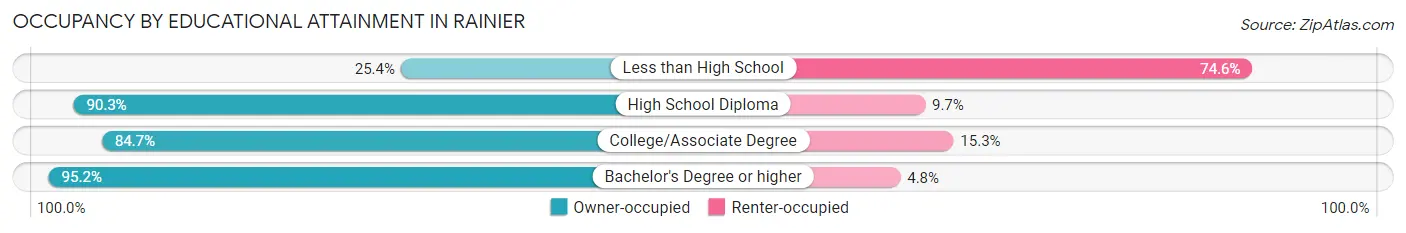
| Household Size | Owner-occupied | Renter-occupied |
| Less than High School | 15 (25.4%) | 44 (74.6%) |
| High School Diploma | 177 (90.3%) | 19 (9.7%) |
| College/Associate Degree | 332 (84.7%) | 60 (15.3%) |
| Bachelor's Degree or higher | 199 (95.2%) | 10 (4.8%) |
Occupancy by Age of Householder in Rainier
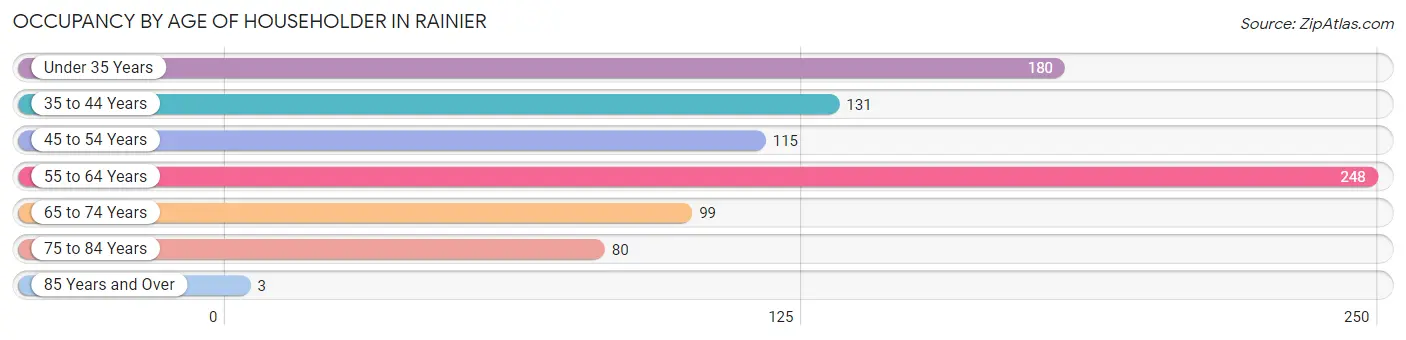
| Age Bracket | # Households | % Households |
| Under 35 Years | 180 | 21.0% |
| 35 to 44 Years | 131 | 15.3% |
| 45 to 54 Years | 115 | 13.4% |
| 55 to 64 Years | 248 | 29.0% |
| 65 to 74 Years | 99 | 11.6% |
| 75 to 84 Years | 80 | 9.3% |
| 85 Years and Over | 3 | 0.4% |
| Total | 856 | 100.0% |
Housing Finances in Rainier
Median Income by Occupancy in Rainier
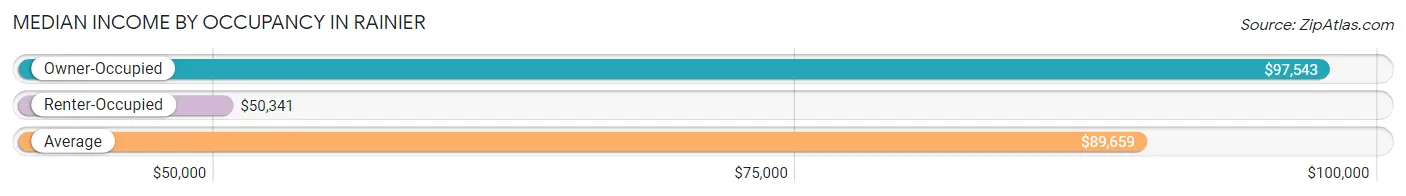
| Occupancy Type | # Households | Median Income |
| Owner-Occupied | 723 (84.5%) | $97,543 |
| Renter-Occupied | 133 (15.5%) | $50,341 |
| Average | 856 (100.0%) | $89,659 |
Occupancy by Householder Income Bracket in Rainier
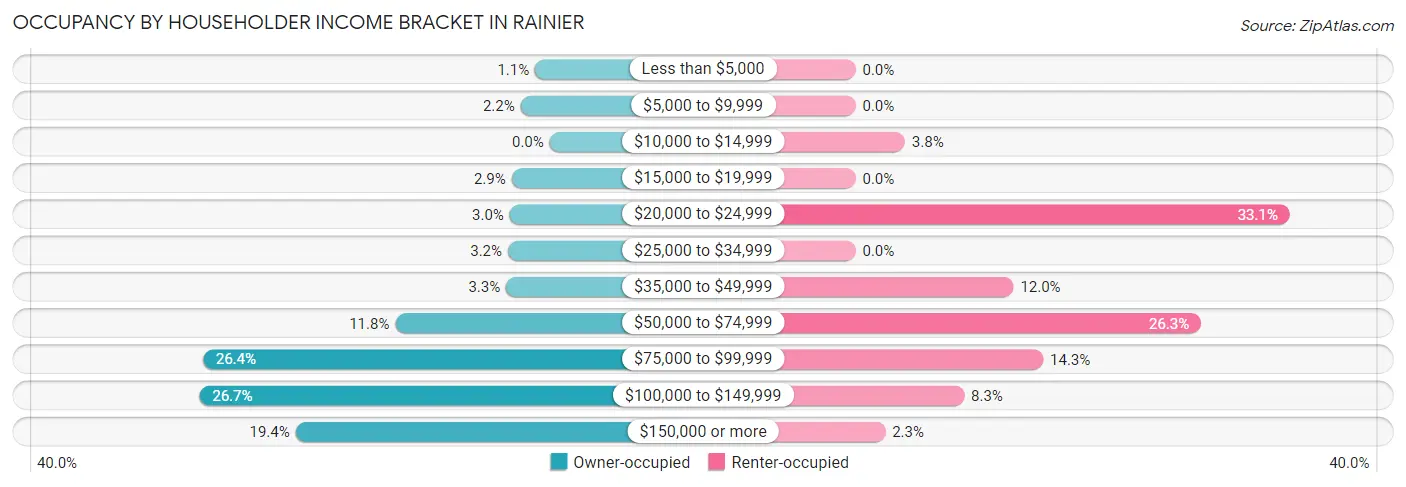
| Income Bracket | Owner-occupied | Renter-occupied |
| Less than $5,000 | 8 (1.1%) | 0 (0.0%) |
| $5,000 to $9,999 | 16 (2.2%) | 0 (0.0%) |
| $10,000 to $14,999 | 0 (0.0%) | 5 (3.8%) |
| $15,000 to $19,999 | 21 (2.9%) | 0 (0.0%) |
| $20,000 to $24,999 | 22 (3.0%) | 44 (33.1%) |
| $25,000 to $34,999 | 23 (3.2%) | 0 (0.0%) |
| $35,000 to $49,999 | 24 (3.3%) | 16 (12.0%) |
| $50,000 to $74,999 | 85 (11.8%) | 35 (26.3%) |
| $75,000 to $99,999 | 191 (26.4%) | 19 (14.3%) |
| $100,000 to $149,999 | 193 (26.7%) | 11 (8.3%) |
| $150,000 or more | 140 (19.4%) | 3 (2.3%) |
| Total | 723 (100.0%) | 133 (100.0%) |
Monthly Housing Cost Tiers in Rainier
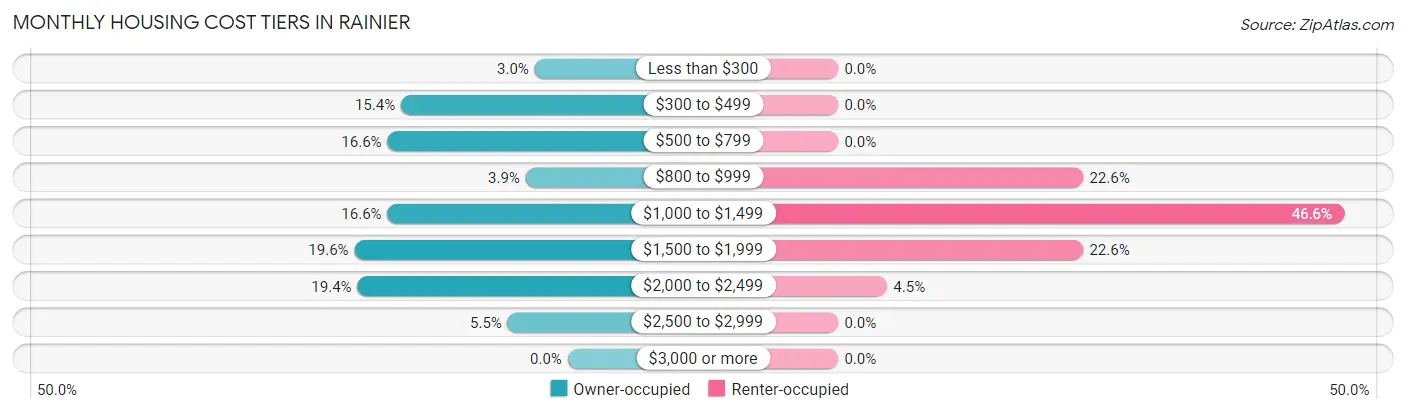
| Monthly Cost | Owner-occupied | Renter-occupied |
| Less than $300 | 22 (3.0%) | 0 (0.0%) |
| $300 to $499 | 111 (15.3%) | 0 (0.0%) |
| $500 to $799 | 120 (16.6%) | 0 (0.0%) |
| $800 to $999 | 28 (3.9%) | 30 (22.6%) |
| $1,000 to $1,499 | 120 (16.6%) | 62 (46.6%) |
| $1,500 to $1,999 | 142 (19.6%) | 30 (22.6%) |
| $2,000 to $2,499 | 140 (19.4%) | 6 (4.5%) |
| $2,500 to $2,999 | 40 (5.5%) | 0 (0.0%) |
| $3,000 or more | 0 (0.0%) | 0 (0.0%) |
| Total | 723 (100.0%) | 133 (100.0%) |
Physical Housing Characteristics in Rainier
Housing Structures in Rainier
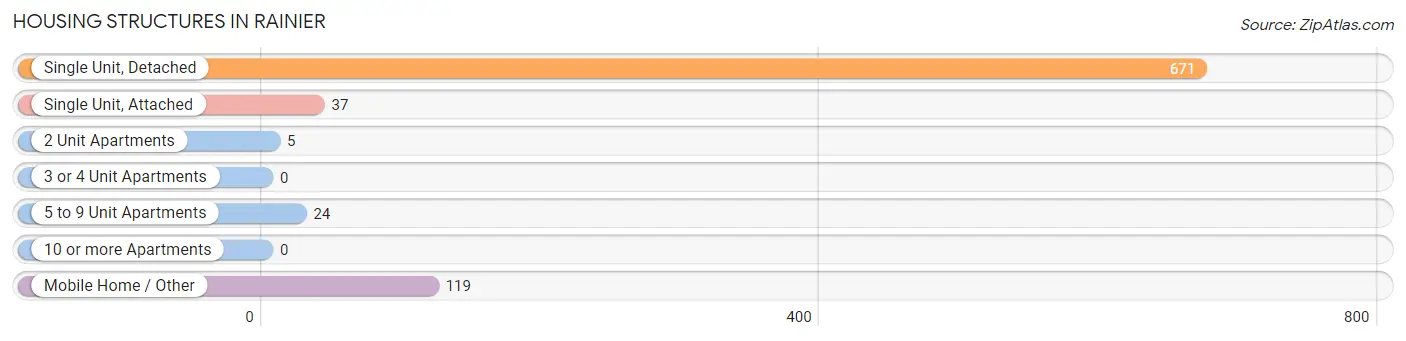
| Structure Type | # Housing Units | % Housing Units |
| Single Unit, Detached | 671 | 78.4% |
| Single Unit, Attached | 37 | 4.3% |
| 2 Unit Apartments | 5 | 0.6% |
| 3 or 4 Unit Apartments | 0 | 0.0% |
| 5 to 9 Unit Apartments | 24 | 2.8% |
| 10 or more Apartments | 0 | 0.0% |
| Mobile Home / Other | 119 | 13.9% |
| Total | 856 | 100.0% |
Housing Structures by Occupancy in Rainier
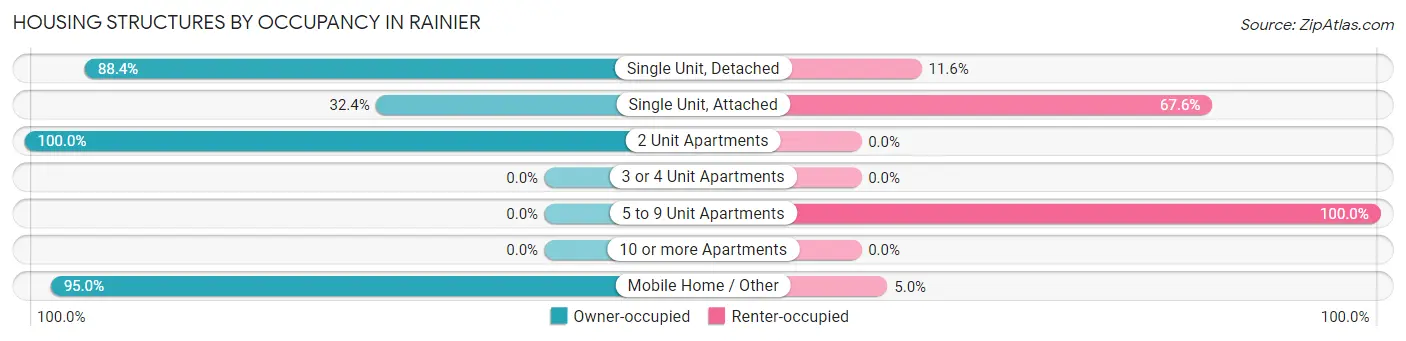
| Structure Type | Owner-occupied | Renter-occupied |
| Single Unit, Detached | 593 (88.4%) | 78 (11.6%) |
| Single Unit, Attached | 12 (32.4%) | 25 (67.6%) |
| 2 Unit Apartments | 5 (100.0%) | 0 (0.0%) |
| 3 or 4 Unit Apartments | 0 (0.0%) | 0 (0.0%) |
| 5 to 9 Unit Apartments | 0 (0.0%) | 24 (100.0%) |
| 10 or more Apartments | 0 (0.0%) | 0 (0.0%) |
| Mobile Home / Other | 113 (95.0%) | 6 (5.0%) |
| Total | 723 (84.5%) | 133 (15.5%) |
Housing Structures by Number of Rooms in Rainier
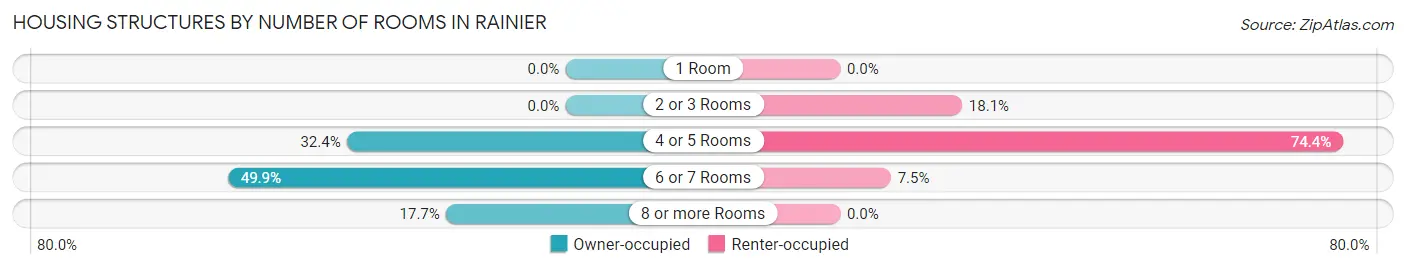
| Number of Rooms | Owner-occupied | Renter-occupied |
| 1 Room | 0 (0.0%) | 0 (0.0%) |
| 2 or 3 Rooms | 0 (0.0%) | 24 (18.0%) |
| 4 or 5 Rooms | 234 (32.4%) | 99 (74.4%) |
| 6 or 7 Rooms | 361 (49.9%) | 10 (7.5%) |
| 8 or more Rooms | 128 (17.7%) | 0 (0.0%) |
| Total | 723 (100.0%) | 133 (100.0%) |
Housing Structure by Heating Type in Rainier
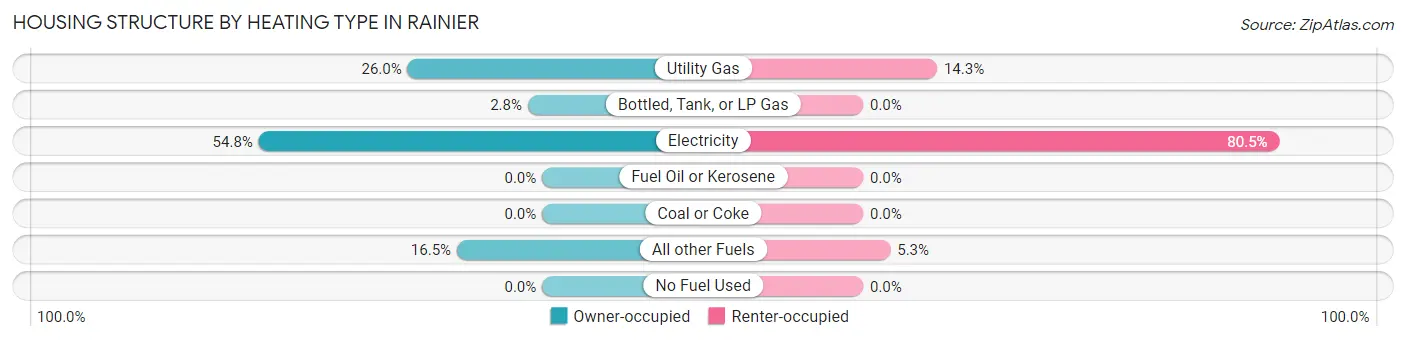
| Heating Type | Owner-occupied | Renter-occupied |
| Utility Gas | 188 (26.0%) | 19 (14.3%) |
| Bottled, Tank, or LP Gas | 20 (2.8%) | 0 (0.0%) |
| Electricity | 396 (54.8%) | 107 (80.4%) |
| Fuel Oil or Kerosene | 0 (0.0%) | 0 (0.0%) |
| Coal or Coke | 0 (0.0%) | 0 (0.0%) |
| All other Fuels | 119 (16.5%) | 7 (5.3%) |
| No Fuel Used | 0 (0.0%) | 0 (0.0%) |
| Total | 723 (100.0%) | 133 (100.0%) |
Household Vehicle Usage in Rainier
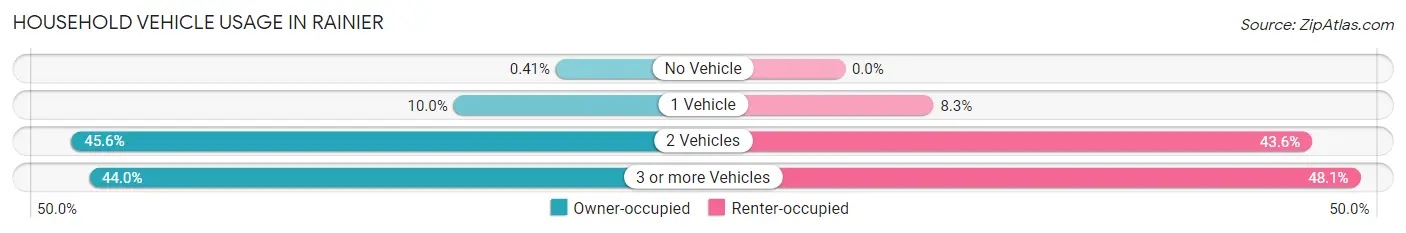
| Vehicles per Household | Owner-occupied | Renter-occupied |
| No Vehicle | 3 (0.4%) | 0 (0.0%) |
| 1 Vehicle | 72 (10.0%) | 11 (8.3%) |
| 2 Vehicles | 330 (45.6%) | 58 (43.6%) |
| 3 or more Vehicles | 318 (44.0%) | 64 (48.1%) |
| Total | 723 (100.0%) | 133 (100.0%) |
Real Estate & Mortgages in Rainier
Real Estate and Mortgage Overview in Rainier
| Characteristic | Without Mortgage | With Mortgage |
| Housing Units | 240 | 483 |
| Median Property Value | $310,700 | $338,000 |
| Median Household Income | $95,405 | $82 |
| Monthly Housing Costs | $487 | $0 |
| Real Estate Taxes | $2,476 | $0 |
Property Value by Mortgage Status in Rainier
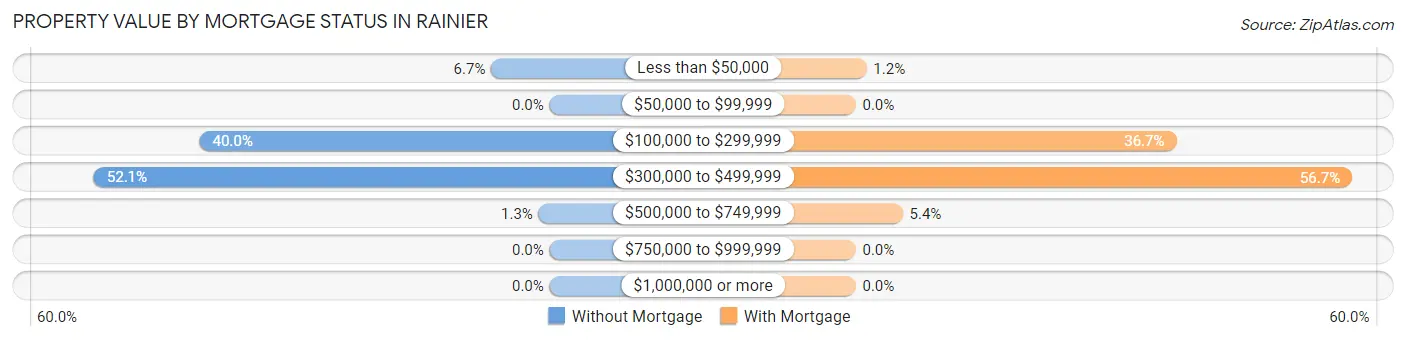
| Property Value | Without Mortgage | With Mortgage |
| Less than $50,000 | 16 (6.7%) | 6 (1.2%) |
| $50,000 to $99,999 | 0 (0.0%) | 0 (0.0%) |
| $100,000 to $299,999 | 96 (40.0%) | 177 (36.6%) |
| $300,000 to $499,999 | 125 (52.1%) | 274 (56.7%) |
| $500,000 to $749,999 | 3 (1.3%) | 26 (5.4%) |
| $750,000 to $999,999 | 0 (0.0%) | 0 (0.0%) |
| $1,000,000 or more | 0 (0.0%) | 0 (0.0%) |
| Total | 240 (100.0%) | 483 (100.0%) |
Household Income by Mortgage Status in Rainier
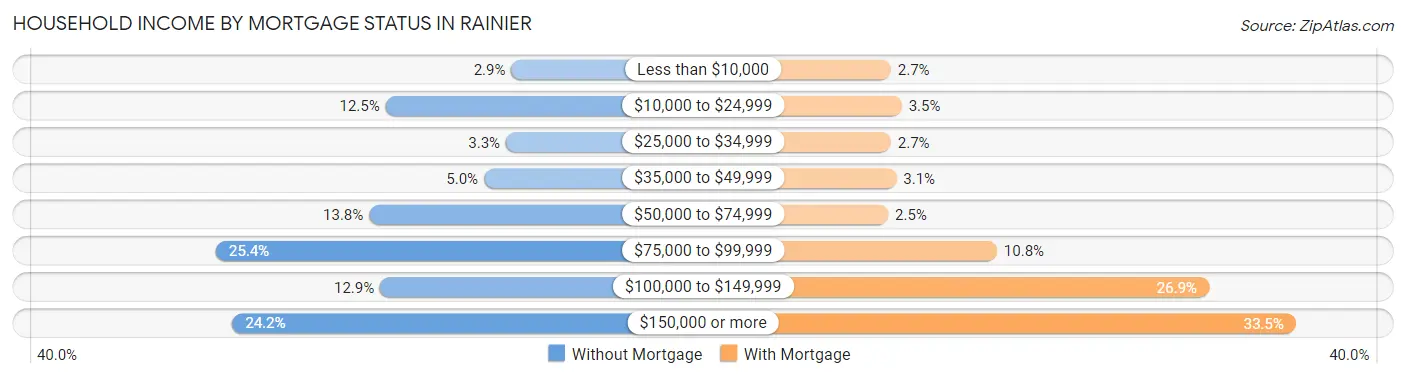
| Household Income | Without Mortgage | With Mortgage |
| Less than $10,000 | 7 (2.9%) | 13 (2.7%) |
| $10,000 to $24,999 | 30 (12.5%) | 17 (3.5%) |
| $25,000 to $34,999 | 8 (3.3%) | 13 (2.7%) |
| $35,000 to $49,999 | 12 (5.0%) | 15 (3.1%) |
| $50,000 to $74,999 | 33 (13.8%) | 12 (2.5%) |
| $75,000 to $99,999 | 61 (25.4%) | 52 (10.8%) |
| $100,000 to $149,999 | 31 (12.9%) | 130 (26.9%) |
| $150,000 or more | 58 (24.2%) | 162 (33.5%) |
| Total | 240 (100.0%) | 483 (100.0%) |
Property Value to Household Income Ratio in Rainier
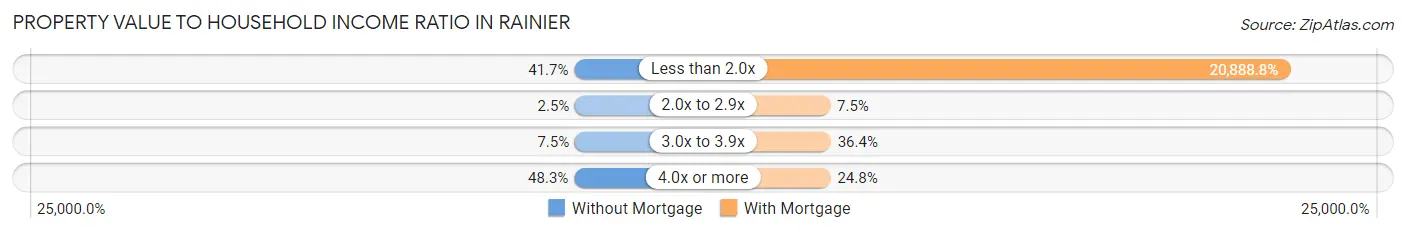
| Value-to-Income Ratio | Without Mortgage | With Mortgage |
| Less than 2.0x | 100 (41.7%) | 100,893 (20,888.8%) |
| 2.0x to 2.9x | 6 (2.5%) | 36 (7.4%) |
| 3.0x to 3.9x | 18 (7.5%) | 176 (36.4%) |
| 4.0x or more | 116 (48.3%) | 120 (24.8%) |
| Total | 240 (100.0%) | 483 (100.0%) |
Real Estate Taxes by Mortgage Status in Rainier
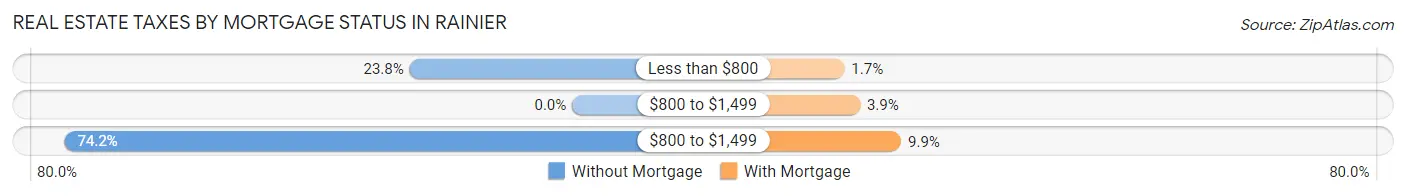
| Property Taxes | Without Mortgage | With Mortgage |
| Less than $800 | 57 (23.7%) | 8 (1.7%) |
| $800 to $1,499 | 0 (0.0%) | 19 (3.9%) |
| $800 to $1,499 | 178 (74.2%) | 48 (9.9%) |
| Total | 240 (100.0%) | 483 (100.0%) |
Health & Disability in Rainier
Health Insurance Coverage by Age in Rainier
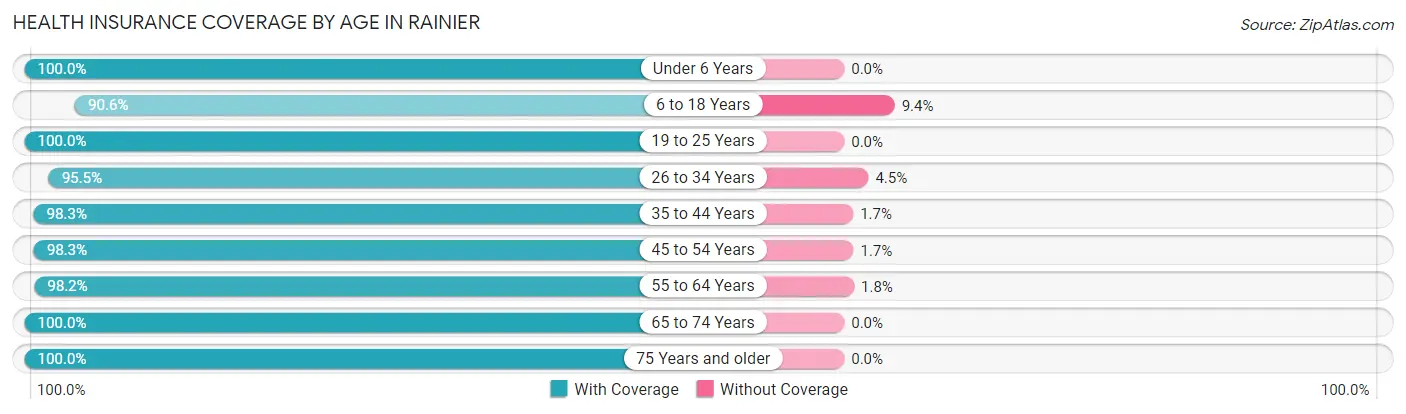
| Age Bracket | With Coverage | Without Coverage |
| Under 6 Years | 202 (100.0%) | 0 (0.0%) |
| 6 to 18 Years | 443 (90.6%) | 46 (9.4%) |
| 19 to 25 Years | 175 (100.0%) | 0 (0.0%) |
| 26 to 34 Years | 339 (95.5%) | 16 (4.5%) |
| 35 to 44 Years | 353 (98.3%) | 6 (1.7%) |
| 45 to 54 Years | 342 (98.3%) | 6 (1.7%) |
| 55 to 64 Years | 375 (98.2%) | 7 (1.8%) |
| 65 to 74 Years | 269 (100.0%) | 0 (0.0%) |
| 75 Years and older | 108 (100.0%) | 0 (0.0%) |
| Total | 2,606 (97.0%) | 81 (3.0%) |
Health Insurance Coverage by Citizenship Status in Rainier
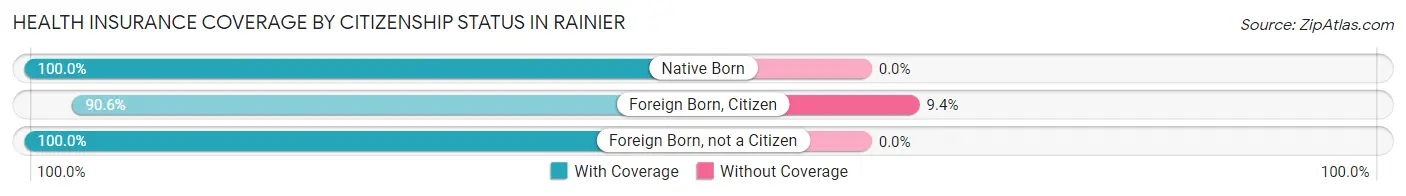
| Citizenship Status | With Coverage | Without Coverage |
| Native Born | 202 (100.0%) | 0 (0.0%) |
| Foreign Born, Citizen | 443 (90.6%) | 46 (9.4%) |
| Foreign Born, not a Citizen | 175 (100.0%) | 0 (0.0%) |
Health Insurance Coverage by Household Income in Rainier
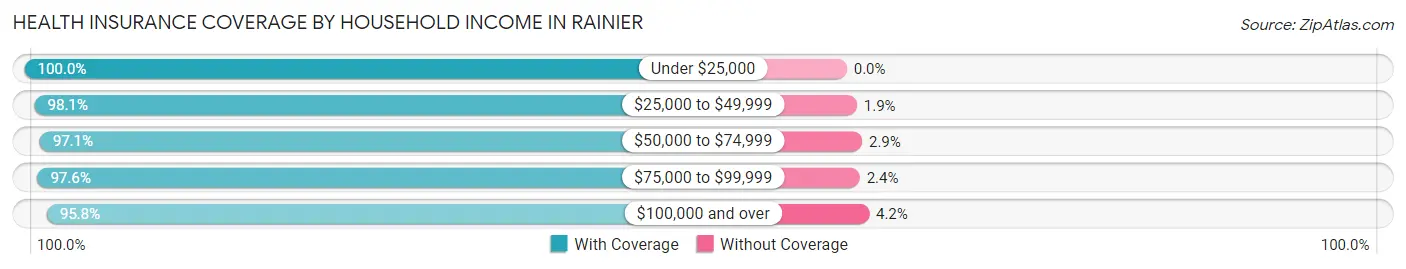
| Household Income | With Coverage | Without Coverage |
| Under $25,000 | 316 (100.0%) | 0 (0.0%) |
| $25,000 to $49,999 | 157 (98.1%) | 3 (1.9%) |
| $50,000 to $74,999 | 306 (97.1%) | 9 (2.9%) |
| $75,000 to $99,999 | 564 (97.6%) | 14 (2.4%) |
| $100,000 and over | 1,263 (95.8%) | 55 (4.2%) |
Public vs Private Health Insurance Coverage by Age in Rainier
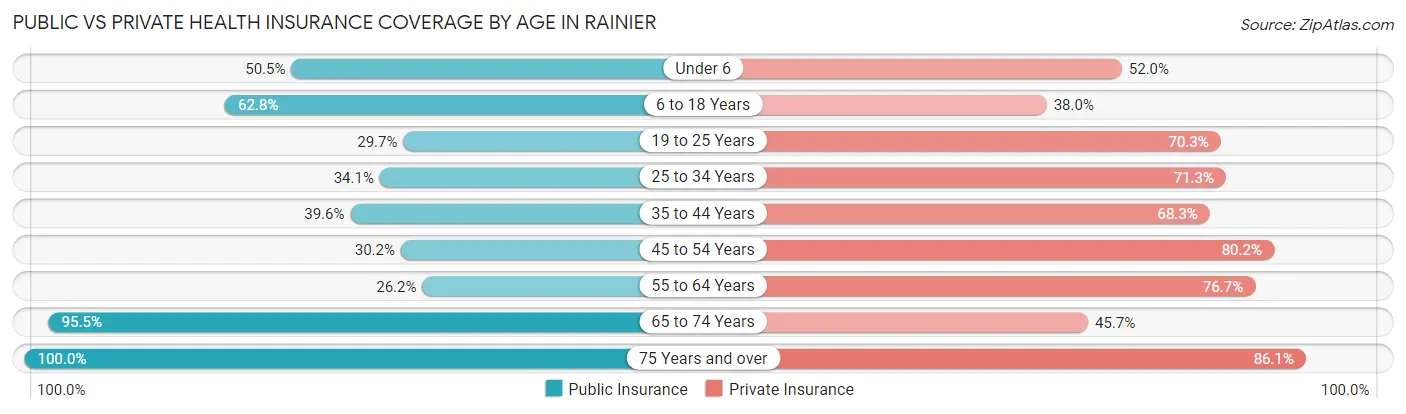
| Age Bracket | Public Insurance | Private Insurance |
| Under 6 | 102 (50.5%) | 105 (52.0%) |
| 6 to 18 Years | 307 (62.8%) | 186 (38.0%) |
| 19 to 25 Years | 52 (29.7%) | 123 (70.3%) |
| 25 to 34 Years | 121 (34.1%) | 253 (71.3%) |
| 35 to 44 Years | 142 (39.6%) | 245 (68.2%) |
| 45 to 54 Years | 105 (30.2%) | 279 (80.2%) |
| 55 to 64 Years | 100 (26.2%) | 293 (76.7%) |
| 65 to 74 Years | 257 (95.5%) | 123 (45.7%) |
| 75 Years and over | 108 (100.0%) | 93 (86.1%) |
| Total | 1,294 (48.2%) | 1,700 (63.3%) |
Disability Status by Sex by Age in Rainier
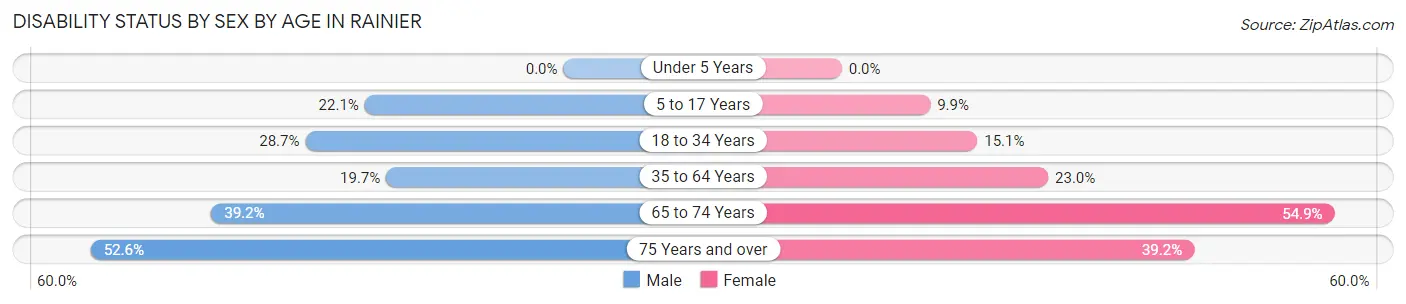
| Age Bracket | Male | Female |
| Under 5 Years | 0 (0.0%) | 0 (0.0%) |
| 5 to 17 Years | 54 (22.1%) | 26 (9.9%) |
| 18 to 34 Years | 75 (28.7%) | 43 (15.1%) |
| 35 to 64 Years | 105 (19.7%) | 128 (23.0%) |
| 65 to 74 Years | 49 (39.2%) | 79 (54.9%) |
| 75 Years and over | 30 (52.6%) | 20 (39.2%) |
Disability Class by Sex by Age in Rainier
Disability Class: Hearing Difficulty
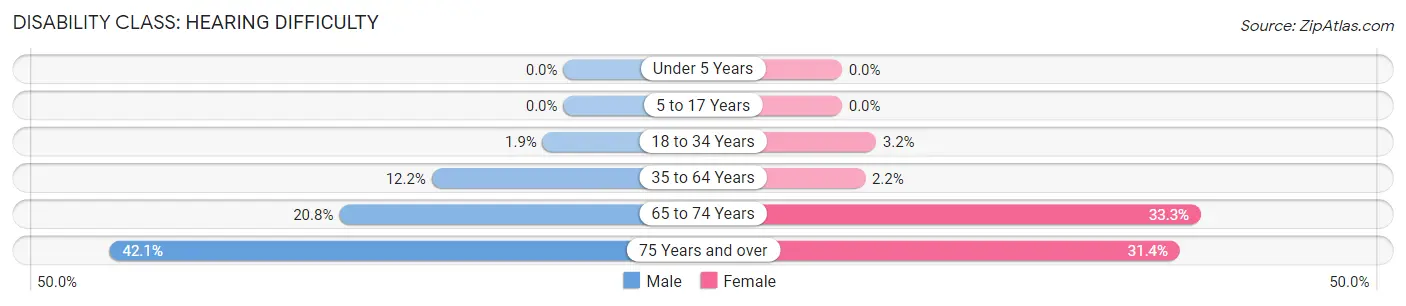
| Age Bracket | Male | Female |
| Under 5 Years | 0 (0.0%) | 0 (0.0%) |
| 5 to 17 Years | 0 (0.0%) | 0 (0.0%) |
| 18 to 34 Years | 5 (1.9%) | 9 (3.2%) |
| 35 to 64 Years | 65 (12.2%) | 12 (2.1%) |
| 65 to 74 Years | 26 (20.8%) | 48 (33.3%) |
| 75 Years and over | 24 (42.1%) | 16 (31.4%) |
Disability Class: Vision Difficulty
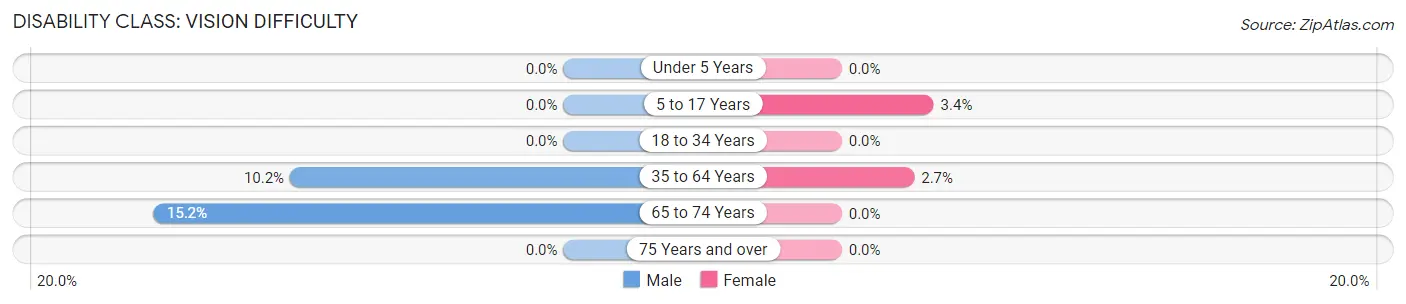
| Age Bracket | Male | Female |
| Under 5 Years | 0 (0.0%) | 0 (0.0%) |
| 5 to 17 Years | 0 (0.0%) | 9 (3.4%) |
| 18 to 34 Years | 0 (0.0%) | 0 (0.0%) |
| 35 to 64 Years | 54 (10.2%) | 15 (2.7%) |
| 65 to 74 Years | 19 (15.2%) | 0 (0.0%) |
| 75 Years and over | 0 (0.0%) | 0 (0.0%) |
Disability Class: Cognitive Difficulty
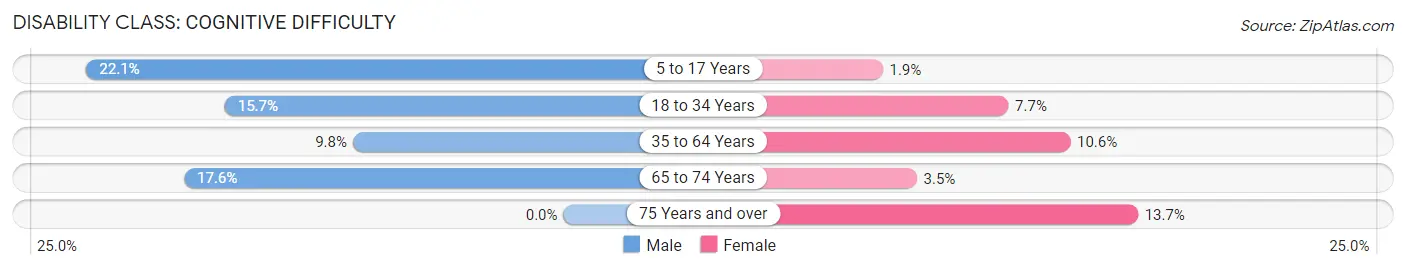
| Age Bracket | Male | Female |
| 5 to 17 Years | 54 (22.1%) | 5 (1.9%) |
| 18 to 34 Years | 41 (15.7%) | 22 (7.7%) |
| 35 to 64 Years | 52 (9.8%) | 59 (10.6%) |
| 65 to 74 Years | 22 (17.6%) | 5 (3.5%) |
| 75 Years and over | 0 (0.0%) | 7 (13.7%) |
Disability Class: Ambulatory Difficulty
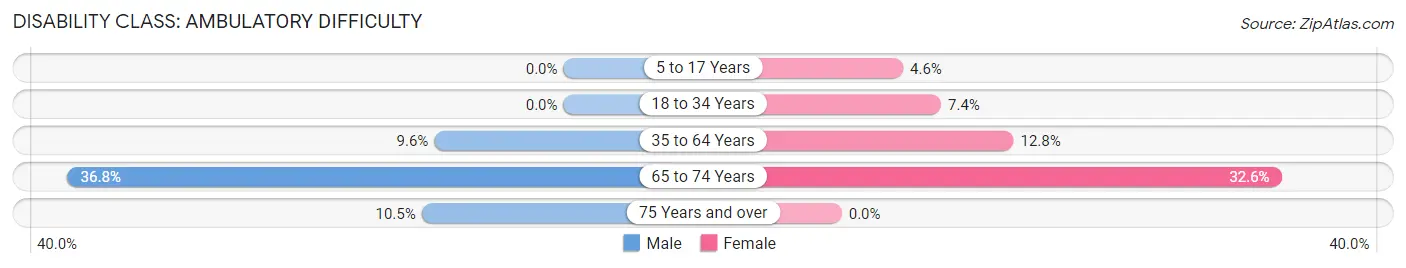
| Age Bracket | Male | Female |
| 5 to 17 Years | 0 (0.0%) | 12 (4.5%) |
| 18 to 34 Years | 0 (0.0%) | 21 (7.4%) |
| 35 to 64 Years | 51 (9.6%) | 71 (12.8%) |
| 65 to 74 Years | 46 (36.8%) | 47 (32.6%) |
| 75 Years and over | 6 (10.5%) | 0 (0.0%) |
Disability Class: Self-Care Difficulty
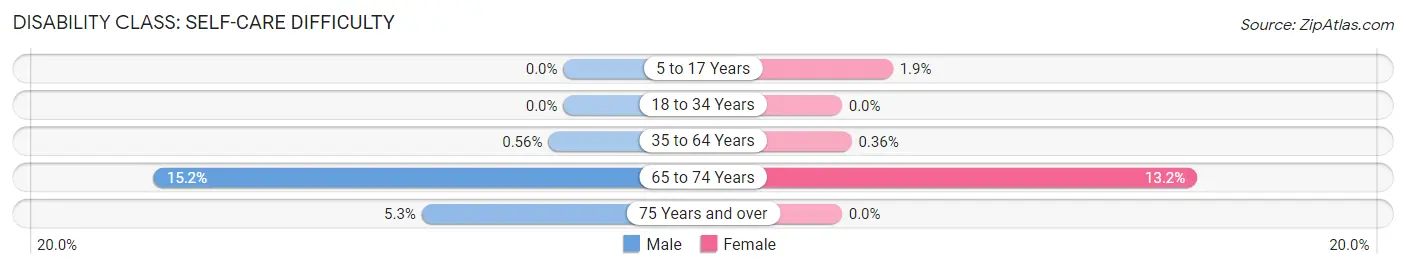
| Age Bracket | Male | Female |
| 5 to 17 Years | 0 (0.0%) | 5 (1.9%) |
| 18 to 34 Years | 0 (0.0%) | 0 (0.0%) |
| 35 to 64 Years | 3 (0.6%) | 2 (0.4%) |
| 65 to 74 Years | 19 (15.2%) | 19 (13.2%) |
| 75 Years and over | 3 (5.3%) | 0 (0.0%) |
Technology Access in Rainier
Computing Device Access in Rainier
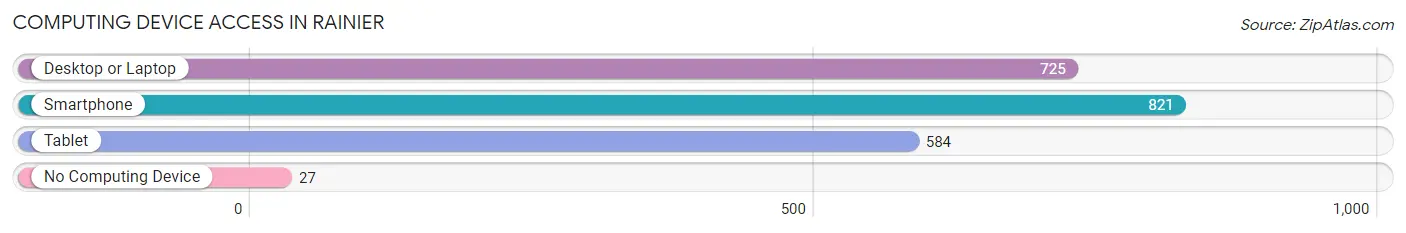
| Device Type | # Households | % Households |
| Desktop or Laptop | 725 | 84.7% |
| Smartphone | 821 | 95.9% |
| Tablet | 584 | 68.2% |
| No Computing Device | 27 | 3.2% |
| Total | 856 | 100.0% |
Internet Access in Rainier
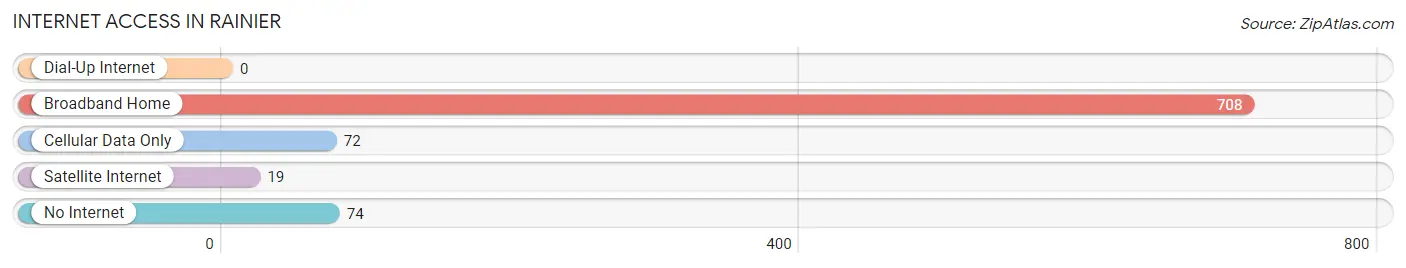
| Internet Type | # Households | % Households |
| Dial-Up Internet | 0 | 0.0% |
| Broadband Home | 708 | 82.7% |
| Cellular Data Only | 72 | 8.4% |
| Satellite Internet | 19 | 2.2% |
| No Internet | 74 | 8.6% |
| Total | 856 | 100.0% |
Rainier Summary
Rainier, Washington is a small city located in Thurston County, Washington, United States. It is situated on the banks of the Deschutes River, approximately 10 miles south of Olympia, the state capital. The city has a population of approximately 1,890 people, according to the 2010 census.
History
The area that is now Rainier was first inhabited by the Nisqually and Squaxin Island tribes. The first European settlers arrived in the area in the mid-1800s, and the town was officially incorporated in 1891. The town was named after Mount Rainier, which is visible from the city.
In the early 1900s, Rainier was a thriving logging and mill town. The town was home to several sawmills, a shingle mill, and a sash and door factory. The town also had a thriving agricultural industry, with dairy farms, poultry farms, and fruit orchards.
In the 1950s, the town began to decline as the logging industry moved away and the mills closed. The town was revitalized in the 1970s when the state of Washington began to invest in the area. The town was designated as a National Historic District in 1978, and the Rainier Historical Museum was established in 1982.
Geography
Rainier is located in the Puget Sound lowlands, at the confluence of the Deschutes and Nisqually Rivers. The city is situated on a flat plain, with an elevation of approximately 20 feet above sea level. The city is surrounded by forests and wetlands, and is located approximately 10 miles south of Olympia, the state capital.
The climate in Rainier is mild and temperate, with warm summers and cool winters. The average annual temperature is approximately 50 degrees Fahrenheit, and the average annual precipitation is approximately 40 inches.
Economy
Rainier’s economy is largely based on tourism and agriculture. The city is home to several tourist attractions, including the Rainier Historical Museum, the Rainier Valley Railroad, and the Rainier Valley Farmers Market. The city is also home to several wineries and breweries, as well as several small businesses.
The city’s agricultural industry is centered around dairy farming, poultry farming, and fruit orchards. The city is also home to several nurseries and greenhouses.
Demographics
According to the 2010 census, the population of Rainier was 1,890. The racial makeup of the city was 87.3% White, 5.2% Hispanic or Latino, 2.2% Asian, 1.7% African American, and 0.7% Native American. The median household income was $45,938, and the median age was 39.7 years.
Conclusion
Rainier, Washington is a small city located in Thurston County, Washington, United States. It is situated on the banks of the Deschutes River, approximately 10 miles south of Olympia, the state capital. The city has a population of approximately 1,890 people, according to the 2010 census. The city’s economy is largely based on tourism and agriculture, and the city is home to several tourist attractions, wineries, breweries, and small businesses. The racial makeup of the city was 87.3% White, 5.2% Hispanic or Latino, 2.2% Asian, 1.7% African American, and 0.7% Native American. The median household income was $45,938, and the median age was 39.7 years.
Common Questions
What is Per Capita Income in Rainier?
Per Capita income in Rainier is $31,000.
What is the Median Family Income in Rainier?
Median Family Income in Rainier is $89,389.
What is the Median Household income in Rainier?
Median Household Income in Rainier is $89,659.
What is Income or Wage Gap in Rainier?
Income or Wage Gap in Rainier is 44.8%.
Women in Rainier earn 55.2 cents for every dollar earned by a man.
What is Inequality or Gini Index in Rainier?
Inequality or Gini Index in Rainier is 0.32.
What is the Total Population of Rainier?
Total Population of Rainier is 2,707.
What is the Total Male Population of Rainier?
Total Male Population of Rainier is 1,315.
What is the Total Female Population of Rainier?
Total Female Population of Rainier is 1,392.
What is the Ratio of Males per 100 Females in Rainier?
There are 94.47 Males per 100 Females in Rainier.
What is the Ratio of Females per 100 Males in Rainier?
There are 105.86 Females per 100 Males in Rainier.
What is the Median Population Age in Rainier?
Median Population Age in Rainier is 38.2 Years.
What is the Average Family Size in Rainier
Average Family Size in Rainier is 3.1 People.
What is the Average Household Size in Rainier
Average Household Size in Rainier is 3.2 People.
How Large is the Labor Force in Rainier?
There are 1,214 People in the Labor Forcein in Rainier.
What is the Percentage of People in the Labor Force in Rainier?
57.5% of People are in the Labor Force in Rainier.
What is the Unemployment Rate in Rainier?
Unemployment Rate in Rainier is 7.5%.