Coupeville, WA Map & Demographics
Coupeville Map
Coupeville Overview
$38,755
PER CAPITA INCOME
$81,429
AVG FAMILY INCOME
$78,438
AVG HOUSEHOLD INCOME
38.7%
WAGE / INCOME GAP [ % ]
61.3¢/ $1
WAGE / INCOME GAP [ $ ]
0.40
INEQUALITY / GINI INDEX
2,040
TOTAL POPULATION
949
MALE POPULATION
1,091
FEMALE POPULATION
86.98
MALES / 100 FEMALES
114.96
FEMALES / 100 MALES
64.2
MEDIAN AGE
2.6
AVG FAMILY SIZE
2.2
AVG HOUSEHOLD SIZE
749
LABOR FORCE [ PEOPLE ]
40.1%
PERCENT IN LABOR FORCE
1.2%
UNEMPLOYMENT RATE
Coupeville Zip Codes
Coupeville Area Codes
Income in Coupeville
Income Overview in Coupeville
Per Capita Income in Coupeville is $38,755, while median incomes of families and households are $81,429 and $78,438 respectively.
| Characteristic | Number | Measure |
| Per Capita Income | 2,040 | $38,755 |
| Median Family Income | 560 | $81,429 |
| Mean Family Income | 560 | $95,023 |
| Median Household Income | 853 | $78,438 |
| Mean Household Income | 853 | $84,834 |
| Income Deficit | 560 | $0 |
| Wage / Income Gap (%) | 2,040 | 38.70% |
| Wage / Income Gap ($) | 2,040 | 61.30¢ per $1 |
| Gini / Inequality Index | 2,040 | 0.40 |
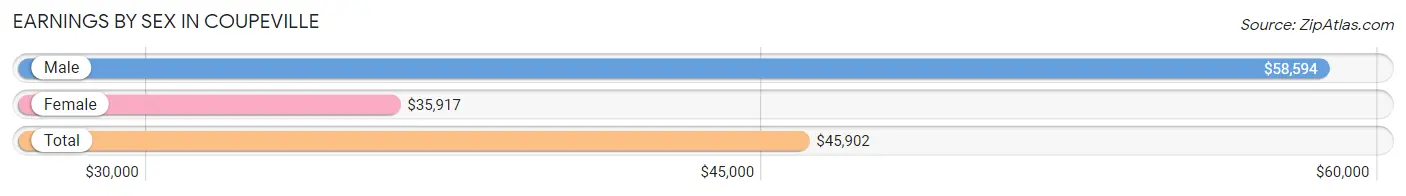
Earnings by Sex in Coupeville
Average Earnings in Coupeville are $45,902, $58,594 for men and $35,917 for women, a difference of 38.7%.
| Sex | Number | Average Earnings |
| Male | 449 (53.7%) | $58,594 |
| Female | 387 (46.3%) | $35,917 |
| Total | 836 (100.0%) | $45,902 |
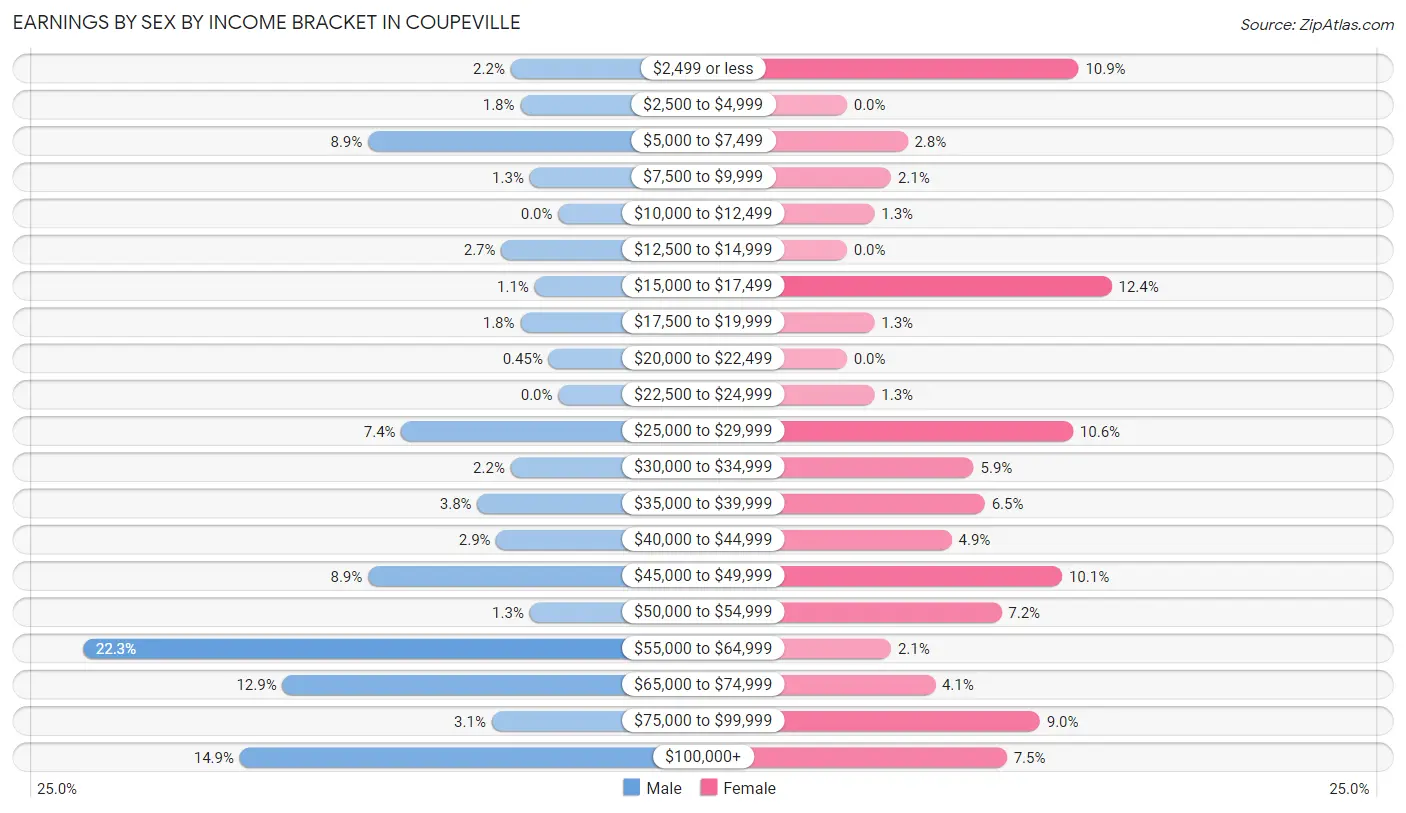
Earnings by Sex by Income Bracket in Coupeville
The most common earnings brackets in Coupeville are $55,000 to $64,999 for men (100 | 22.3%) and $15,000 to $17,499 for women (48 | 12.4%).
| Income | Male | Female |
| $2,499 or less | 10 (2.2%) | 42 (10.8%) |
| $2,500 to $4,999 | 8 (1.8%) | 0 (0.0%) |
| $5,000 to $7,499 | 40 (8.9%) | 11 (2.8%) |
| $7,500 to $9,999 | 6 (1.3%) | 8 (2.1%) |
| $10,000 to $12,499 | 0 (0.0%) | 5 (1.3%) |
| $12,500 to $14,999 | 12 (2.7%) | 0 (0.0%) |
| $15,000 to $17,499 | 5 (1.1%) | 48 (12.4%) |
| $17,500 to $19,999 | 8 (1.8%) | 5 (1.3%) |
| $20,000 to $22,499 | 2 (0.4%) | 0 (0.0%) |
| $22,500 to $24,999 | 0 (0.0%) | 5 (1.3%) |
| $25,000 to $29,999 | 33 (7.3%) | 41 (10.6%) |
| $30,000 to $34,999 | 10 (2.2%) | 23 (5.9%) |
| $35,000 to $39,999 | 17 (3.8%) | 25 (6.5%) |
| $40,000 to $44,999 | 13 (2.9%) | 19 (4.9%) |
| $45,000 to $49,999 | 40 (8.9%) | 39 (10.1%) |
| $50,000 to $54,999 | 6 (1.3%) | 28 (7.2%) |
| $55,000 to $64,999 | 100 (22.3%) | 8 (2.1%) |
| $65,000 to $74,999 | 58 (12.9%) | 16 (4.1%) |
| $75,000 to $99,999 | 14 (3.1%) | 35 (9.0%) |
| $100,000+ | 67 (14.9%) | 29 (7.5%) |
| Total | 449 (100.0%) | 387 (100.0%) |
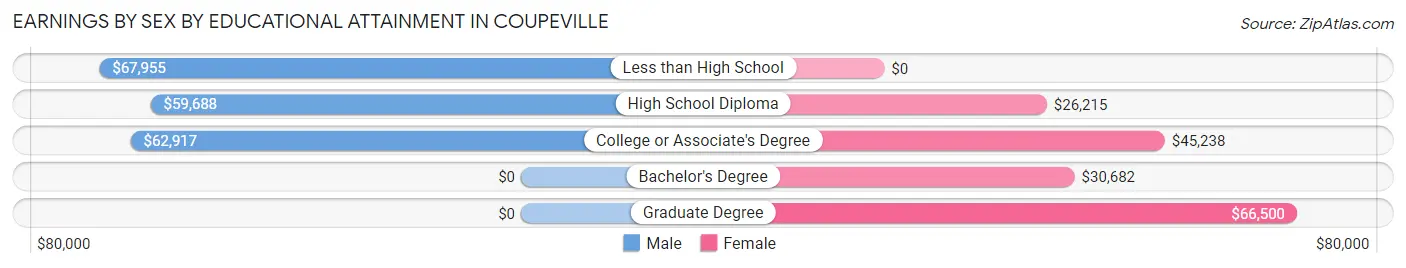
Earnings by Sex by Educational Attainment in Coupeville
Average earnings in Coupeville are $61,625 for men and $36,417 for women, a difference of 40.9%. Men with an educational attainment of less than high school enjoy the highest average annual earnings of $67,955, while those with high school diploma education earn the least with $59,688. Women with an educational attainment of graduate degree earn the most with the average annual earnings of $66,500, while those with high school diploma education have the smallest earnings of $26,215.
| Educational Attainment | Male Income | Female Income |
| Less than High School | $67,955 | $0 |
| High School Diploma | $59,688 | $26,215 |
| College or Associate's Degree | $62,917 | $45,238 |
| Bachelor's Degree | - | - |
| Graduate Degree | - | - |
| Total | $61,625 | $36,417 |
Family Income in Coupeville
Family Income Brackets in Coupeville
According to the Coupeville family income data, there are 138 families falling into the $100,000 to $149,999 income range, which is the most common income bracket and makes up 24.6% of all families. Conversely, the $10,000 to $14,999 income bracket is the least frequent group with only 10 families (1.8%) belonging to this category.
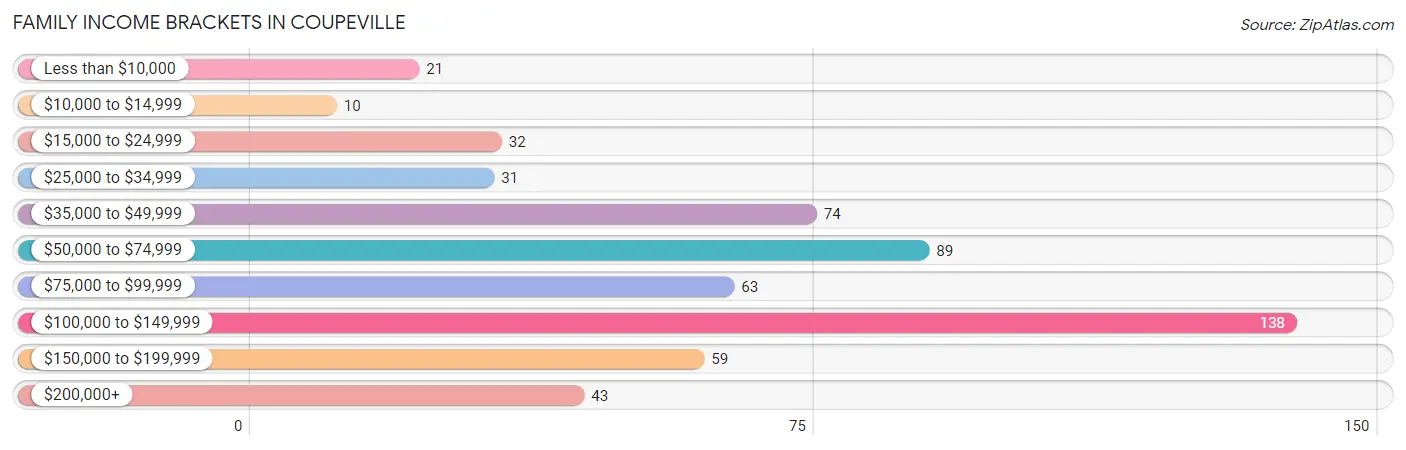
| Income Bracket | # Families | % Families |
| Less than $10,000 | 21 | 3.8% |
| $10,000 to $14,999 | 10 | 1.8% |
| $15,000 to $24,999 | 32 | 5.7% |
| $25,000 to $34,999 | 31 | 5.5% |
| $35,000 to $49,999 | 74 | 13.2% |
| $50,000 to $74,999 | 89 | 15.9% |
| $75,000 to $99,999 | 63 | 11.3% |
| $100,000 to $149,999 | 138 | 24.6% |
| $150,000 to $199,999 | 59 | 10.5% |
| $200,000+ | 43 | 7.7% |
Family Income by Famaliy Size in Coupeville
4-person families (34 | 6.1%) account for the highest median family income in Coupeville with $137,000 per family, while 2-person families (424 | 75.7%) have the highest median income of $45,000 per family member.
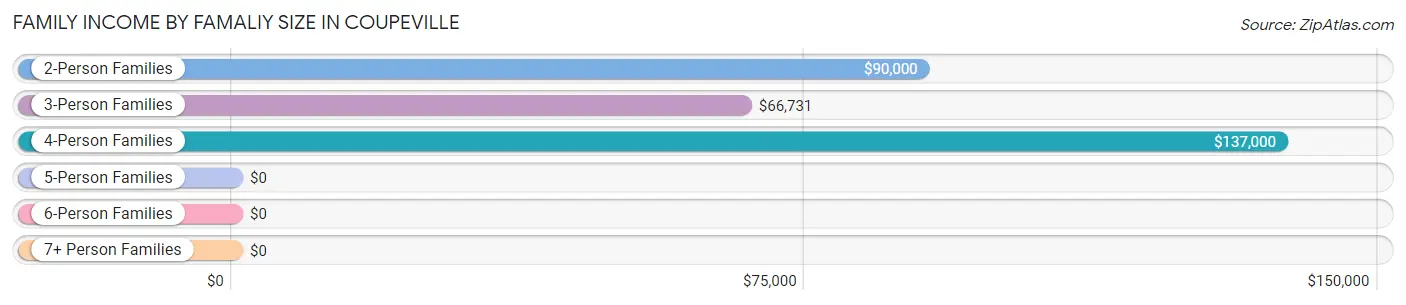
| Income Bracket | # Families | Median Income |
| 2-Person Families | 424 (75.7%) | $90,000 |
| 3-Person Families | 80 (14.3%) | $66,731 |
| 4-Person Families | 34 (6.1%) | $137,000 |
| 5-Person Families | 12 (2.1%) | $0 |
| 6-Person Families | 10 (1.8%) | $0 |
| 7+ Person Families | 0 (0.0%) | $0 |
| Total | 560 (100.0%) | $81,429 |
Family Income by Number of Earners in Coupeville
The median family income in Coupeville is $81,429, with families comprising 3+ earners (26) having the highest median family income of $186,250, while families with 1 earner (183) have the lowest median family income of $62,917, accounting for 4.6% and 32.7% of families, respectively.
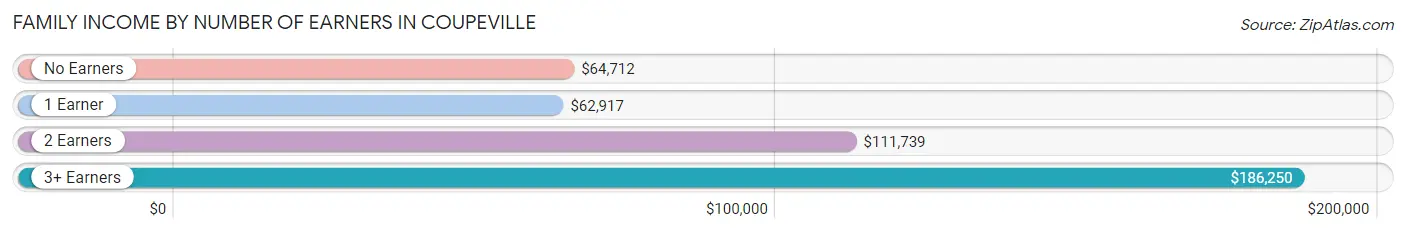
| Number of Earners | # Families | Median Income |
| No Earners | 205 (36.6%) | $64,712 |
| 1 Earner | 183 (32.7%) | $62,917 |
| 2 Earners | 146 (26.1%) | $111,739 |
| 3+ Earners | 26 (4.6%) | $186,250 |
| Total | 560 (100.0%) | $81,429 |
Household Income in Coupeville
Household Income Brackets in Coupeville
With 199 households falling in the category, the $100,000 to $149,999 income range is the most frequent in Coupeville, accounting for 23.3% of all households. In contrast, only 12 households (1.4%) fall into the less than $10,000 income bracket, making it the least populous group.
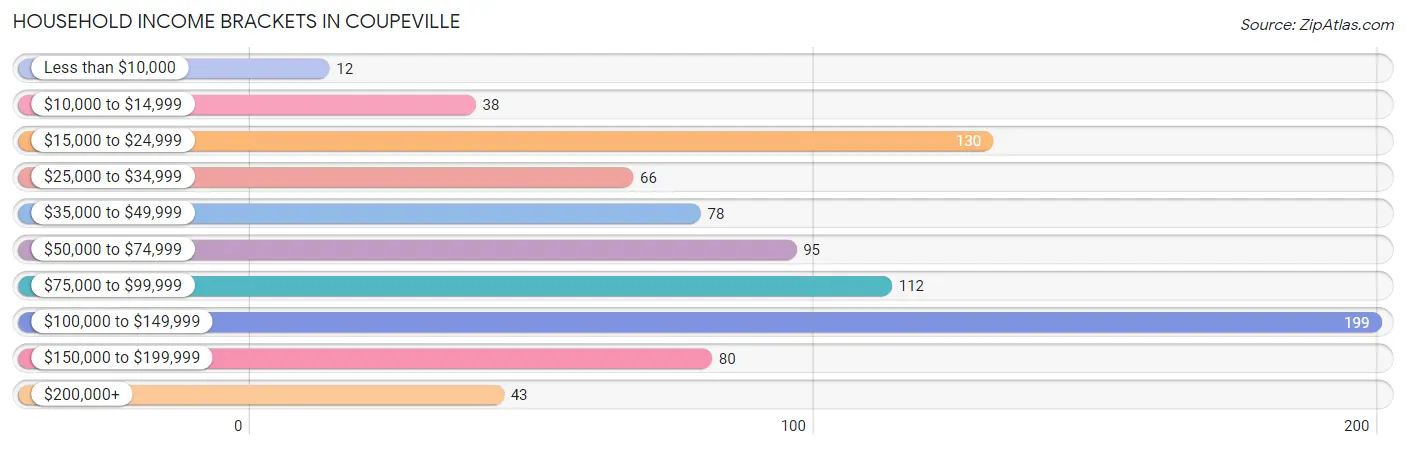
| Income Bracket | # Households | % Households |
| Less than $10,000 | 12 | 1.4% |
| $10,000 to $14,999 | 38 | 4.5% |
| $15,000 to $24,999 | 130 | 15.2% |
| $25,000 to $34,999 | 66 | 7.7% |
| $35,000 to $49,999 | 78 | 9.1% |
| $50,000 to $74,999 | 95 | 11.1% |
| $75,000 to $99,999 | 112 | 13.1% |
| $100,000 to $149,999 | 199 | 23.3% |
| $150,000 to $199,999 | 80 | 9.4% |
| $200,000+ | 43 | 5.0% |
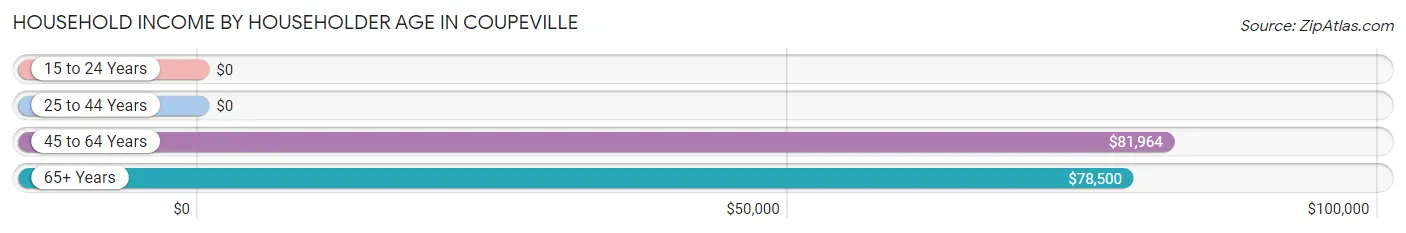
Household Income by Householder Age in Coupeville
The median household income in Coupeville is $78,438, with the highest median household income of $81,964 found in the 45 to 64 years age bracket for the primary householder. A total of 271 households (31.8%) fall into this category. Meanwhile, the 15 to 24 years age bracket for the primary householder has the lowest median household income of $0, with 2 households (0.2%) in this group.
| Income Bracket | # Households | Median Income |
| 15 to 24 Years | 2 (0.2%) | $0 |
| 25 to 44 Years | 96 (11.3%) | $0 |
| 45 to 64 Years | 271 (31.8%) | $81,964 |
| 65+ Years | 484 (56.7%) | $78,500 |
| Total | 853 (100.0%) | $78,438 |
Poverty in Coupeville
Income Below Poverty by Sex and Age in Coupeville
With 11.0% poverty level for males and 16.0% for females among the residents of Coupeville, 18 to 24 year old males and 6 to 11 year old females are the most vulnerable to poverty, with 6 males (37.5%) and 24 females (40.7%) in their respective age groups living below the poverty level.
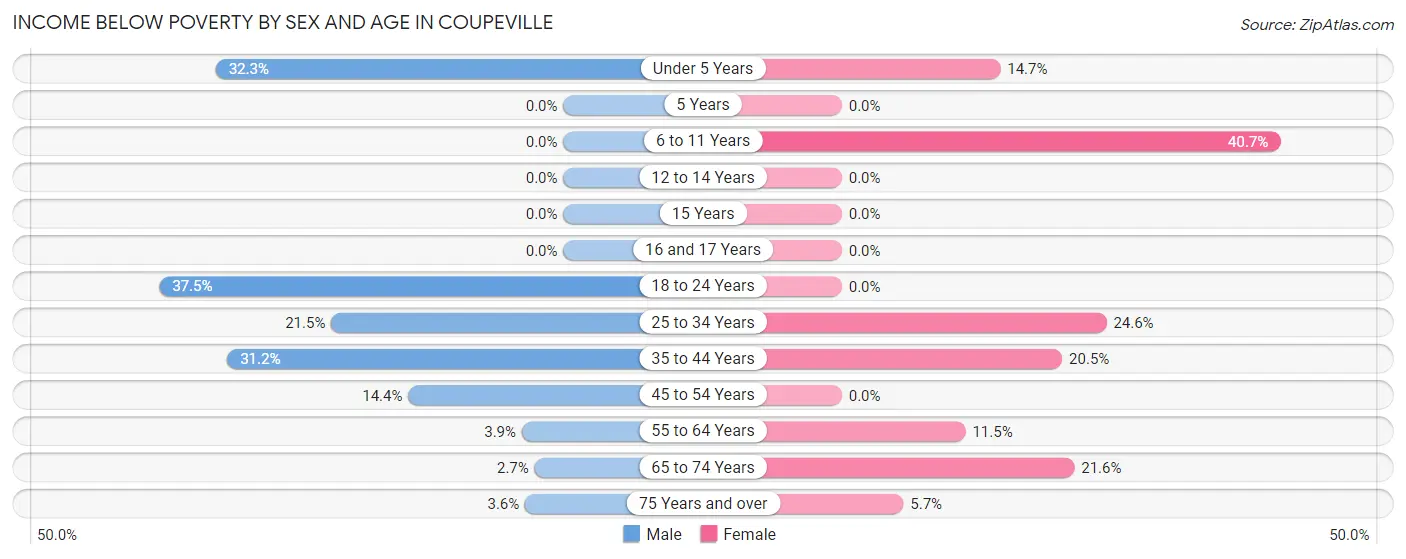
| Age Bracket | Male | Female |
| Under 5 Years | 10 (32.3%) | 5 (14.7%) |
| 5 Years | 0 (0.0%) | 0 (0.0%) |
| 6 to 11 Years | 0 (0.0%) | 24 (40.7%) |
| 12 to 14 Years | 0 (0.0%) | 0 (0.0%) |
| 15 Years | 0 (0.0%) | 0 (0.0%) |
| 16 and 17 Years | 0 (0.0%) | 0 (0.0%) |
| 18 to 24 Years | 6 (37.5%) | 0 (0.0%) |
| 25 to 34 Years | 14 (21.5%) | 14 (24.6%) |
| 35 to 44 Years | 34 (31.2%) | 9 (20.4%) |
| 45 to 54 Years | 19 (14.4%) | 0 (0.0%) |
| 55 to 64 Years | 4 (3.8%) | 24 (11.5%) |
| 65 to 74 Years | 7 (2.7%) | 79 (21.6%) |
| 75 Years and over | 5 (3.5%) | 8 (5.7%) |
| Total | 99 (11.0%) | 163 (16.0%) |
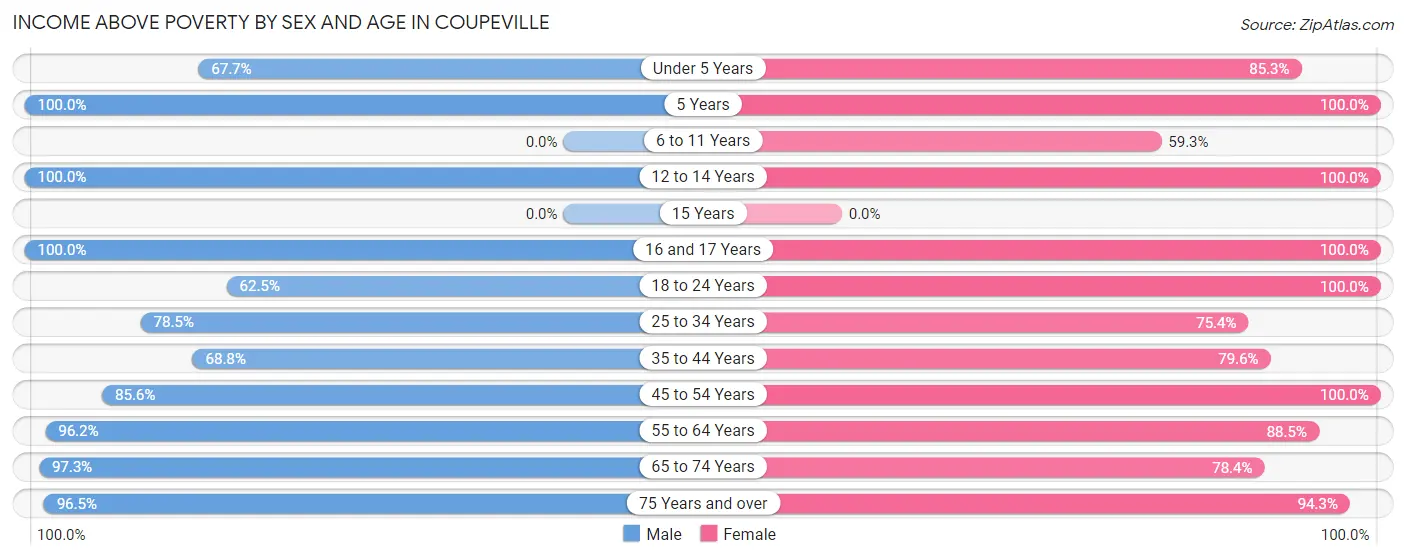
Income Above Poverty by Sex and Age in Coupeville
According to the poverty statistics in Coupeville, males aged 5 years and females aged 5 years are the age groups that are most secure financially, with 100.0% of males and 100.0% of females in these age groups living above the poverty line.
| Age Bracket | Male | Female |
| Under 5 Years | 21 (67.7%) | 29 (85.3%) |
| 5 Years | 6 (100.0%) | 13 (100.0%) |
| 6 to 11 Years | 0 (0.0%) | 35 (59.3%) |
| 12 to 14 Years | 15 (100.0%) | 13 (100.0%) |
| 15 Years | 0 (0.0%) | 0 (0.0%) |
| 16 and 17 Years | 17 (100.0%) | 7 (100.0%) |
| 18 to 24 Years | 10 (62.5%) | 6 (100.0%) |
| 25 to 34 Years | 51 (78.5%) | 43 (75.4%) |
| 35 to 44 Years | 75 (68.8%) | 35 (79.5%) |
| 45 to 54 Years | 113 (85.6%) | 69 (100.0%) |
| 55 to 64 Years | 100 (96.2%) | 185 (88.5%) |
| 65 to 74 Years | 255 (97.3%) | 287 (78.4%) |
| 75 Years and over | 136 (96.5%) | 132 (94.3%) |
| Total | 799 (89.0%) | 854 (84.0%) |
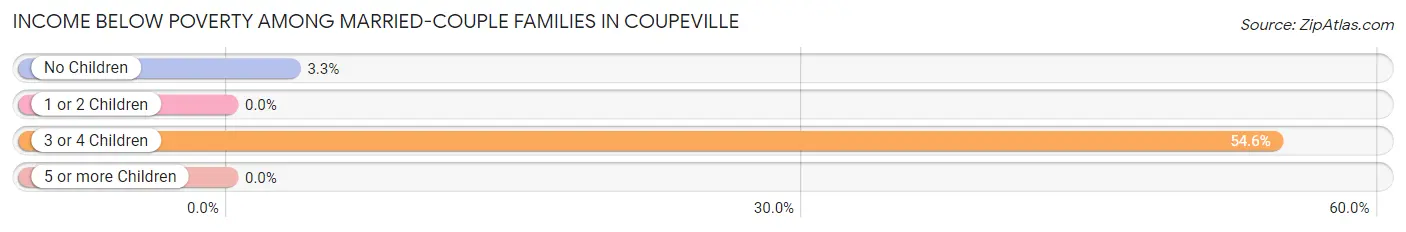
Income Below Poverty Among Married-Couple Families in Coupeville
The poverty statistics for married-couple families in Coupeville show that 5.3% or 24 of the total 451 families live below the poverty line. Families with 3 or 4 children have the highest poverty rate of 54.5%, comprising of 12 families. On the other hand, families with 1 or 2 children have the lowest poverty rate of 0.0%, which includes 0 families.
| Children | Above Poverty | Below Poverty |
| No Children | 356 (96.7%) | 12 (3.3%) |
| 1 or 2 Children | 61 (100.0%) | 0 (0.0%) |
| 3 or 4 Children | 10 (45.5%) | 12 (54.5%) |
| 5 or more Children | 0 (0.0%) | 0 (0.0%) |
| Total | 427 (94.7%) | 24 (5.3%) |
Income Below Poverty Among Single-Parent Households in Coupeville
According to the poverty data in Coupeville, 9.3% or 5 single-father households and 36.4% or 20 single-mother households are living below the poverty line. Among single-father households, those with no children have the highest poverty rate, with 5 households (9.8%) experiencing poverty. Likewise, among single-mother households, those with no children have the highest poverty rate, with 15 households (39.5%) falling below the poverty line.
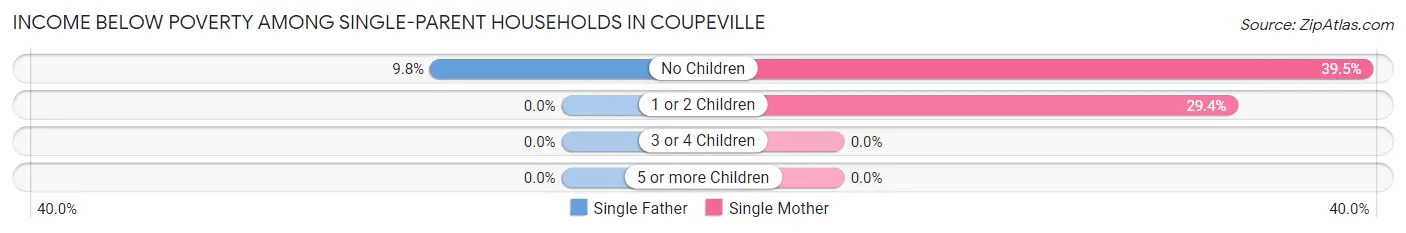
| Children | Single Father | Single Mother |
| No Children | 5 (9.8%) | 15 (39.5%) |
| 1 or 2 Children | 0 (0.0%) | 5 (29.4%) |
| 3 or 4 Children | 0 (0.0%) | 0 (0.0%) |
| 5 or more Children | 0 (0.0%) | 0 (0.0%) |
| Total | 5 (9.3%) | 20 (36.4%) |
Income Below Poverty Among Married-Couple vs Single-Parent Households in Coupeville
The poverty data for Coupeville shows that 24 of the married-couple family households (5.3%) and 25 of the single-parent households (22.9%) are living below the poverty level. Within the married-couple family households, those with 3 or 4 children have the highest poverty rate, with 12 households (54.5%) falling below the poverty line. Among the single-parent households, those with 1 or 2 children have the highest poverty rate, with 5 household (25.0%) living below poverty.
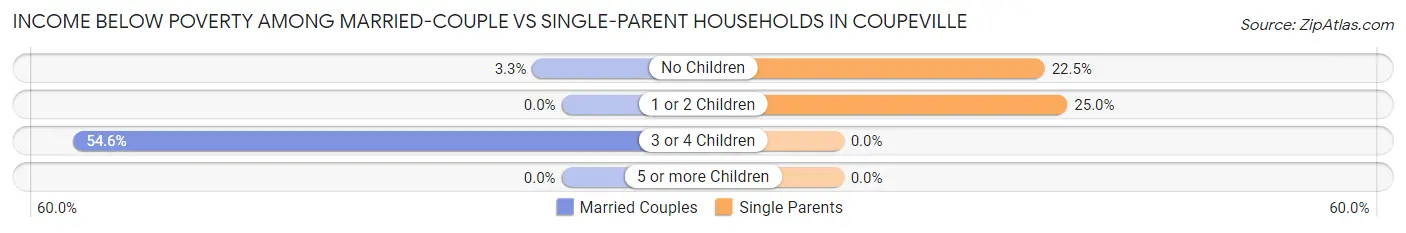
| Children | Married-Couple Families | Single-Parent Households |
| No Children | 12 (3.3%) | 20 (22.5%) |
| 1 or 2 Children | 0 (0.0%) | 5 (25.0%) |
| 3 or 4 Children | 12 (54.5%) | 0 (0.0%) |
| 5 or more Children | 0 (0.0%) | 0 (0.0%) |
| Total | 24 (5.3%) | 25 (22.9%) |
Race in Coupeville
The most populous races in Coupeville are White / Caucasian (1,650 | 80.9%), Two or more Races (219 | 10.7%), and Hispanic or Latino (148 | 7.2%).
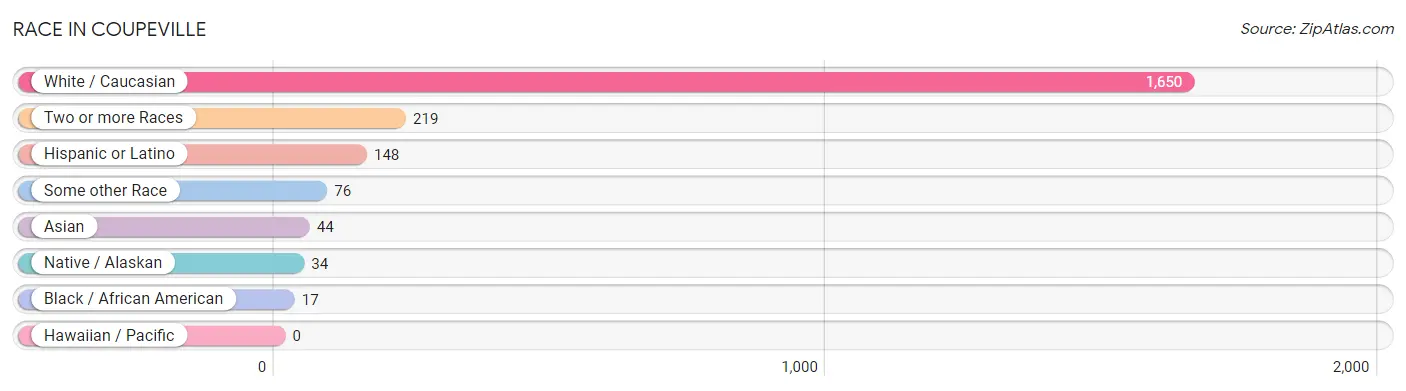
| Race | # Population | % Population |
| Asian | 44 | 2.2% |
| Black / African American | 17 | 0.8% |
| Hawaiian / Pacific | 0 | 0.0% |
| Hispanic or Latino | 148 | 7.2% |
| Native / Alaskan | 34 | 1.7% |
| White / Caucasian | 1,650 | 80.9% |
| Two or more Races | 219 | 10.7% |
| Some other Race | 76 | 3.7% |
| Total | 2,040 | 100.0% |
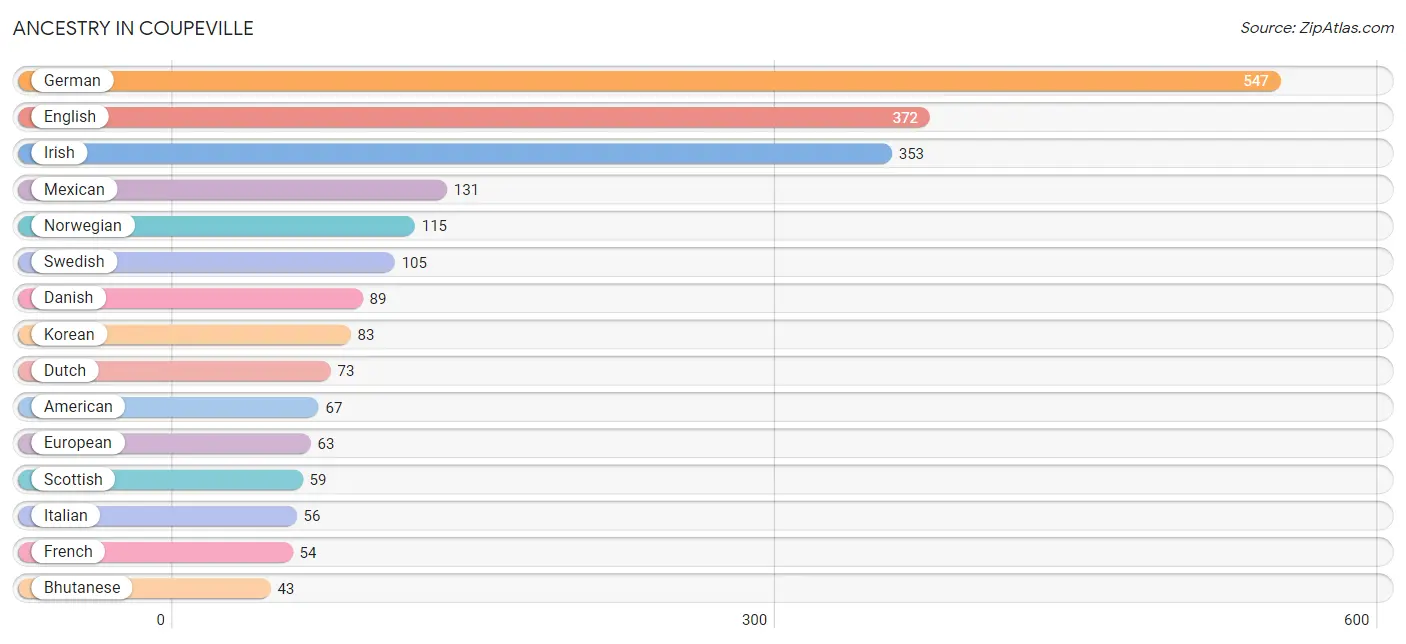
Ancestry in Coupeville
The most populous ancestries reported in Coupeville are German (547 | 26.8%), English (372 | 18.2%), Irish (353 | 17.3%), Mexican (131 | 6.4%), and Norwegian (115 | 5.6%), together accounting for 74.4% of all Coupeville residents.
| Ancestry | # Population | % Population |
| African | 3 | 0.2% |
| Aleut | 3 | 0.2% |
| American | 67 | 3.3% |
| Apache | 3 | 0.2% |
| Arab | 3 | 0.2% |
| Basque | 5 | 0.3% |
| Bhutanese | 43 | 2.1% |
| British | 25 | 1.2% |
| Burmese | 5 | 0.3% |
| Cajun | 5 | 0.3% |
| Canadian | 7 | 0.3% |
| Central American | 11 | 0.5% |
| Danish | 89 | 4.4% |
| Dominican | 4 | 0.2% |
| Dutch | 73 | 3.6% |
| Egyptian | 3 | 0.2% |
| English | 372 | 18.2% |
| European | 63 | 3.1% |
| Finnish | 11 | 0.5% |
| French | 54 | 2.6% |
| French Canadian | 5 | 0.3% |
| German | 547 | 26.8% |
| Guatemalan | 11 | 0.5% |
| Hungarian | 2 | 0.1% |
| Iranian | 18 | 0.9% |
| Irish | 353 | 17.3% |
| Italian | 56 | 2.8% |
| Korean | 83 | 4.1% |
| Latvian | 4 | 0.2% |
| Lithuanian | 4 | 0.2% |
| Mexican | 131 | 6.4% |
| Mexican American Indian | 3 | 0.2% |
| Northern European | 10 | 0.5% |
| Norwegian | 115 | 5.6% |
| Pennsylvania German | 6 | 0.3% |
| Polish | 11 | 0.5% |
| Portuguese | 3 | 0.2% |
| Pueblo | 3 | 0.2% |
| Puget Sound Salish | 3 | 0.2% |
| Romanian | 14 | 0.7% |
| Russian | 6 | 0.3% |
| Scandinavian | 27 | 1.3% |
| Scotch-Irish | 10 | 0.5% |
| Scottish | 59 | 2.9% |
| Spaniard | 2 | 0.1% |
| Subsaharan African | 3 | 0.2% |
| Swedish | 105 | 5.1% |
| Swiss | 23 | 1.1% |
| Thai | 20 | 1.0% |
| Welsh | 43 | 2.1% |
| Yugoslavian | 7 | 0.3% | View All 51 Rows |
Immigrants in Coupeville
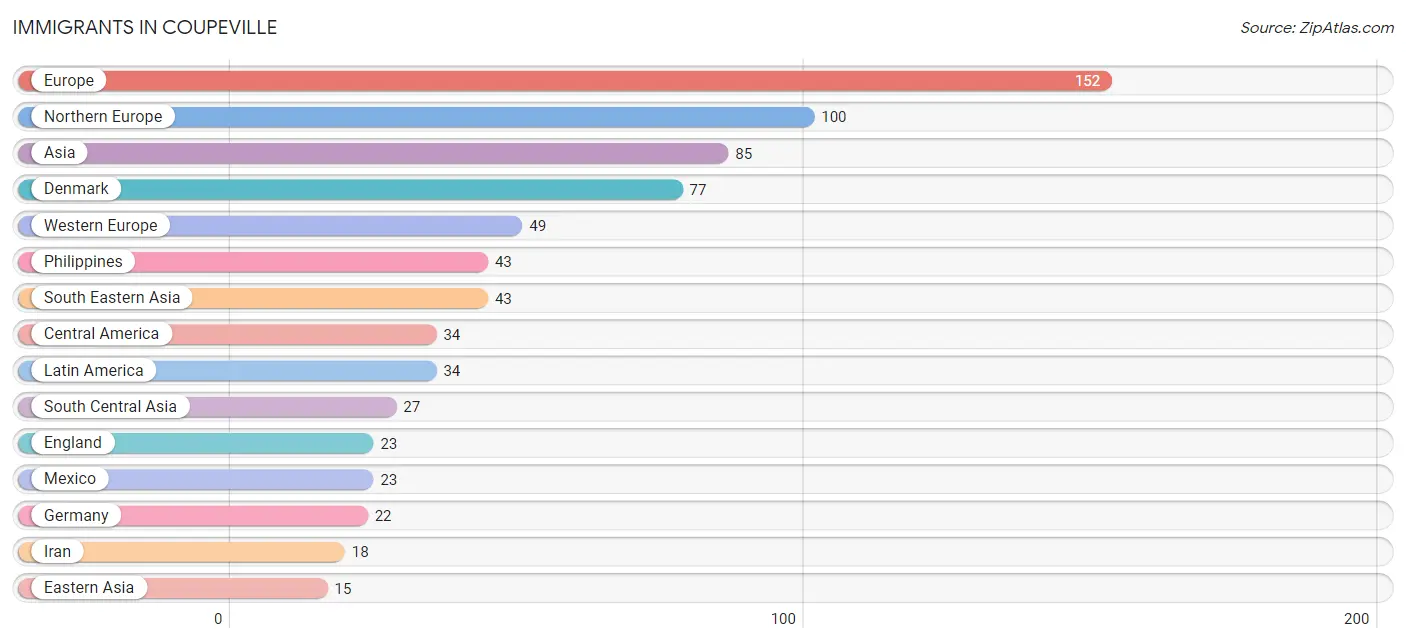
The most numerous immigrant groups reported in Coupeville came from Europe (152 | 7.4%), Northern Europe (100 | 4.9%), Asia (85 | 4.2%), Denmark (77 | 3.8%), and Western Europe (49 | 2.4%), together accounting for 22.7% of all Coupeville residents.
| Immigration Origin | # Population | % Population |
| Africa | 4 | 0.2% |
| Asia | 85 | 4.2% |
| Central America | 34 | 1.7% |
| Denmark | 77 | 3.8% |
| Eastern Asia | 15 | 0.7% |
| Eastern Europe | 3 | 0.2% |
| England | 23 | 1.1% |
| Europe | 152 | 7.4% |
| France | 13 | 0.6% |
| Germany | 22 | 1.1% |
| Guatemala | 11 | 0.5% |
| India | 9 | 0.4% |
| Iran | 18 | 0.9% |
| Japan | 13 | 0.6% |
| Korea | 2 | 0.1% |
| Latin America | 34 | 1.7% |
| Mexico | 23 | 1.1% |
| Netherlands | 14 | 0.7% |
| Northern Europe | 100 | 4.9% |
| Philippines | 43 | 2.1% |
| Romania | 3 | 0.2% |
| South Africa | 4 | 0.2% |
| South Central Asia | 27 | 1.3% |
| South Eastern Asia | 43 | 2.1% |
| Western Europe | 49 | 2.4% | View All 25 Rows |
Sex and Age in Coupeville
Sex and Age in Coupeville
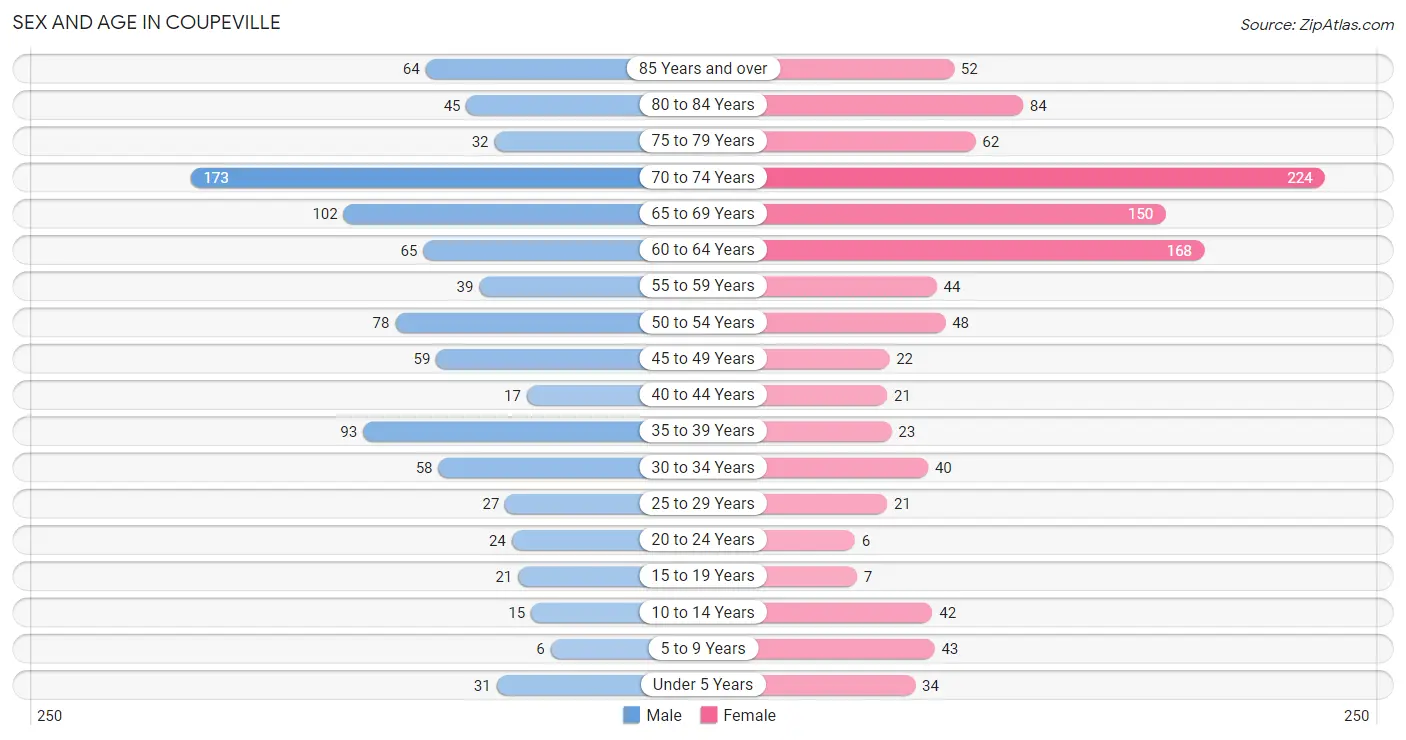
The most populous age groups in Coupeville are 70 to 74 Years (173 | 18.2%) for men and 70 to 74 Years (224 | 20.5%) for women.
| Age Bracket | Male | Female |
| Under 5 Years | 31 (3.3%) | 34 (3.1%) |
| 5 to 9 Years | 6 (0.6%) | 43 (3.9%) |
| 10 to 14 Years | 15 (1.6%) | 42 (3.8%) |
| 15 to 19 Years | 21 (2.2%) | 7 (0.6%) |
| 20 to 24 Years | 24 (2.5%) | 6 (0.5%) |
| 25 to 29 Years | 27 (2.9%) | 21 (1.9%) |
| 30 to 34 Years | 58 (6.1%) | 40 (3.7%) |
| 35 to 39 Years | 93 (9.8%) | 23 (2.1%) |
| 40 to 44 Years | 17 (1.8%) | 21 (1.9%) |
| 45 to 49 Years | 59 (6.2%) | 22 (2.0%) |
| 50 to 54 Years | 78 (8.2%) | 48 (4.4%) |
| 55 to 59 Years | 39 (4.1%) | 44 (4.0%) |
| 60 to 64 Years | 65 (6.9%) | 168 (15.4%) |
| 65 to 69 Years | 102 (10.7%) | 150 (13.8%) |
| 70 to 74 Years | 173 (18.2%) | 224 (20.5%) |
| 75 to 79 Years | 32 (3.4%) | 62 (5.7%) |
| 80 to 84 Years | 45 (4.7%) | 84 (7.7%) |
| 85 Years and over | 64 (6.7%) | 52 (4.8%) |
| Total | 949 (100.0%) | 1,091 (100.0%) |
Families and Households in Coupeville
Median Family Size in Coupeville
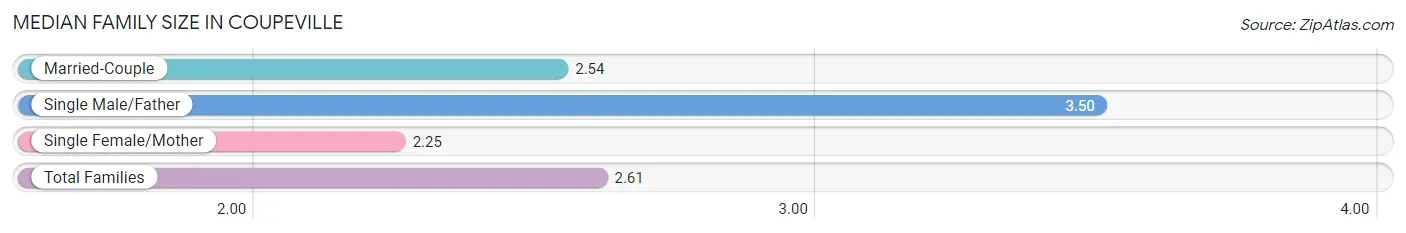
The median family size in Coupeville is 2.61 persons per family, with single male/father families (54 | 9.6%) accounting for the largest median family size of 3.5 persons per family. On the other hand, single female/mother families (55 | 9.8%) represent the smallest median family size with 2.25 persons per family.
| Family Type | # Families | Family Size |
| Married-Couple | 451 (80.5%) | 2.54 |
| Single Male/Father | 54 (9.6%) | 3.50 |
| Single Female/Mother | 55 (9.8%) | 2.25 |
| Total Families | 560 (100.0%) | 2.61 |
Median Household Size in Coupeville
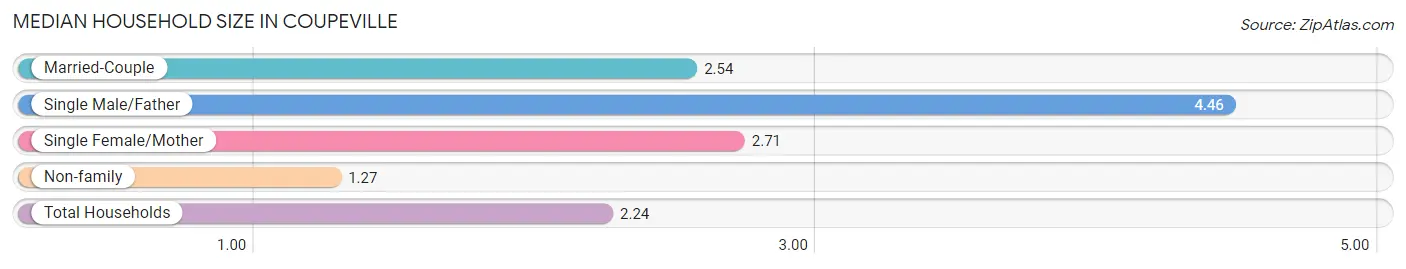
The median household size in Coupeville is 2.24 persons per household, with single male/father households (54 | 6.3%) accounting for the largest median household size of 4.46 persons per household. non-family households (293 | 34.4%) represent the smallest median household size with 1.27 persons per household.
| Household Type | # Households | Household Size |
| Married-Couple | 451 (52.9%) | 2.54 |
| Single Male/Father | 54 (6.3%) | 4.46 |
| Single Female/Mother | 55 (6.5%) | 2.71 |
| Non-family | 293 (34.4%) | 1.27 |
| Total Households | 853 (100.0%) | 2.24 |
Household Size by Marriage Status in Coupeville
Out of a total of 853 households in Coupeville, 560 (65.6%) are family households, while 293 (34.4%) are nonfamily households. The most numerous type of family households are 2-person households, comprising 365, and the most common type of nonfamily households are 1-person households, comprising 260.
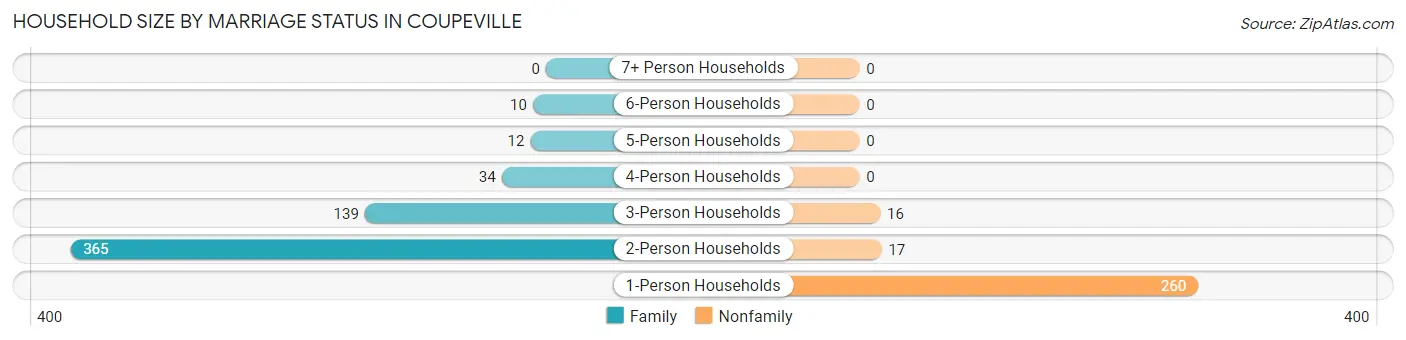
| Household Size | Family Households | Nonfamily Households |
| 1-Person Households | - | 260 (30.5%) |
| 2-Person Households | 365 (42.8%) | 17 (2.0%) |
| 3-Person Households | 139 (16.3%) | 16 (1.9%) |
| 4-Person Households | 34 (4.0%) | 0 (0.0%) |
| 5-Person Households | 12 (1.4%) | 0 (0.0%) |
| 6-Person Households | 10 (1.2%) | 0 (0.0%) |
| 7+ Person Households | 0 (0.0%) | 0 (0.0%) |
| Total | 560 (65.6%) | 293 (34.4%) |
Female Fertility in Coupeville
Fertility by Age in Coupeville
Average fertility rate in Coupeville is 75.0 births per 1,000 women. Women in the age bracket of 20 to 34 years have the highest fertility rate with 164.0 births per 1,000 women. Women in the age bracket of 20 to 34 years acount for 100.0% of all women with births.
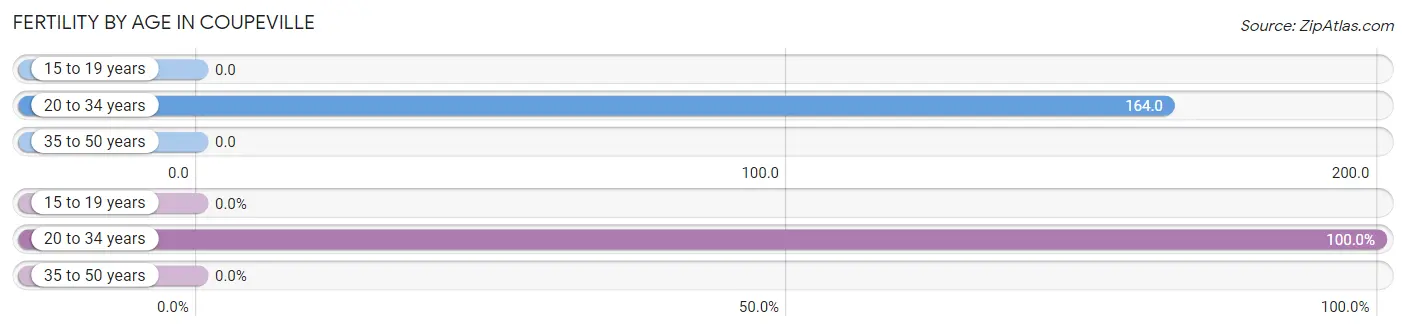
| Age Bracket | Women with Births | Births / 1,000 Women |
| 15 to 19 years | 0 (0.0%) | 0.0 |
| 20 to 34 years | 11 (100.0%) | 164.0 |
| 35 to 50 years | 0 (0.0%) | 0.0 |
| Total | 11 (100.0%) | 75.0 |
Fertility by Age by Marriage Status in Coupeville
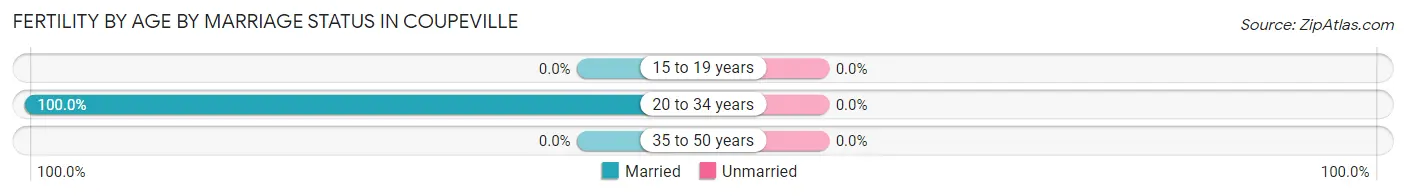
| Age Bracket | Married | Unmarried |
| 15 to 19 years | 0 (0.0%) | 0 (0.0%) |
| 20 to 34 years | 11 (100.0%) | 0 (0.0%) |
| 35 to 50 years | 0 (0.0%) | 0 (0.0%) |
| Total | 11 (100.0%) | 0 (0.0%) |
Fertility by Education in Coupeville
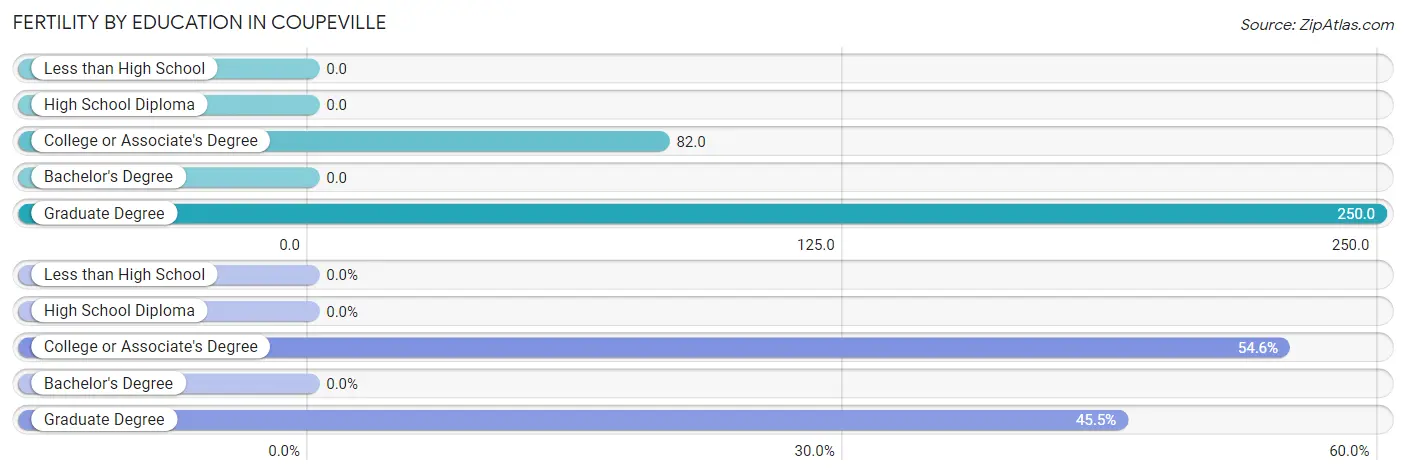
| Educational Attainment | Women with Births | Births / 1,000 Women |
| Less than High School | 0 (0.0%) | 0.0 |
| High School Diploma | 0 (0.0%) | 0.0 |
| College or Associate's Degree | 6 (54.5%) | 82.0 |
| Bachelor's Degree | 0 (0.0%) | 0.0 |
| Graduate Degree | 5 (45.5%) | 250.0 |
| Total | 11 (100.0%) | 75.0 |
Fertility by Education by Marriage Status in Coupeville
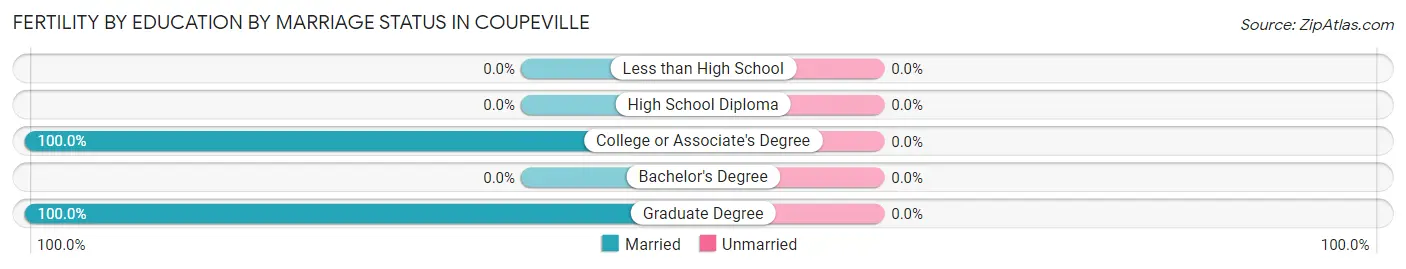
| Educational Attainment | Married | Unmarried |
| Less than High School | 0 (0.0%) | 0 (0.0%) |
| High School Diploma | 0 (0.0%) | 0 (0.0%) |
| College or Associate's Degree | 6 (100.0%) | 0 (0.0%) |
| Bachelor's Degree | 0 (0.0%) | 0 (0.0%) |
| Graduate Degree | 5 (100.0%) | 0 (0.0%) |
| Total | 11 (100.0%) | 0 (0.0%) |
Employment Characteristics in Coupeville
Employment by Class of Employer in Coupeville
Among the 730 employed individuals in Coupeville, private company employees (420 | 57.5%), local government employees (75 | 10.3%), and self-employed (not incorporated) (61 | 8.4%) make up the most common classes of employment.
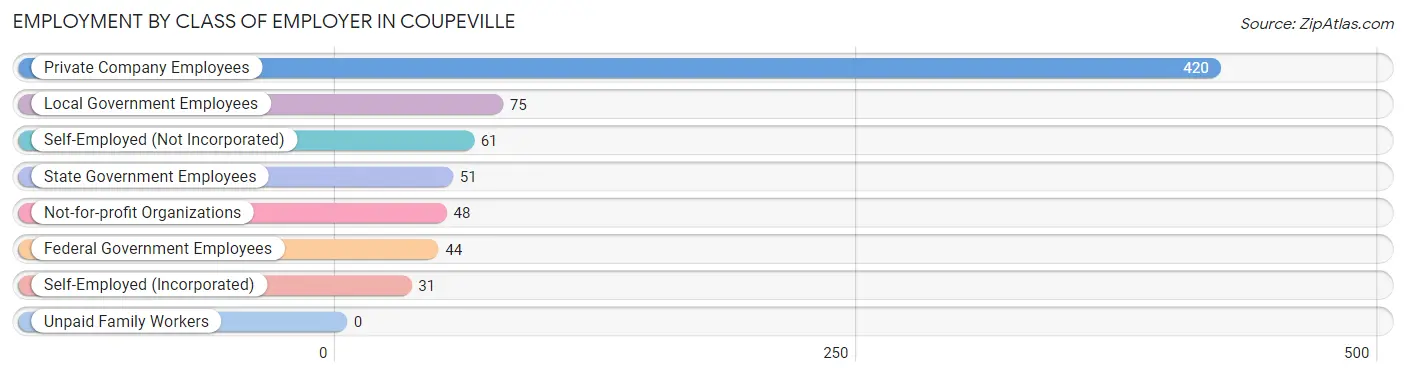
| Employer Class | # Employees | % Employees |
| Private Company Employees | 420 | 57.5% |
| Self-Employed (Incorporated) | 31 | 4.3% |
| Self-Employed (Not Incorporated) | 61 | 8.4% |
| Not-for-profit Organizations | 48 | 6.6% |
| Local Government Employees | 75 | 10.3% |
| State Government Employees | 51 | 7.0% |
| Federal Government Employees | 44 | 6.0% |
| Unpaid Family Workers | 0 | 0.0% |
| Total | 730 | 100.0% |
Employment Status by Age in Coupeville
According to the labor force statistics for Coupeville, out of the total population over 16 years of age (1,869), 40.1% or 749 individuals are in the labor force, with 1.2% or 9 of them unemployed. The age group with the highest labor force participation rate is 25 to 29 years, with 77.1% or 37 individuals in the labor force. Within the labor force, the 35 to 44 years age range has the highest percentage of unemployed individuals, with 9.2% or 9 of them being unemployed.
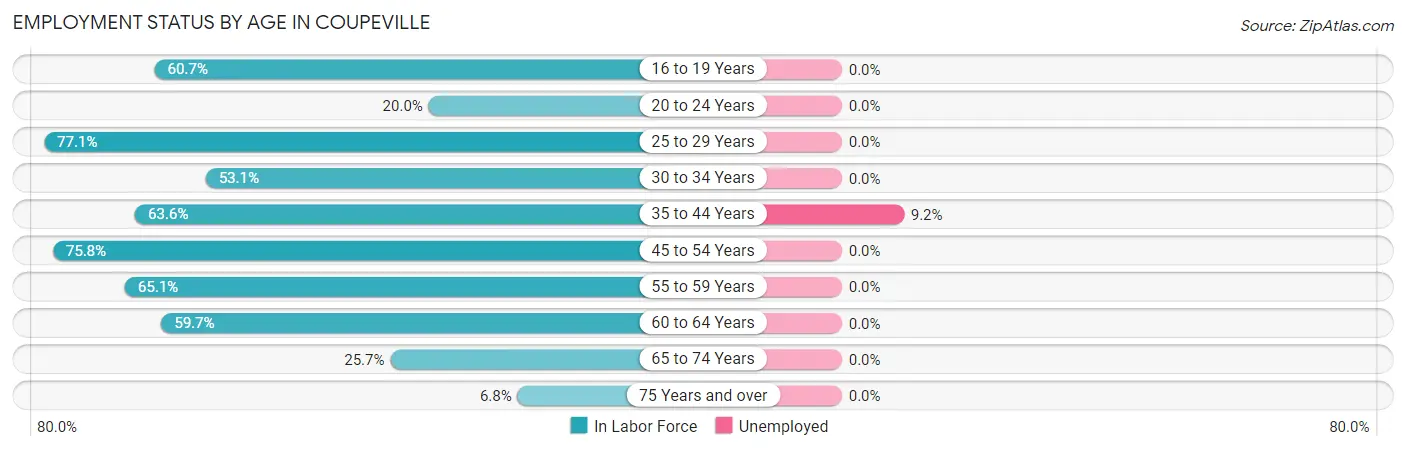
| Age Bracket | In Labor Force | Unemployed |
| 16 to 19 Years | 17 (60.7%) | 0 (0.0%) |
| 20 to 24 Years | 6 (20.0%) | 0 (0.0%) |
| 25 to 29 Years | 37 (77.1%) | 0 (0.0%) |
| 30 to 34 Years | 52 (53.1%) | 0 (0.0%) |
| 35 to 44 Years | 98 (63.6%) | 9 (9.2%) |
| 45 to 54 Years | 157 (75.8%) | 0 (0.0%) |
| 55 to 59 Years | 54 (65.1%) | 0 (0.0%) |
| 60 to 64 Years | 139 (59.7%) | 0 (0.0%) |
| 65 to 74 Years | 167 (25.7%) | 0 (0.0%) |
| 75 Years and over | 23 (6.8%) | 0 (0.0%) |
| Total | 749 (40.1%) | 9 (1.2%) |
Employment Status by Educational Attainment in Coupeville
According to labor force statistics for Coupeville, 65.2% of individuals (537) out of the total population between 25 and 64 years of age (823) are in the labor force, with 1.7% or 9 of them being unemployed. The group with the highest labor force participation rate are those with the educational attainment of bachelor's degree or higher, with 80.4% or 148 individuals in the labor force. Within the labor force, individuals with college / associate degree education have the highest percentage of unemployment, with 4.7% or 9 of them being unemployed.
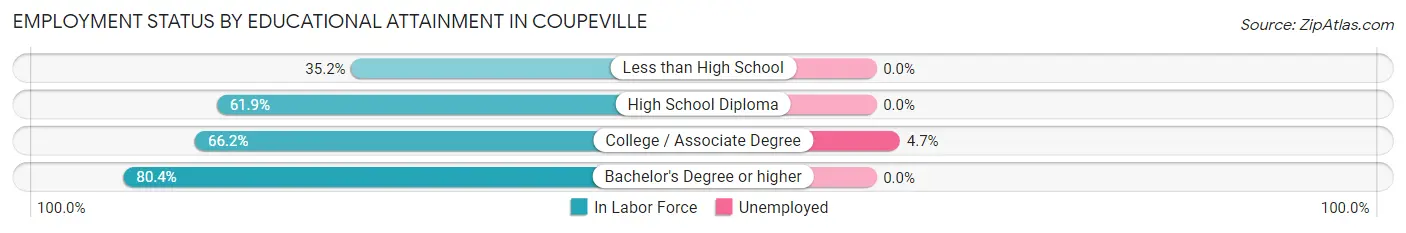
| Educational Attainment | In Labor Force | Unemployed |
| Less than High School | 25 (35.2%) | 0 (0.0%) |
| High School Diploma | 174 (61.9%) | 0 (0.0%) |
| College / Associate Degree | 190 (66.2%) | 13 (4.7%) |
| Bachelor's Degree or higher | 148 (80.4%) | 0 (0.0%) |
| Total | 537 (65.2%) | 14 (1.7%) |
Employment Occupations by Sex in Coupeville
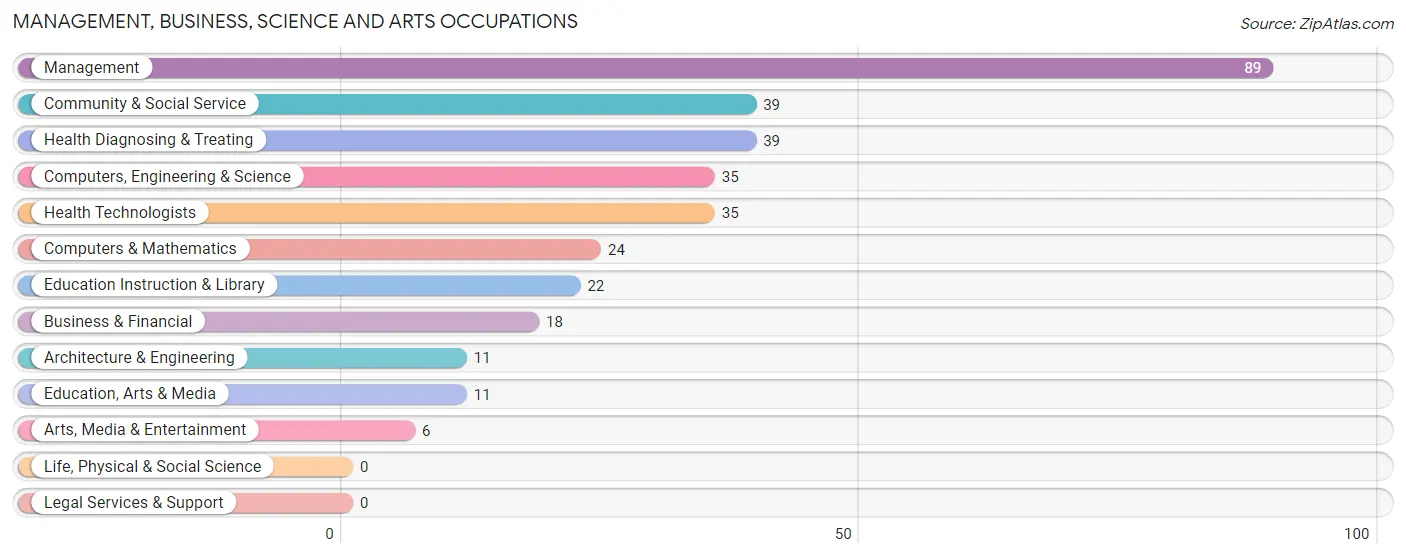
Management, Business, Science and Arts Occupations
The most common Management, Business, Science and Arts occupations in Coupeville are Management (89 | 12.0%), Community & Social Service (39 | 5.3%), Health Diagnosing & Treating (39 | 5.3%), Computers, Engineering & Science (35 | 4.7%), and Health Technologists (35 | 4.7%).
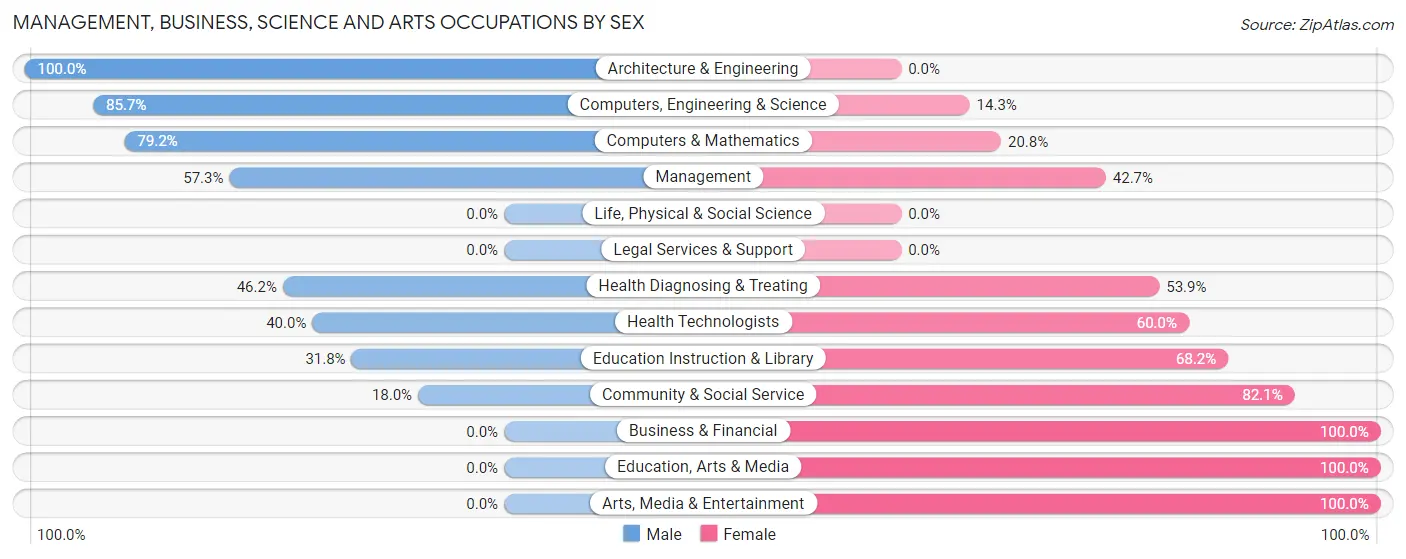
Management, Business, Science and Arts Occupations by Sex
Within the Management, Business, Science and Arts occupations in Coupeville, the most male-oriented occupations are Architecture & Engineering (100.0%), Computers, Engineering & Science (85.7%), and Computers & Mathematics (79.2%), while the most female-oriented occupations are Business & Financial (100.0%), Education, Arts & Media (100.0%), and Arts, Media & Entertainment (100.0%).
| Occupation | Male | Female |
| Management | 51 (57.3%) | 38 (42.7%) |
| Business & Financial | 0 (0.0%) | 18 (100.0%) |
| Computers, Engineering & Science | 30 (85.7%) | 5 (14.3%) |
| Computers & Mathematics | 19 (79.2%) | 5 (20.8%) |
| Architecture & Engineering | 11 (100.0%) | 0 (0.0%) |
| Life, Physical & Social Science | 0 (0.0%) | 0 (0.0%) |
| Community & Social Service | 7 (17.9%) | 32 (82.1%) |
| Education, Arts & Media | 0 (0.0%) | 11 (100.0%) |
| Legal Services & Support | 0 (0.0%) | 0 (0.0%) |
| Education Instruction & Library | 7 (31.8%) | 15 (68.2%) |
| Arts, Media & Entertainment | 0 (0.0%) | 6 (100.0%) |
| Health Diagnosing & Treating | 18 (46.2%) | 21 (53.8%) |
| Health Technologists | 14 (40.0%) | 21 (60.0%) |
| Total (Category) | 106 (48.2%) | 114 (51.8%) |
| Total (Overall) | 415 (56.0%) | 326 (44.0%) |
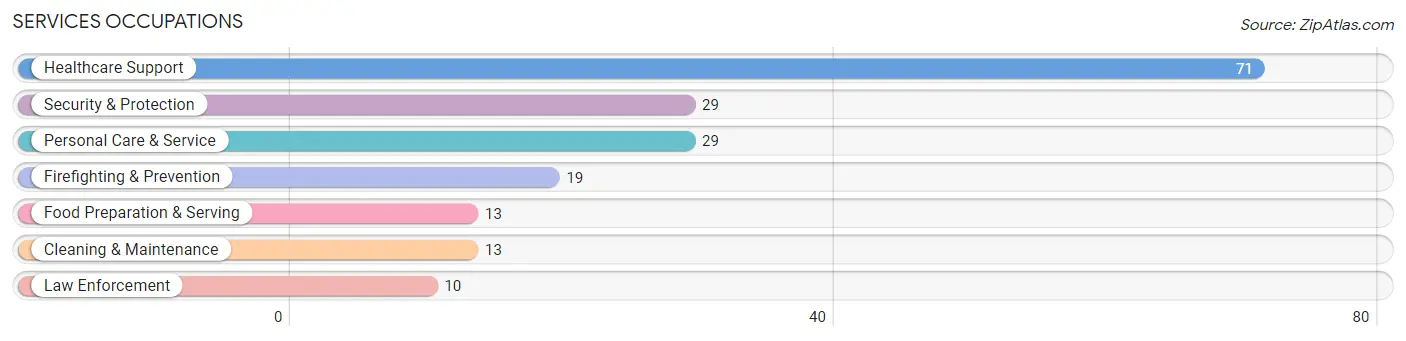
Services Occupations
The most common Services occupations in Coupeville are Healthcare Support (71 | 9.6%), Security & Protection (29 | 3.9%), Personal Care & Service (29 | 3.9%), Firefighting & Prevention (19 | 2.6%), and Food Preparation & Serving (13 | 1.8%).
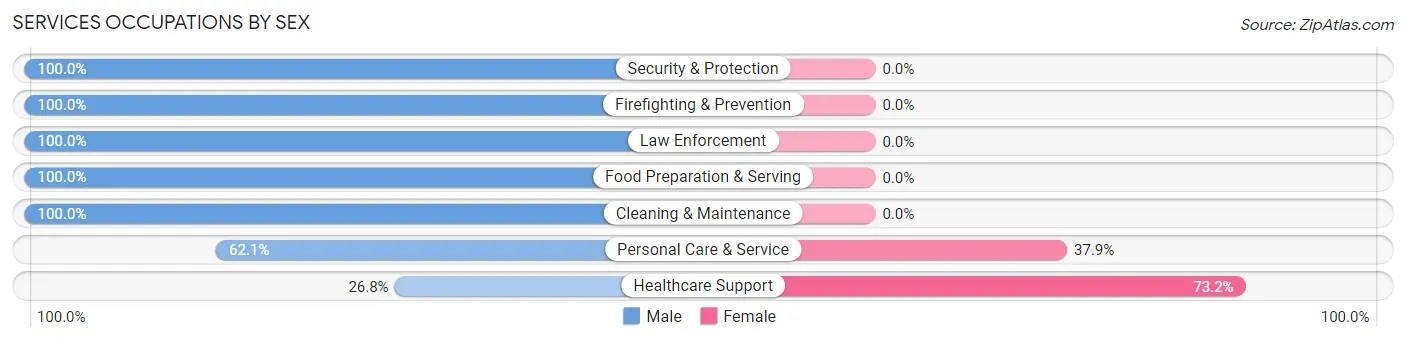
Services Occupations by Sex
Within the Services occupations in Coupeville, the most male-oriented occupations are Security & Protection (100.0%), Firefighting & Prevention (100.0%), and Law Enforcement (100.0%), while the most female-oriented occupations are Healthcare Support (73.2%), and Personal Care & Service (37.9%).
| Occupation | Male | Female |
| Healthcare Support | 19 (26.8%) | 52 (73.2%) |
| Security & Protection | 29 (100.0%) | 0 (0.0%) |
| Firefighting & Prevention | 19 (100.0%) | 0 (0.0%) |
| Law Enforcement | 10 (100.0%) | 0 (0.0%) |
| Food Preparation & Serving | 13 (100.0%) | 0 (0.0%) |
| Cleaning & Maintenance | 13 (100.0%) | 0 (0.0%) |
| Personal Care & Service | 18 (62.1%) | 11 (37.9%) |
| Total (Category) | 92 (59.4%) | 63 (40.6%) |
| Total (Overall) | 415 (56.0%) | 326 (44.0%) |
Sales and Office Occupations
The most common Sales and Office occupations in Coupeville are Sales & Related (124 | 16.7%), and Office & Administration (48 | 6.5%).

Sales and Office Occupations by Sex
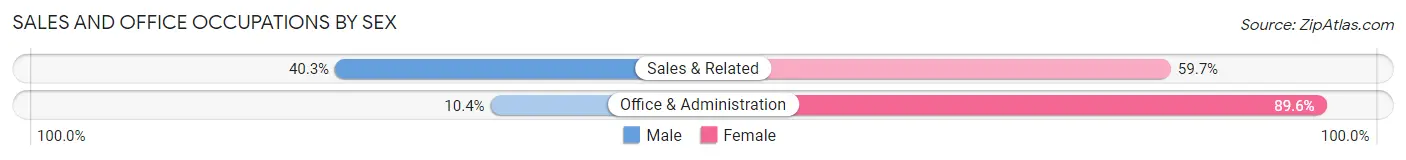
| Occupation | Male | Female |
| Sales & Related | 50 (40.3%) | 74 (59.7%) |
| Office & Administration | 5 (10.4%) | 43 (89.6%) |
| Total (Category) | 55 (32.0%) | 117 (68.0%) |
| Total (Overall) | 415 (56.0%) | 326 (44.0%) |
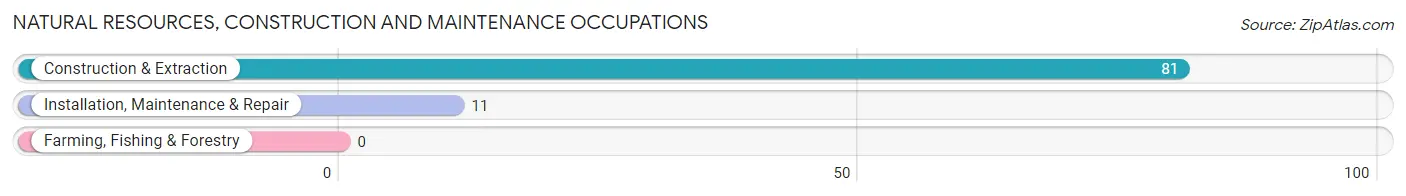
Natural Resources, Construction and Maintenance Occupations
The most common Natural Resources, Construction and Maintenance occupations in Coupeville are Construction & Extraction (81 | 10.9%), and Installation, Maintenance & Repair (11 | 1.5%).
Natural Resources, Construction and Maintenance Occupations by Sex
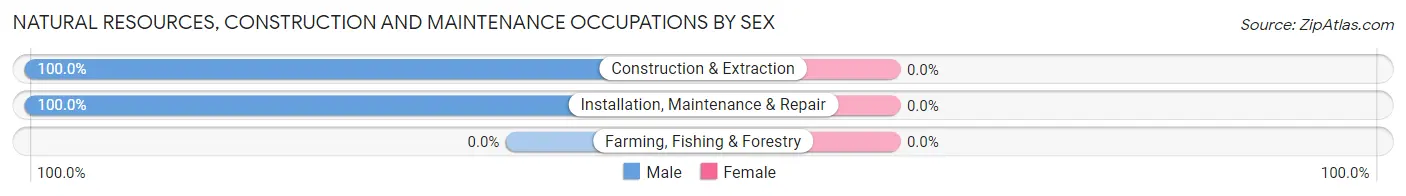
| Occupation | Male | Female |
| Farming, Fishing & Forestry | 0 (0.0%) | 0 (0.0%) |
| Construction & Extraction | 81 (100.0%) | 0 (0.0%) |
| Installation, Maintenance & Repair | 11 (100.0%) | 0 (0.0%) |
| Total (Category) | 92 (100.0%) | 0 (0.0%) |
| Total (Overall) | 415 (56.0%) | 326 (44.0%) |
Production, Transportation and Moving Occupations
The most common Production, Transportation and Moving occupations in Coupeville are Transportation (47 | 6.3%), Material Moving (34 | 4.6%), and Production (21 | 2.8%).
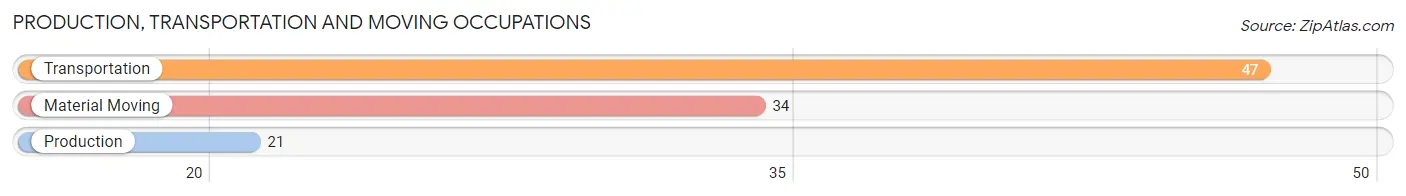
Production, Transportation and Moving Occupations by Sex
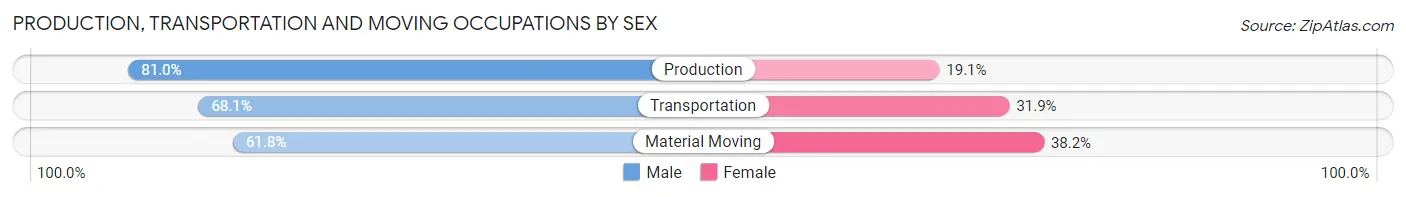
| Occupation | Male | Female |
| Production | 17 (80.9%) | 4 (19.1%) |
| Transportation | 32 (68.1%) | 15 (31.9%) |
| Material Moving | 21 (61.8%) | 13 (38.2%) |
| Total (Category) | 70 (68.6%) | 32 (31.4%) |
| Total (Overall) | 415 (56.0%) | 326 (44.0%) |
Employment Industries by Sex in Coupeville
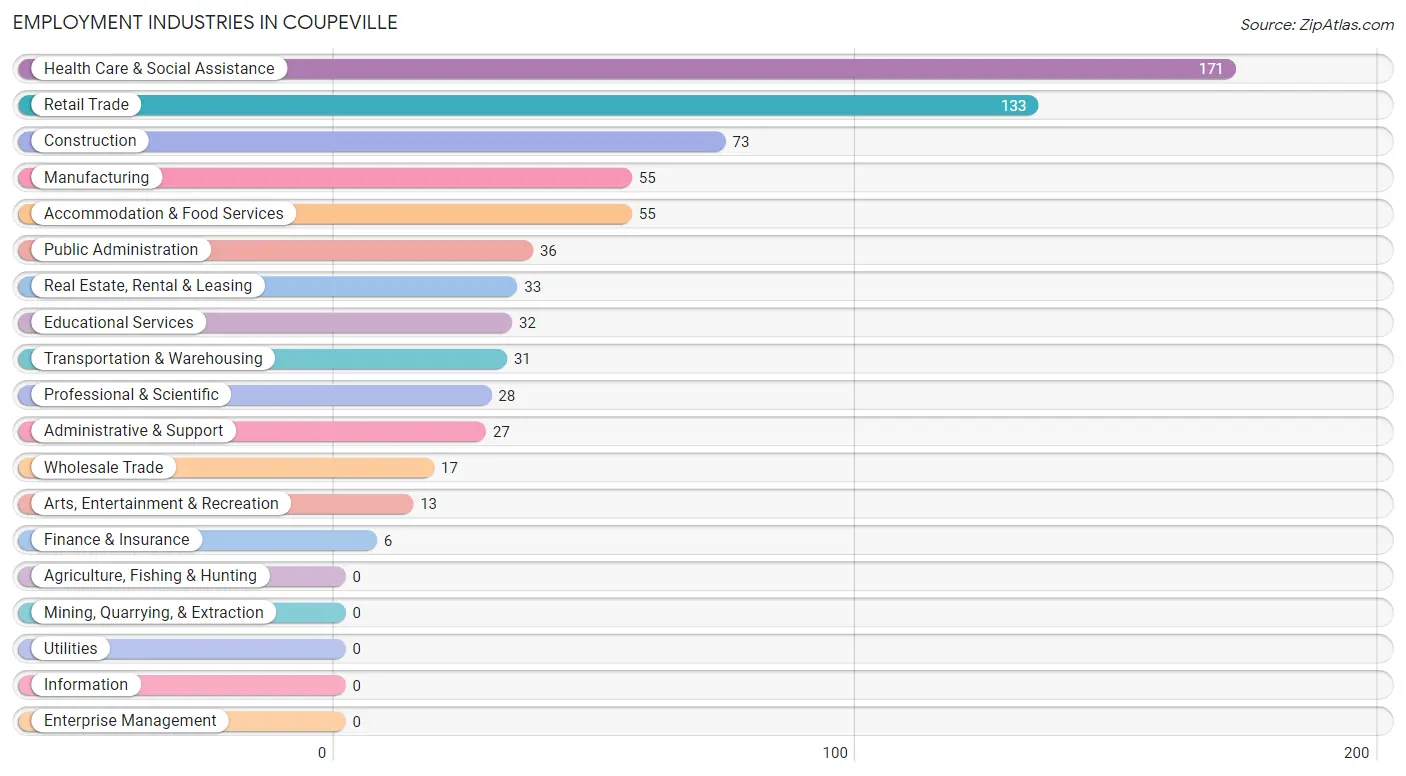
Employment Industries in Coupeville
The major employment industries in Coupeville include Health Care & Social Assistance (171 | 23.1%), Retail Trade (133 | 17.9%), Construction (73 | 9.9%), Manufacturing (55 | 7.4%), and Accommodation & Food Services (55 | 7.4%).
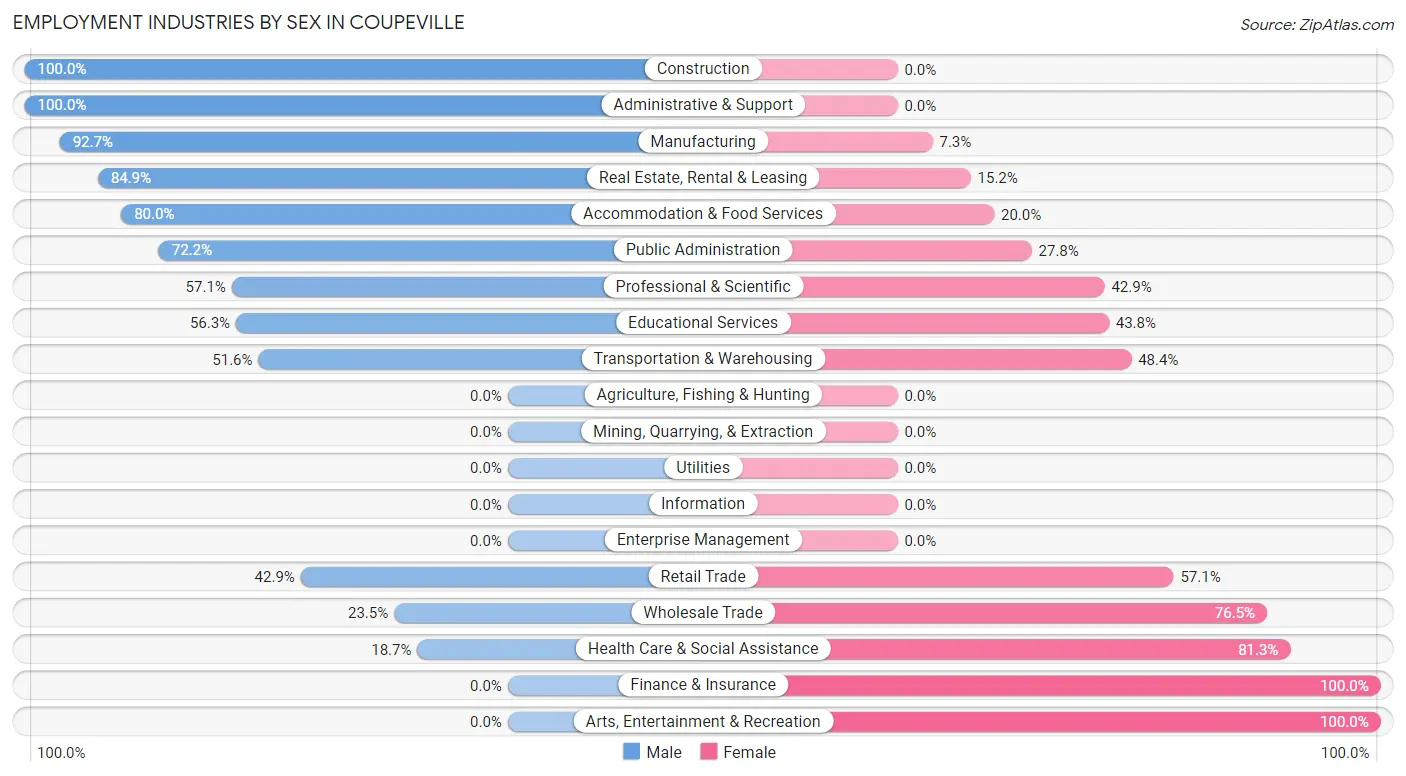
Employment Industries by Sex in Coupeville
The Coupeville industries that see more men than women are Construction (100.0%), Administrative & Support (100.0%), and Manufacturing (92.7%), whereas the industries that tend to have a higher number of women are Finance & Insurance (100.0%), Arts, Entertainment & Recreation (100.0%), and Health Care & Social Assistance (81.3%).
| Industry | Male | Female |
| Agriculture, Fishing & Hunting | 0 (0.0%) | 0 (0.0%) |
| Mining, Quarrying, & Extraction | 0 (0.0%) | 0 (0.0%) |
| Construction | 73 (100.0%) | 0 (0.0%) |
| Manufacturing | 51 (92.7%) | 4 (7.3%) |
| Wholesale Trade | 4 (23.5%) | 13 (76.5%) |
| Retail Trade | 57 (42.9%) | 76 (57.1%) |
| Transportation & Warehousing | 16 (51.6%) | 15 (48.4%) |
| Utilities | 0 (0.0%) | 0 (0.0%) |
| Information | 0 (0.0%) | 0 (0.0%) |
| Finance & Insurance | 0 (0.0%) | 6 (100.0%) |
| Real Estate, Rental & Leasing | 28 (84.9%) | 5 (15.1%) |
| Professional & Scientific | 16 (57.1%) | 12 (42.9%) |
| Enterprise Management | 0 (0.0%) | 0 (0.0%) |
| Administrative & Support | 27 (100.0%) | 0 (0.0%) |
| Educational Services | 18 (56.2%) | 14 (43.8%) |
| Health Care & Social Assistance | 32 (18.7%) | 139 (81.3%) |
| Arts, Entertainment & Recreation | 0 (0.0%) | 13 (100.0%) |
| Accommodation & Food Services | 44 (80.0%) | 11 (20.0%) |
| Public Administration | 26 (72.2%) | 10 (27.8%) |
| Total | 415 (56.0%) | 326 (44.0%) |
Education in Coupeville
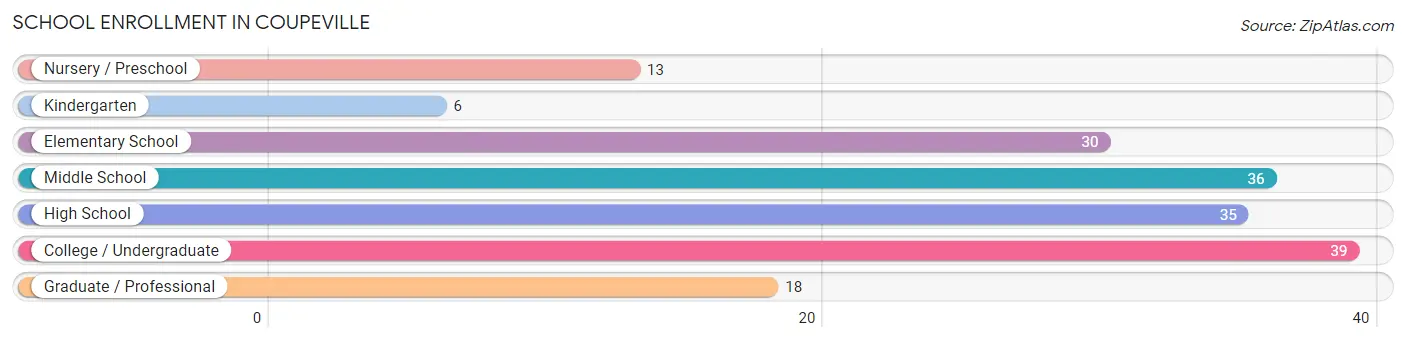
School Enrollment in Coupeville
The most common levels of schooling among the 177 students in Coupeville are college / undergraduate (39 | 22.0%), middle school (36 | 20.3%), and high school (35 | 19.8%).
| School Level | # Students | % Students |
| Nursery / Preschool | 13 | 7.3% |
| Kindergarten | 6 | 3.4% |
| Elementary School | 30 | 17.0% |
| Middle School | 36 | 20.3% |
| High School | 35 | 19.8% |
| College / Undergraduate | 39 | 22.0% |
| Graduate / Professional | 18 | 10.2% |
| Total | 177 | 100.0% |
School Enrollment by Age by Funding Source in Coupeville
Out of a total of 177 students who are enrolled in schools in Coupeville, 25 (14.1%) attend a private institution, while the remaining 152 (85.9%) are enrolled in public schools. The age group of 20 to 24 year olds has the highest likelihood of being enrolled in private schools, with 4 (100.0% in the age bracket) enrolled. Conversely, the age group of 10 to 14 year olds has the lowest likelihood of being enrolled in a private school, with 47 (100.0% in the age bracket) attending a public institution.
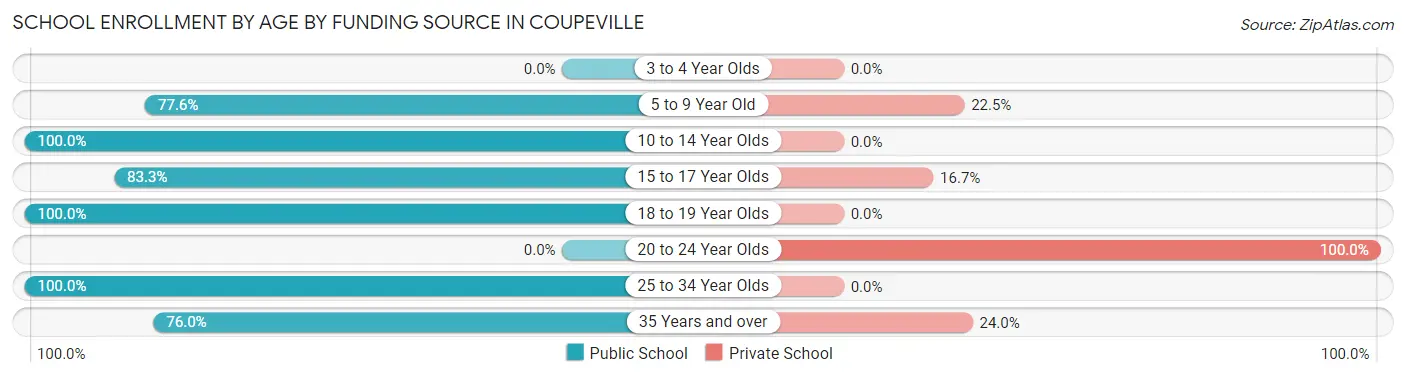
| Age Bracket | Public School | Private School |
| 3 to 4 Year Olds | 0 (0.0%) | 0 (0.0%) |
| 5 to 9 Year Old | 38 (77.5%) | 11 (22.5%) |
| 10 to 14 Year Olds | 47 (100.0%) | 0 (0.0%) |
| 15 to 17 Year Olds | 20 (83.3%) | 4 (16.7%) |
| 18 to 19 Year Olds | 4 (100.0%) | 0 (0.0%) |
| 20 to 24 Year Olds | 0 (0.0%) | 4 (100.0%) |
| 25 to 34 Year Olds | 24 (100.0%) | 0 (0.0%) |
| 35 Years and over | 19 (76.0%) | 6 (24.0%) |
| Total | 152 (85.9%) | 25 (14.1%) |
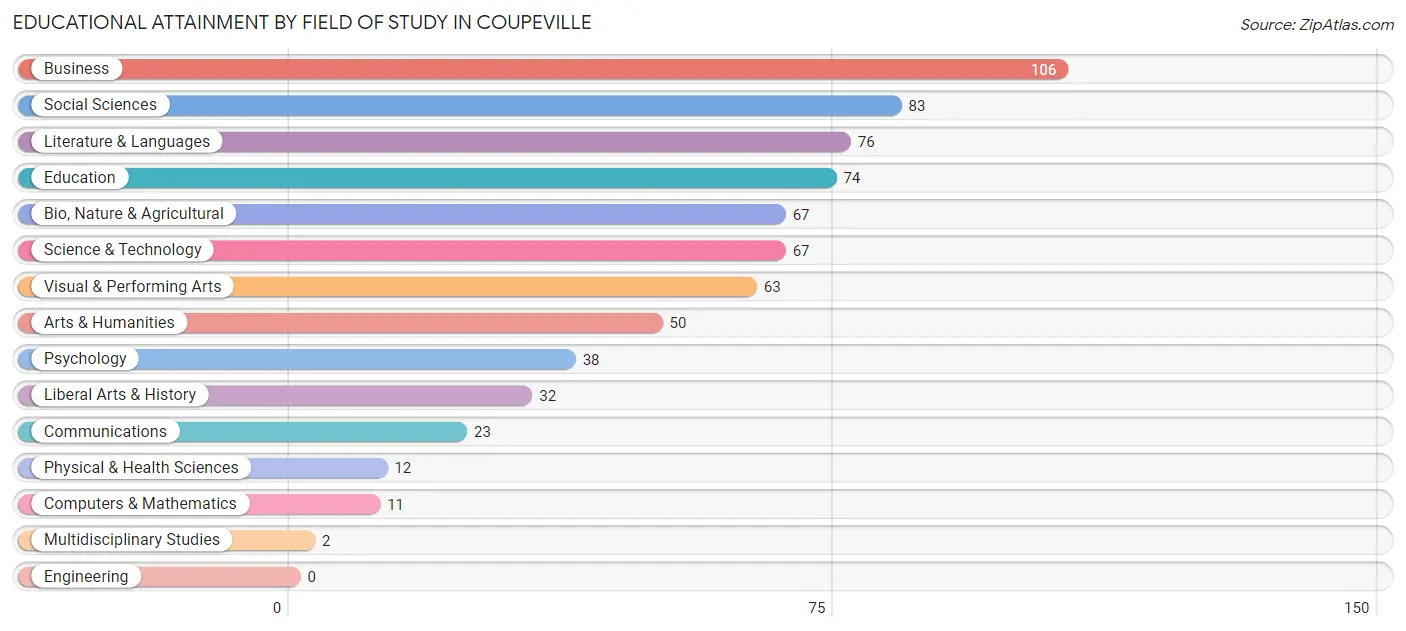
Educational Attainment by Field of Study in Coupeville
Business (106 | 15.1%), social sciences (83 | 11.8%), literature & languages (76 | 10.8%), education (74 | 10.5%), and bio, nature & agricultural (67 | 9.5%) are the most common fields of study among 704 individuals in Coupeville who have obtained a bachelor's degree or higher.
| Field of Study | # Graduates | % Graduates |
| Computers & Mathematics | 11 | 1.6% |
| Bio, Nature & Agricultural | 67 | 9.5% |
| Physical & Health Sciences | 12 | 1.7% |
| Psychology | 38 | 5.4% |
| Social Sciences | 83 | 11.8% |
| Engineering | 0 | 0.0% |
| Multidisciplinary Studies | 2 | 0.3% |
| Science & Technology | 67 | 9.5% |
| Business | 106 | 15.1% |
| Education | 74 | 10.5% |
| Literature & Languages | 76 | 10.8% |
| Liberal Arts & History | 32 | 4.5% |
| Visual & Performing Arts | 63 | 8.9% |
| Communications | 23 | 3.3% |
| Arts & Humanities | 50 | 7.1% |
| Total | 704 | 100.0% |
Transportation & Commute in Coupeville
Vehicle Availability by Sex in Coupeville
The most prevalent vehicle ownership categories in Coupeville are males with 2 vehicles (128, accounting for 31.7%) and females with 2 vehicles (98, making up 39.8%).
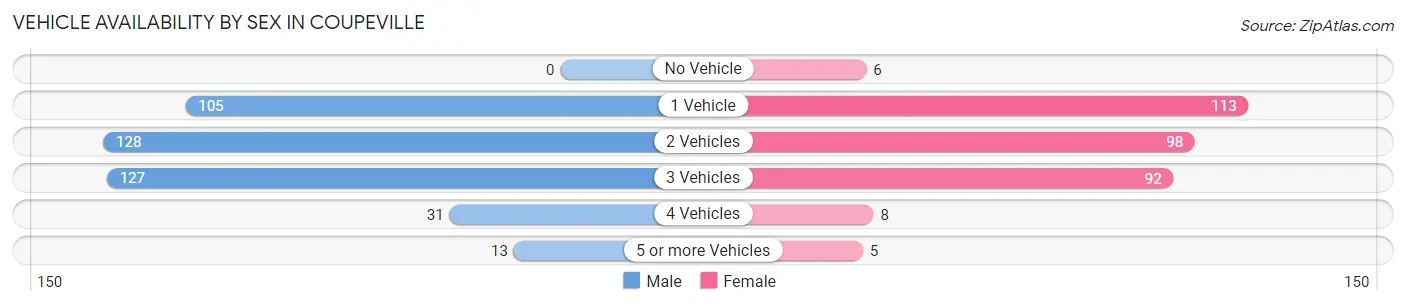
| Vehicles Available | Male | Female |
| No Vehicle | 0 (0.0%) | 6 (1.9%) |
| 1 Vehicle | 105 (26.0%) | 113 (35.1%) |
| 2 Vehicles | 128 (31.7%) | 98 (30.4%) |
| 3 Vehicles | 127 (31.4%) | 92 (28.6%) |
| 4 Vehicles | 31 (7.7%) | 8 (2.5%) |
| 5 or more Vehicles | 13 (3.2%) | 5 (1.5%) |
| Total | 404 (100.0%) | 322 (100.0%) |
Commute Time in Coupeville
The most frequently occuring commute durations in Coupeville are 5 to 9 minutes (137 commuters, 22.7%), less than 5 minutes (82 commuters, 13.6%), and 20 to 24 minutes (72 commuters, 11.9%).
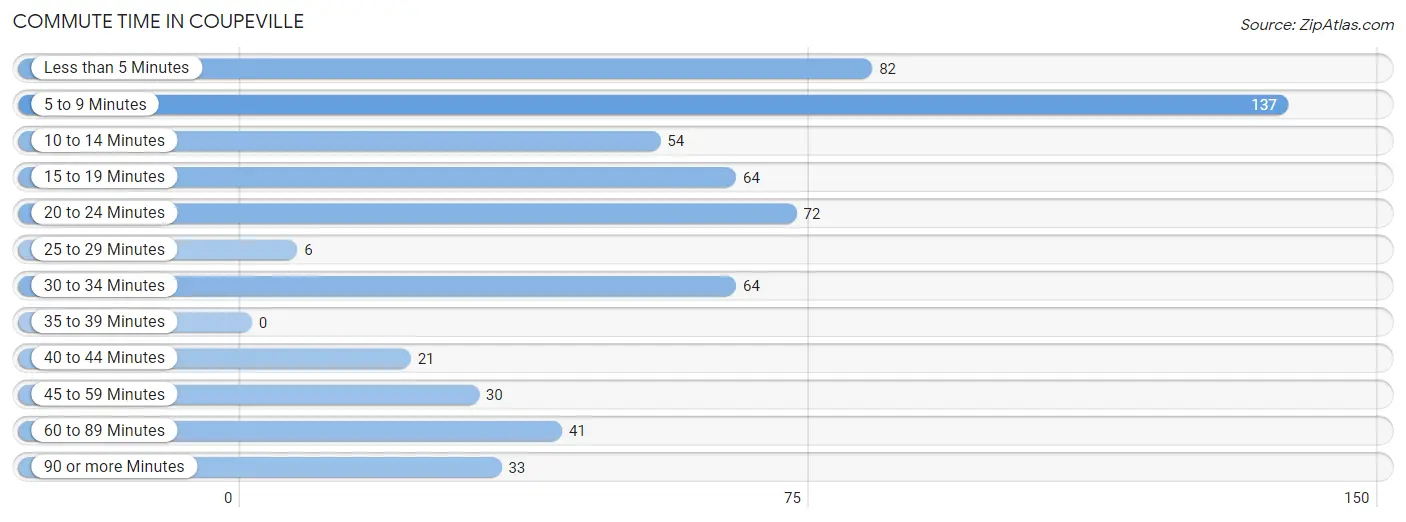
| Commute Time | # Commuters | % Commuters |
| Less than 5 Minutes | 82 | 13.6% |
| 5 to 9 Minutes | 137 | 22.7% |
| 10 to 14 Minutes | 54 | 8.9% |
| 15 to 19 Minutes | 64 | 10.6% |
| 20 to 24 Minutes | 72 | 11.9% |
| 25 to 29 Minutes | 6 | 1.0% |
| 30 to 34 Minutes | 64 | 10.6% |
| 35 to 39 Minutes | 0 | 0.0% |
| 40 to 44 Minutes | 21 | 3.5% |
| 45 to 59 Minutes | 30 | 5.0% |
| 60 to 89 Minutes | 41 | 6.8% |
| 90 or more Minutes | 33 | 5.5% |
Commute Time by Sex in Coupeville
The most common commute times in Coupeville are less than 5 minutes (58 commuters, 16.9%) for males and 5 to 9 minutes (97 commuters, 37.2%) for females.
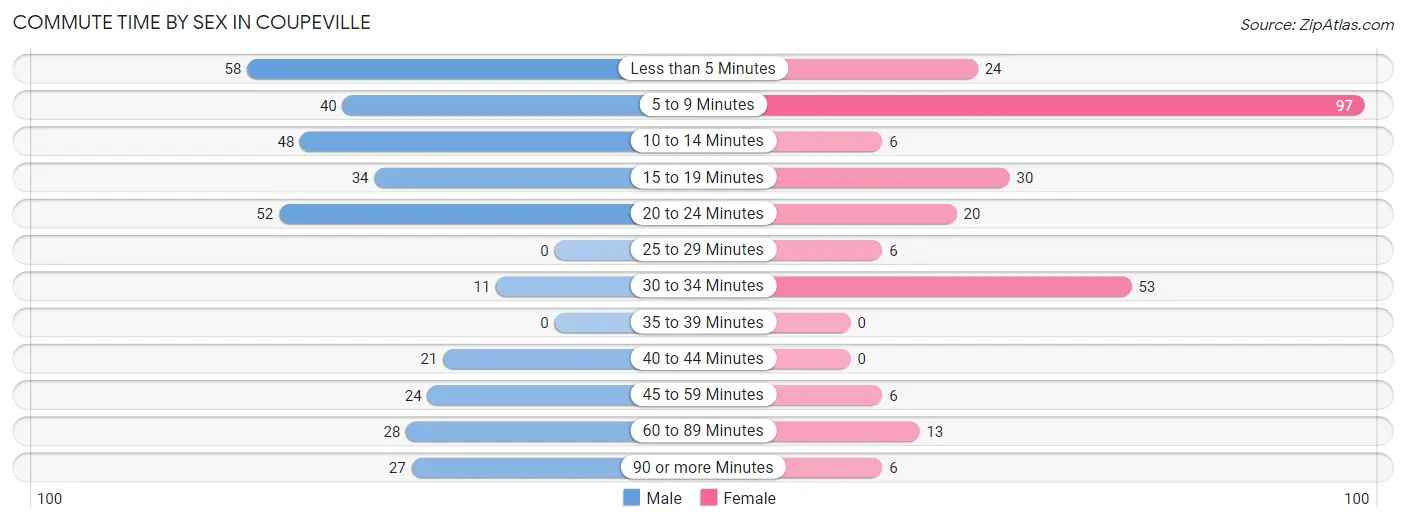
| Commute Time | Male | Female |
| Less than 5 Minutes | 58 (16.9%) | 24 (9.2%) |
| 5 to 9 Minutes | 40 (11.7%) | 97 (37.2%) |
| 10 to 14 Minutes | 48 (14.0%) | 6 (2.3%) |
| 15 to 19 Minutes | 34 (9.9%) | 30 (11.5%) |
| 20 to 24 Minutes | 52 (15.2%) | 20 (7.7%) |
| 25 to 29 Minutes | 0 (0.0%) | 6 (2.3%) |
| 30 to 34 Minutes | 11 (3.2%) | 53 (20.3%) |
| 35 to 39 Minutes | 0 (0.0%) | 0 (0.0%) |
| 40 to 44 Minutes | 21 (6.1%) | 0 (0.0%) |
| 45 to 59 Minutes | 24 (7.0%) | 6 (2.3%) |
| 60 to 89 Minutes | 28 (8.2%) | 13 (5.0%) |
| 90 or more Minutes | 27 (7.9%) | 6 (2.3%) |
Time of Departure to Work by Sex in Coupeville
The most frequent times of departure to work in Coupeville are 12:00 PM to 3:59 PM (64, 18.7%) for males and 12:00 PM to 3:59 PM (78, 29.9%) for females.
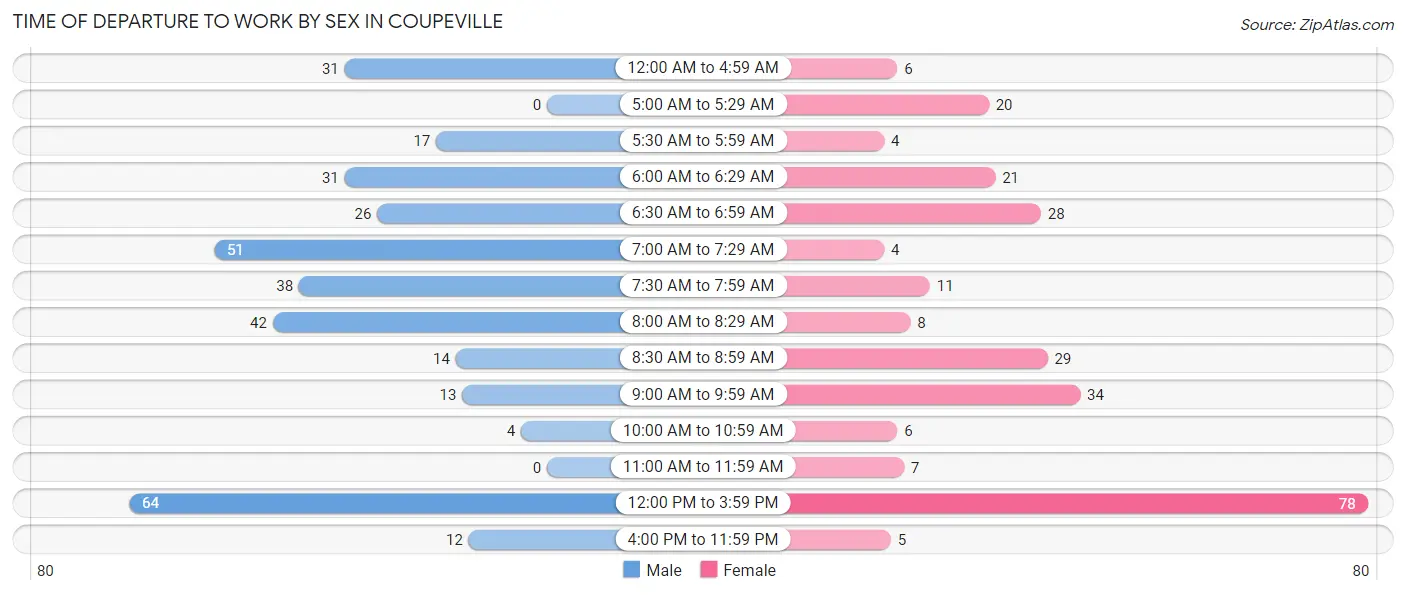
| Time of Departure | Male | Female |
| 12:00 AM to 4:59 AM | 31 (9.0%) | 6 (2.3%) |
| 5:00 AM to 5:29 AM | 0 (0.0%) | 20 (7.7%) |
| 5:30 AM to 5:59 AM | 17 (5.0%) | 4 (1.5%) |
| 6:00 AM to 6:29 AM | 31 (9.0%) | 21 (8.1%) |
| 6:30 AM to 6:59 AM | 26 (7.6%) | 28 (10.7%) |
| 7:00 AM to 7:29 AM | 51 (14.9%) | 4 (1.5%) |
| 7:30 AM to 7:59 AM | 38 (11.1%) | 11 (4.2%) |
| 8:00 AM to 8:29 AM | 42 (12.2%) | 8 (3.1%) |
| 8:30 AM to 8:59 AM | 14 (4.1%) | 29 (11.1%) |
| 9:00 AM to 9:59 AM | 13 (3.8%) | 34 (13.0%) |
| 10:00 AM to 10:59 AM | 4 (1.2%) | 6 (2.3%) |
| 11:00 AM to 11:59 AM | 0 (0.0%) | 7 (2.7%) |
| 12:00 PM to 3:59 PM | 64 (18.7%) | 78 (29.9%) |
| 4:00 PM to 11:59 PM | 12 (3.5%) | 5 (1.9%) |
| Total | 343 (100.0%) | 261 (100.0%) |
Housing Occupancy in Coupeville
Occupancy by Ownership in Coupeville
Of the total 853 dwellings in Coupeville, owner-occupied units account for 560 (65.6%), while renter-occupied units make up 293 (34.4%).
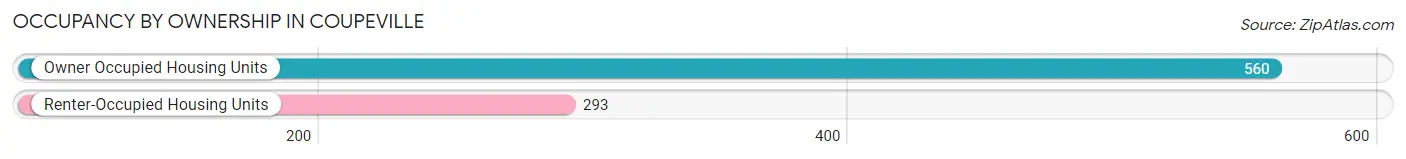
| Occupancy | # Housing Units | % Housing Units |
| Owner Occupied Housing Units | 560 | 65.6% |
| Renter-Occupied Housing Units | 293 | 34.4% |
| Total Occupied Housing Units | 853 | 100.0% |
Occupancy by Household Size in Coupeville
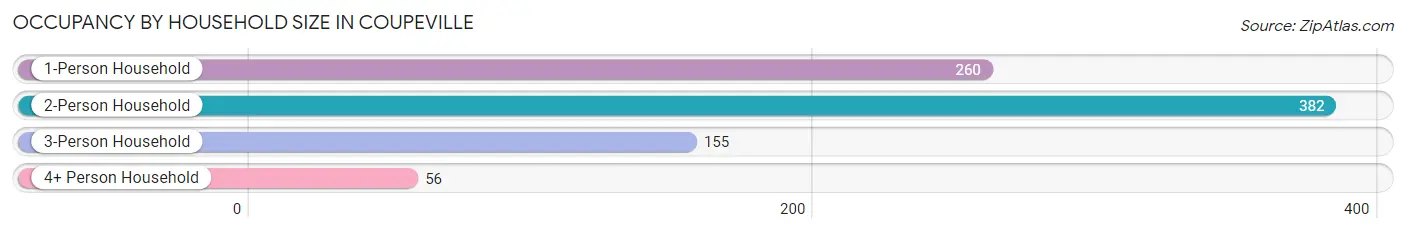
| Household Size | # Housing Units | % Housing Units |
| 1-Person Household | 260 | 30.5% |
| 2-Person Household | 382 | 44.8% |
| 3-Person Household | 155 | 18.2% |
| 4+ Person Household | 56 | 6.6% |
| Total Housing Units | 853 | 100.0% |
Occupancy by Ownership by Household Size in Coupeville
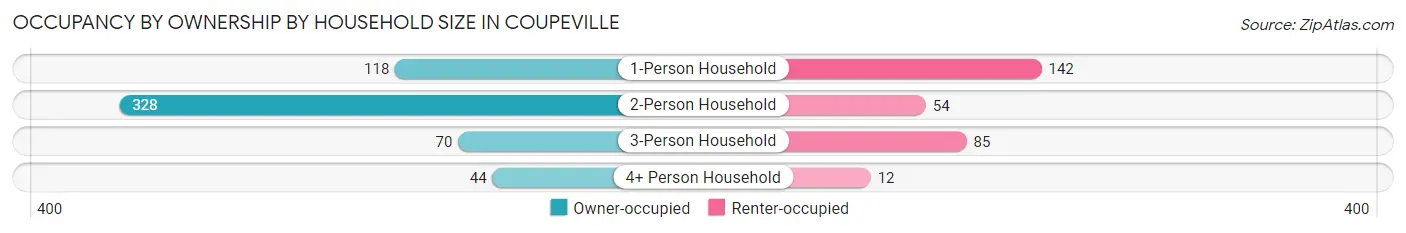
| Household Size | Owner-occupied | Renter-occupied |
| 1-Person Household | 118 (45.4%) | 142 (54.6%) |
| 2-Person Household | 328 (85.9%) | 54 (14.1%) |
| 3-Person Household | 70 (45.2%) | 85 (54.8%) |
| 4+ Person Household | 44 (78.6%) | 12 (21.4%) |
| Total Housing Units | 560 (65.6%) | 293 (34.4%) |
Occupancy by Educational Attainment in Coupeville
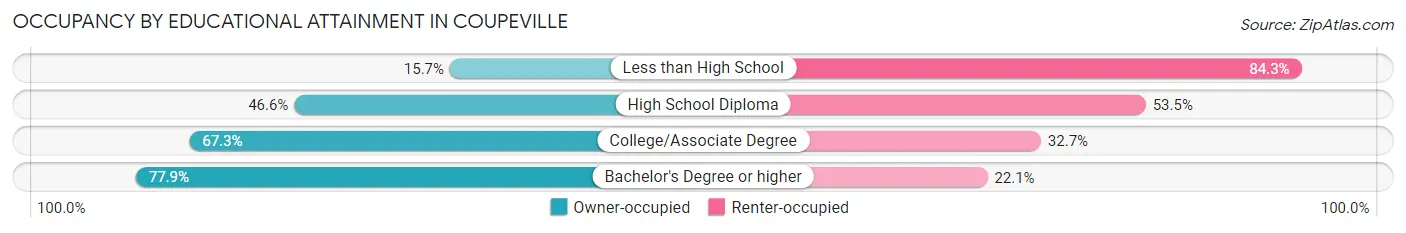
| Household Size | Owner-occupied | Renter-occupied |
| Less than High School | 8 (15.7%) | 43 (84.3%) |
| High School Diploma | 54 (46.6%) | 62 (53.4%) |
| College/Associate Degree | 233 (67.3%) | 113 (32.7%) |
| Bachelor's Degree or higher | 265 (77.9%) | 75 (22.1%) |
Occupancy by Age of Householder in Coupeville
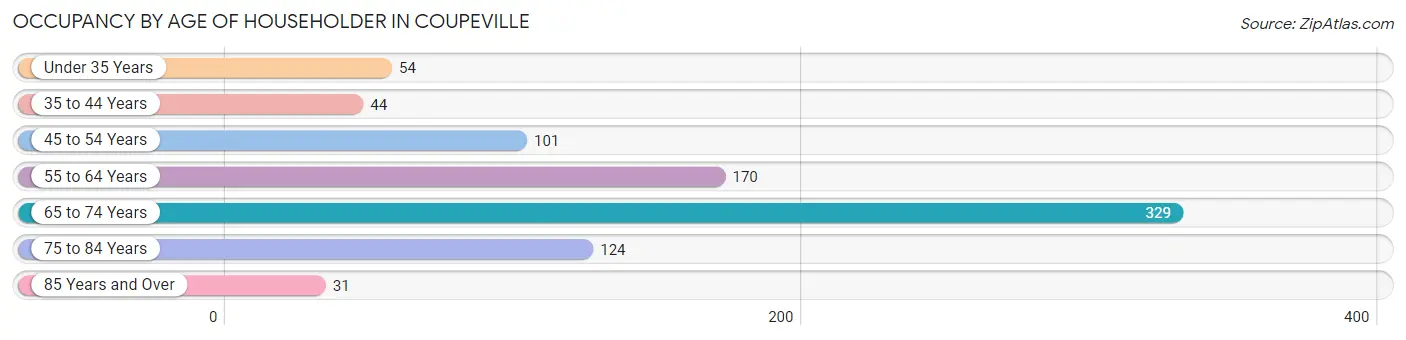
| Age Bracket | # Households | % Households |
| Under 35 Years | 54 | 6.3% |
| 35 to 44 Years | 44 | 5.2% |
| 45 to 54 Years | 101 | 11.8% |
| 55 to 64 Years | 170 | 19.9% |
| 65 to 74 Years | 329 | 38.6% |
| 75 to 84 Years | 124 | 14.5% |
| 85 Years and Over | 31 | 3.6% |
| Total | 853 | 100.0% |
Housing Finances in Coupeville
Median Income by Occupancy in Coupeville
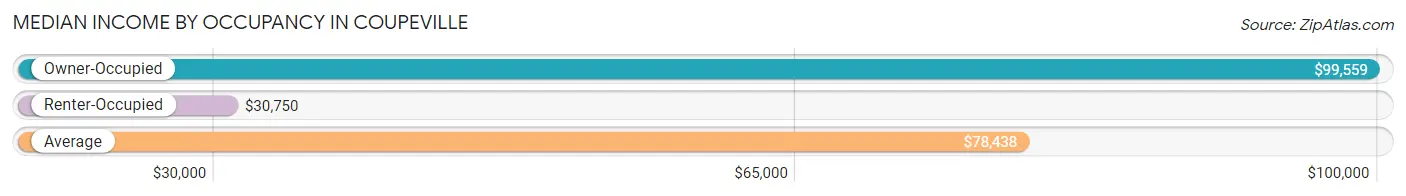
| Occupancy Type | # Households | Median Income |
| Owner-Occupied | 560 (65.6%) | $99,559 |
| Renter-Occupied | 293 (34.4%) | $30,750 |
| Average | 853 (100.0%) | $78,438 |
Occupancy by Householder Income Bracket in Coupeville
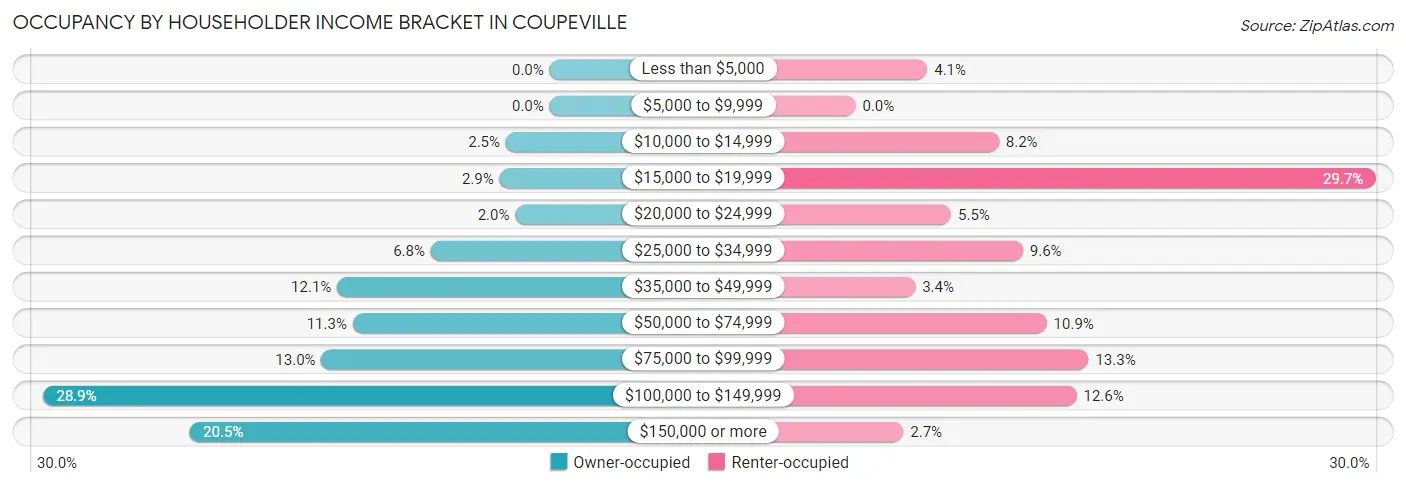
| Income Bracket | Owner-occupied | Renter-occupied |
| Less than $5,000 | 0 (0.0%) | 12 (4.1%) |
| $5,000 to $9,999 | 0 (0.0%) | 0 (0.0%) |
| $10,000 to $14,999 | 14 (2.5%) | 24 (8.2%) |
| $15,000 to $19,999 | 16 (2.9%) | 87 (29.7%) |
| $20,000 to $24,999 | 11 (2.0%) | 16 (5.5%) |
| $25,000 to $34,999 | 38 (6.8%) | 28 (9.6%) |
| $35,000 to $49,999 | 68 (12.1%) | 10 (3.4%) |
| $50,000 to $74,999 | 63 (11.3%) | 32 (10.9%) |
| $75,000 to $99,999 | 73 (13.0%) | 39 (13.3%) |
| $100,000 to $149,999 | 162 (28.9%) | 37 (12.6%) |
| $150,000 or more | 115 (20.5%) | 8 (2.7%) |
| Total | 560 (100.0%) | 293 (100.0%) |
Monthly Housing Cost Tiers in Coupeville
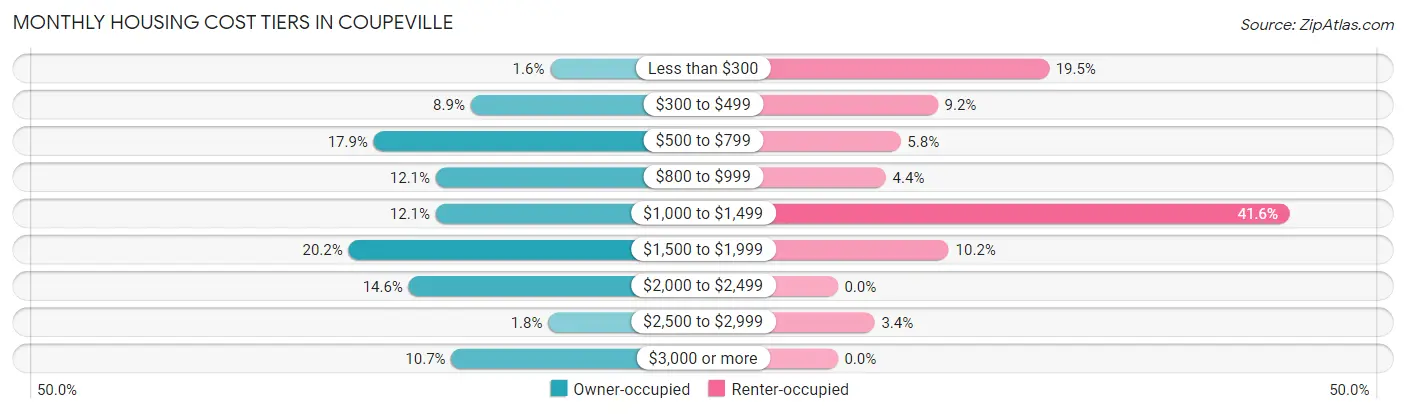
| Monthly Cost | Owner-occupied | Renter-occupied |
| Less than $300 | 9 (1.6%) | 57 (19.5%) |
| $300 to $499 | 50 (8.9%) | 27 (9.2%) |
| $500 to $799 | 100 (17.9%) | 17 (5.8%) |
| $800 to $999 | 68 (12.1%) | 13 (4.4%) |
| $1,000 to $1,499 | 68 (12.1%) | 122 (41.6%) |
| $1,500 to $1,999 | 113 (20.2%) | 30 (10.2%) |
| $2,000 to $2,499 | 82 (14.6%) | 0 (0.0%) |
| $2,500 to $2,999 | 10 (1.8%) | 10 (3.4%) |
| $3,000 or more | 60 (10.7%) | 0 (0.0%) |
| Total | 560 (100.0%) | 293 (100.0%) |
Physical Housing Characteristics in Coupeville
Housing Structures in Coupeville
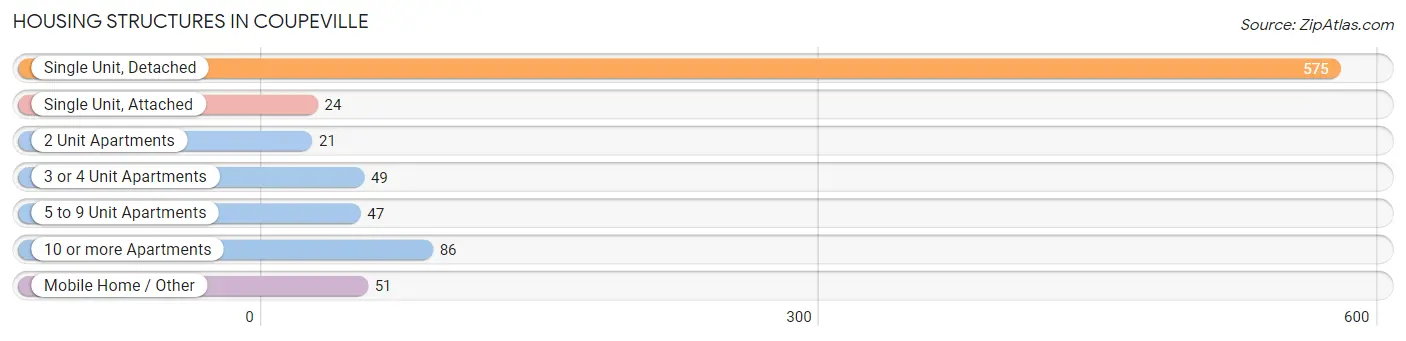
| Structure Type | # Housing Units | % Housing Units |
| Single Unit, Detached | 575 | 67.4% |
| Single Unit, Attached | 24 | 2.8% |
| 2 Unit Apartments | 21 | 2.5% |
| 3 or 4 Unit Apartments | 49 | 5.7% |
| 5 to 9 Unit Apartments | 47 | 5.5% |
| 10 or more Apartments | 86 | 10.1% |
| Mobile Home / Other | 51 | 6.0% |
| Total | 853 | 100.0% |
Housing Structures by Occupancy in Coupeville
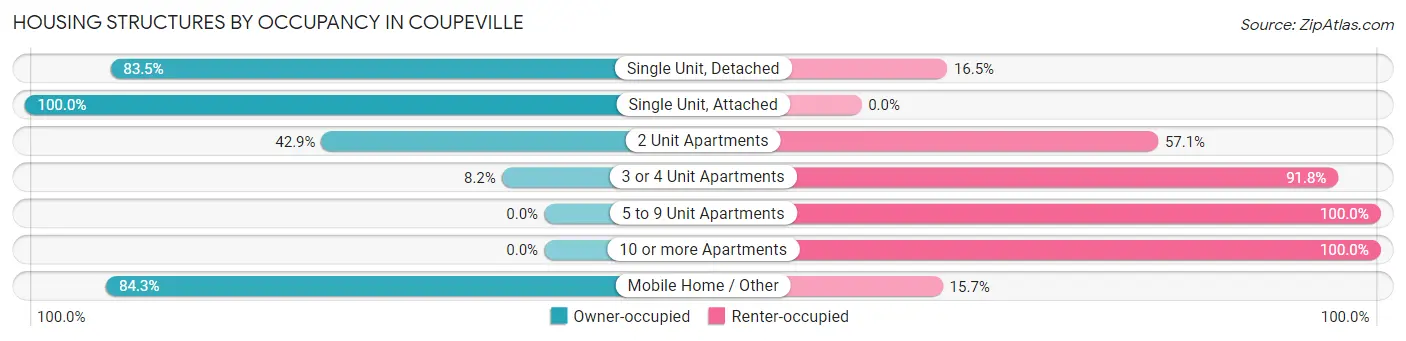
| Structure Type | Owner-occupied | Renter-occupied |
| Single Unit, Detached | 480 (83.5%) | 95 (16.5%) |
| Single Unit, Attached | 24 (100.0%) | 0 (0.0%) |
| 2 Unit Apartments | 9 (42.9%) | 12 (57.1%) |
| 3 or 4 Unit Apartments | 4 (8.2%) | 45 (91.8%) |
| 5 to 9 Unit Apartments | 0 (0.0%) | 47 (100.0%) |
| 10 or more Apartments | 0 (0.0%) | 86 (100.0%) |
| Mobile Home / Other | 43 (84.3%) | 8 (15.7%) |
| Total | 560 (65.6%) | 293 (34.4%) |
Housing Structures by Number of Rooms in Coupeville
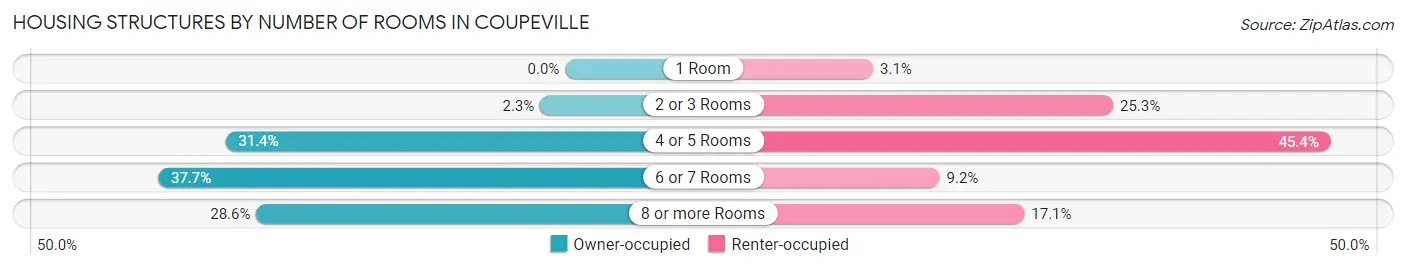
| Number of Rooms | Owner-occupied | Renter-occupied |
| 1 Room | 0 (0.0%) | 9 (3.1%) |
| 2 or 3 Rooms | 13 (2.3%) | 74 (25.3%) |
| 4 or 5 Rooms | 176 (31.4%) | 133 (45.4%) |
| 6 or 7 Rooms | 211 (37.7%) | 27 (9.2%) |
| 8 or more Rooms | 160 (28.6%) | 50 (17.1%) |
| Total | 560 (100.0%) | 293 (100.0%) |
Housing Structure by Heating Type in Coupeville
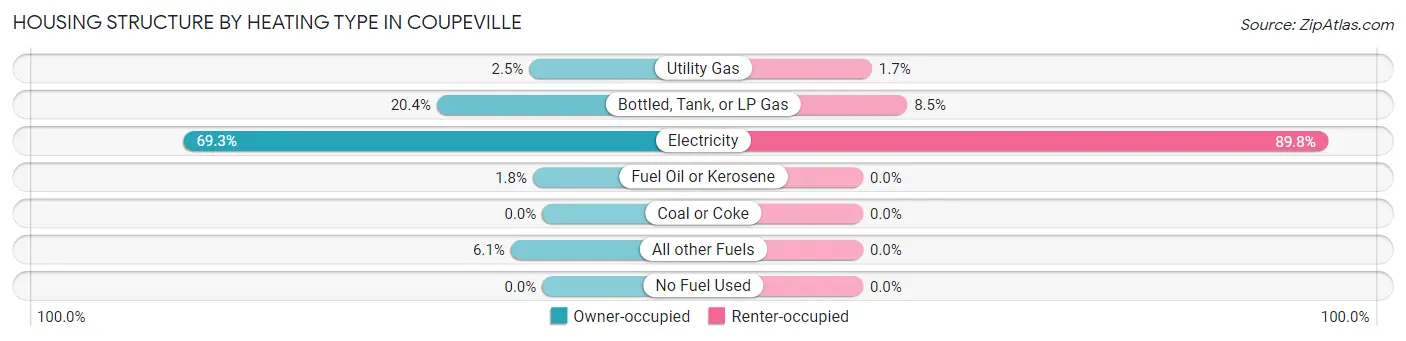
| Heating Type | Owner-occupied | Renter-occupied |
| Utility Gas | 14 (2.5%) | 5 (1.7%) |
| Bottled, Tank, or LP Gas | 114 (20.4%) | 25 (8.5%) |
| Electricity | 388 (69.3%) | 263 (89.8%) |
| Fuel Oil or Kerosene | 10 (1.8%) | 0 (0.0%) |
| Coal or Coke | 0 (0.0%) | 0 (0.0%) |
| All other Fuels | 34 (6.1%) | 0 (0.0%) |
| No Fuel Used | 0 (0.0%) | 0 (0.0%) |
| Total | 560 (100.0%) | 293 (100.0%) |
Household Vehicle Usage in Coupeville
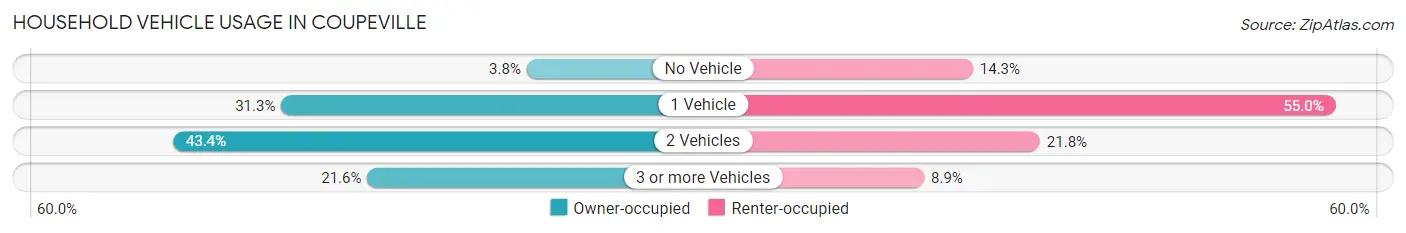
| Vehicles per Household | Owner-occupied | Renter-occupied |
| No Vehicle | 21 (3.7%) | 42 (14.3%) |
| 1 Vehicle | 175 (31.2%) | 161 (54.9%) |
| 2 Vehicles | 243 (43.4%) | 64 (21.8%) |
| 3 or more Vehicles | 121 (21.6%) | 26 (8.9%) |
| Total | 560 (100.0%) | 293 (100.0%) |
Real Estate & Mortgages in Coupeville
Real Estate and Mortgage Overview in Coupeville
| Characteristic | Without Mortgage | With Mortgage |
| Housing Units | 226 | 334 |
| Median Property Value | $364,400 | $486,000 |
| Median Household Income | $94,375 | $78 |
| Monthly Housing Costs | $725 | $60 |
| Real Estate Taxes | $3,354 | $20 |
Property Value by Mortgage Status in Coupeville
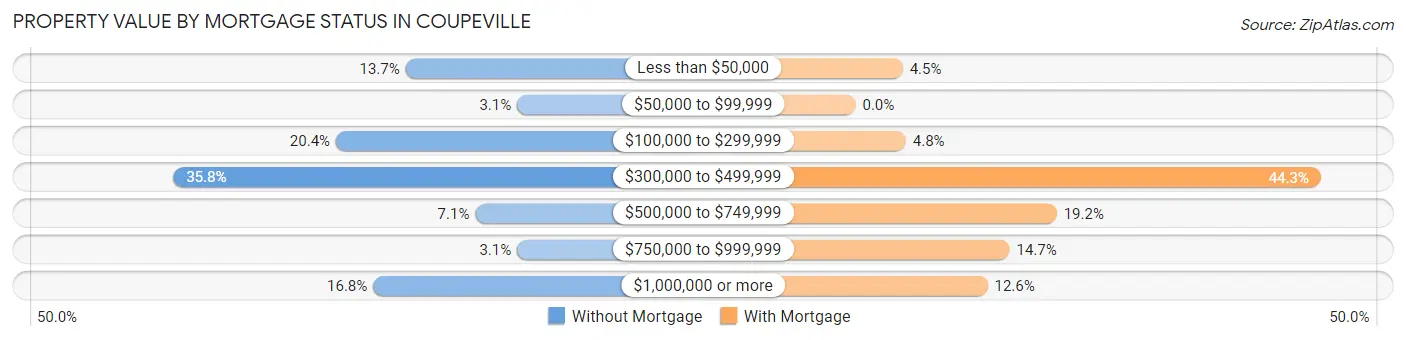
| Property Value | Without Mortgage | With Mortgage |
| Less than $50,000 | 31 (13.7%) | 15 (4.5%) |
| $50,000 to $99,999 | 7 (3.1%) | 0 (0.0%) |
| $100,000 to $299,999 | 46 (20.3%) | 16 (4.8%) |
| $300,000 to $499,999 | 81 (35.8%) | 148 (44.3%) |
| $500,000 to $749,999 | 16 (7.1%) | 64 (19.2%) |
| $750,000 to $999,999 | 7 (3.1%) | 49 (14.7%) |
| $1,000,000 or more | 38 (16.8%) | 42 (12.6%) |
| Total | 226 (100.0%) | 334 (100.0%) |
Household Income by Mortgage Status in Coupeville
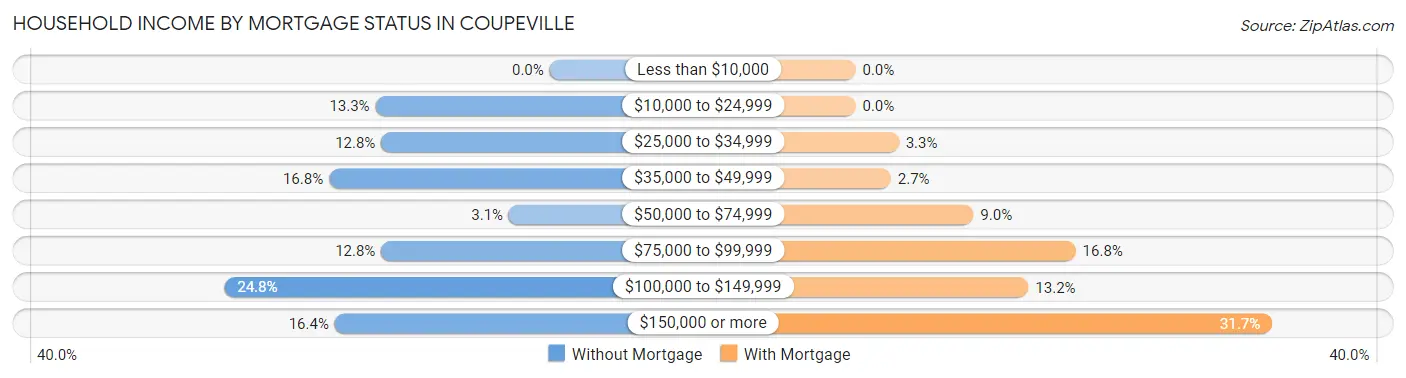
| Household Income | Without Mortgage | With Mortgage |
| Less than $10,000 | 0 (0.0%) | 0 (0.0%) |
| $10,000 to $24,999 | 30 (13.3%) | 0 (0.0%) |
| $25,000 to $34,999 | 29 (12.8%) | 11 (3.3%) |
| $35,000 to $49,999 | 38 (16.8%) | 9 (2.7%) |
| $50,000 to $74,999 | 7 (3.1%) | 30 (9.0%) |
| $75,000 to $99,999 | 29 (12.8%) | 56 (16.8%) |
| $100,000 to $149,999 | 56 (24.8%) | 44 (13.2%) |
| $150,000 or more | 37 (16.4%) | 106 (31.7%) |
| Total | 226 (100.0%) | 334 (100.0%) |
Property Value to Household Income Ratio in Coupeville
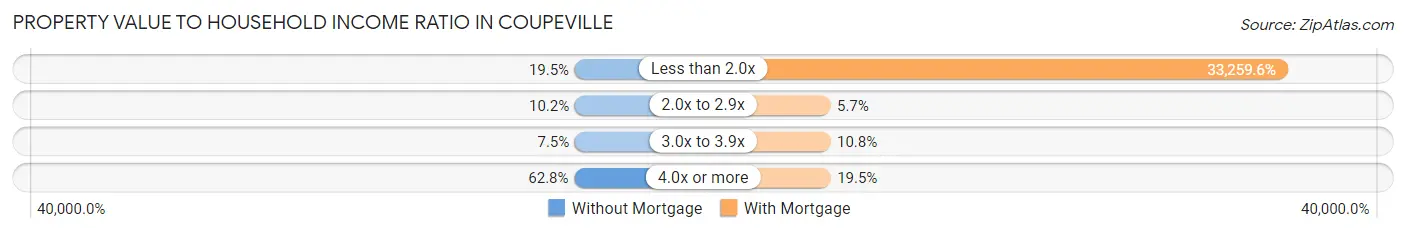
| Value-to-Income Ratio | Without Mortgage | With Mortgage |
| Less than 2.0x | 44 (19.5%) | 111,087 (33,259.6%) |
| 2.0x to 2.9x | 23 (10.2%) | 19 (5.7%) |
| 3.0x to 3.9x | 17 (7.5%) | 36 (10.8%) |
| 4.0x or more | 142 (62.8%) | 65 (19.5%) |
| Total | 226 (100.0%) | 334 (100.0%) |
Real Estate Taxes by Mortgage Status in Coupeville
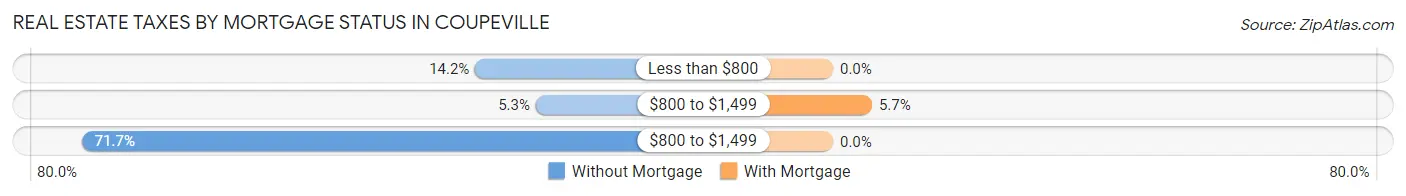
| Property Taxes | Without Mortgage | With Mortgage |
| Less than $800 | 32 (14.2%) | 0 (0.0%) |
| $800 to $1,499 | 12 (5.3%) | 19 (5.7%) |
| $800 to $1,499 | 162 (71.7%) | 0 (0.0%) |
| Total | 226 (100.0%) | 334 (100.0%) |
Health & Disability in Coupeville
Health Insurance Coverage by Age in Coupeville
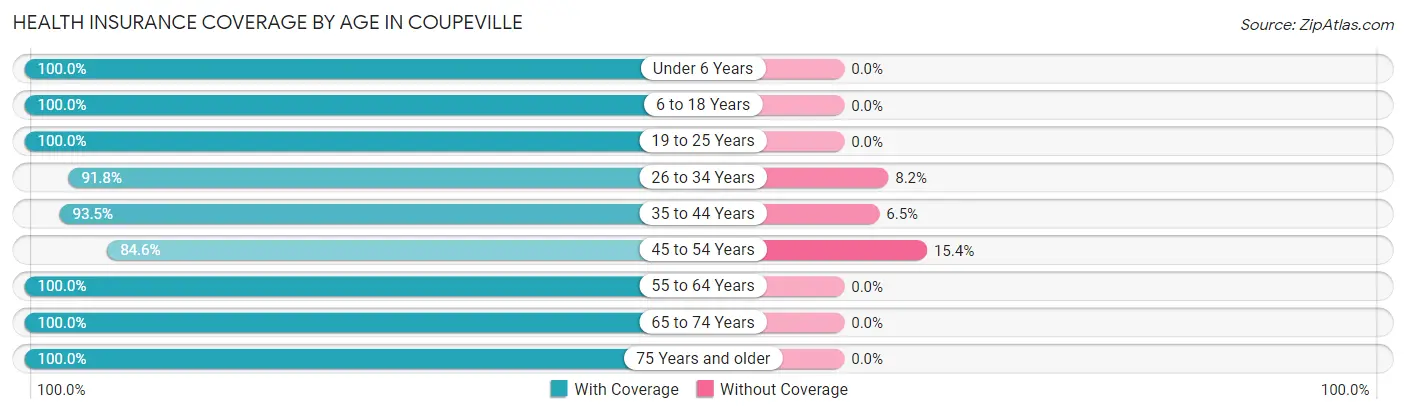
| Age Bracket | With Coverage | Without Coverage |
| Under 6 Years | 84 (100.0%) | 0 (0.0%) |
| 6 to 18 Years | 111 (100.0%) | 0 (0.0%) |
| 19 to 25 Years | 22 (100.0%) | 0 (0.0%) |
| 26 to 34 Years | 112 (91.8%) | 10 (8.2%) |
| 35 to 44 Years | 143 (93.5%) | 10 (6.5%) |
| 45 to 54 Years | 170 (84.6%) | 31 (15.4%) |
| 55 to 64 Years | 313 (100.0%) | 0 (0.0%) |
| 65 to 74 Years | 628 (100.0%) | 0 (0.0%) |
| 75 Years and older | 281 (100.0%) | 0 (0.0%) |
| Total | 1,864 (97.3%) | 51 (2.7%) |
Health Insurance Coverage by Citizenship Status in Coupeville
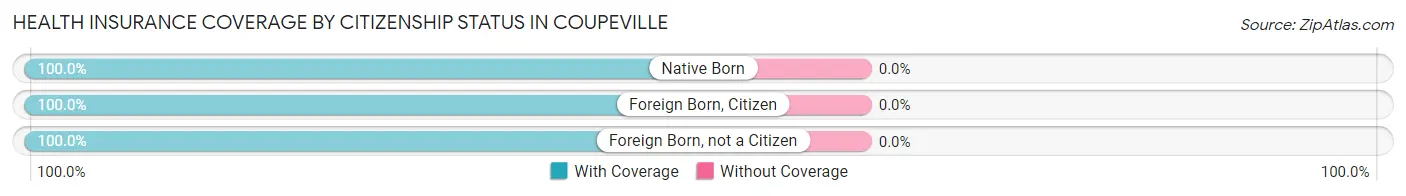
| Citizenship Status | With Coverage | Without Coverage |
| Native Born | 84 (100.0%) | 0 (0.0%) |
| Foreign Born, Citizen | 111 (100.0%) | 0 (0.0%) |
| Foreign Born, not a Citizen | 22 (100.0%) | 0 (0.0%) |
Health Insurance Coverage by Household Income in Coupeville
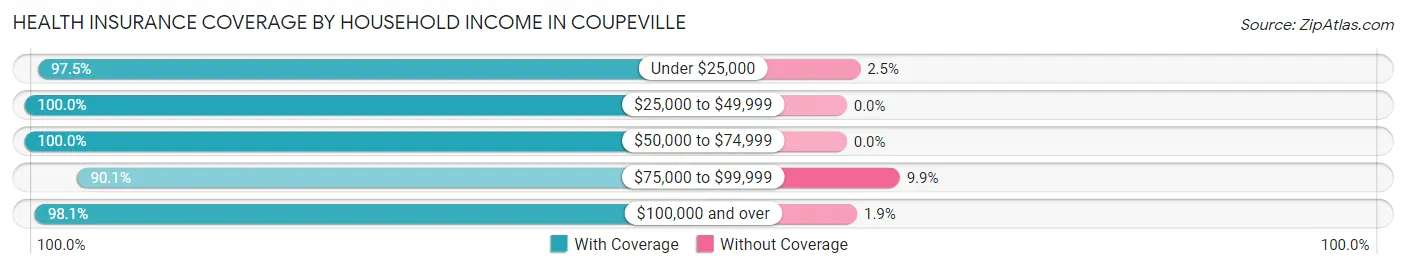
| Household Income | With Coverage | Without Coverage |
| Under $25,000 | 349 (97.5%) | 9 (2.5%) |
| $25,000 to $49,999 | 273 (100.0%) | 0 (0.0%) |
| $50,000 to $74,999 | 180 (100.0%) | 0 (0.0%) |
| $75,000 to $99,999 | 236 (90.1%) | 26 (9.9%) |
| $100,000 and over | 819 (98.1%) | 16 (1.9%) |
Public vs Private Health Insurance Coverage by Age in Coupeville
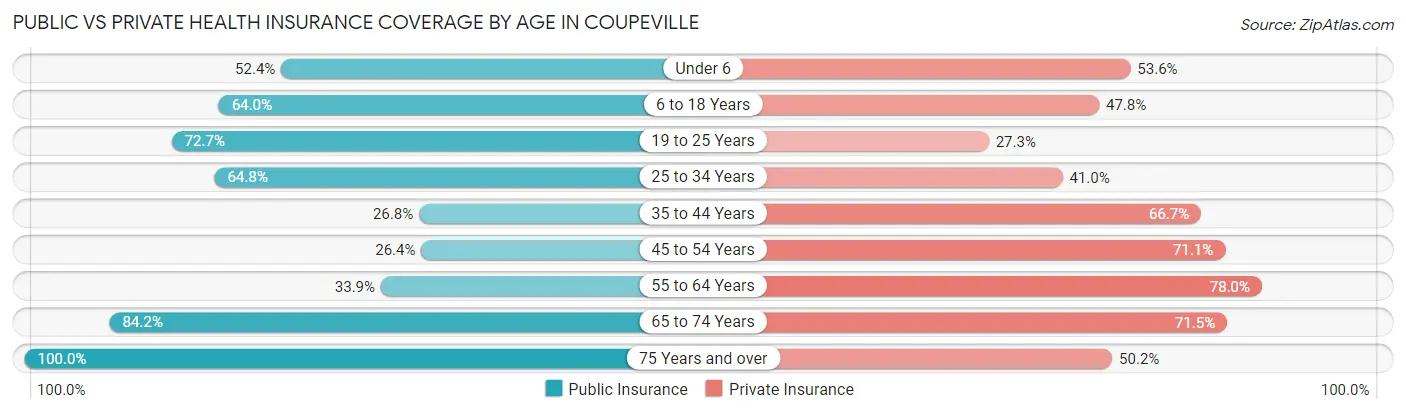
| Age Bracket | Public Insurance | Private Insurance |
| Under 6 | 44 (52.4%) | 45 (53.6%) |
| 6 to 18 Years | 71 (64.0%) | 53 (47.7%) |
| 19 to 25 Years | 16 (72.7%) | 6 (27.3%) |
| 25 to 34 Years | 79 (64.7%) | 50 (41.0%) |
| 35 to 44 Years | 41 (26.8%) | 102 (66.7%) |
| 45 to 54 Years | 53 (26.4%) | 143 (71.1%) |
| 55 to 64 Years | 106 (33.9%) | 244 (78.0%) |
| 65 to 74 Years | 529 (84.2%) | 449 (71.5%) |
| 75 Years and over | 281 (100.0%) | 141 (50.2%) |
| Total | 1,220 (63.7%) | 1,233 (64.4%) |
Disability Status by Sex by Age in Coupeville
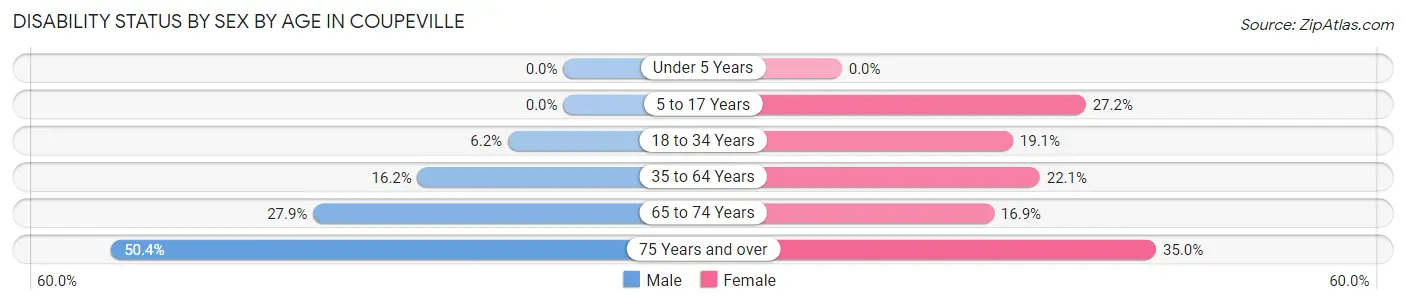
| Age Bracket | Male | Female |
| Under 5 Years | 0 (0.0%) | 0 (0.0%) |
| 5 to 17 Years | 0 (0.0%) | 25 (27.2%) |
| 18 to 34 Years | 5 (6.2%) | 12 (19.1%) |
| 35 to 64 Years | 56 (16.2%) | 71 (22.1%) |
| 65 to 74 Years | 73 (27.9%) | 62 (16.9%) |
| 75 Years and over | 71 (50.3%) | 49 (35.0%) |
Disability Class by Sex by Age in Coupeville
Disability Class: Hearing Difficulty
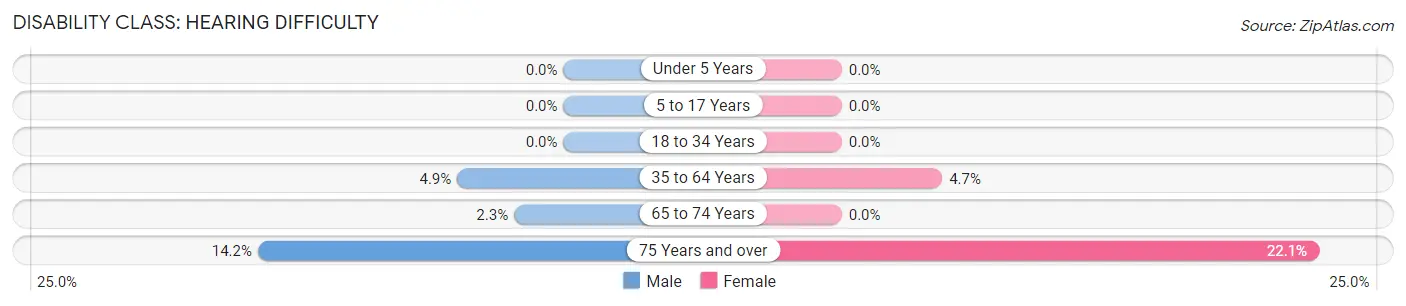
| Age Bracket | Male | Female |
| Under 5 Years | 0 (0.0%) | 0 (0.0%) |
| 5 to 17 Years | 0 (0.0%) | 0 (0.0%) |
| 18 to 34 Years | 0 (0.0%) | 0 (0.0%) |
| 35 to 64 Years | 17 (4.9%) | 15 (4.7%) |
| 65 to 74 Years | 6 (2.3%) | 0 (0.0%) |
| 75 Years and over | 20 (14.2%) | 31 (22.1%) |
Disability Class: Vision Difficulty
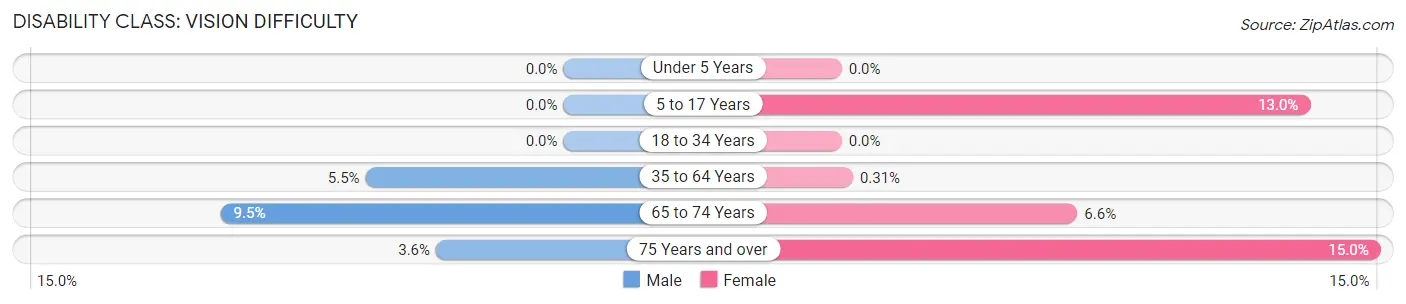
| Age Bracket | Male | Female |
| Under 5 Years | 0 (0.0%) | 0 (0.0%) |
| 5 to 17 Years | 0 (0.0%) | 12 (13.0%) |
| 18 to 34 Years | 0 (0.0%) | 0 (0.0%) |
| 35 to 64 Years | 19 (5.5%) | 1 (0.3%) |
| 65 to 74 Years | 25 (9.5%) | 24 (6.6%) |
| 75 Years and over | 5 (3.5%) | 21 (15.0%) |
Disability Class: Cognitive Difficulty
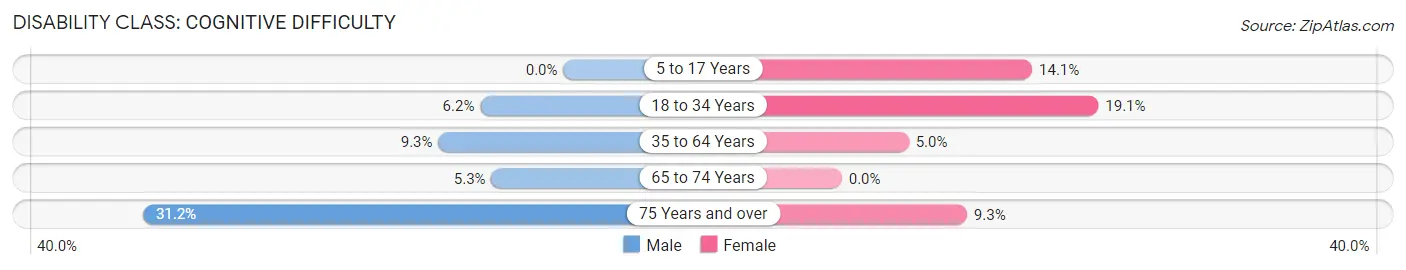
| Age Bracket | Male | Female |
| 5 to 17 Years | 0 (0.0%) | 13 (14.1%) |
| 18 to 34 Years | 5 (6.2%) | 12 (19.1%) |
| 35 to 64 Years | 32 (9.3%) | 16 (5.0%) |
| 65 to 74 Years | 14 (5.3%) | 0 (0.0%) |
| 75 Years and over | 44 (31.2%) | 13 (9.3%) |
Disability Class: Ambulatory Difficulty
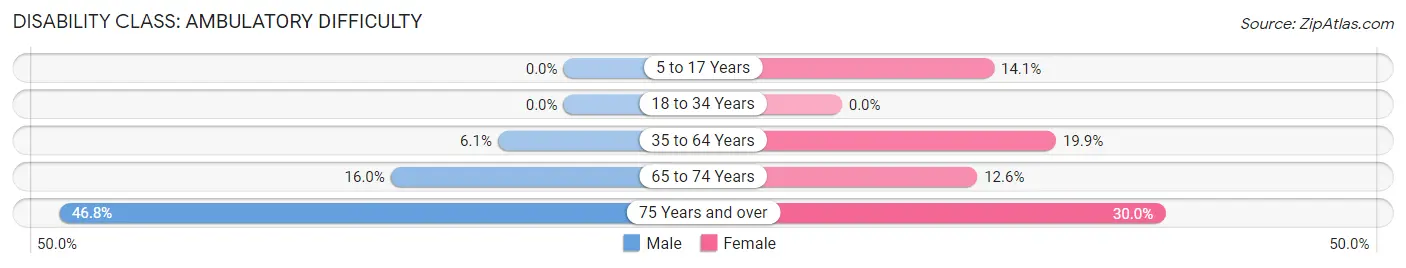
| Age Bracket | Male | Female |
| 5 to 17 Years | 0 (0.0%) | 13 (14.1%) |
| 18 to 34 Years | 0 (0.0%) | 0 (0.0%) |
| 35 to 64 Years | 21 (6.1%) | 64 (19.9%) |
| 65 to 74 Years | 42 (16.0%) | 46 (12.6%) |
| 75 Years and over | 66 (46.8%) | 42 (30.0%) |
Disability Class: Self-Care Difficulty
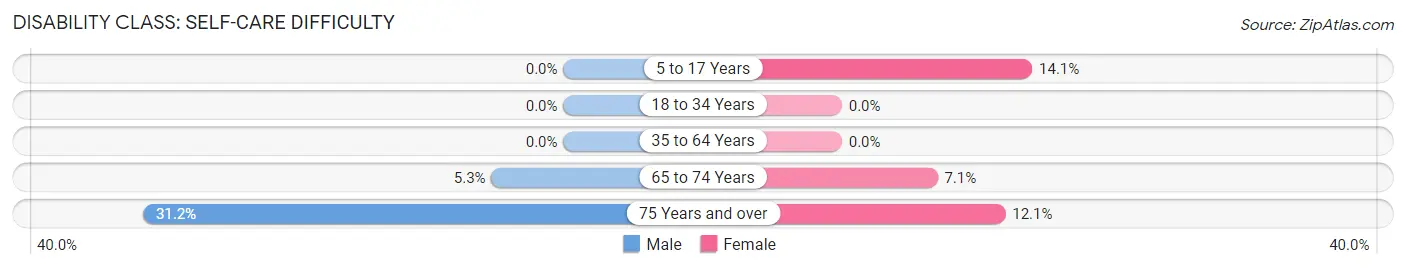
| Age Bracket | Male | Female |
| 5 to 17 Years | 0 (0.0%) | 13 (14.1%) |
| 18 to 34 Years | 0 (0.0%) | 0 (0.0%) |
| 35 to 64 Years | 0 (0.0%) | 0 (0.0%) |
| 65 to 74 Years | 14 (5.3%) | 26 (7.1%) |
| 75 Years and over | 44 (31.2%) | 17 (12.1%) |
Technology Access in Coupeville
Computing Device Access in Coupeville
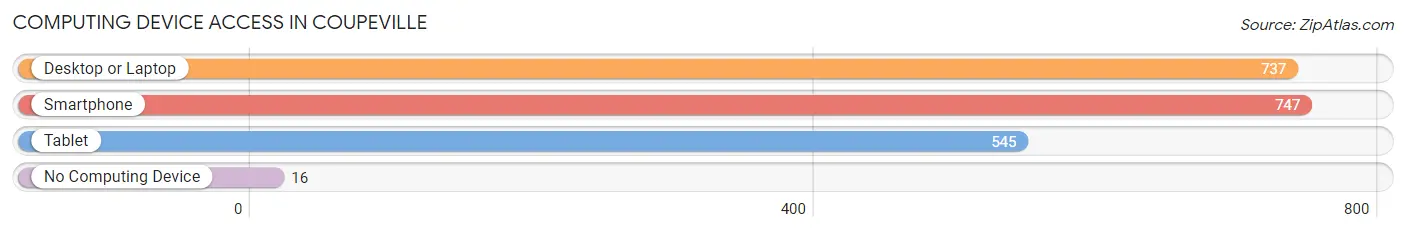
| Device Type | # Households | % Households |
| Desktop or Laptop | 737 | 86.4% |
| Smartphone | 747 | 87.6% |
| Tablet | 545 | 63.9% |
| No Computing Device | 16 | 1.9% |
| Total | 853 | 100.0% |
Internet Access in Coupeville
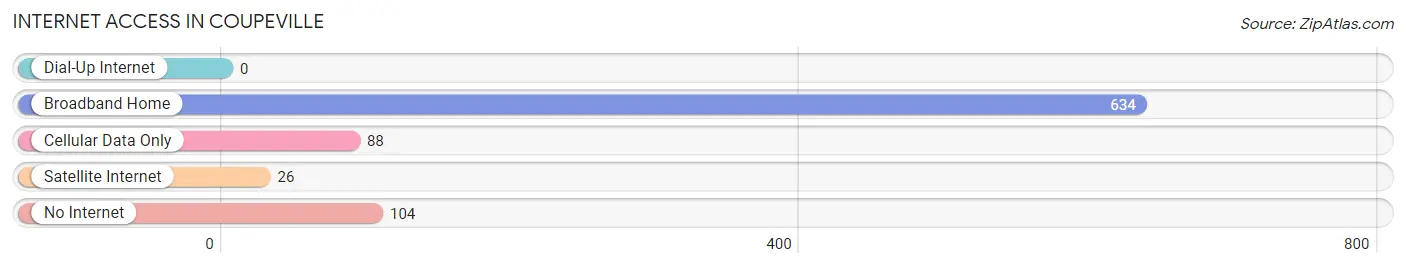
| Internet Type | # Households | % Households |
| Dial-Up Internet | 0 | 0.0% |
| Broadband Home | 634 | 74.3% |
| Cellular Data Only | 88 | 10.3% |
| Satellite Internet | 26 | 3.0% |
| No Internet | 104 | 12.2% |
| Total | 853 | 100.0% |
Coupeville Summary
Coupeville is a town located on Whidbey Island in Island County, Washington. It is the county seat of Island County and is the oldest town in the county. The town is located on the north end of the island, about 30 miles north of Seattle. The population of Coupeville was 1,813 at the 2010 census.
History
The area around Coupeville was first inhabited by the Snohomish people, who lived in the area for thousands of years before the arrival of European settlers. The first European settlers arrived in the area in the late 1850s, and the town of Coupeville was officially founded in 1858. The town was named after Captain Thomas Coupe, who was the first settler in the area.
The town quickly grew and became a major port for the region, with ships coming from all over the world to trade goods. The town was also a major center for the logging industry, with logs being shipped to Seattle and other cities.
In the late 19th century, Coupeville became a popular tourist destination, with visitors coming to enjoy the scenery and the mild climate. The town was also home to a number of artists, writers, and musicians, who were drawn to the area by its beauty and tranquility.
Geography
Coupeville is located on the north end of Whidbey Island, about 30 miles north of Seattle. The town is situated on a peninsula, with Penn Cove to the east and Admiralty Inlet to the west. The town is surrounded by the waters of Penn Cove, Admiralty Inlet, and Saratoga Passage.
The town is located in a temperate rainforest climate, with mild temperatures year-round and abundant rainfall. The average annual precipitation is around 40 inches, with most of the rain falling between October and April.
Economy
The economy of Coupeville is largely based on tourism and the service industry. The town is a popular destination for visitors from all over the world, who come to enjoy the scenery and the mild climate. The town is also home to a number of artists, writers, and musicians, who are drawn to the area by its beauty and tranquility.
The town is also home to a number of businesses, including restaurants, shops, and galleries. The town is also home to a number of marinas, which provide services to boaters from all over the world.
Demographics
As of the 2010 census, the population of Coupeville was 1,813. The racial makeup of the town was 90.2% White, 0.7% African American, 0.7% Native American, 2.2% Asian, 0.2% Pacific Islander, 2.2% from other races, and 3.8% from two or more races. Hispanic or Latino of any race were 5.2% of the population.
The median income for a household in Coupeville was $50,938, and the median income for a family was $60,938. The per capita income for the town was $27,938. About 8.2% of families and 11.2% of the population were below the poverty line, including 16.2% of those under age 18 and 5.2% of those age 65 or over.
Common Questions
What is Per Capita Income in Coupeville?
Per Capita income in Coupeville is $38,755.
What is the Median Family Income in Coupeville?
Median Family Income in Coupeville is $81,429.
What is the Median Household income in Coupeville?
Median Household Income in Coupeville is $78,438.
What is Income or Wage Gap in Coupeville?
Income or Wage Gap in Coupeville is 38.7%.
Women in Coupeville earn 61.3 cents for every dollar earned by a man.
What is Inequality or Gini Index in Coupeville?
Inequality or Gini Index in Coupeville is 0.40.
What is the Total Population of Coupeville?
Total Population of Coupeville is 2,040.
What is the Total Male Population of Coupeville?
Total Male Population of Coupeville is 949.
What is the Total Female Population of Coupeville?
Total Female Population of Coupeville is 1,091.
What is the Ratio of Males per 100 Females in Coupeville?
There are 86.98 Males per 100 Females in Coupeville.
What is the Ratio of Females per 100 Males in Coupeville?
There are 114.96 Females per 100 Males in Coupeville.
What is the Median Population Age in Coupeville?
Median Population Age in Coupeville is 64.2 Years.
What is the Average Family Size in Coupeville
Average Family Size in Coupeville is 2.6 People.
What is the Average Household Size in Coupeville
Average Household Size in Coupeville is 2.2 People.
How Large is the Labor Force in Coupeville?
There are 749 People in the Labor Forcein in Coupeville.
What is the Percentage of People in the Labor Force in Coupeville?
40.1% of People are in the Labor Force in Coupeville.
What is the Unemployment Rate in Coupeville?
Unemployment Rate in Coupeville is 1.2%.