Belfair, WA Map & Demographics
Belfair Map
Belfair Overview
$34,755
PER CAPITA INCOME
$69,875
AVG FAMILY INCOME
$68,080
AVG HOUSEHOLD INCOME
34.1%
WAGE / INCOME GAP [ % ]
65.9¢/ $1
WAGE / INCOME GAP [ $ ]
0.44
INEQUALITY / GINI INDEX
4,175
TOTAL POPULATION
2,290
MALE POPULATION
1,885
FEMALE POPULATION
121.49
MALES / 100 FEMALES
82.31
FEMALES / 100 MALES
33.4
MEDIAN AGE
3.1
AVG FAMILY SIZE
2.4
AVG HOUSEHOLD SIZE
1,994
LABOR FORCE [ PEOPLE ]
59.3%
PERCENT IN LABOR FORCE
4.9%
UNEMPLOYMENT RATE
Belfair Zip Codes
Belfair Area Codes
Income in Belfair
Income Overview in Belfair
Per Capita Income in Belfair is $34,755, while median incomes of families and households are $69,875 and $68,080 respectively.
| Characteristic | Number | Measure |
| Per Capita Income | 4,175 | $34,755 |
| Median Family Income | 988 | $69,875 |
| Mean Family Income | 988 | $97,530 |
| Median Household Income | 1,771 | $68,080 |
| Mean Household Income | 1,771 | $82,135 |
| Income Deficit | 988 | $0 |
| Wage / Income Gap (%) | 4,175 | 34.10% |
| Wage / Income Gap ($) | 4,175 | 65.90¢ per $1 |
| Gini / Inequality Index | 4,175 | 0.44 |
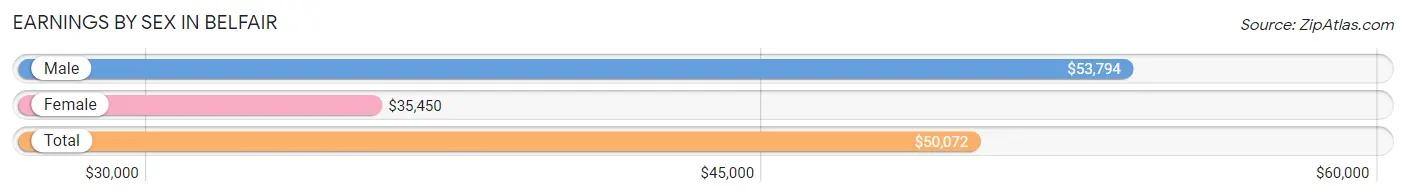
Earnings by Sex in Belfair
Average Earnings in Belfair are $50,072, $53,794 for men and $35,450 for women, a difference of 34.1%.
| Sex | Number | Average Earnings |
| Male | 1,353 (64.7%) | $53,794 |
| Female | 739 (35.3%) | $35,450 |
| Total | 2,092 (100.0%) | $50,072 |
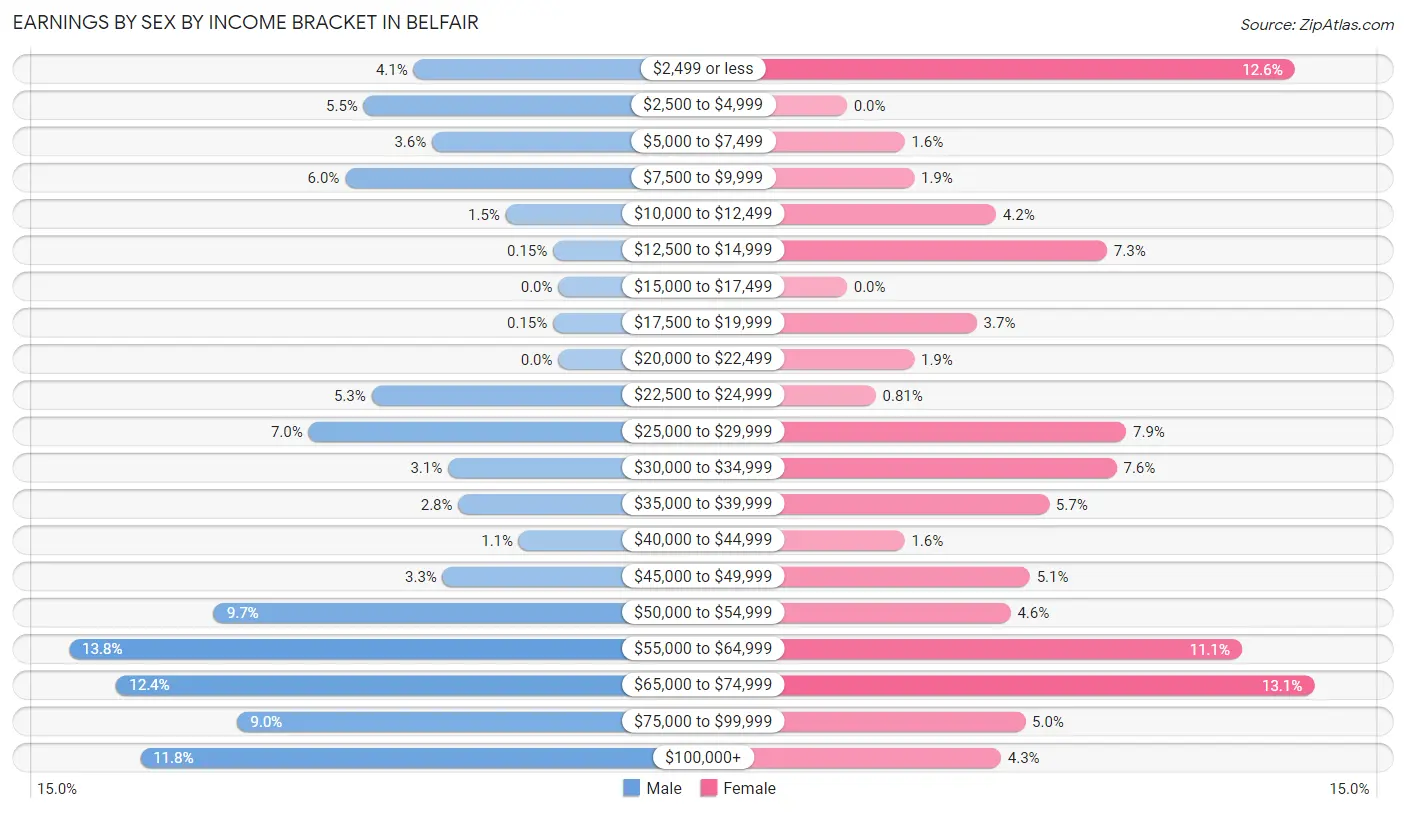
Earnings by Sex by Income Bracket in Belfair
The most common earnings brackets in Belfair are $55,000 to $64,999 for men (186 | 13.8%) and $65,000 to $74,999 for women (97 | 13.1%).
| Income | Male | Female |
| $2,499 or less | 55 (4.1%) | 93 (12.6%) |
| $2,500 to $4,999 | 74 (5.5%) | 0 (0.0%) |
| $5,000 to $7,499 | 48 (3.5%) | 12 (1.6%) |
| $7,500 to $9,999 | 81 (6.0%) | 14 (1.9%) |
| $10,000 to $12,499 | 20 (1.5%) | 31 (4.2%) |
| $12,500 to $14,999 | 2 (0.2%) | 54 (7.3%) |
| $15,000 to $17,499 | 0 (0.0%) | 0 (0.0%) |
| $17,500 to $19,999 | 2 (0.2%) | 27 (3.6%) |
| $20,000 to $22,499 | 0 (0.0%) | 14 (1.9%) |
| $22,500 to $24,999 | 71 (5.2%) | 6 (0.8%) |
| $25,000 to $29,999 | 95 (7.0%) | 58 (7.9%) |
| $30,000 to $34,999 | 42 (3.1%) | 56 (7.6%) |
| $35,000 to $39,999 | 38 (2.8%) | 42 (5.7%) |
| $40,000 to $44,999 | 15 (1.1%) | 12 (1.6%) |
| $45,000 to $49,999 | 44 (3.3%) | 38 (5.1%) |
| $50,000 to $54,999 | 131 (9.7%) | 34 (4.6%) |
| $55,000 to $64,999 | 186 (13.8%) | 82 (11.1%) |
| $65,000 to $74,999 | 168 (12.4%) | 97 (13.1%) |
| $75,000 to $99,999 | 122 (9.0%) | 37 (5.0%) |
| $100,000+ | 159 (11.7%) | 32 (4.3%) |
| Total | 1,353 (100.0%) | 739 (100.0%) |
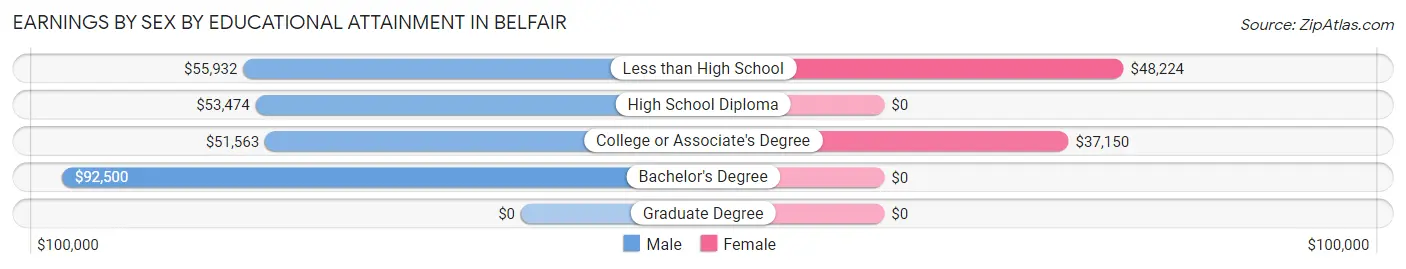
Earnings by Sex by Educational Attainment in Belfair
Average earnings in Belfair are $55,500 for men and $39,779 for women, a difference of 28.3%. Men with an educational attainment of bachelor's degree enjoy the highest average annual earnings of $92,500, while those with college or associate's degree education earn the least with $51,563. Women with an educational attainment of less than high school earn the most with the average annual earnings of $48,224, while those with college or associate's degree education have the smallest earnings of $37,150.
| Educational Attainment | Male Income | Female Income |
| Less than High School | $55,932 | $48,224 |
| High School Diploma | $53,474 | $0 |
| College or Associate's Degree | $51,563 | $37,150 |
| Bachelor's Degree | $92,500 | $0 |
| Graduate Degree | - | - |
| Total | $55,500 | $39,779 |
Family Income in Belfair
Family Income Brackets in Belfair
According to the Belfair family income data, there are 431 families falling into the $50,000 to $74,999 income range, which is the most common income bracket and makes up 43.6% of all families.
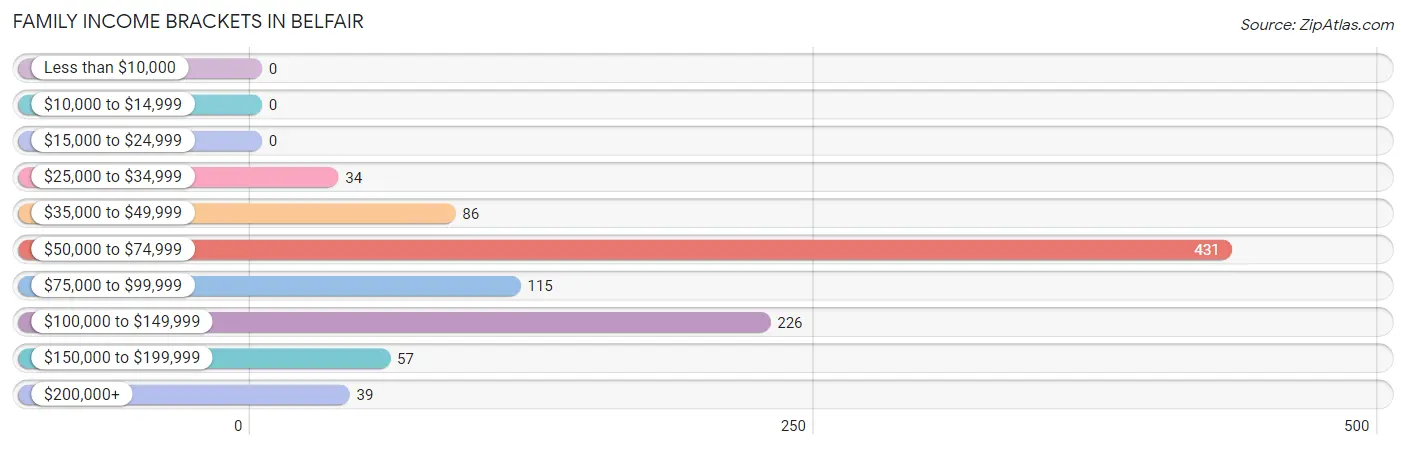
| Income Bracket | # Families | % Families |
| Less than $10,000 | 0 | 0.0% |
| $10,000 to $14,999 | 0 | 0.0% |
| $15,000 to $24,999 | 0 | 0.0% |
| $25,000 to $34,999 | 34 | 3.4% |
| $35,000 to $49,999 | 86 | 8.7% |
| $50,000 to $74,999 | 431 | 43.6% |
| $75,000 to $99,999 | 115 | 11.6% |
| $100,000 to $149,999 | 226 | 22.9% |
| $150,000 to $199,999 | 57 | 5.8% |
| $200,000+ | 39 | 3.9% |
Family Income by Famaliy Size in Belfair
4-person families (257 | 26.0%) account for the highest median family income in Belfair with $140,156 per family, while 4-person families (257 | 26.0%) have the highest median income of $35,039 per family member.
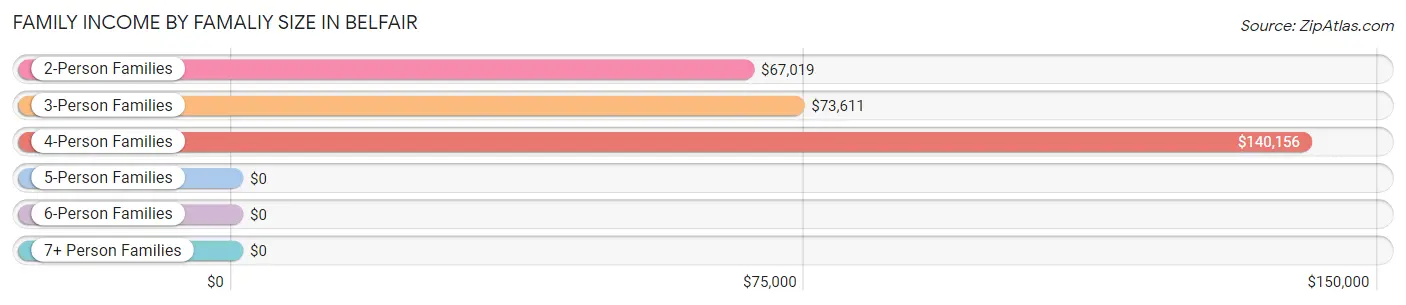
| Income Bracket | # Families | Median Income |
| 2-Person Families | 483 (48.9%) | $67,019 |
| 3-Person Families | 182 (18.4%) | $73,611 |
| 4-Person Families | 257 (26.0%) | $140,156 |
| 5-Person Families | 19 (1.9%) | $0 |
| 6-Person Families | 22 (2.2%) | $0 |
| 7+ Person Families | 25 (2.5%) | $0 |
| Total | 988 (100.0%) | $69,875 |
Family Income by Number of Earners in Belfair
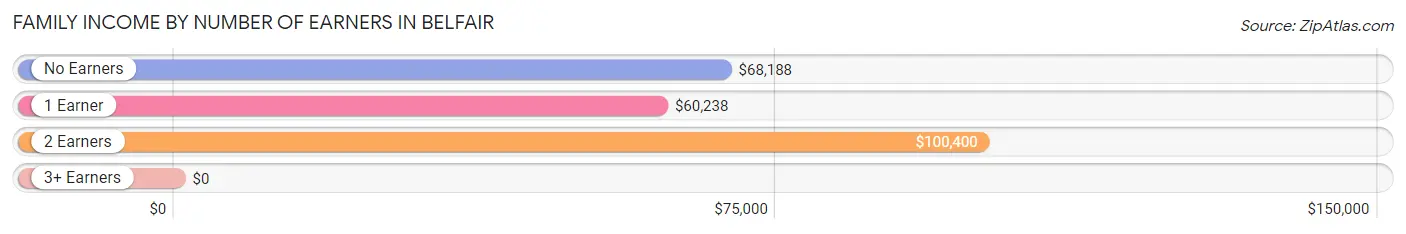
| Number of Earners | # Families | Median Income |
| No Earners | 216 (21.9%) | $68,188 |
| 1 Earner | 378 (38.3%) | $60,238 |
| 2 Earners | 282 (28.5%) | $100,400 |
| 3+ Earners | 112 (11.3%) | $0 |
| Total | 988 (100.0%) | $69,875 |
Household Income in Belfair
Household Income Brackets in Belfair
With 471 households falling in the category, the $50,000 to $74,999 income range is the most frequent in Belfair, accounting for 26.6% of all households. In contrast, only 57 households (3.2%) fall into the $200,000+ income bracket, making it the least populous group.
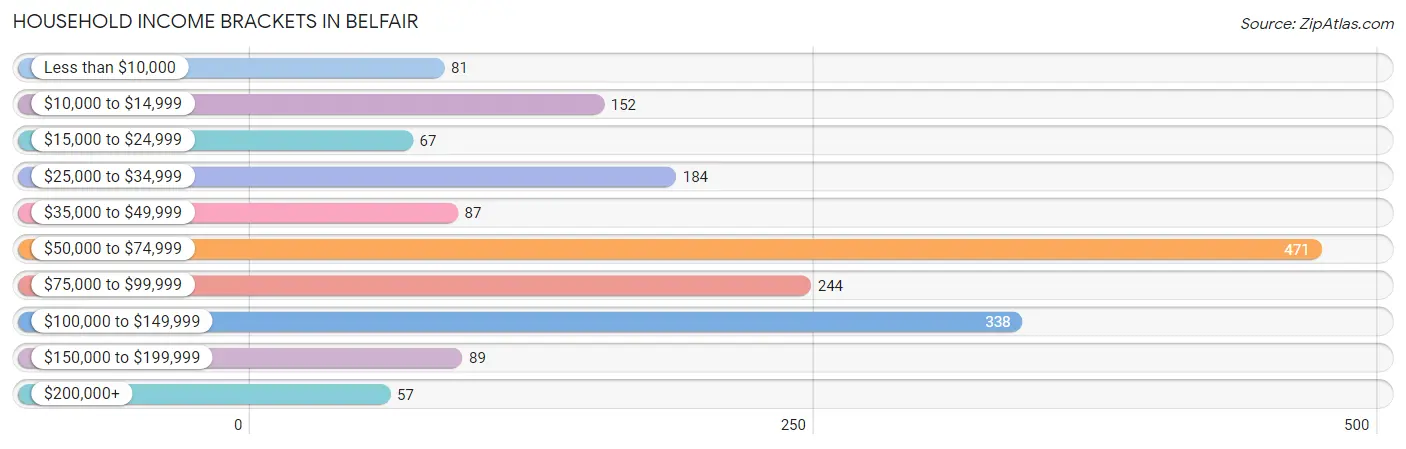
| Income Bracket | # Households | % Households |
| Less than $10,000 | 81 | 4.6% |
| $10,000 to $14,999 | 152 | 8.6% |
| $15,000 to $24,999 | 67 | 3.8% |
| $25,000 to $34,999 | 184 | 10.4% |
| $35,000 to $49,999 | 87 | 4.9% |
| $50,000 to $74,999 | 471 | 26.6% |
| $75,000 to $99,999 | 244 | 13.8% |
| $100,000 to $149,999 | 338 | 19.1% |
| $150,000 to $199,999 | 89 | 5.0% |
| $200,000+ | 57 | 3.2% |
Household Income by Householder Age in Belfair
The median household income in Belfair is $68,080, with the highest median household income of $93,571 found in the 25 to 44 years age bracket for the primary householder. A total of 562 households (31.7%) fall into this category. Meanwhile, the 15 to 24 years age bracket for the primary householder has the lowest median household income of $0, with 40 households (2.3%) in this group.
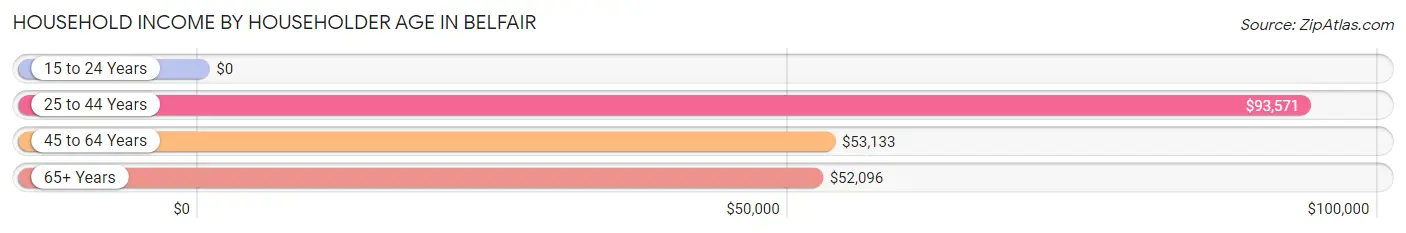
| Income Bracket | # Households | Median Income |
| 15 to 24 Years | 40 (2.3%) | $0 |
| 25 to 44 Years | 562 (31.7%) | $93,571 |
| 45 to 64 Years | 706 (39.9%) | $53,133 |
| 65+ Years | 463 (26.1%) | $52,096 |
| Total | 1,771 (100.0%) | $68,080 |
Poverty in Belfair
Income Below Poverty by Sex and Age in Belfair
With 8.2% poverty level for males and 9.4% for females among the residents of Belfair, 55 to 64 year old males and 75 year old and over females are the most vulnerable to poverty, with 86 males (27.7%) and 20 females (39.2%) in their respective age groups living below the poverty level.
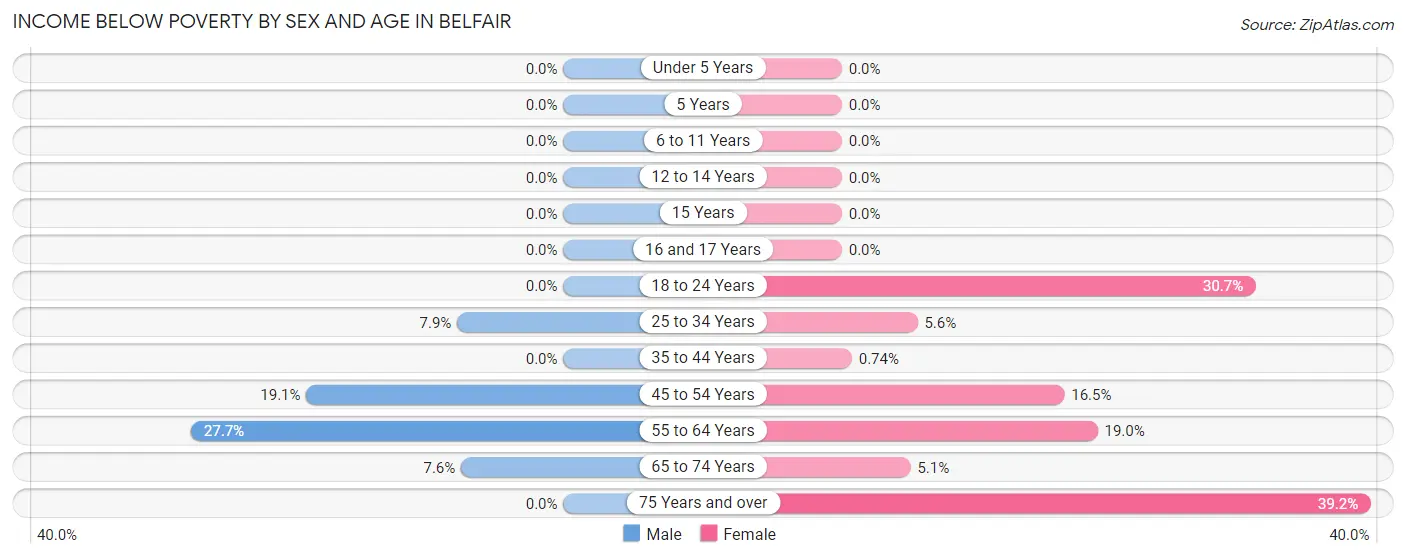
| Age Bracket | Male | Female |
| Under 5 Years | 0 (0.0%) | 0 (0.0%) |
| 5 Years | 0 (0.0%) | 0 (0.0%) |
| 6 to 11 Years | 0 (0.0%) | 0 (0.0%) |
| 12 to 14 Years | 0 (0.0%) | 0 (0.0%) |
| 15 Years | 0 (0.0%) | 0 (0.0%) |
| 16 and 17 Years | 0 (0.0%) | 0 (0.0%) |
| 18 to 24 Years | 0 (0.0%) | 27 (30.7%) |
| 25 to 34 Years | 45 (7.9%) | 19 (5.6%) |
| 35 to 44 Years | 0 (0.0%) | 1 (0.7%) |
| 45 to 54 Years | 33 (19.1%) | 37 (16.5%) |
| 55 to 64 Years | 86 (27.7%) | 64 (19.0%) |
| 65 to 74 Years | 24 (7.6%) | 10 (5.1%) |
| 75 Years and over | 0 (0.0%) | 20 (39.2%) |
| Total | 188 (8.2%) | 178 (9.4%) |
Income Above Poverty by Sex and Age in Belfair
According to the poverty statistics in Belfair, males aged under 5 years and females aged under 5 years are the age groups that are most secure financially, with 100.0% of males and 100.0% of females in these age groups living above the poverty line.
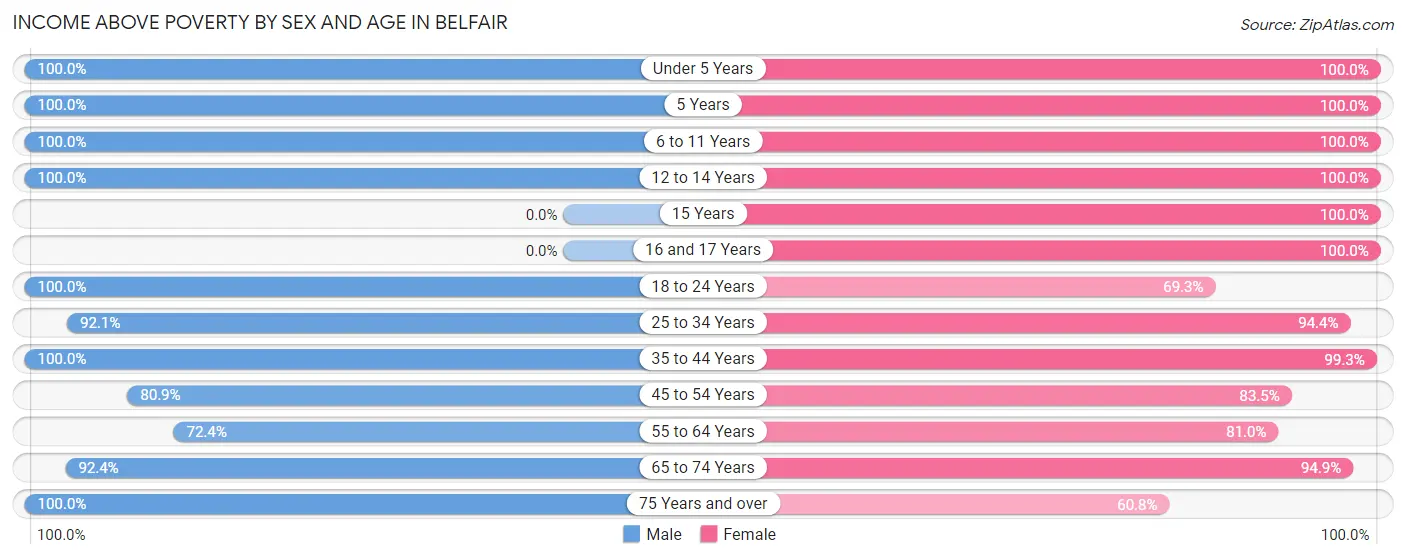
| Age Bracket | Male | Female |
| Under 5 Years | 150 (100.0%) | 112 (100.0%) |
| 5 Years | 68 (100.0%) | 22 (100.0%) |
| 6 to 11 Years | 104 (100.0%) | 214 (100.0%) |
| 12 to 14 Years | 65 (100.0%) | 42 (100.0%) |
| 15 Years | 0 (0.0%) | 36 (100.0%) |
| 16 and 17 Years | 0 (0.0%) | 90 (100.0%) |
| 18 to 24 Years | 262 (100.0%) | 61 (69.3%) |
| 25 to 34 Years | 526 (92.1%) | 319 (94.4%) |
| 35 to 44 Years | 244 (100.0%) | 134 (99.3%) |
| 45 to 54 Years | 140 (80.9%) | 187 (83.5%) |
| 55 to 64 Years | 225 (72.4%) | 273 (81.0%) |
| 65 to 74 Years | 292 (92.4%) | 186 (94.9%) |
| 75 Years and over | 26 (100.0%) | 31 (60.8%) |
| Total | 2,102 (91.8%) | 1,707 (90.6%) |
Income Below Poverty Among Married-Couple Families in Belfair
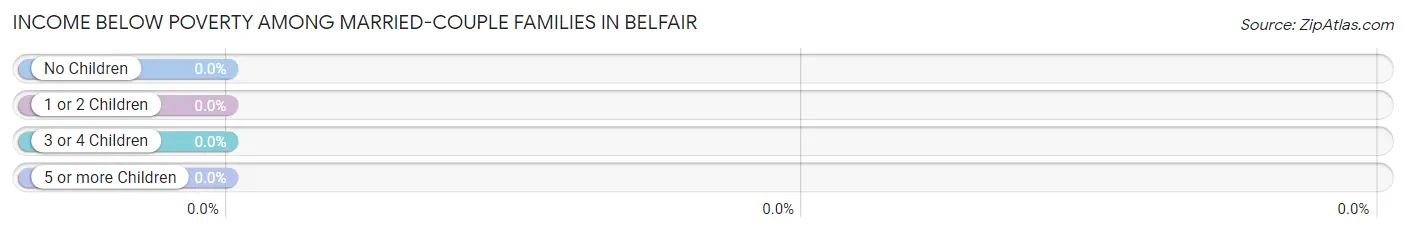
| Children | Above Poverty | Below Poverty |
| No Children | 425 (100.0%) | 0 (0.0%) |
| 1 or 2 Children | 264 (100.0%) | 0 (0.0%) |
| 3 or 4 Children | 19 (100.0%) | 0 (0.0%) |
| 5 or more Children | 25 (100.0%) | 0 (0.0%) |
| Total | 733 (100.0%) | 0 (0.0%) |
Income Below Poverty Among Single-Parent Households in Belfair
| Children | Single Father | Single Mother |
| No Children | 0 (0.0%) | 0 (0.0%) |
| 1 or 2 Children | 0 (0.0%) | 0 (0.0%) |
| 3 or 4 Children | 0 (0.0%) | 0 (0.0%) |
| 5 or more Children | 0 (0.0%) | 0 (0.0%) |
| Total | 0 (0.0%) | 0 (0.0%) |
Income Below Poverty Among Married-Couple vs Single-Parent Households in Belfair
| Children | Married-Couple Families | Single-Parent Households |
| No Children | 0 (0.0%) | 0 (0.0%) |
| 1 or 2 Children | 0 (0.0%) | 0 (0.0%) |
| 3 or 4 Children | 0 (0.0%) | 0 (0.0%) |
| 5 or more Children | 0 (0.0%) | 0 (0.0%) |
| Total | 0 (0.0%) | 0 (0.0%) |
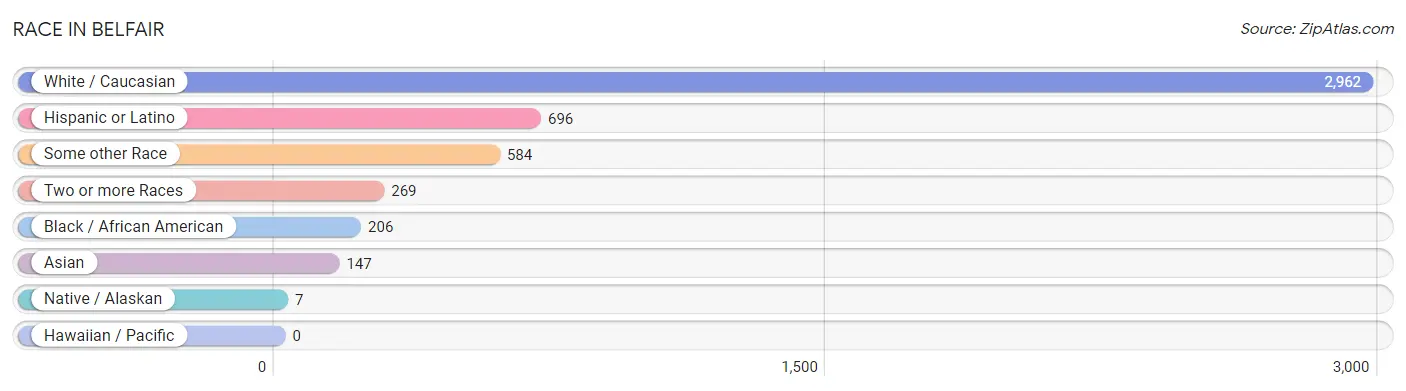
Race in Belfair
The most populous races in Belfair are White / Caucasian (2,962 | 71.0%), Hispanic or Latino (696 | 16.7%), and Some other Race (584 | 14.0%).
| Race | # Population | % Population |
| Asian | 147 | 3.5% |
| Black / African American | 206 | 4.9% |
| Hawaiian / Pacific | 0 | 0.0% |
| Hispanic or Latino | 696 | 16.7% |
| Native / Alaskan | 7 | 0.2% |
| White / Caucasian | 2,962 | 71.0% |
| Two or more Races | 269 | 6.4% |
| Some other Race | 584 | 14.0% |
| Total | 4,175 | 100.0% |
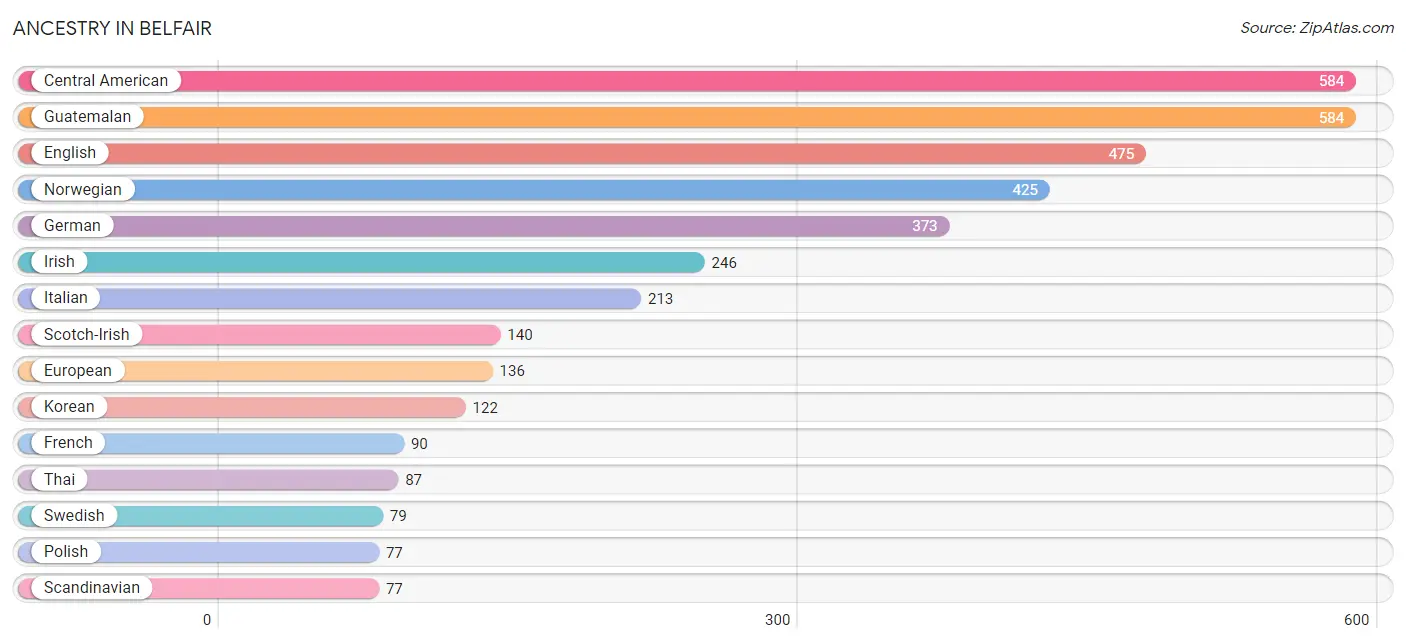
Ancestry in Belfair
The most populous ancestries reported in Belfair are Central American (584 | 14.0%), Guatemalan (584 | 14.0%), English (475 | 11.4%), Norwegian (425 | 10.2%), and German (373 | 8.9%), together accounting for 58.5% of all Belfair residents.
| Ancestry | # Population | % Population |
| American | 57 | 1.4% |
| Bhutanese | 10 | 0.2% |
| British | 25 | 0.6% |
| Central American | 584 | 14.0% |
| Czech | 22 | 0.5% |
| Danish | 14 | 0.3% |
| Dutch | 13 | 0.3% |
| Eastern European | 22 | 0.5% |
| English | 475 | 11.4% |
| European | 136 | 3.3% |
| Finnish | 39 | 0.9% |
| French | 90 | 2.2% |
| French Canadian | 15 | 0.4% |
| German | 373 | 8.9% |
| Guamanian / Chamorro | 10 | 0.2% |
| Guatemalan | 584 | 14.0% |
| Iranian | 38 | 0.9% |
| Irish | 246 | 5.9% |
| Iroquois | 56 | 1.3% |
| Italian | 213 | 5.1% |
| Korean | 122 | 2.9% |
| Mexican | 63 | 1.5% |
| Mexican American Indian | 57 | 1.4% |
| Native Hawaiian | 56 | 1.3% |
| Navajo | 32 | 0.8% |
| Norwegian | 425 | 10.2% |
| Pakistani | 26 | 0.6% |
| Polish | 77 | 1.8% |
| Portuguese | 21 | 0.5% |
| Puerto Rican | 28 | 0.7% |
| Romanian | 12 | 0.3% |
| Russian | 1 | 0.0% |
| Samoan | 35 | 0.8% |
| Scandinavian | 77 | 1.8% |
| Scotch-Irish | 140 | 3.4% |
| Scottish | 68 | 1.6% |
| Spaniard | 21 | 0.5% |
| Sri Lankan | 3 | 0.1% |
| Swedish | 79 | 1.9% |
| Thai | 87 | 2.1% |
| Welsh | 69 | 1.7% | View All 41 Rows |
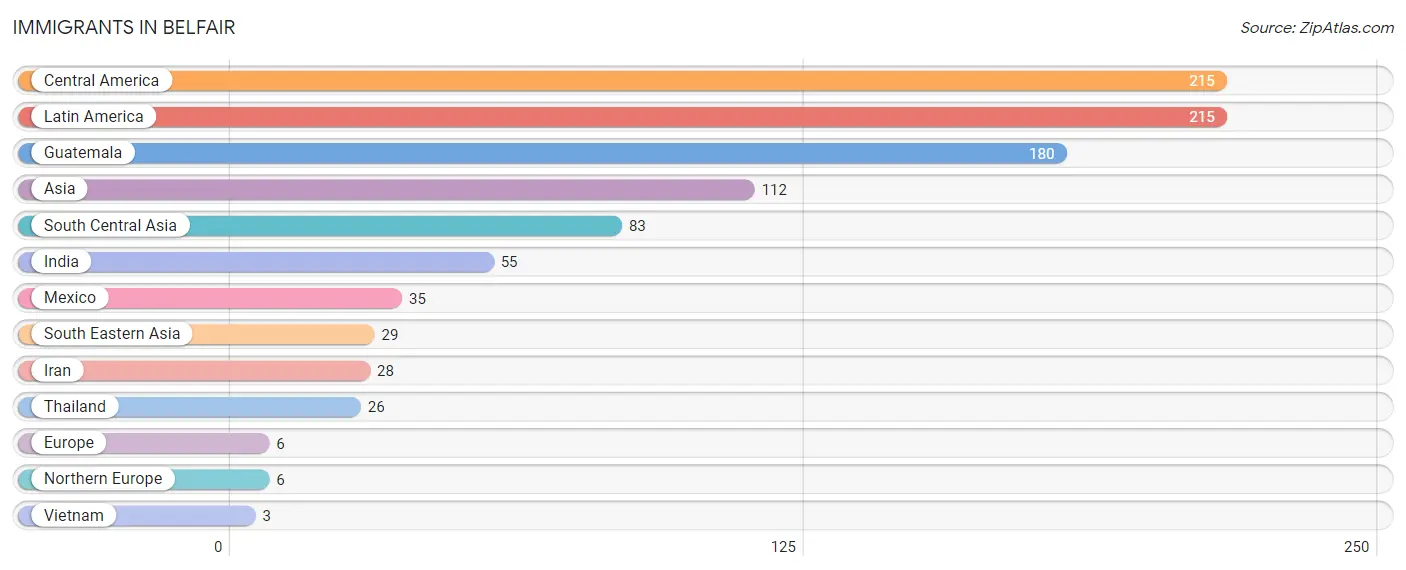
Immigrants in Belfair
The most numerous immigrant groups reported in Belfair came from Central America (215 | 5.1%), Latin America (215 | 5.1%), Guatemala (180 | 4.3%), Asia (112 | 2.7%), and South Central Asia (83 | 2.0%), together accounting for 19.3% of all Belfair residents.
| Immigration Origin | # Population | % Population |
| Asia | 112 | 2.7% |
| Central America | 215 | 5.1% |
| Europe | 6 | 0.1% |
| Guatemala | 180 | 4.3% |
| India | 55 | 1.3% |
| Iran | 28 | 0.7% |
| Latin America | 215 | 5.1% |
| Mexico | 35 | 0.8% |
| Northern Europe | 6 | 0.1% |
| South Central Asia | 83 | 2.0% |
| South Eastern Asia | 29 | 0.7% |
| Thailand | 26 | 0.6% |
| Vietnam | 3 | 0.1% | View All 13 Rows |
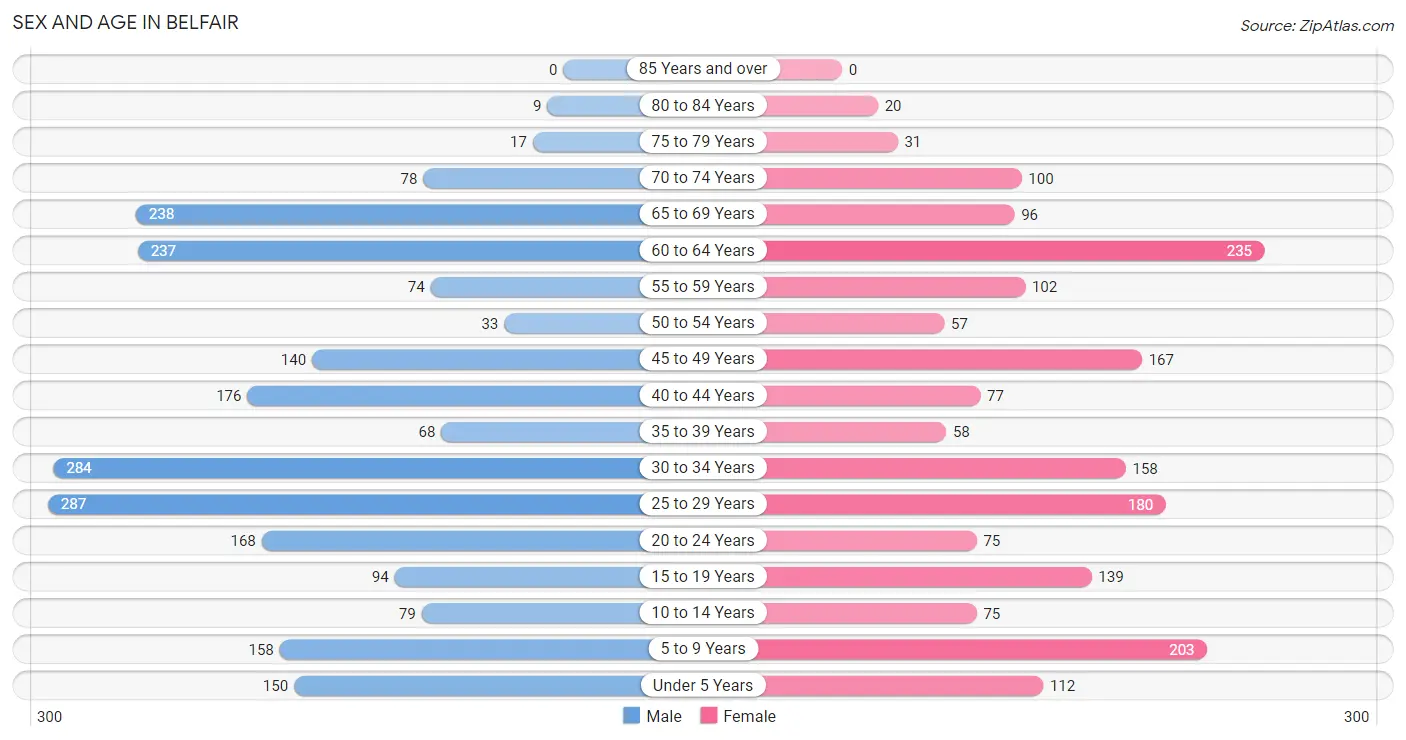
Sex and Age in Belfair
Sex and Age in Belfair
The most populous age groups in Belfair are 25 to 29 Years (287 | 12.5%) for men and 60 to 64 Years (235 | 12.5%) for women.
| Age Bracket | Male | Female |
| Under 5 Years | 150 (6.6%) | 112 (5.9%) |
| 5 to 9 Years | 158 (6.9%) | 203 (10.8%) |
| 10 to 14 Years | 79 (3.5%) | 75 (4.0%) |
| 15 to 19 Years | 94 (4.1%) | 139 (7.4%) |
| 20 to 24 Years | 168 (7.3%) | 75 (4.0%) |
| 25 to 29 Years | 287 (12.5%) | 180 (9.6%) |
| 30 to 34 Years | 284 (12.4%) | 158 (8.4%) |
| 35 to 39 Years | 68 (3.0%) | 58 (3.1%) |
| 40 to 44 Years | 176 (7.7%) | 77 (4.1%) |
| 45 to 49 Years | 140 (6.1%) | 167 (8.9%) |
| 50 to 54 Years | 33 (1.4%) | 57 (3.0%) |
| 55 to 59 Years | 74 (3.2%) | 102 (5.4%) |
| 60 to 64 Years | 237 (10.3%) | 235 (12.5%) |
| 65 to 69 Years | 238 (10.4%) | 96 (5.1%) |
| 70 to 74 Years | 78 (3.4%) | 100 (5.3%) |
| 75 to 79 Years | 17 (0.7%) | 31 (1.6%) |
| 80 to 84 Years | 9 (0.4%) | 20 (1.1%) |
| 85 Years and over | 0 (0.0%) | 0 (0.0%) |
| Total | 2,290 (100.0%) | 1,885 (100.0%) |
Families and Households in Belfair
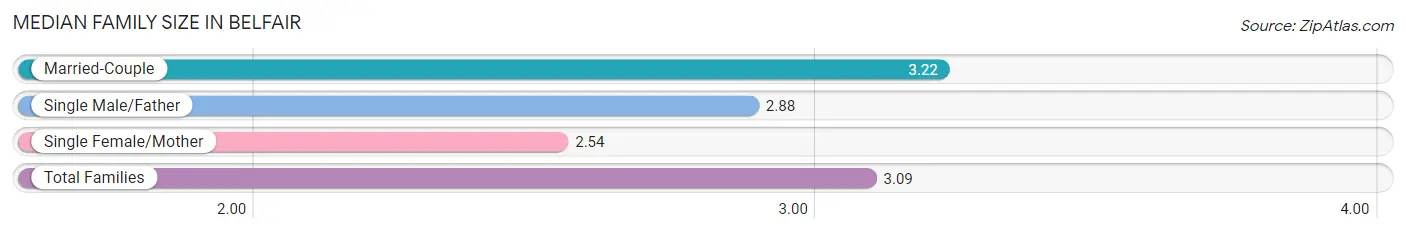
Median Family Size in Belfair
The median family size in Belfair is 3.09 persons per family, with married-couple families (733 | 74.2%) accounting for the largest median family size of 3.22 persons per family. On the other hand, single female/mother families (134 | 13.6%) represent the smallest median family size with 2.54 persons per family.
| Family Type | # Families | Family Size |
| Married-Couple | 733 (74.2%) | 3.22 |
| Single Male/Father | 121 (12.2%) | 2.88 |
| Single Female/Mother | 134 (13.6%) | 2.54 |
| Total Families | 988 (100.0%) | 3.09 |
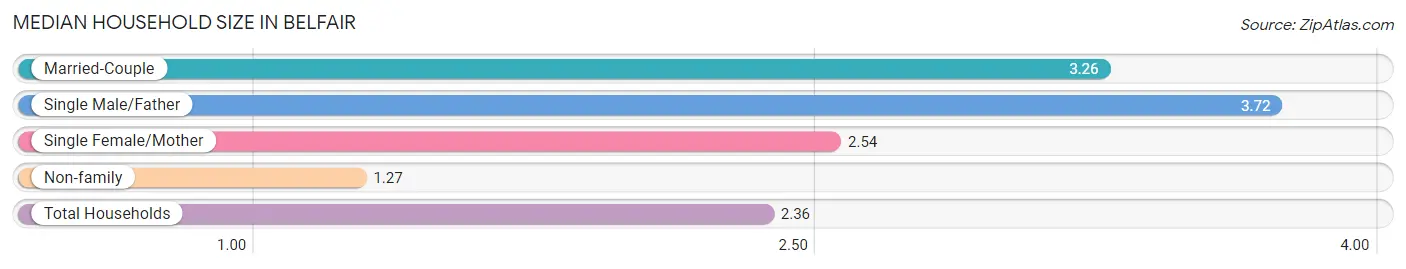
Median Household Size in Belfair
The median household size in Belfair is 2.36 persons per household, with single male/father households (121 | 6.8%) accounting for the largest median household size of 3.72 persons per household. non-family households (783 | 44.2%) represent the smallest median household size with 1.27 persons per household.
| Household Type | # Households | Household Size |
| Married-Couple | 733 (41.4%) | 3.26 |
| Single Male/Father | 121 (6.8%) | 3.72 |
| Single Female/Mother | 134 (7.6%) | 2.54 |
| Non-family | 783 (44.2%) | 1.27 |
| Total Households | 1,771 (100.0%) | 2.36 |
Household Size by Marriage Status in Belfair
Out of a total of 1,771 households in Belfair, 988 (55.8%) are family households, while 783 (44.2%) are nonfamily households. The most numerous type of family households are 2-person households, comprising 462, and the most common type of nonfamily households are 1-person households, comprising 608.
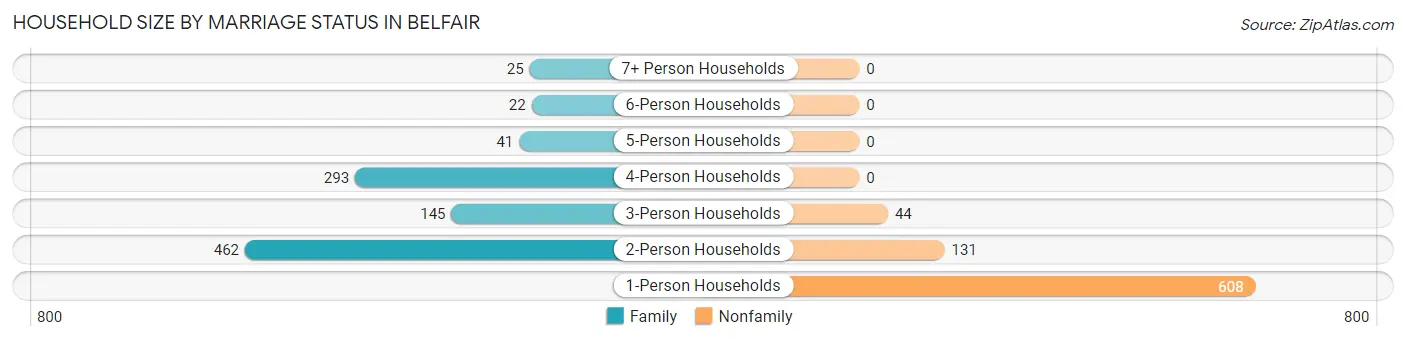
| Household Size | Family Households | Nonfamily Households |
| 1-Person Households | - | 608 (34.3%) |
| 2-Person Households | 462 (26.1%) | 131 (7.4%) |
| 3-Person Households | 145 (8.2%) | 44 (2.5%) |
| 4-Person Households | 293 (16.5%) | 0 (0.0%) |
| 5-Person Households | 41 (2.3%) | 0 (0.0%) |
| 6-Person Households | 22 (1.2%) | 0 (0.0%) |
| 7+ Person Households | 25 (1.4%) | 0 (0.0%) |
| Total | 988 (55.8%) | 783 (44.2%) |
Female Fertility in Belfair
Fertility by Age in Belfair
Average fertility rate in Belfair is 11.0 births per 1,000 women. Women in the age bracket of 20 to 34 years have the highest fertility rate with 22.0 births per 1,000 women. Women in the age bracket of 20 to 34 years acount for 100.0% of all women with births.
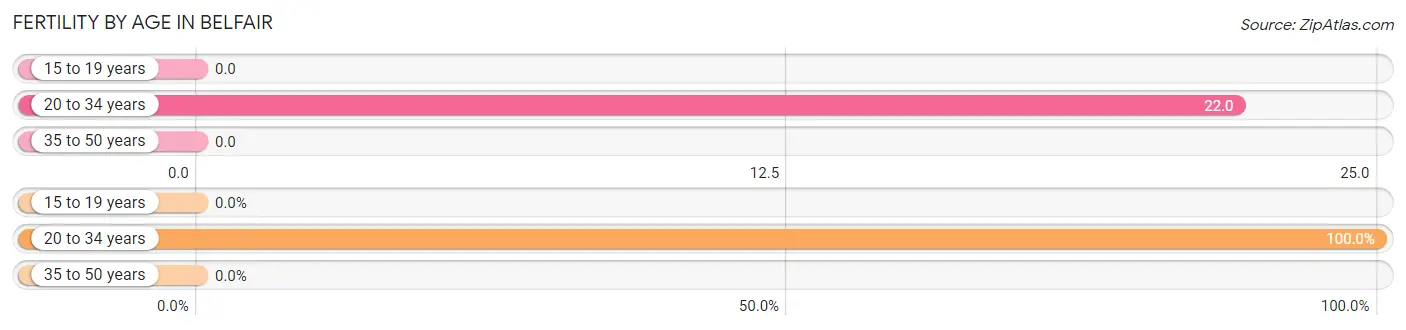
| Age Bracket | Women with Births | Births / 1,000 Women |
| 15 to 19 years | 0 (0.0%) | 0.0 |
| 20 to 34 years | 9 (100.0%) | 22.0 |
| 35 to 50 years | 0 (0.0%) | 0.0 |
| Total | 9 (100.0%) | 11.0 |
Fertility by Age by Marriage Status in Belfair
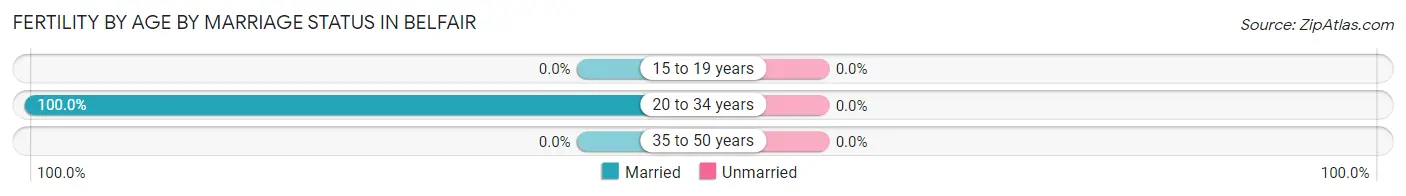
| Age Bracket | Married | Unmarried |
| 15 to 19 years | 0 (0.0%) | 0 (0.0%) |
| 20 to 34 years | 9 (100.0%) | 0 (0.0%) |
| 35 to 50 years | 0 (0.0%) | 0 (0.0%) |
| Total | 9 (100.0%) | 0 (0.0%) |
Fertility by Education in Belfair
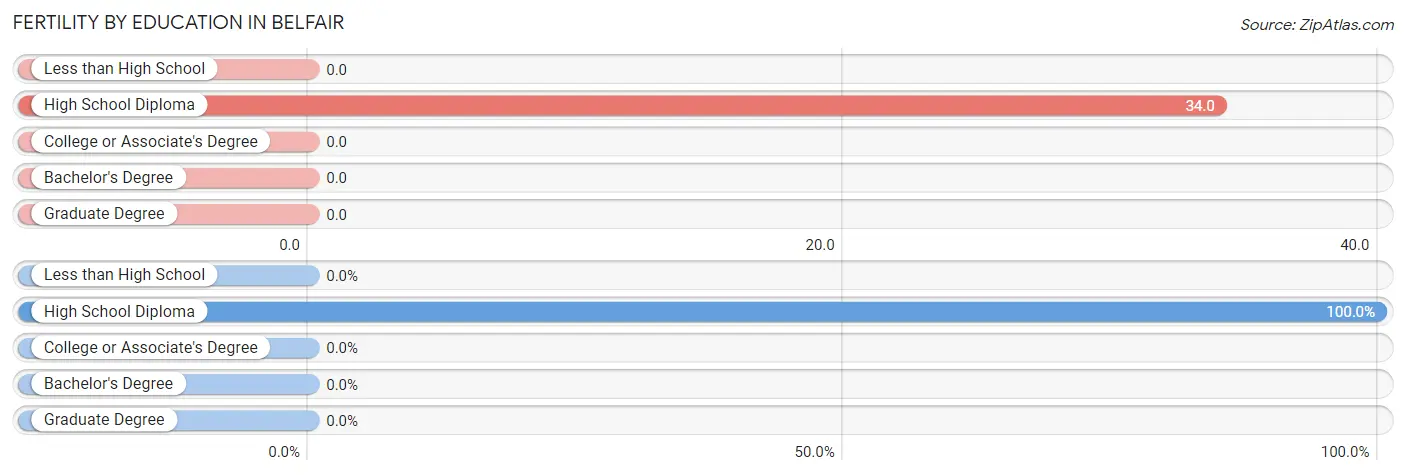
| Educational Attainment | Women with Births | Births / 1,000 Women |
| Less than High School | 0 (0.0%) | 0.0 |
| High School Diploma | 9 (100.0%) | 34.0 |
| College or Associate's Degree | 0 (0.0%) | 0.0 |
| Bachelor's Degree | 0 (0.0%) | 0.0 |
| Graduate Degree | 0 (0.0%) | 0.0 |
| Total | 9 (100.0%) | 11.0 |
Fertility by Education by Marriage Status in Belfair
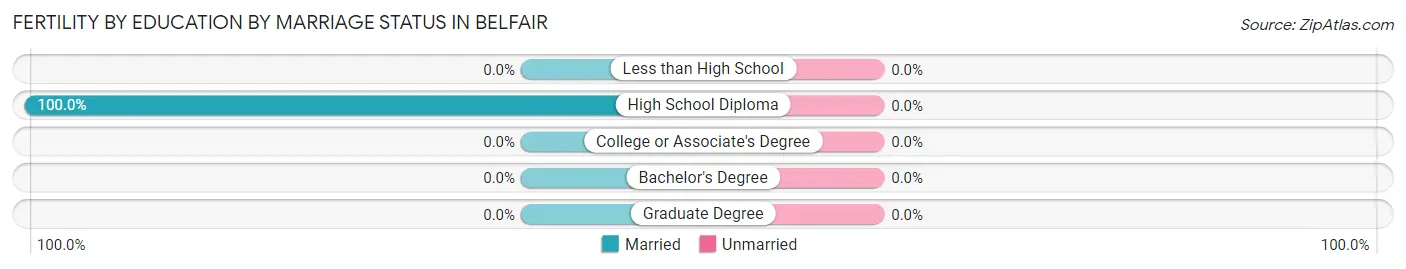
| Educational Attainment | Married | Unmarried |
| Less than High School | 0 (0.0%) | 0 (0.0%) |
| High School Diploma | 9 (100.0%) | 0 (0.0%) |
| College or Associate's Degree | 0 (0.0%) | 0 (0.0%) |
| Bachelor's Degree | 0 (0.0%) | 0 (0.0%) |
| Graduate Degree | 0 (0.0%) | 0 (0.0%) |
| Total | 9 (100.0%) | 0 (0.0%) |
Employment Characteristics in Belfair
Employment by Class of Employer in Belfair
Among the 1,776 employed individuals in Belfair, private company employees (738 | 41.5%), federal government employees (465 | 26.2%), and local government employees (237 | 13.3%) make up the most common classes of employment.
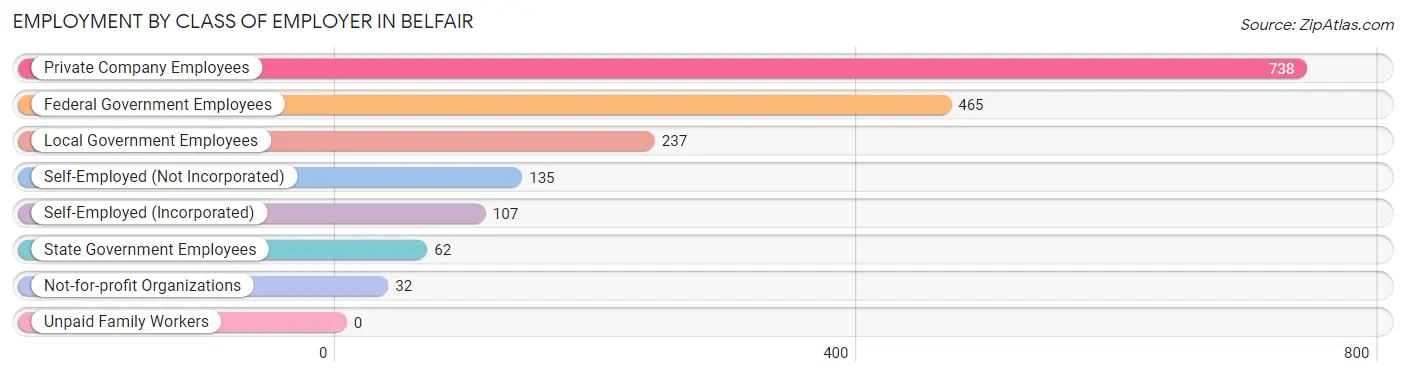
| Employer Class | # Employees | % Employees |
| Private Company Employees | 738 | 41.5% |
| Self-Employed (Incorporated) | 107 | 6.0% |
| Self-Employed (Not Incorporated) | 135 | 7.6% |
| Not-for-profit Organizations | 32 | 1.8% |
| Local Government Employees | 237 | 13.3% |
| State Government Employees | 62 | 3.5% |
| Federal Government Employees | 465 | 26.2% |
| Unpaid Family Workers | 0 | 0.0% |
| Total | 1,776 | 100.0% |
Employment Status by Age in Belfair
According to the labor force statistics for Belfair, out of the total population over 16 years of age (3,362), 59.3% or 1,994 individuals are in the labor force, with 4.9% or 98 of them unemployed. The age group with the highest labor force participation rate is 35 to 44 years, with 90.5% or 343 individuals in the labor force. Within the labor force, the 20 to 24 years age range has the highest percentage of unemployed individuals, with 22.8% or 44 of them being unemployed.
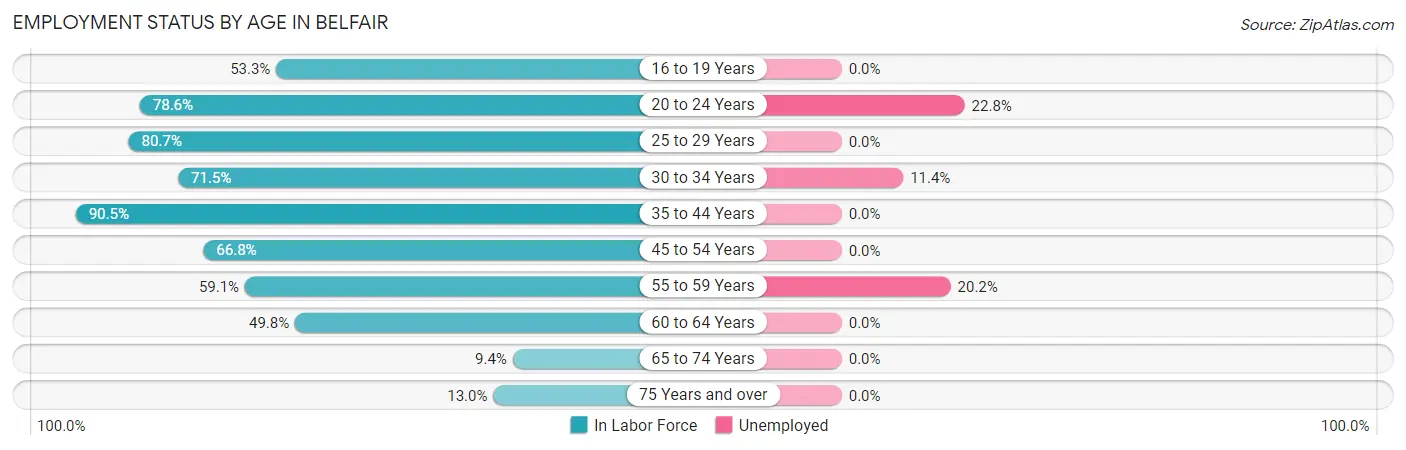
| Age Bracket | In Labor Force | Unemployed |
| 16 to 19 Years | 105 (53.3%) | 0 (0.0%) |
| 20 to 24 Years | 191 (78.6%) | 44 (22.8%) |
| 25 to 29 Years | 377 (80.7%) | 0 (0.0%) |
| 30 to 34 Years | 316 (71.5%) | 36 (11.4%) |
| 35 to 44 Years | 343 (90.5%) | 0 (0.0%) |
| 45 to 54 Years | 265 (66.8%) | 0 (0.0%) |
| 55 to 59 Years | 104 (59.1%) | 21 (20.2%) |
| 60 to 64 Years | 235 (49.8%) | 0 (0.0%) |
| 65 to 74 Years | 48 (9.4%) | 0 (0.0%) |
| 75 Years and over | 10 (13.0%) | 0 (0.0%) |
| Total | 1,994 (59.3%) | 98 (4.9%) |
Employment Status by Educational Attainment in Belfair
According to labor force statistics for Belfair, 70.3% of individuals (1,640) out of the total population between 25 and 64 years of age (2,333) are in the labor force, with 3.6% or 59 of them being unemployed. The group with the highest labor force participation rate are those with the educational attainment of less than high school, with 87.5% or 161 individuals in the labor force. Within the labor force, individuals with bachelor's degree or higher education have the highest percentage of unemployment, with 12.4% or 27 of them being unemployed.
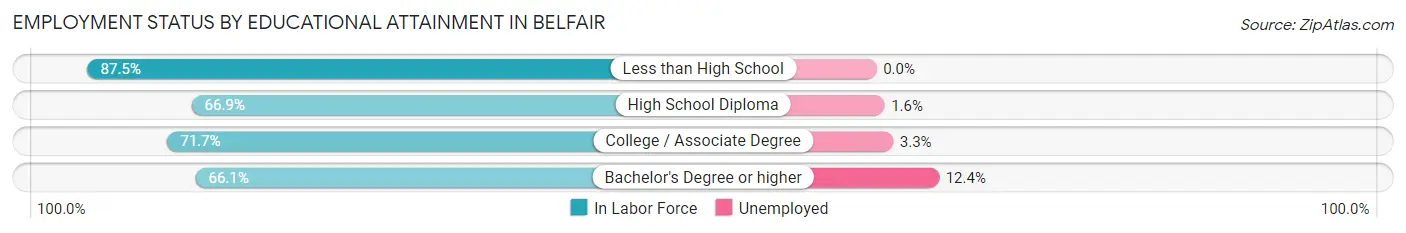
| Educational Attainment | In Labor Force | Unemployed |
| Less than High School | 161 (87.5%) | 0 (0.0%) |
| High School Diploma | 595 (66.9%) | 14 (1.6%) |
| College / Associate Degree | 666 (71.7%) | 31 (3.3%) |
| Bachelor's Degree or higher | 218 (66.1%) | 41 (12.4%) |
| Total | 1,640 (70.3%) | 84 (3.6%) |
Employment Occupations by Sex in Belfair
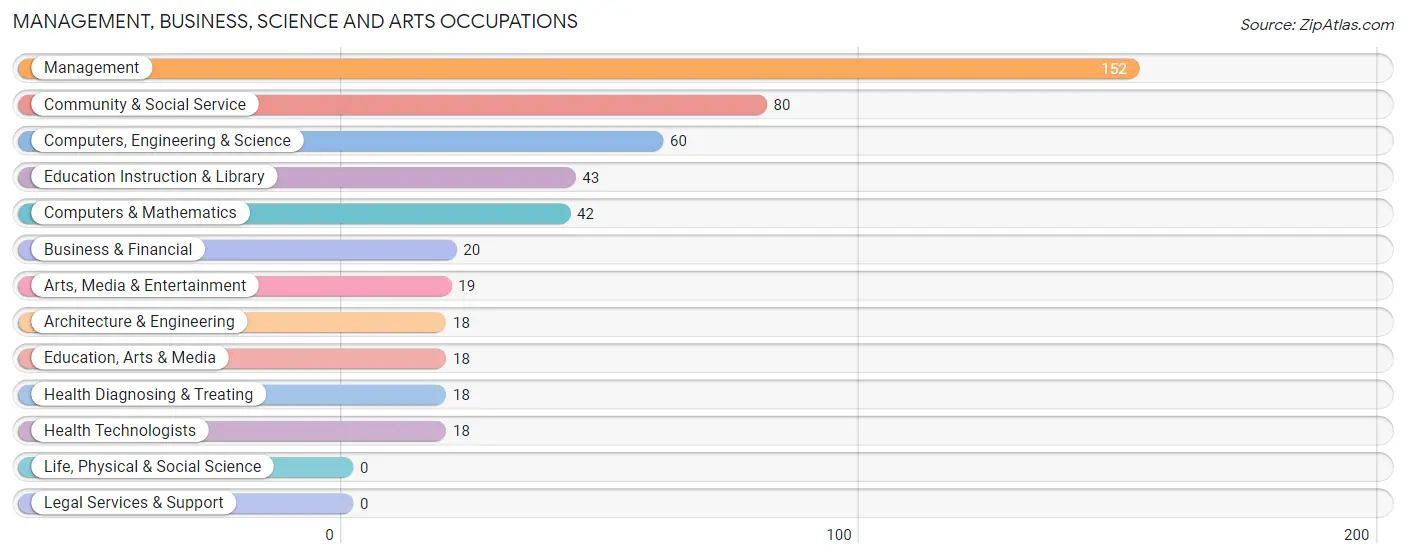
Management, Business, Science and Arts Occupations
The most common Management, Business, Science and Arts occupations in Belfair are Management (152 | 8.4%), Community & Social Service (80 | 4.4%), Computers, Engineering & Science (60 | 3.3%), Education Instruction & Library (43 | 2.4%), and Computers & Mathematics (42 | 2.3%).
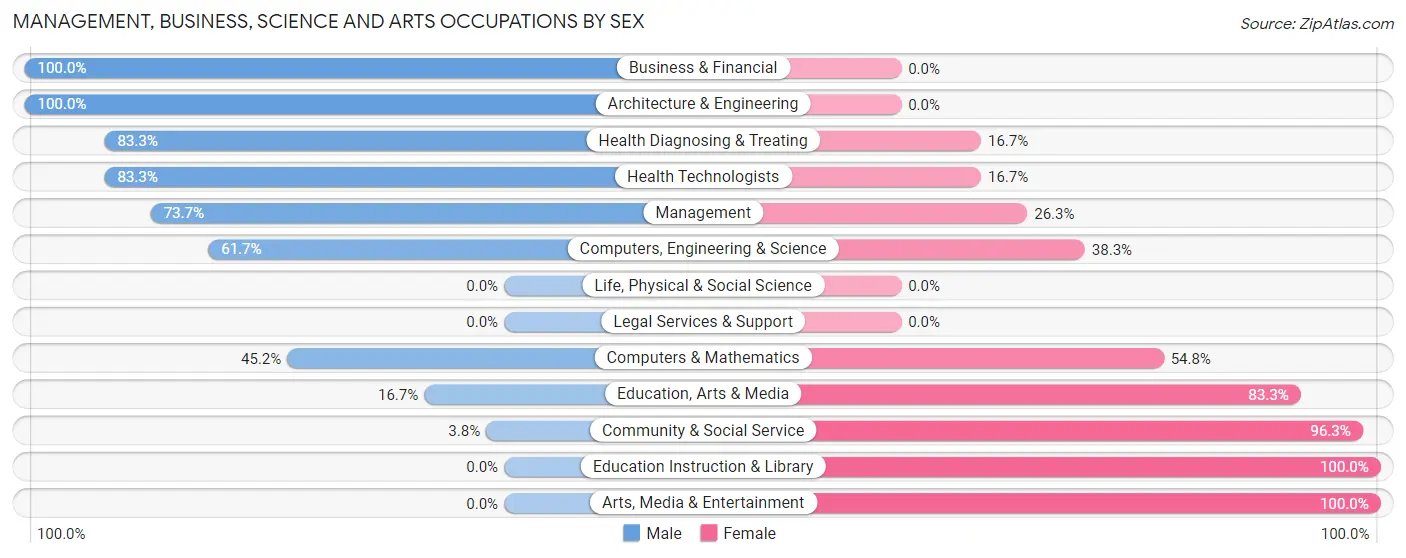
Management, Business, Science and Arts Occupations by Sex
Within the Management, Business, Science and Arts occupations in Belfair, the most male-oriented occupations are Business & Financial (100.0%), Architecture & Engineering (100.0%), and Health Diagnosing & Treating (83.3%), while the most female-oriented occupations are Education Instruction & Library (100.0%), Arts, Media & Entertainment (100.0%), and Community & Social Service (96.3%).
| Occupation | Male | Female |
| Management | 112 (73.7%) | 40 (26.3%) |
| Business & Financial | 20 (100.0%) | 0 (0.0%) |
| Computers, Engineering & Science | 37 (61.7%) | 23 (38.3%) |
| Computers & Mathematics | 19 (45.2%) | 23 (54.8%) |
| Architecture & Engineering | 18 (100.0%) | 0 (0.0%) |
| Life, Physical & Social Science | 0 (0.0%) | 0 (0.0%) |
| Community & Social Service | 3 (3.7%) | 77 (96.3%) |
| Education, Arts & Media | 3 (16.7%) | 15 (83.3%) |
| Legal Services & Support | 0 (0.0%) | 0 (0.0%) |
| Education Instruction & Library | 0 (0.0%) | 43 (100.0%) |
| Arts, Media & Entertainment | 0 (0.0%) | 19 (100.0%) |
| Health Diagnosing & Treating | 15 (83.3%) | 3 (16.7%) |
| Health Technologists | 15 (83.3%) | 3 (16.7%) |
| Total (Category) | 187 (56.7%) | 143 (43.3%) |
| Total (Overall) | 1,156 (63.7%) | 658 (36.3%) |
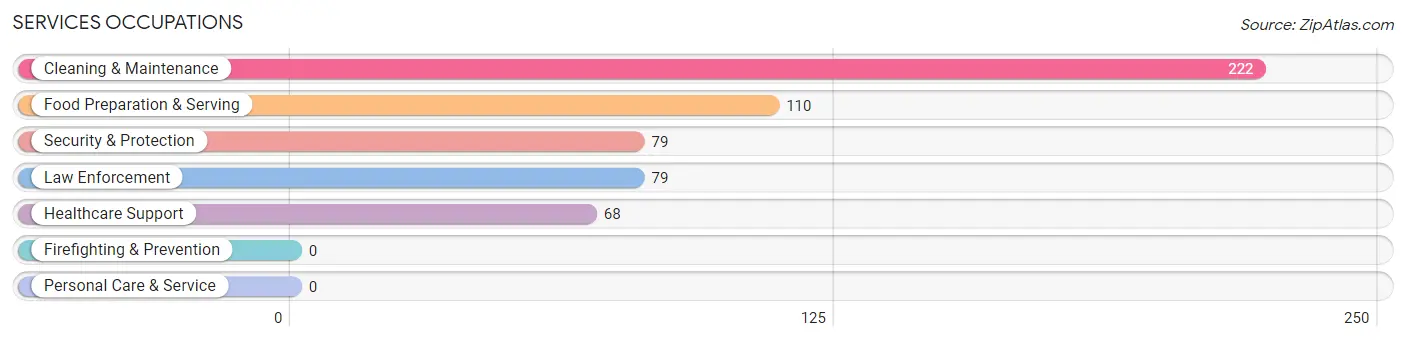
Services Occupations
The most common Services occupations in Belfair are Cleaning & Maintenance (222 | 12.2%), Food Preparation & Serving (110 | 6.1%), Security & Protection (79 | 4.4%), Law Enforcement (79 | 4.4%), and Healthcare Support (68 | 3.7%).
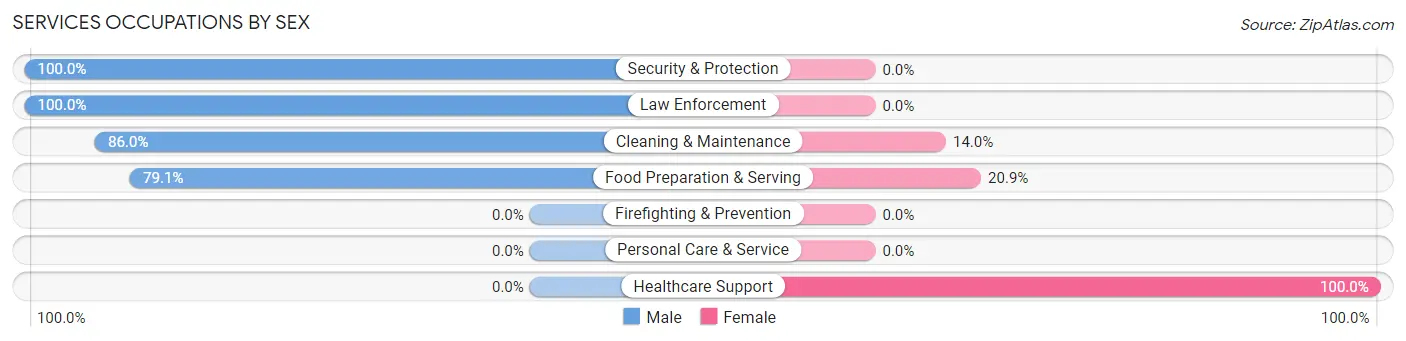
Services Occupations by Sex
Within the Services occupations in Belfair, the most male-oriented occupations are Security & Protection (100.0%), Law Enforcement (100.0%), and Cleaning & Maintenance (86.0%), while the most female-oriented occupations are Healthcare Support (100.0%), Food Preparation & Serving (20.9%), and Cleaning & Maintenance (14.0%).
| Occupation | Male | Female |
| Healthcare Support | 0 (0.0%) | 68 (100.0%) |
| Security & Protection | 79 (100.0%) | 0 (0.0%) |
| Firefighting & Prevention | 0 (0.0%) | 0 (0.0%) |
| Law Enforcement | 79 (100.0%) | 0 (0.0%) |
| Food Preparation & Serving | 87 (79.1%) | 23 (20.9%) |
| Cleaning & Maintenance | 191 (86.0%) | 31 (14.0%) |
| Personal Care & Service | 0 (0.0%) | 0 (0.0%) |
| Total (Category) | 357 (74.5%) | 122 (25.5%) |
| Total (Overall) | 1,156 (63.7%) | 658 (36.3%) |
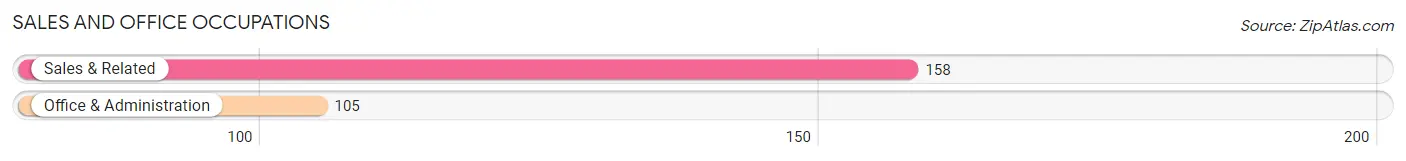
Sales and Office Occupations
The most common Sales and Office occupations in Belfair are Sales & Related (158 | 8.7%), and Office & Administration (105 | 5.8%).
Sales and Office Occupations by Sex
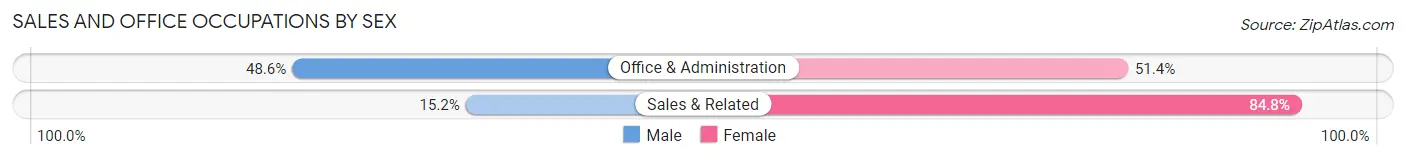
| Occupation | Male | Female |
| Sales & Related | 24 (15.2%) | 134 (84.8%) |
| Office & Administration | 51 (48.6%) | 54 (51.4%) |
| Total (Category) | 75 (28.5%) | 188 (71.5%) |
| Total (Overall) | 1,156 (63.7%) | 658 (36.3%) |
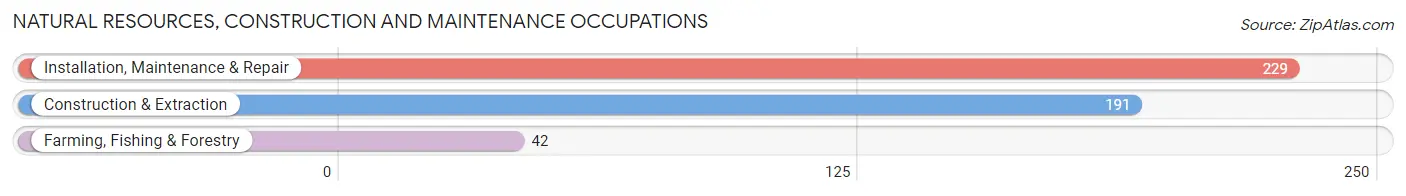
Natural Resources, Construction and Maintenance Occupations
The most common Natural Resources, Construction and Maintenance occupations in Belfair are Installation, Maintenance & Repair (229 | 12.6%), Construction & Extraction (191 | 10.5%), and Farming, Fishing & Forestry (42 | 2.3%).
Natural Resources, Construction and Maintenance Occupations by Sex
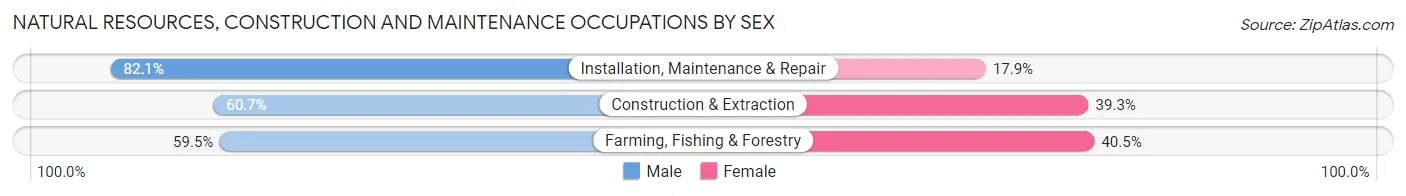
| Occupation | Male | Female |
| Farming, Fishing & Forestry | 25 (59.5%) | 17 (40.5%) |
| Construction & Extraction | 116 (60.7%) | 75 (39.3%) |
| Installation, Maintenance & Repair | 188 (82.1%) | 41 (17.9%) |
| Total (Category) | 329 (71.2%) | 133 (28.8%) |
| Total (Overall) | 1,156 (63.7%) | 658 (36.3%) |
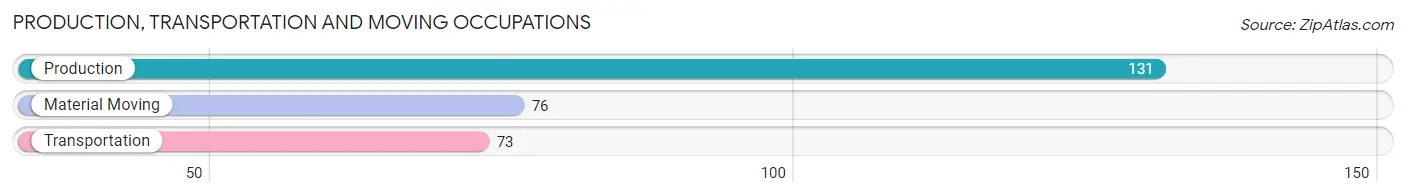
Production, Transportation and Moving Occupations
The most common Production, Transportation and Moving occupations in Belfair are Production (131 | 7.2%), Material Moving (76 | 4.2%), and Transportation (73 | 4.0%).
Production, Transportation and Moving Occupations by Sex
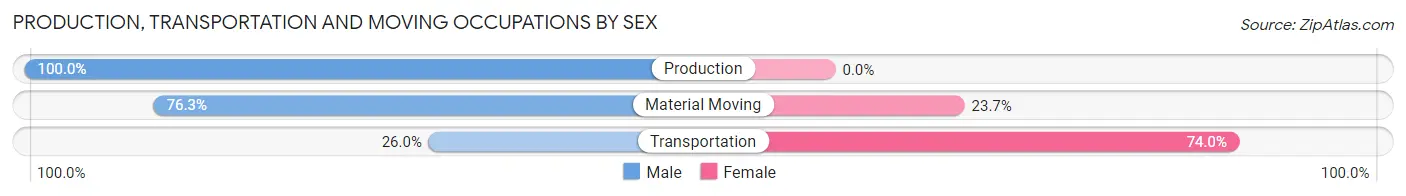
| Occupation | Male | Female |
| Production | 131 (100.0%) | 0 (0.0%) |
| Transportation | 19 (26.0%) | 54 (74.0%) |
| Material Moving | 58 (76.3%) | 18 (23.7%) |
| Total (Category) | 208 (74.3%) | 72 (25.7%) |
| Total (Overall) | 1,156 (63.7%) | 658 (36.3%) |
Employment Industries by Sex in Belfair
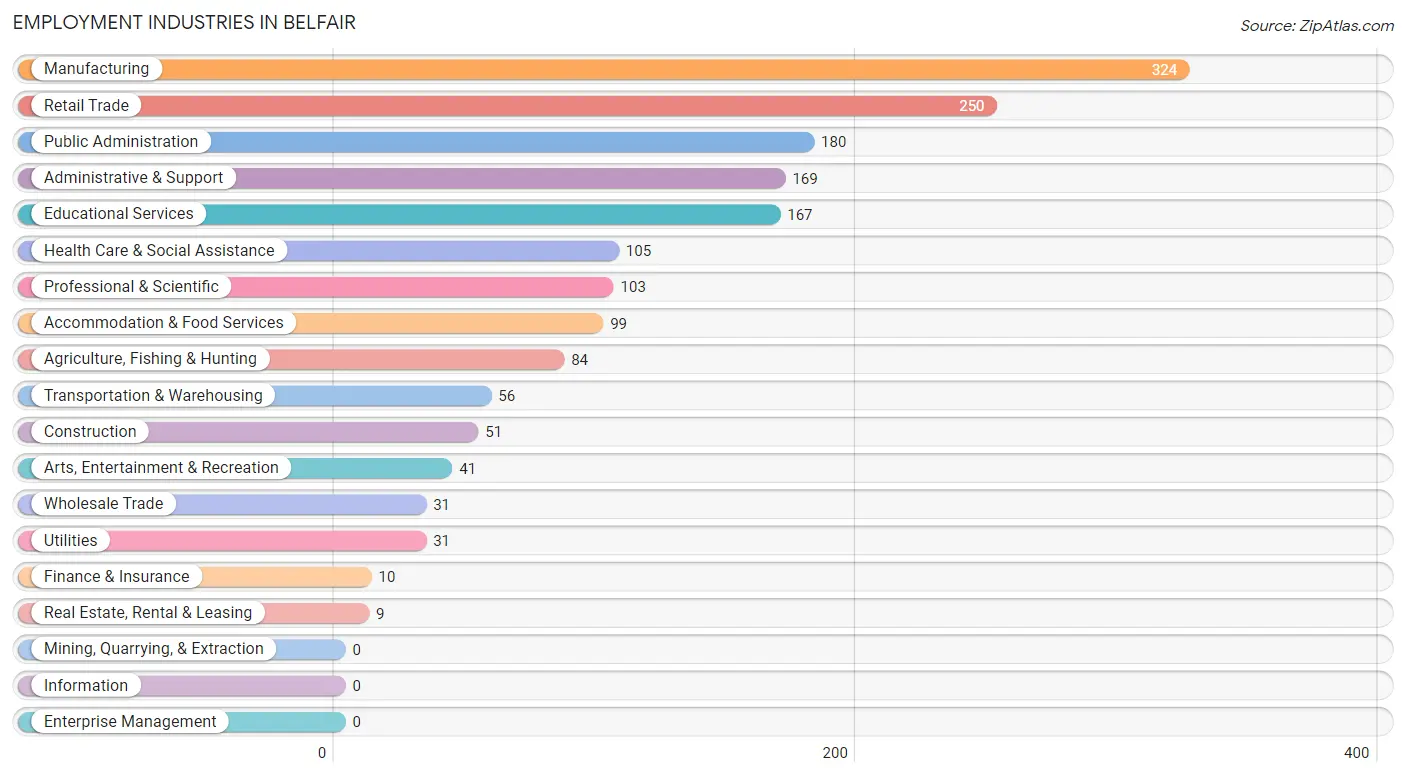
Employment Industries in Belfair
The major employment industries in Belfair include Manufacturing (324 | 17.9%), Retail Trade (250 | 13.8%), Public Administration (180 | 9.9%), Administrative & Support (169 | 9.3%), and Educational Services (167 | 9.2%).
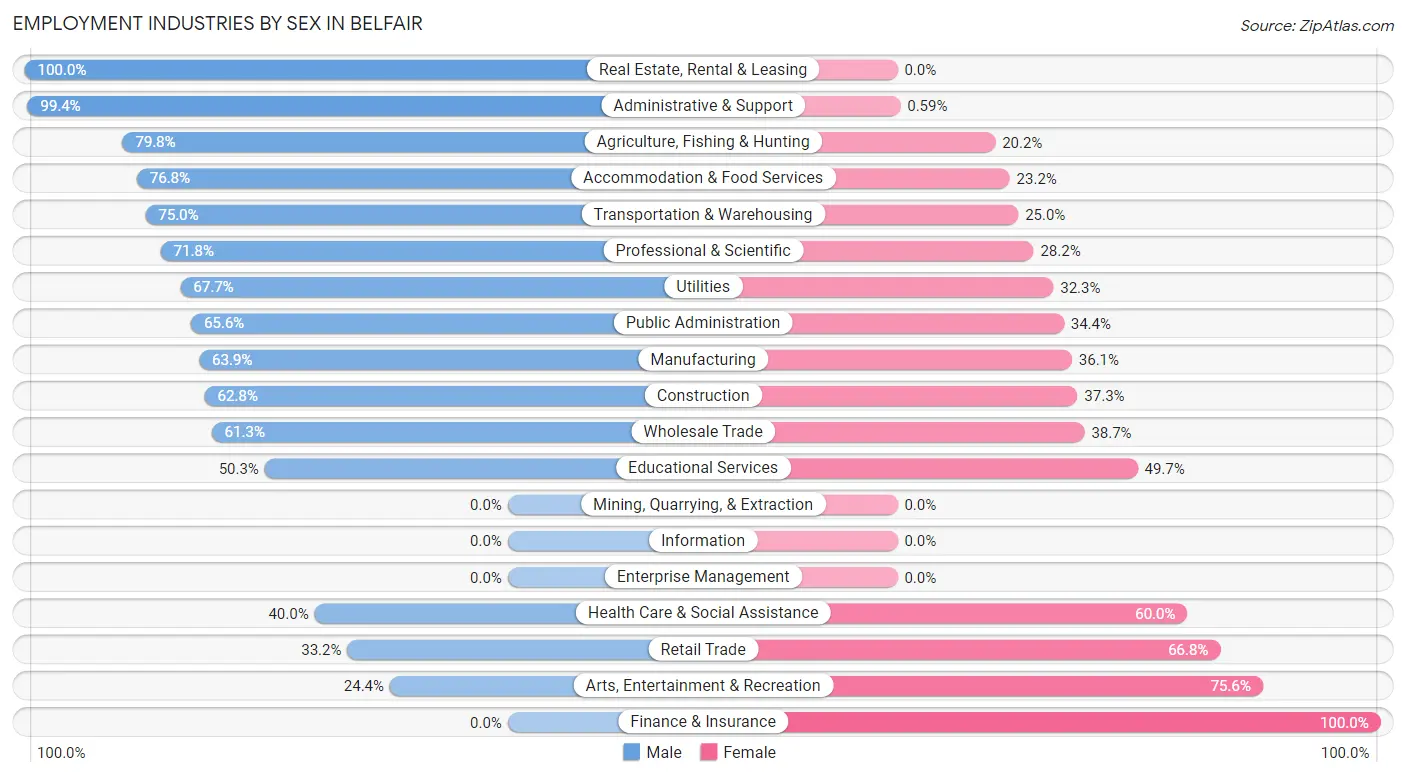
Employment Industries by Sex in Belfair
The Belfair industries that see more men than women are Real Estate, Rental & Leasing (100.0%), Administrative & Support (99.4%), and Agriculture, Fishing & Hunting (79.8%), whereas the industries that tend to have a higher number of women are Finance & Insurance (100.0%), Arts, Entertainment & Recreation (75.6%), and Retail Trade (66.8%).
| Industry | Male | Female |
| Agriculture, Fishing & Hunting | 67 (79.8%) | 17 (20.2%) |
| Mining, Quarrying, & Extraction | 0 (0.0%) | 0 (0.0%) |
| Construction | 32 (62.7%) | 19 (37.2%) |
| Manufacturing | 207 (63.9%) | 117 (36.1%) |
| Wholesale Trade | 19 (61.3%) | 12 (38.7%) |
| Retail Trade | 83 (33.2%) | 167 (66.8%) |
| Transportation & Warehousing | 42 (75.0%) | 14 (25.0%) |
| Utilities | 21 (67.7%) | 10 (32.3%) |
| Information | 0 (0.0%) | 0 (0.0%) |
| Finance & Insurance | 0 (0.0%) | 10 (100.0%) |
| Real Estate, Rental & Leasing | 9 (100.0%) | 0 (0.0%) |
| Professional & Scientific | 74 (71.8%) | 29 (28.2%) |
| Enterprise Management | 0 (0.0%) | 0 (0.0%) |
| Administrative & Support | 168 (99.4%) | 1 (0.6%) |
| Educational Services | 84 (50.3%) | 83 (49.7%) |
| Health Care & Social Assistance | 42 (40.0%) | 63 (60.0%) |
| Arts, Entertainment & Recreation | 10 (24.4%) | 31 (75.6%) |
| Accommodation & Food Services | 76 (76.8%) | 23 (23.2%) |
| Public Administration | 118 (65.6%) | 62 (34.4%) |
| Total | 1,156 (63.7%) | 658 (36.3%) |
Education in Belfair
School Enrollment in Belfair
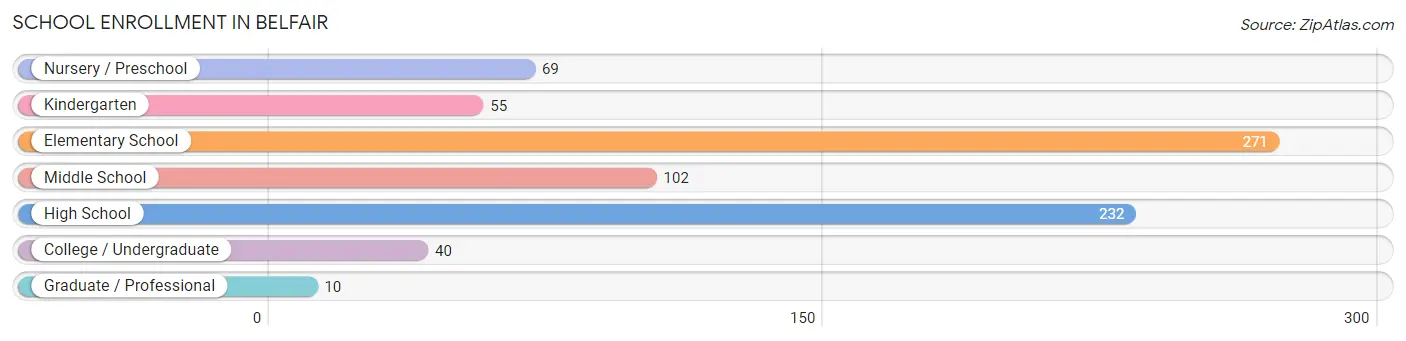
The most common levels of schooling among the 779 students in Belfair are elementary school (271 | 34.8%), high school (232 | 29.8%), and middle school (102 | 13.1%).
| School Level | # Students | % Students |
| Nursery / Preschool | 69 | 8.9% |
| Kindergarten | 55 | 7.1% |
| Elementary School | 271 | 34.8% |
| Middle School | 102 | 13.1% |
| High School | 232 | 29.8% |
| College / Undergraduate | 40 | 5.1% |
| Graduate / Professional | 10 | 1.3% |
| Total | 779 | 100.0% |
School Enrollment by Age by Funding Source in Belfair
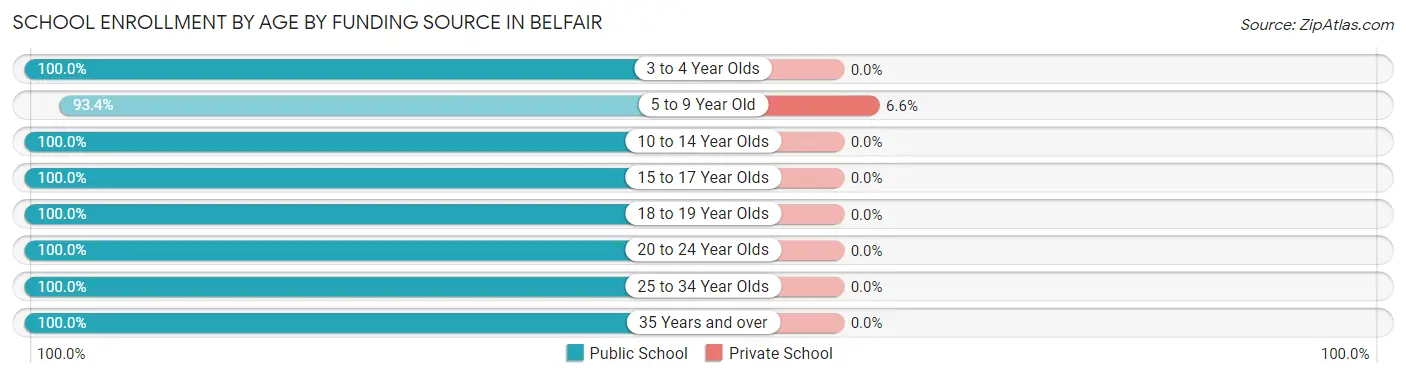
Out of a total of 779 students who are enrolled in schools in Belfair, 22 (2.8%) attend a private institution, while the remaining 757 (97.2%) are enrolled in public schools. The age group of 5 to 9 year old has the highest likelihood of being enrolled in private schools, with 22 (6.6% in the age bracket) enrolled. Conversely, the age group of 3 to 4 year olds has the lowest likelihood of being enrolled in a private school, with 29 (100.0% in the age bracket) attending a public institution.
| Age Bracket | Public School | Private School |
| 3 to 4 Year Olds | 29 (100.0%) | 0 (0.0%) |
| 5 to 9 Year Old | 311 (93.4%) | 22 (6.6%) |
| 10 to 14 Year Olds | 154 (100.0%) | 0 (0.0%) |
| 15 to 17 Year Olds | 126 (100.0%) | 0 (0.0%) |
| 18 to 19 Year Olds | 87 (100.0%) | 0 (0.0%) |
| 20 to 24 Year Olds | 19 (100.0%) | 0 (0.0%) |
| 25 to 34 Year Olds | 14 (100.0%) | 0 (0.0%) |
| 35 Years and over | 17 (100.0%) | 0 (0.0%) |
| Total | 757 (97.2%) | 22 (2.8%) |
Educational Attainment by Field of Study in Belfair
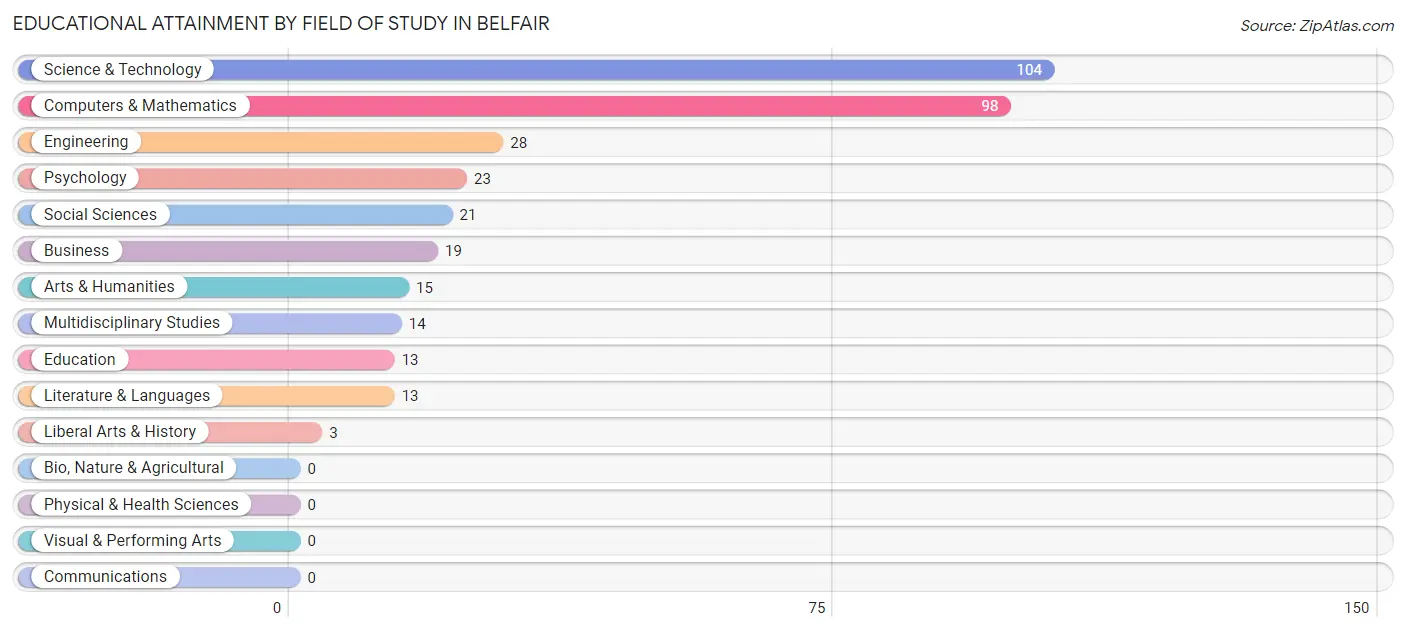
Science & technology (104 | 29.6%), computers & mathematics (98 | 27.9%), engineering (28 | 8.0%), psychology (23 | 6.6%), and social sciences (21 | 6.0%) are the most common fields of study among 351 individuals in Belfair who have obtained a bachelor's degree or higher.
| Field of Study | # Graduates | % Graduates |
| Computers & Mathematics | 98 | 27.9% |
| Bio, Nature & Agricultural | 0 | 0.0% |
| Physical & Health Sciences | 0 | 0.0% |
| Psychology | 23 | 6.6% |
| Social Sciences | 21 | 6.0% |
| Engineering | 28 | 8.0% |
| Multidisciplinary Studies | 14 | 4.0% |
| Science & Technology | 104 | 29.6% |
| Business | 19 | 5.4% |
| Education | 13 | 3.7% |
| Literature & Languages | 13 | 3.7% |
| Liberal Arts & History | 3 | 0.9% |
| Visual & Performing Arts | 0 | 0.0% |
| Communications | 0 | 0.0% |
| Arts & Humanities | 15 | 4.3% |
| Total | 351 | 100.0% |
Transportation & Commute in Belfair
Vehicle Availability by Sex in Belfair
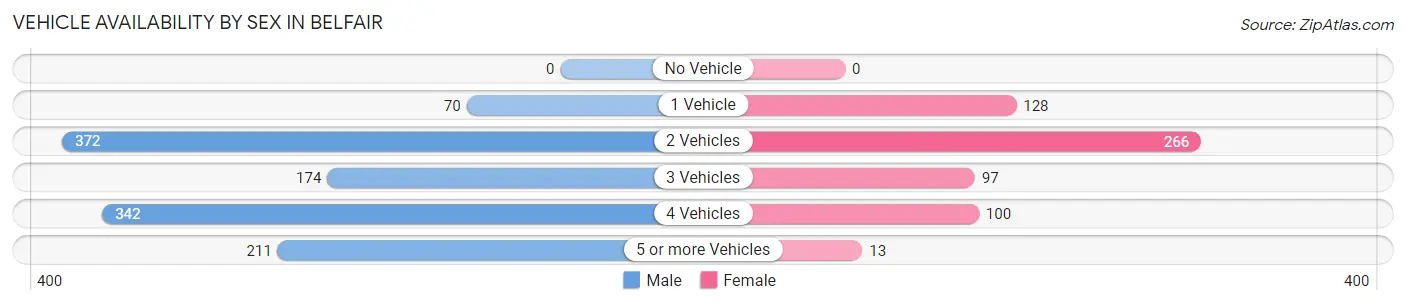
The most prevalent vehicle ownership categories in Belfair are males with 2 vehicles (372, accounting for 31.8%) and females with 2 vehicles (266, making up 61.6%).
| Vehicles Available | Male | Female |
| No Vehicle | 0 (0.0%) | 0 (0.0%) |
| 1 Vehicle | 70 (6.0%) | 128 (21.2%) |
| 2 Vehicles | 372 (31.8%) | 266 (44.0%) |
| 3 Vehicles | 174 (14.9%) | 97 (16.1%) |
| 4 Vehicles | 342 (29.3%) | 100 (16.6%) |
| 5 or more Vehicles | 211 (18.0%) | 13 (2.1%) |
| Total | 1,169 (100.0%) | 604 (100.0%) |
Commute Time in Belfair
The most frequently occuring commute durations in Belfair are 45 to 59 minutes (386 commuters, 22.2%), 30 to 34 minutes (324 commuters, 18.6%), and 5 to 9 minutes (238 commuters, 13.7%).
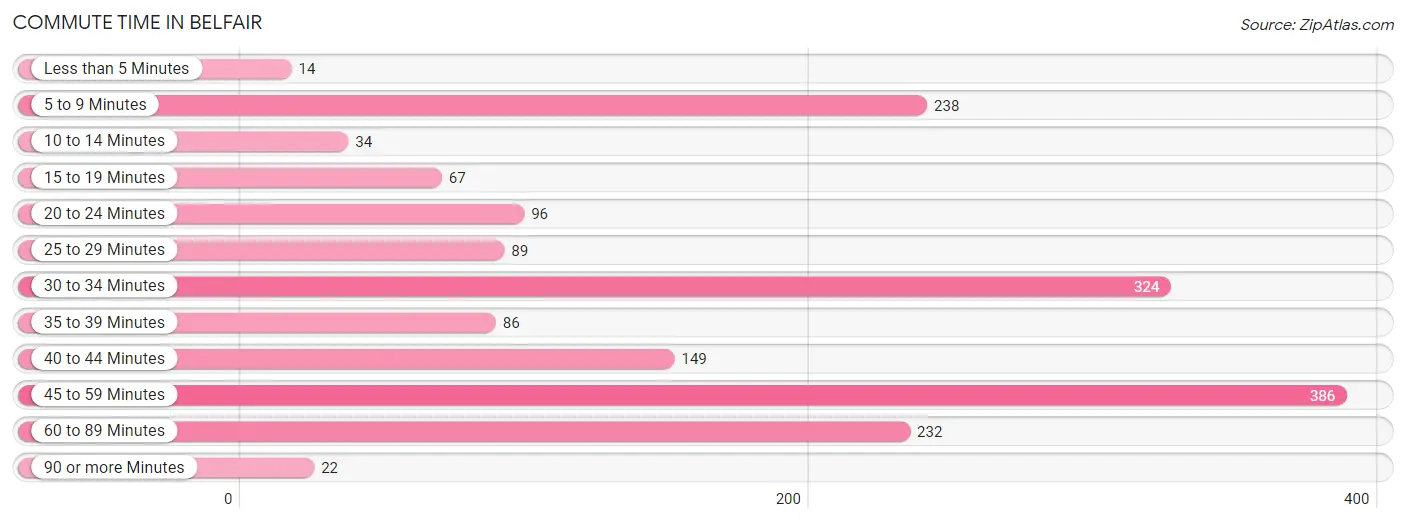
| Commute Time | # Commuters | % Commuters |
| Less than 5 Minutes | 14 | 0.8% |
| 5 to 9 Minutes | 238 | 13.7% |
| 10 to 14 Minutes | 34 | 2.0% |
| 15 to 19 Minutes | 67 | 3.9% |
| 20 to 24 Minutes | 96 | 5.5% |
| 25 to 29 Minutes | 89 | 5.1% |
| 30 to 34 Minutes | 324 | 18.6% |
| 35 to 39 Minutes | 86 | 5.0% |
| 40 to 44 Minutes | 149 | 8.6% |
| 45 to 59 Minutes | 386 | 22.2% |
| 60 to 89 Minutes | 232 | 13.4% |
| 90 or more Minutes | 22 | 1.3% |
Commute Time by Sex in Belfair
The most common commute times in Belfair are 45 to 59 minutes (296 commuters, 25.8%) for males and 60 to 89 minutes (112 commuters, 19.1%) for females.
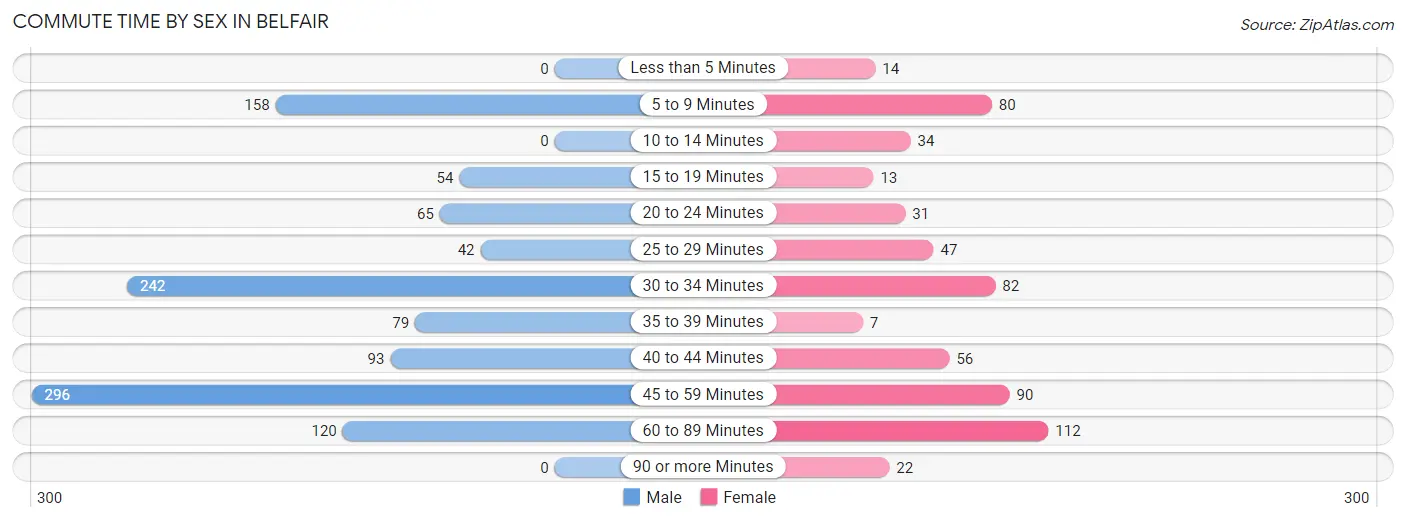
| Commute Time | Male | Female |
| Less than 5 Minutes | 0 (0.0%) | 14 (2.4%) |
| 5 to 9 Minutes | 158 (13.8%) | 80 (13.6%) |
| 10 to 14 Minutes | 0 (0.0%) | 34 (5.8%) |
| 15 to 19 Minutes | 54 (4.7%) | 13 (2.2%) |
| 20 to 24 Minutes | 65 (5.7%) | 31 (5.3%) |
| 25 to 29 Minutes | 42 (3.7%) | 47 (8.0%) |
| 30 to 34 Minutes | 242 (21.1%) | 82 (14.0%) |
| 35 to 39 Minutes | 79 (6.9%) | 7 (1.2%) |
| 40 to 44 Minutes | 93 (8.1%) | 56 (9.5%) |
| 45 to 59 Minutes | 296 (25.8%) | 90 (15.3%) |
| 60 to 89 Minutes | 120 (10.4%) | 112 (19.1%) |
| 90 or more Minutes | 0 (0.0%) | 22 (3.7%) |
Time of Departure to Work by Sex in Belfair
The most frequent times of departure to work in Belfair are 12:00 PM to 3:59 PM (201, 17.5%) for males and 6:00 AM to 6:29 AM (91, 15.5%) for females.
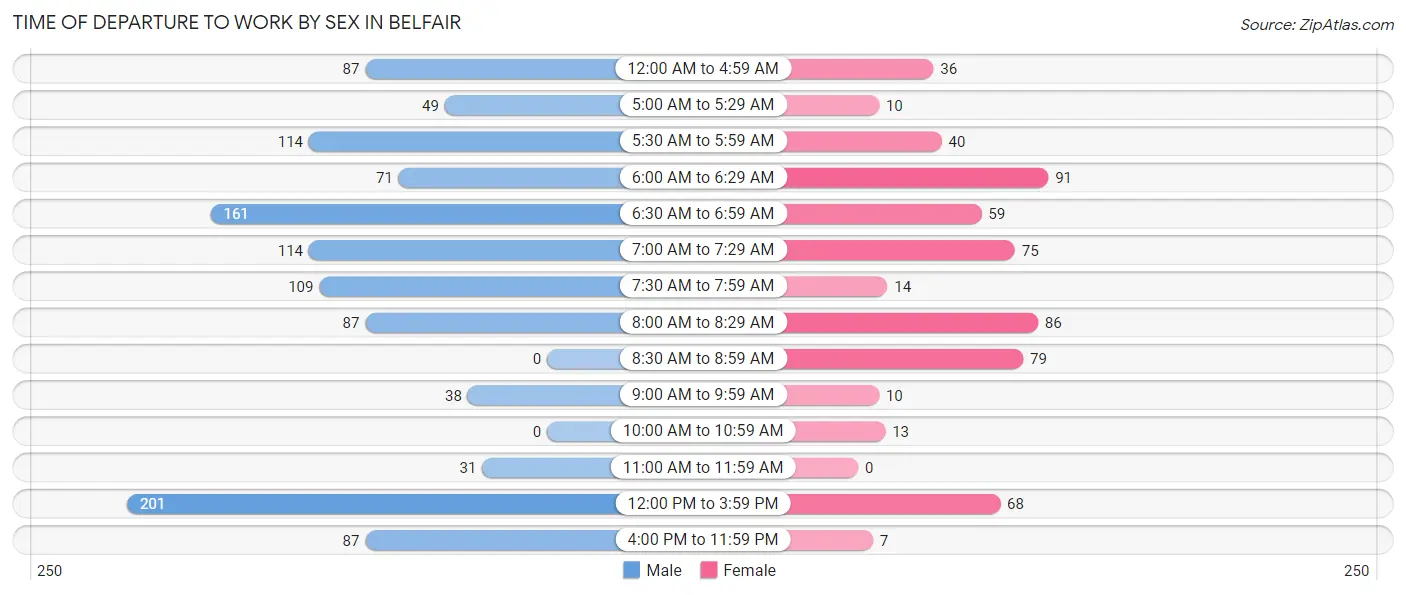
| Time of Departure | Male | Female |
| 12:00 AM to 4:59 AM | 87 (7.6%) | 36 (6.1%) |
| 5:00 AM to 5:29 AM | 49 (4.3%) | 10 (1.7%) |
| 5:30 AM to 5:59 AM | 114 (9.9%) | 40 (6.8%) |
| 6:00 AM to 6:29 AM | 71 (6.2%) | 91 (15.5%) |
| 6:30 AM to 6:59 AM | 161 (14.0%) | 59 (10.0%) |
| 7:00 AM to 7:29 AM | 114 (9.9%) | 75 (12.8%) |
| 7:30 AM to 7:59 AM | 109 (9.5%) | 14 (2.4%) |
| 8:00 AM to 8:29 AM | 87 (7.6%) | 86 (14.6%) |
| 8:30 AM to 8:59 AM | 0 (0.0%) | 79 (13.4%) |
| 9:00 AM to 9:59 AM | 38 (3.3%) | 10 (1.7%) |
| 10:00 AM to 10:59 AM | 0 (0.0%) | 13 (2.2%) |
| 11:00 AM to 11:59 AM | 31 (2.7%) | 0 (0.0%) |
| 12:00 PM to 3:59 PM | 201 (17.5%) | 68 (11.6%) |
| 4:00 PM to 11:59 PM | 87 (7.6%) | 7 (1.2%) |
| Total | 1,149 (100.0%) | 588 (100.0%) |
Housing Occupancy in Belfair
Occupancy by Ownership in Belfair
Of the total 1,771 dwellings in Belfair, owner-occupied units account for 1,245 (70.3%), while renter-occupied units make up 526 (29.7%).
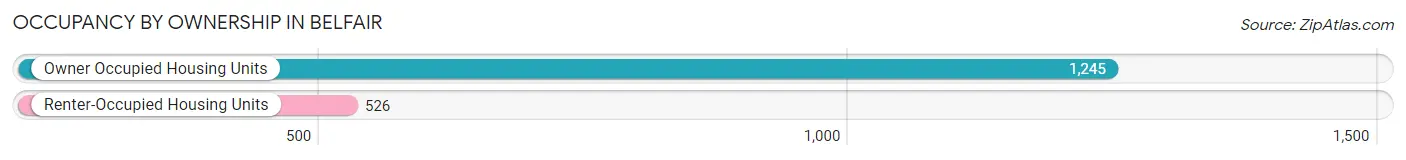
| Occupancy | # Housing Units | % Housing Units |
| Owner Occupied Housing Units | 1,245 | 70.3% |
| Renter-Occupied Housing Units | 526 | 29.7% |
| Total Occupied Housing Units | 1,771 | 100.0% |
Occupancy by Household Size in Belfair
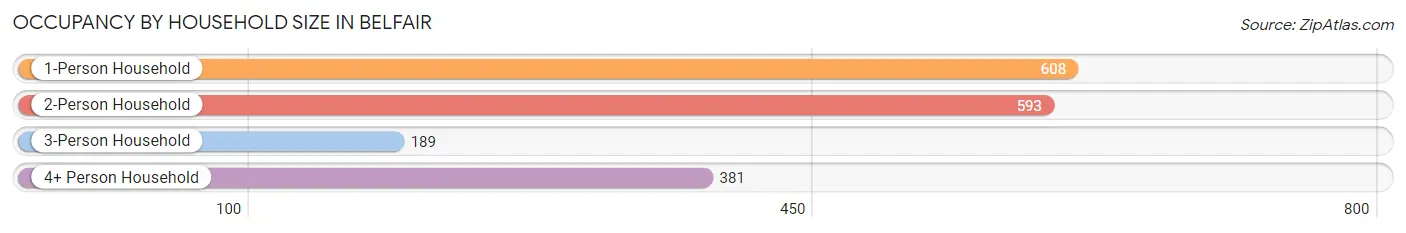
| Household Size | # Housing Units | % Housing Units |
| 1-Person Household | 608 | 34.3% |
| 2-Person Household | 593 | 33.5% |
| 3-Person Household | 189 | 10.7% |
| 4+ Person Household | 381 | 21.5% |
| Total Housing Units | 1,771 | 100.0% |
Occupancy by Ownership by Household Size in Belfair
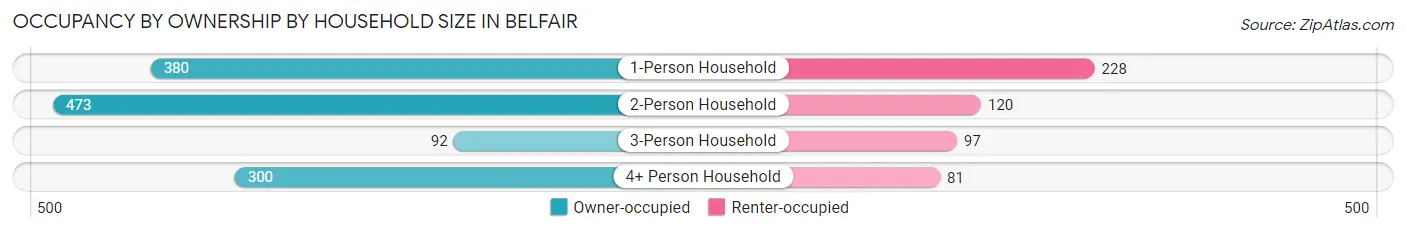
| Household Size | Owner-occupied | Renter-occupied |
| 1-Person Household | 380 (62.5%) | 228 (37.5%) |
| 2-Person Household | 473 (79.8%) | 120 (20.2%) |
| 3-Person Household | 92 (48.7%) | 97 (51.3%) |
| 4+ Person Household | 300 (78.7%) | 81 (21.3%) |
| Total Housing Units | 1,245 (70.3%) | 526 (29.7%) |
Occupancy by Educational Attainment in Belfair
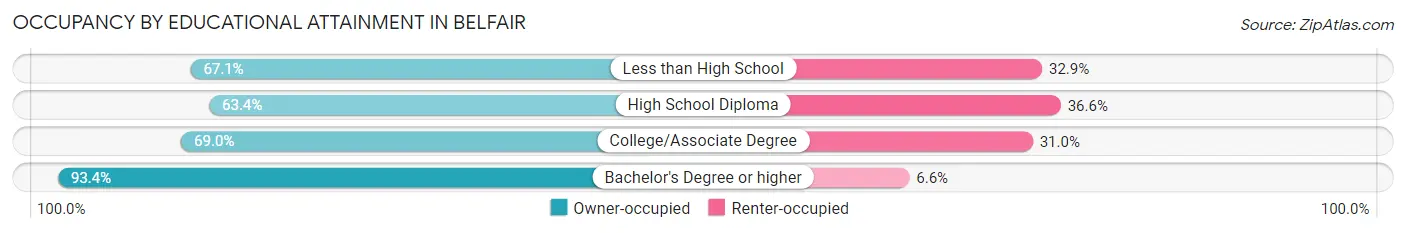
| Household Size | Owner-occupied | Renter-occupied |
| Less than High School | 51 (67.1%) | 25 (32.9%) |
| High School Diploma | 350 (63.4%) | 202 (36.6%) |
| College/Associate Degree | 631 (69.0%) | 284 (31.0%) |
| Bachelor's Degree or higher | 213 (93.4%) | 15 (6.6%) |
Occupancy by Age of Householder in Belfair
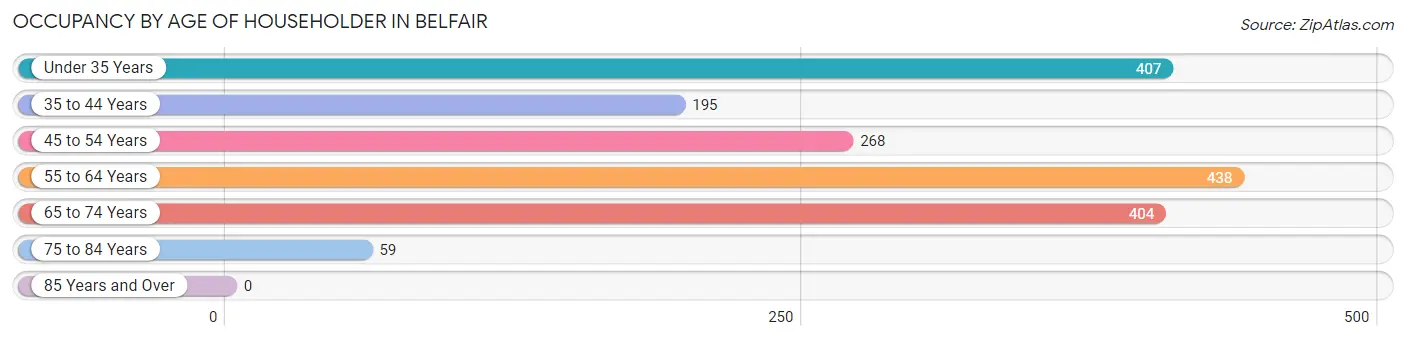
| Age Bracket | # Households | % Households |
| Under 35 Years | 407 | 23.0% |
| 35 to 44 Years | 195 | 11.0% |
| 45 to 54 Years | 268 | 15.1% |
| 55 to 64 Years | 438 | 24.7% |
| 65 to 74 Years | 404 | 22.8% |
| 75 to 84 Years | 59 | 3.3% |
| 85 Years and Over | 0 | 0.0% |
| Total | 1,771 | 100.0% |
Housing Finances in Belfair
Median Income by Occupancy in Belfair
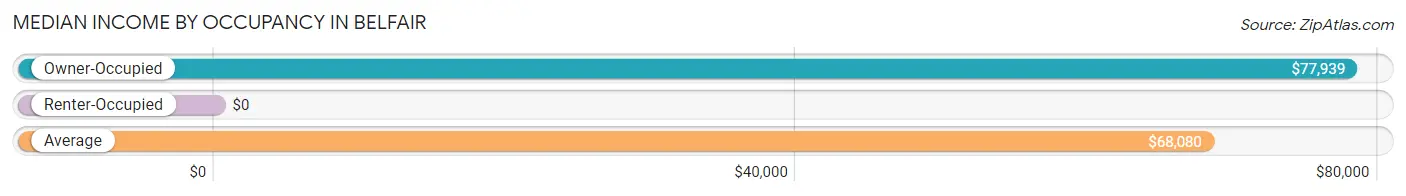
| Occupancy Type | # Households | Median Income |
| Owner-Occupied | 1,245 (70.3%) | $77,939 |
| Renter-Occupied | 526 (29.7%) | $0 |
| Average | 1,771 (100.0%) | $68,080 |
Occupancy by Householder Income Bracket in Belfair
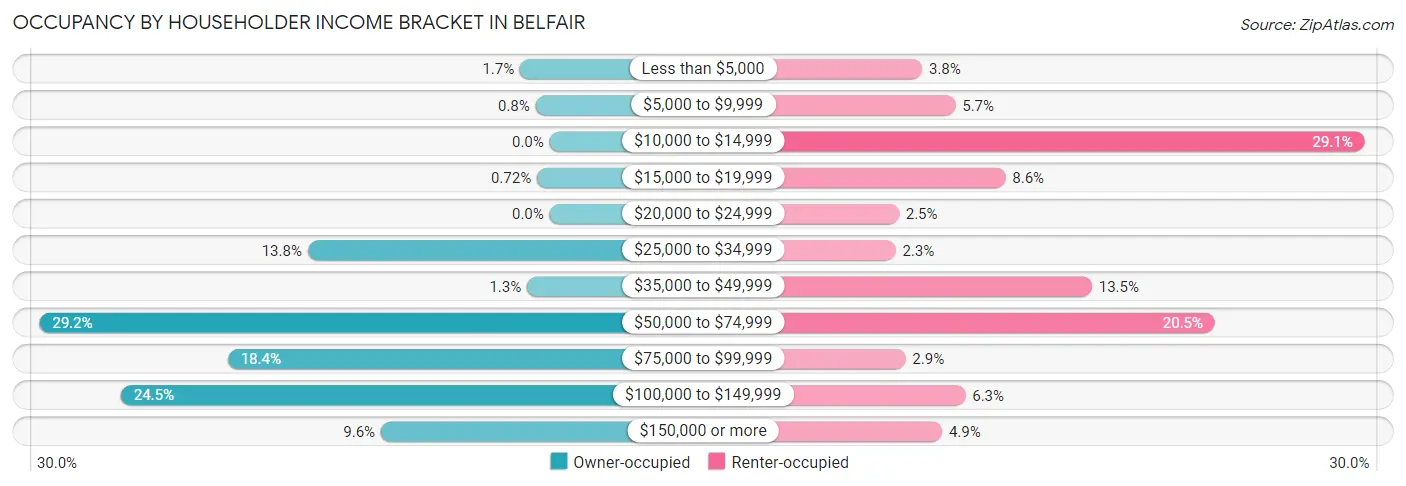
| Income Bracket | Owner-occupied | Renter-occupied |
| Less than $5,000 | 21 (1.7%) | 20 (3.8%) |
| $5,000 to $9,999 | 10 (0.8%) | 30 (5.7%) |
| $10,000 to $14,999 | 0 (0.0%) | 153 (29.1%) |
| $15,000 to $19,999 | 9 (0.7%) | 45 (8.6%) |
| $20,000 to $24,999 | 0 (0.0%) | 13 (2.5%) |
| $25,000 to $34,999 | 172 (13.8%) | 12 (2.3%) |
| $35,000 to $49,999 | 16 (1.3%) | 71 (13.5%) |
| $50,000 to $74,999 | 363 (29.2%) | 108 (20.5%) |
| $75,000 to $99,999 | 229 (18.4%) | 15 (2.9%) |
| $100,000 to $149,999 | 305 (24.5%) | 33 (6.3%) |
| $150,000 or more | 120 (9.6%) | 26 (4.9%) |
| Total | 1,245 (100.0%) | 526 (100.0%) |
Monthly Housing Cost Tiers in Belfair
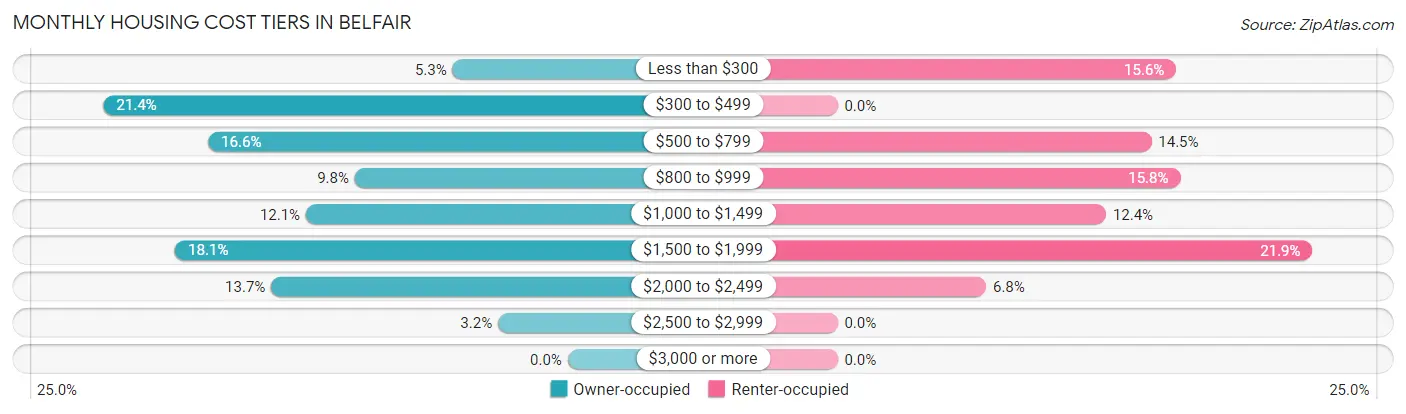
| Monthly Cost | Owner-occupied | Renter-occupied |
| Less than $300 | 66 (5.3%) | 82 (15.6%) |
| $300 to $499 | 266 (21.4%) | 0 (0.0%) |
| $500 to $799 | 206 (16.6%) | 76 (14.4%) |
| $800 to $999 | 122 (9.8%) | 83 (15.8%) |
| $1,000 to $1,499 | 150 (12.0%) | 65 (12.4%) |
| $1,500 to $1,999 | 225 (18.1%) | 115 (21.9%) |
| $2,000 to $2,499 | 170 (13.7%) | 36 (6.8%) |
| $2,500 to $2,999 | 40 (3.2%) | 0 (0.0%) |
| $3,000 or more | 0 (0.0%) | 0 (0.0%) |
| Total | 1,245 (100.0%) | 526 (100.0%) |
Physical Housing Characteristics in Belfair
Housing Structures in Belfair
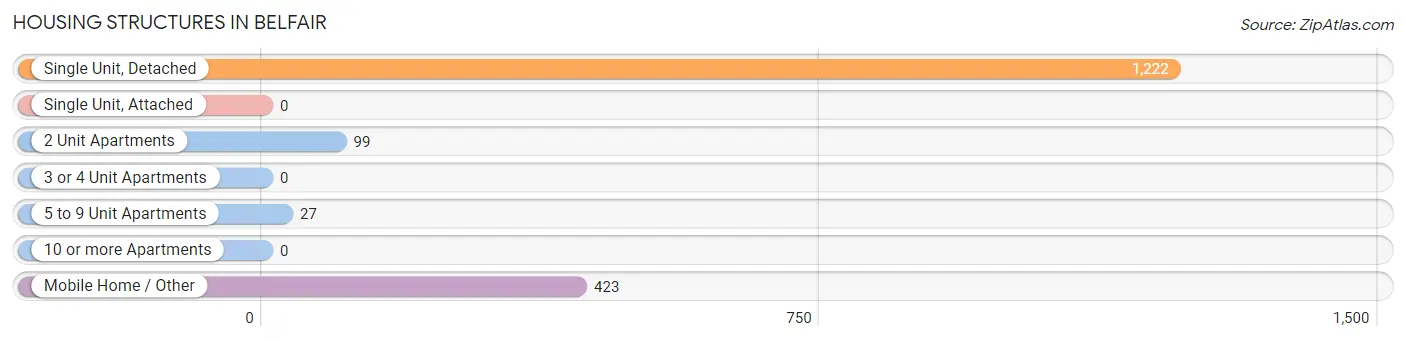
| Structure Type | # Housing Units | % Housing Units |
| Single Unit, Detached | 1,222 | 69.0% |
| Single Unit, Attached | 0 | 0.0% |
| 2 Unit Apartments | 99 | 5.6% |
| 3 or 4 Unit Apartments | 0 | 0.0% |
| 5 to 9 Unit Apartments | 27 | 1.5% |
| 10 or more Apartments | 0 | 0.0% |
| Mobile Home / Other | 423 | 23.9% |
| Total | 1,771 | 100.0% |
Housing Structures by Occupancy in Belfair
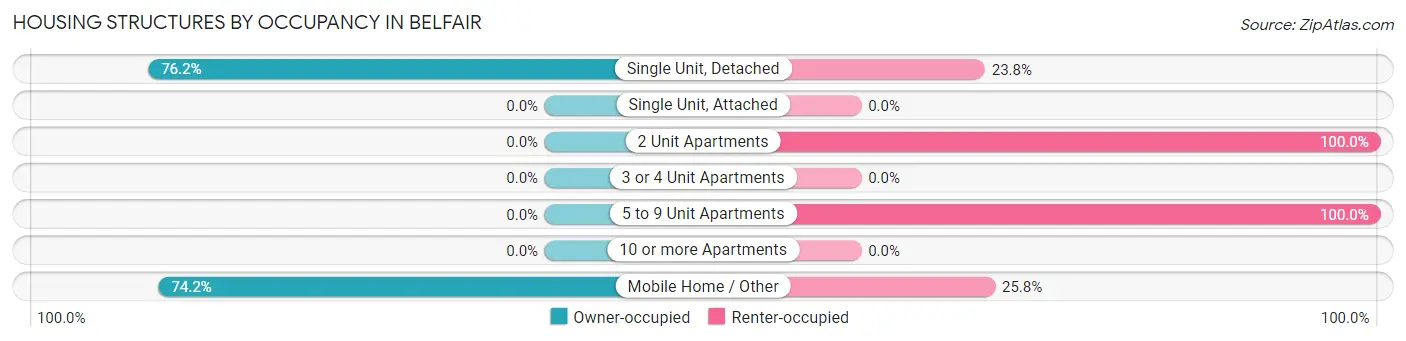
| Structure Type | Owner-occupied | Renter-occupied |
| Single Unit, Detached | 931 (76.2%) | 291 (23.8%) |
| Single Unit, Attached | 0 (0.0%) | 0 (0.0%) |
| 2 Unit Apartments | 0 (0.0%) | 99 (100.0%) |
| 3 or 4 Unit Apartments | 0 (0.0%) | 0 (0.0%) |
| 5 to 9 Unit Apartments | 0 (0.0%) | 27 (100.0%) |
| 10 or more Apartments | 0 (0.0%) | 0 (0.0%) |
| Mobile Home / Other | 314 (74.2%) | 109 (25.8%) |
| Total | 1,245 (70.3%) | 526 (29.7%) |
Housing Structures by Number of Rooms in Belfair
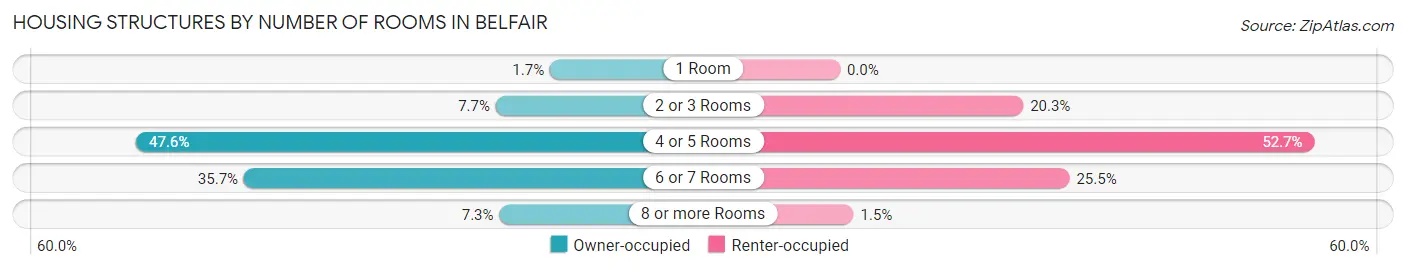
| Number of Rooms | Owner-occupied | Renter-occupied |
| 1 Room | 21 (1.7%) | 0 (0.0%) |
| 2 or 3 Rooms | 96 (7.7%) | 107 (20.3%) |
| 4 or 5 Rooms | 593 (47.6%) | 277 (52.7%) |
| 6 or 7 Rooms | 444 (35.7%) | 134 (25.5%) |
| 8 or more Rooms | 91 (7.3%) | 8 (1.5%) |
| Total | 1,245 (100.0%) | 526 (100.0%) |
Housing Structure by Heating Type in Belfair
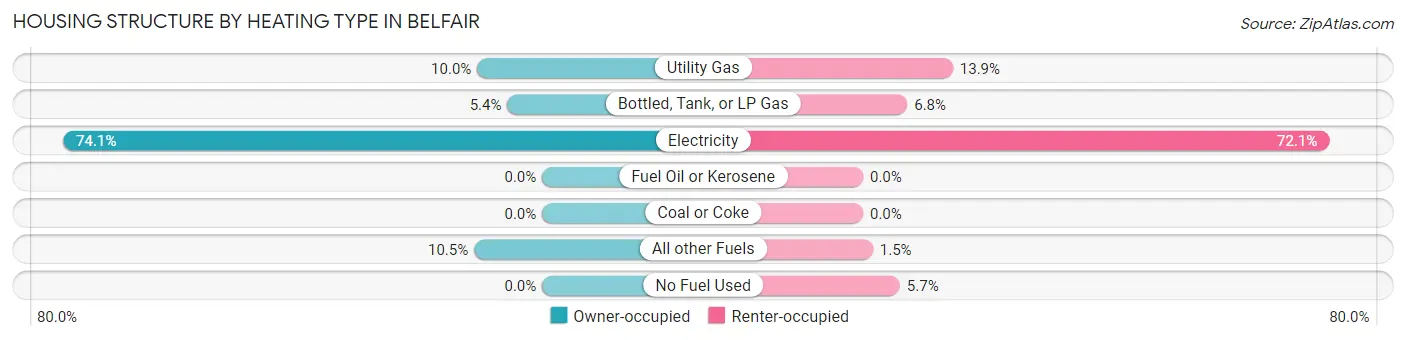
| Heating Type | Owner-occupied | Renter-occupied |
| Utility Gas | 125 (10.0%) | 73 (13.9%) |
| Bottled, Tank, or LP Gas | 67 (5.4%) | 36 (6.8%) |
| Electricity | 922 (74.1%) | 379 (72.1%) |
| Fuel Oil or Kerosene | 0 (0.0%) | 0 (0.0%) |
| Coal or Coke | 0 (0.0%) | 0 (0.0%) |
| All other Fuels | 131 (10.5%) | 8 (1.5%) |
| No Fuel Used | 0 (0.0%) | 30 (5.7%) |
| Total | 1,245 (100.0%) | 526 (100.0%) |
Household Vehicle Usage in Belfair
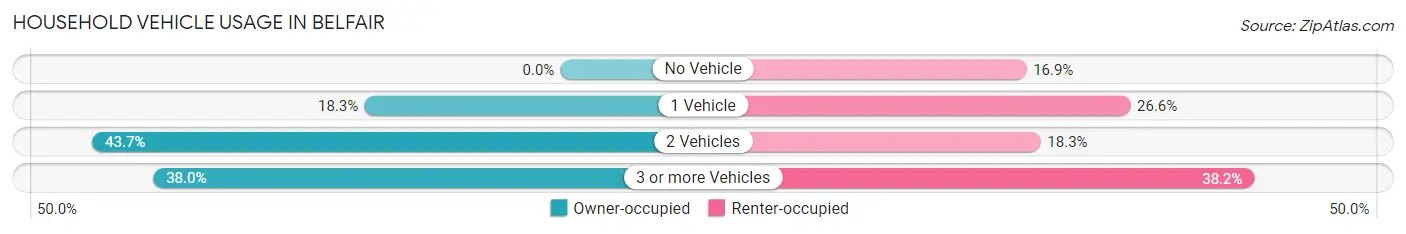
| Vehicles per Household | Owner-occupied | Renter-occupied |
| No Vehicle | 0 (0.0%) | 89 (16.9%) |
| 1 Vehicle | 228 (18.3%) | 140 (26.6%) |
| 2 Vehicles | 544 (43.7%) | 96 (18.2%) |
| 3 or more Vehicles | 473 (38.0%) | 201 (38.2%) |
| Total | 1,245 (100.0%) | 526 (100.0%) |
Real Estate & Mortgages in Belfair
Real Estate and Mortgage Overview in Belfair
| Characteristic | Without Mortgage | With Mortgage |
| Housing Units | 480 | 765 |
| Median Property Value | $239,400 | $267,400 |
| Median Household Income | $67,587 | $69 |
| Monthly Housing Costs | $446 | $0 |
| Real Estate Taxes | $2,271 | $14 |
Property Value by Mortgage Status in Belfair
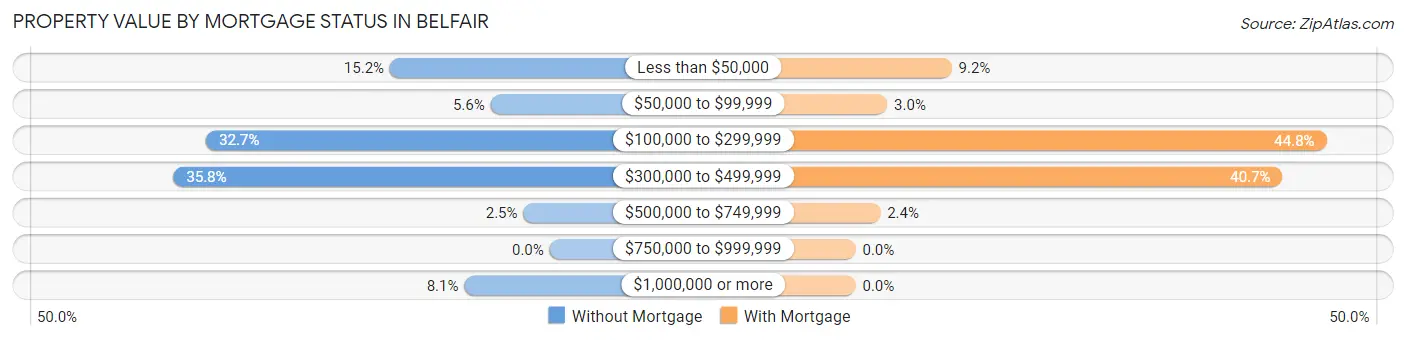
| Property Value | Without Mortgage | With Mortgage |
| Less than $50,000 | 73 (15.2%) | 70 (9.1%) |
| $50,000 to $99,999 | 27 (5.6%) | 23 (3.0%) |
| $100,000 to $299,999 | 157 (32.7%) | 343 (44.8%) |
| $300,000 to $499,999 | 172 (35.8%) | 311 (40.6%) |
| $500,000 to $749,999 | 12 (2.5%) | 18 (2.4%) |
| $750,000 to $999,999 | 0 (0.0%) | 0 (0.0%) |
| $1,000,000 or more | 39 (8.1%) | 0 (0.0%) |
| Total | 480 (100.0%) | 765 (100.0%) |
Household Income by Mortgage Status in Belfair
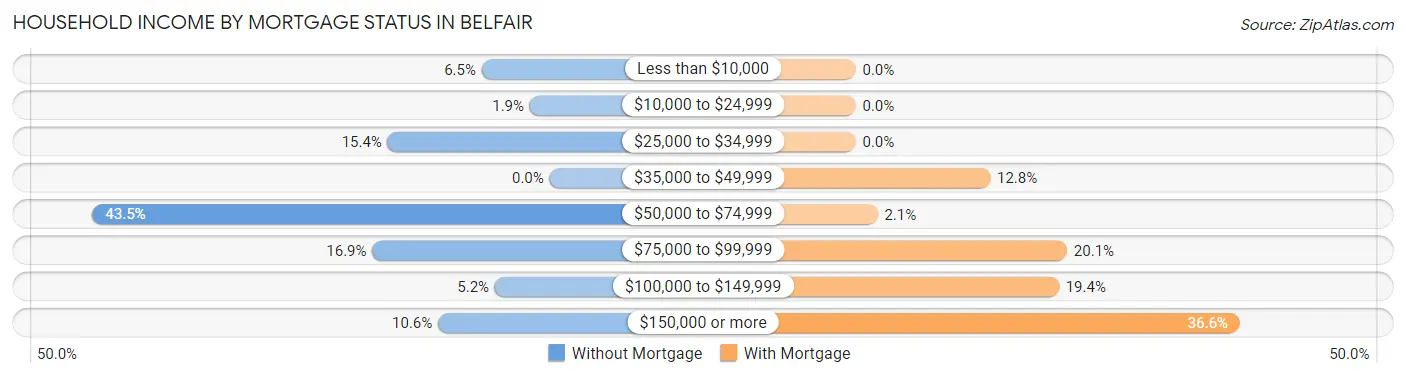
| Household Income | Without Mortgage | With Mortgage |
| Less than $10,000 | 31 (6.5%) | 0 (0.0%) |
| $10,000 to $24,999 | 9 (1.9%) | 0 (0.0%) |
| $25,000 to $34,999 | 74 (15.4%) | 0 (0.0%) |
| $35,000 to $49,999 | 0 (0.0%) | 98 (12.8%) |
| $50,000 to $74,999 | 209 (43.5%) | 16 (2.1%) |
| $75,000 to $99,999 | 81 (16.9%) | 154 (20.1%) |
| $100,000 to $149,999 | 25 (5.2%) | 148 (19.4%) |
| $150,000 or more | 51 (10.6%) | 280 (36.6%) |
| Total | 480 (100.0%) | 765 (100.0%) |
Property Value to Household Income Ratio in Belfair
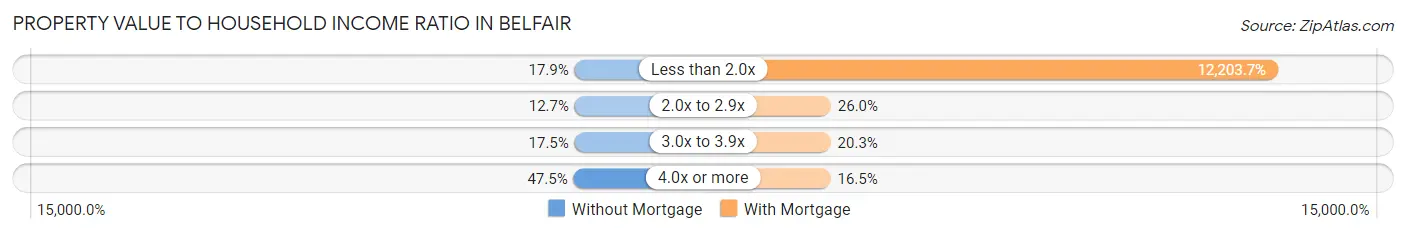
| Value-to-Income Ratio | Without Mortgage | With Mortgage |
| Less than 2.0x | 86 (17.9%) | 93,358 (12,203.7%) |
| 2.0x to 2.9x | 61 (12.7%) | 199 (26.0%) |
| 3.0x to 3.9x | 84 (17.5%) | 155 (20.3%) |
| 4.0x or more | 228 (47.5%) | 126 (16.5%) |
| Total | 480 (100.0%) | 765 (100.0%) |
Real Estate Taxes by Mortgage Status in Belfair
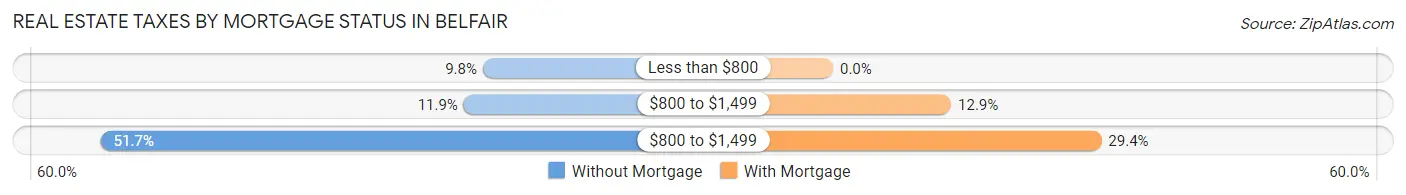
| Property Taxes | Without Mortgage | With Mortgage |
| Less than $800 | 47 (9.8%) | 0 (0.0%) |
| $800 to $1,499 | 57 (11.9%) | 99 (12.9%) |
| $800 to $1,499 | 248 (51.7%) | 225 (29.4%) |
| Total | 480 (100.0%) | 765 (100.0%) |
Health & Disability in Belfair
Health Insurance Coverage by Age in Belfair
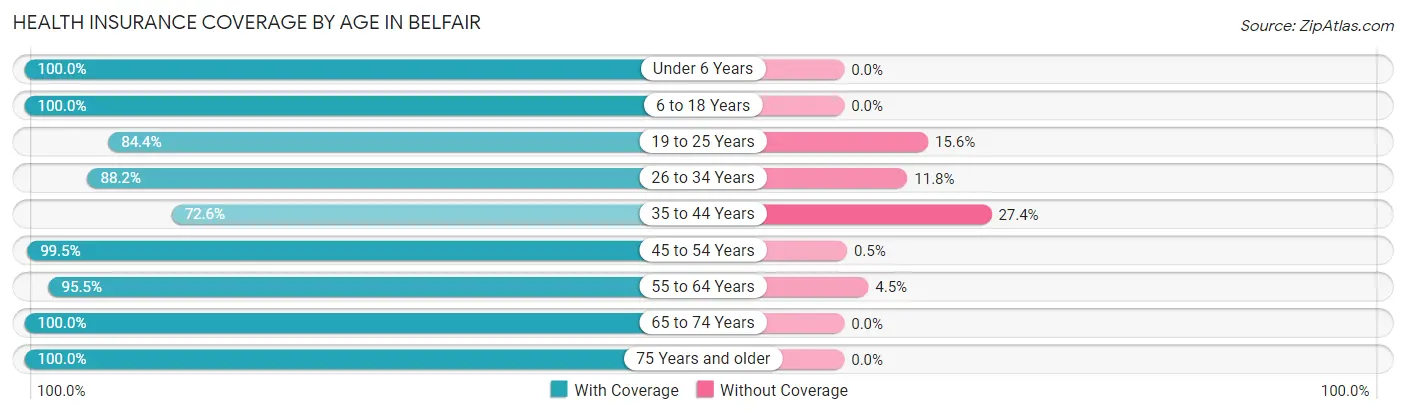
| Age Bracket | With Coverage | Without Coverage |
| Under 6 Years | 352 (100.0%) | 0 (0.0%) |
| 6 to 18 Years | 638 (100.0%) | 0 (0.0%) |
| 19 to 25 Years | 270 (84.4%) | 50 (15.6%) |
| 26 to 34 Years | 675 (88.2%) | 90 (11.8%) |
| 35 to 44 Years | 275 (72.6%) | 104 (27.4%) |
| 45 to 54 Years | 395 (99.5%) | 2 (0.5%) |
| 55 to 64 Years | 619 (95.5%) | 29 (4.5%) |
| 65 to 74 Years | 512 (100.0%) | 0 (0.0%) |
| 75 Years and older | 77 (100.0%) | 0 (0.0%) |
| Total | 3,813 (93.3%) | 275 (6.7%) |
Health Insurance Coverage by Citizenship Status in Belfair
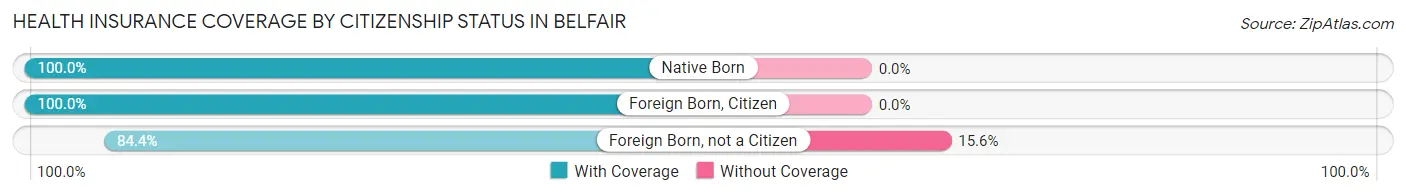
| Citizenship Status | With Coverage | Without Coverage |
| Native Born | 352 (100.0%) | 0 (0.0%) |
| Foreign Born, Citizen | 638 (100.0%) | 0 (0.0%) |
| Foreign Born, not a Citizen | 270 (84.4%) | 50 (15.6%) |
Health Insurance Coverage by Household Income in Belfair
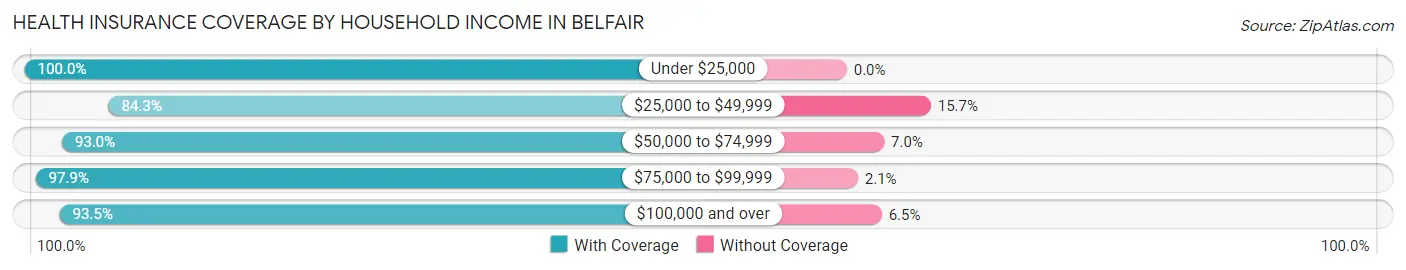
| Household Income | With Coverage | Without Coverage |
| Under $25,000 | 336 (100.0%) | 0 (0.0%) |
| $25,000 to $49,999 | 423 (84.3%) | 79 (15.7%) |
| $50,000 to $74,999 | 1,091 (93.0%) | 82 (7.0%) |
| $75,000 to $99,999 | 474 (97.9%) | 10 (2.1%) |
| $100,000 and over | 1,486 (93.5%) | 104 (6.5%) |
Public vs Private Health Insurance Coverage by Age in Belfair
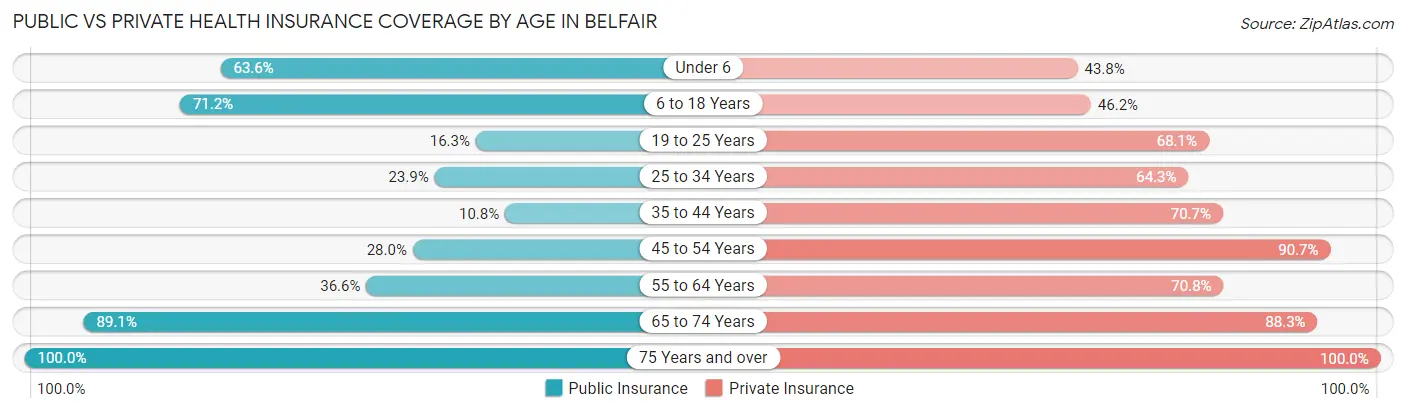
| Age Bracket | Public Insurance | Private Insurance |
| Under 6 | 224 (63.6%) | 154 (43.8%) |
| 6 to 18 Years | 454 (71.2%) | 295 (46.2%) |
| 19 to 25 Years | 52 (16.3%) | 218 (68.1%) |
| 25 to 34 Years | 183 (23.9%) | 492 (64.3%) |
| 35 to 44 Years | 41 (10.8%) | 268 (70.7%) |
| 45 to 54 Years | 111 (28.0%) | 360 (90.7%) |
| 55 to 64 Years | 237 (36.6%) | 459 (70.8%) |
| 65 to 74 Years | 456 (89.1%) | 452 (88.3%) |
| 75 Years and over | 77 (100.0%) | 77 (100.0%) |
| Total | 1,835 (44.9%) | 2,775 (67.9%) |
Disability Status by Sex by Age in Belfair
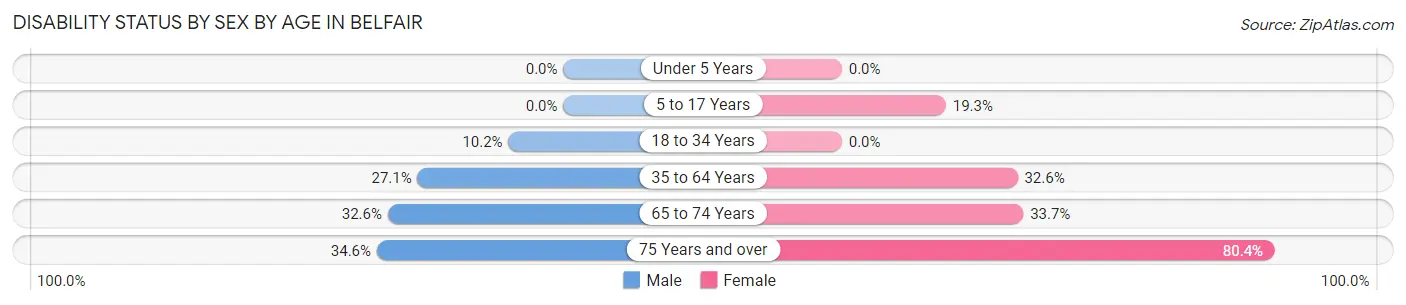
| Age Bracket | Male | Female |
| Under 5 Years | 0 (0.0%) | 0 (0.0%) |
| 5 to 17 Years | 0 (0.0%) | 78 (19.3%) |
| 18 to 34 Years | 76 (10.2%) | 0 (0.0%) |
| 35 to 64 Years | 197 (27.1%) | 227 (32.6%) |
| 65 to 74 Years | 103 (32.6%) | 66 (33.7%) |
| 75 Years and over | 9 (34.6%) | 41 (80.4%) |
Disability Class by Sex by Age in Belfair
Disability Class: Hearing Difficulty
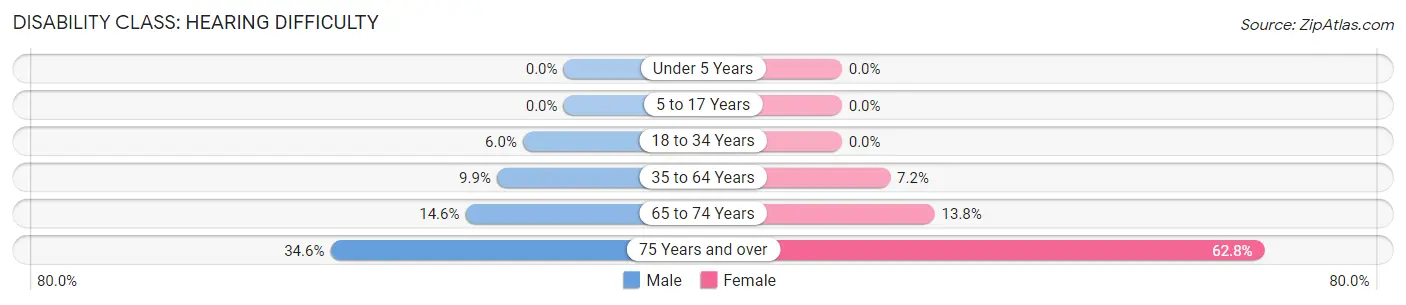
| Age Bracket | Male | Female |
| Under 5 Years | 0 (0.0%) | 0 (0.0%) |
| 5 to 17 Years | 0 (0.0%) | 0 (0.0%) |
| 18 to 34 Years | 45 (6.0%) | 0 (0.0%) |
| 35 to 64 Years | 72 (9.9%) | 50 (7.2%) |
| 65 to 74 Years | 46 (14.6%) | 27 (13.8%) |
| 75 Years and over | 9 (34.6%) | 32 (62.7%) |
Disability Class: Vision Difficulty
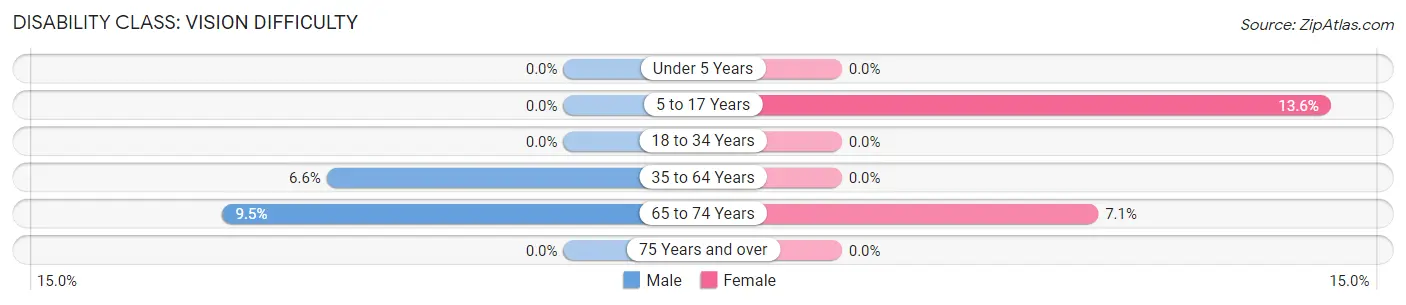
| Age Bracket | Male | Female |
| Under 5 Years | 0 (0.0%) | 0 (0.0%) |
| 5 to 17 Years | 0 (0.0%) | 55 (13.6%) |
| 18 to 34 Years | 0 (0.0%) | 0 (0.0%) |
| 35 to 64 Years | 48 (6.6%) | 0 (0.0%) |
| 65 to 74 Years | 30 (9.5%) | 14 (7.1%) |
| 75 Years and over | 0 (0.0%) | 0 (0.0%) |
Disability Class: Cognitive Difficulty
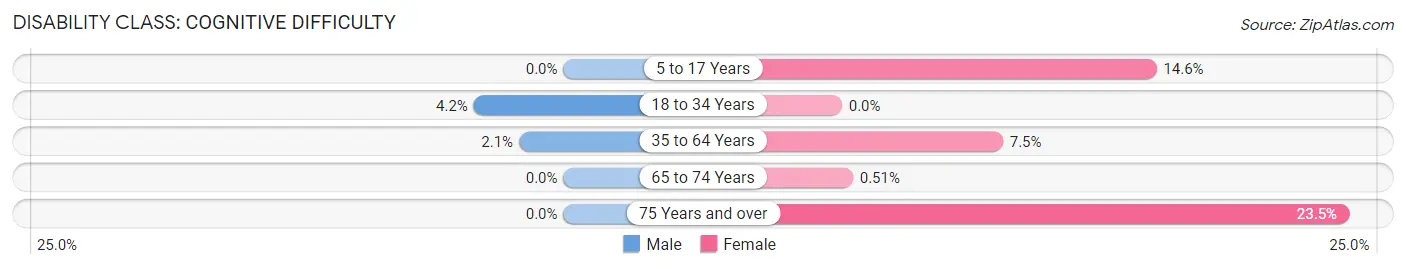
| Age Bracket | Male | Female |
| 5 to 17 Years | 0 (0.0%) | 59 (14.6%) |
| 18 to 34 Years | 31 (4.2%) | 0 (0.0%) |
| 35 to 64 Years | 15 (2.1%) | 52 (7.5%) |
| 65 to 74 Years | 0 (0.0%) | 1 (0.5%) |
| 75 Years and over | 0 (0.0%) | 12 (23.5%) |
Disability Class: Ambulatory Difficulty
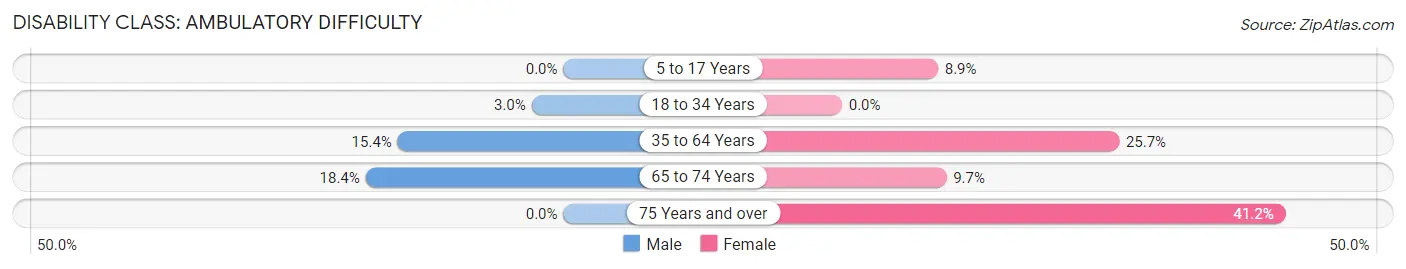
| Age Bracket | Male | Female |
| 5 to 17 Years | 0 (0.0%) | 36 (8.9%) |
| 18 to 34 Years | 22 (2.9%) | 0 (0.0%) |
| 35 to 64 Years | 112 (15.4%) | 179 (25.7%) |
| 65 to 74 Years | 58 (18.3%) | 19 (9.7%) |
| 75 Years and over | 0 (0.0%) | 21 (41.2%) |
Disability Class: Self-Care Difficulty
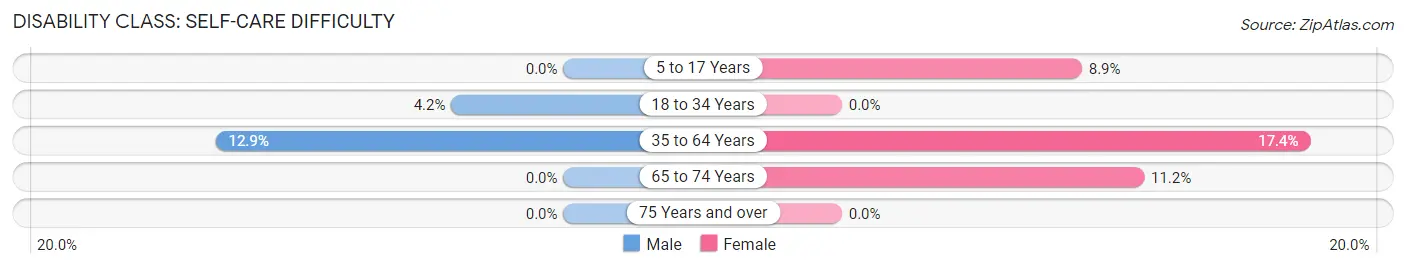
| Age Bracket | Male | Female |
| 5 to 17 Years | 0 (0.0%) | 36 (8.9%) |
| 18 to 34 Years | 31 (4.2%) | 0 (0.0%) |
| 35 to 64 Years | 94 (12.9%) | 121 (17.4%) |
| 65 to 74 Years | 0 (0.0%) | 22 (11.2%) |
| 75 Years and over | 0 (0.0%) | 0 (0.0%) |
Technology Access in Belfair
Computing Device Access in Belfair
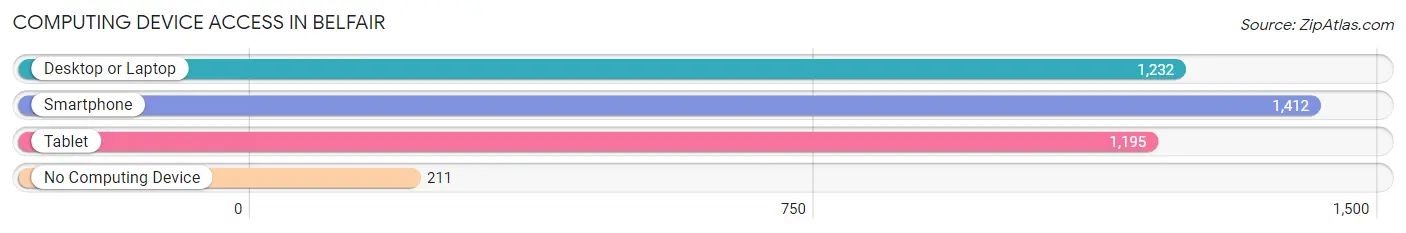
| Device Type | # Households | % Households |
| Desktop or Laptop | 1,232 | 69.6% |
| Smartphone | 1,412 | 79.7% |
| Tablet | 1,195 | 67.5% |
| No Computing Device | 211 | 11.9% |
| Total | 1,771 | 100.0% |
Internet Access in Belfair
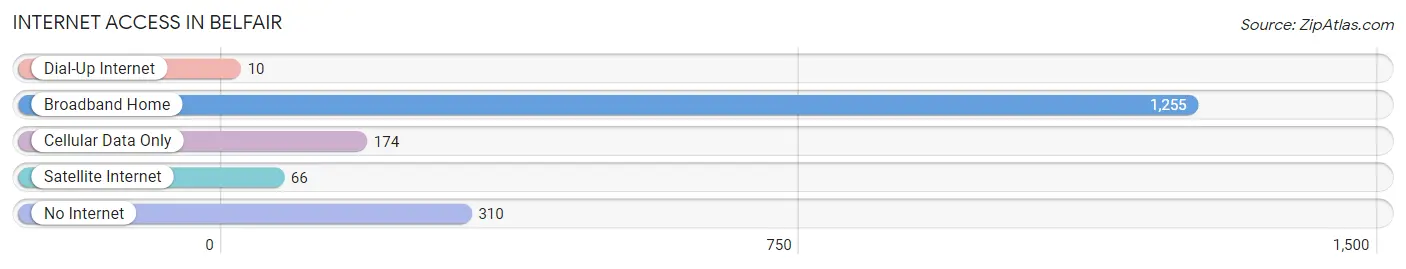
| Internet Type | # Households | % Households |
| Dial-Up Internet | 10 | 0.6% |
| Broadband Home | 1,255 | 70.9% |
| Cellular Data Only | 174 | 9.8% |
| Satellite Internet | 66 | 3.7% |
| No Internet | 310 | 17.5% |
| Total | 1,771 | 100.0% |
Belfair Summary
Belfair is a small unincorporated community located in Mason County, Washington, United States. It is situated on the Hood Canal, a saltwater fjord that separates the Olympic Peninsula from the Kitsap Peninsula. Belfair is located approximately 25 miles (40 km) northwest of Shelton, the county seat, and about 50 miles (80 km) southwest of Seattle. The population of Belfair was estimated to be 2,945 in 2019.
History
The area now known as Belfair was first inhabited by the Twana people, a Coast Salish tribe. The Twana were a semi-nomadic people who lived off the land, fishing, hunting, and gathering. They were known for their basketry and cedar canoes.
The first European settlers arrived in the area in the late 1800s. The town was originally called “Belfair” after the Belfair family, who were among the first settlers. The Belfair family owned a large tract of land in the area and operated a sawmill.
In the early 1900s, the town began to grow as logging and fishing became the primary industries. The town was incorporated in 1911 and the first post office was established in 1912.
Geography
Belfair is located in the foothills of the Olympic Mountains, on the western shore of Hood Canal. The town is situated at an elevation of approximately 100 feet (30 m) above sea level. The climate is mild and temperate, with an average annual temperature of 54°F (12°C).
The town is surrounded by forests and mountains, and is home to several lakes, including Lake Cushman, Lake Kokanee, and Lake Mason. The nearby Tahuya State Forest is a popular destination for camping, hiking, and other outdoor activities.
Economy
The economy of Belfair is largely based on tourism and recreation. The town is home to several marinas, which provide access to the Hood Canal and the Puget Sound. The nearby Tahuya State Forest is a popular destination for camping, hiking, and other outdoor activities.
The town is also home to several businesses, including restaurants, retail stores, and a grocery store. The nearby Hood Canal Bridge provides access to the Kitsap Peninsula and the cities of Bremerton and Silverdale.
Demographics
As of the 2010 census, the population of Belfair was 2,507. The racial makeup of the town was 94.3% White, 0.7% African American, 0.7% Native American, 0.7% Asian, 0.2% Pacific Islander, 0.7% from other races, and 2.5% from two or more races. Hispanic or Latino of any race were 3.2% of the population.
The median income for a household in Belfair was $45,938, and the median income for a family was $50,938. The per capita income for the town was $20,938. About 11.2% of families and 14.2% of the population were below the poverty line, including 18.2% of those under age 18 and 8.2% of those age 65 or over.
Common Questions
What is Per Capita Income in Belfair?
Per Capita income in Belfair is $34,755.
What is the Median Family Income in Belfair?
Median Family Income in Belfair is $69,875.
What is the Median Household income in Belfair?
Median Household Income in Belfair is $68,080.
What is Income or Wage Gap in Belfair?
Income or Wage Gap in Belfair is 34.1%.
Women in Belfair earn 65.9 cents for every dollar earned by a man.
What is Inequality or Gini Index in Belfair?
Inequality or Gini Index in Belfair is 0.44.
What is the Total Population of Belfair?
Total Population of Belfair is 4,175.
What is the Total Male Population of Belfair?
Total Male Population of Belfair is 2,290.
What is the Total Female Population of Belfair?
Total Female Population of Belfair is 1,885.
What is the Ratio of Males per 100 Females in Belfair?
There are 121.49 Males per 100 Females in Belfair.
What is the Ratio of Females per 100 Males in Belfair?
There are 82.31 Females per 100 Males in Belfair.
What is the Median Population Age in Belfair?
Median Population Age in Belfair is 33.4 Years.
What is the Average Family Size in Belfair
Average Family Size in Belfair is 3.1 People.
What is the Average Household Size in Belfair
Average Household Size in Belfair is 2.4 People.
How Large is the Labor Force in Belfair?
There are 1,994 People in the Labor Forcein in Belfair.
What is the Percentage of People in the Labor Force in Belfair?
59.3% of People are in the Labor Force in Belfair.
What is the Unemployment Rate in Belfair?
Unemployment Rate in Belfair is 4.9%.