Elmer City, WA Map & Demographics
Elmer City Map
Elmer City Overview
$28,297
PER CAPITA INCOME
$61,944
AVG FAMILY INCOME
$57,750
AVG HOUSEHOLD INCOME
51.8%
WAGE / INCOME GAP [ % ]
48.2¢/ $1
WAGE / INCOME GAP [ $ ]
0.40
INEQUALITY / GINI INDEX
276
TOTAL POPULATION
119
MALE POPULATION
157
FEMALE POPULATION
75.80
MALES / 100 FEMALES
131.93
FEMALES / 100 MALES
35.0
MEDIAN AGE
2.8
AVG FAMILY SIZE
2.4
AVG HOUSEHOLD SIZE
95
LABOR FORCE [ PEOPLE ]
47.5%
PERCENT IN LABOR FORCE
5.3%
UNEMPLOYMENT RATE
Elmer City Zip Codes
Elmer City Area Codes
Income in Elmer City
Income Overview in Elmer City
Per Capita Income in Elmer City is $28,297, while median incomes of families and households are $61,944 and $57,750 respectively.
| Characteristic | Number | Measure |
| Per Capita Income | 276 | $28,297 |
| Median Family Income | 80 | $61,944 |
| Mean Family Income | 80 | $76,898 |
| Median Household Income | 113 | $57,750 |
| Mean Household Income | 113 | $69,063 |
| Income Deficit | 80 | $0 |
| Wage / Income Gap (%) | 276 | 51.77% |
| Wage / Income Gap ($) | 276 | 48.23¢ per $1 |
| Gini / Inequality Index | 276 | 0.40 |
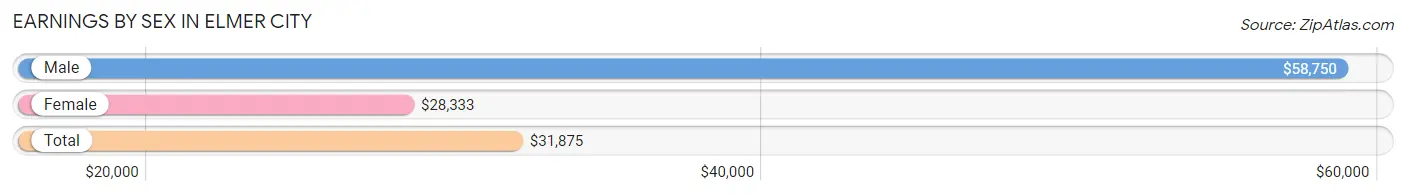
Earnings by Sex in Elmer City
Average Earnings in Elmer City are $31,875, $58,750 for men and $28,333 for women, a difference of 51.8%.
| Sex | Number | Average Earnings |
| Male | 44 (42.3%) | $58,750 |
| Female | 60 (57.7%) | $28,333 |
| Total | 104 (100.0%) | $31,875 |
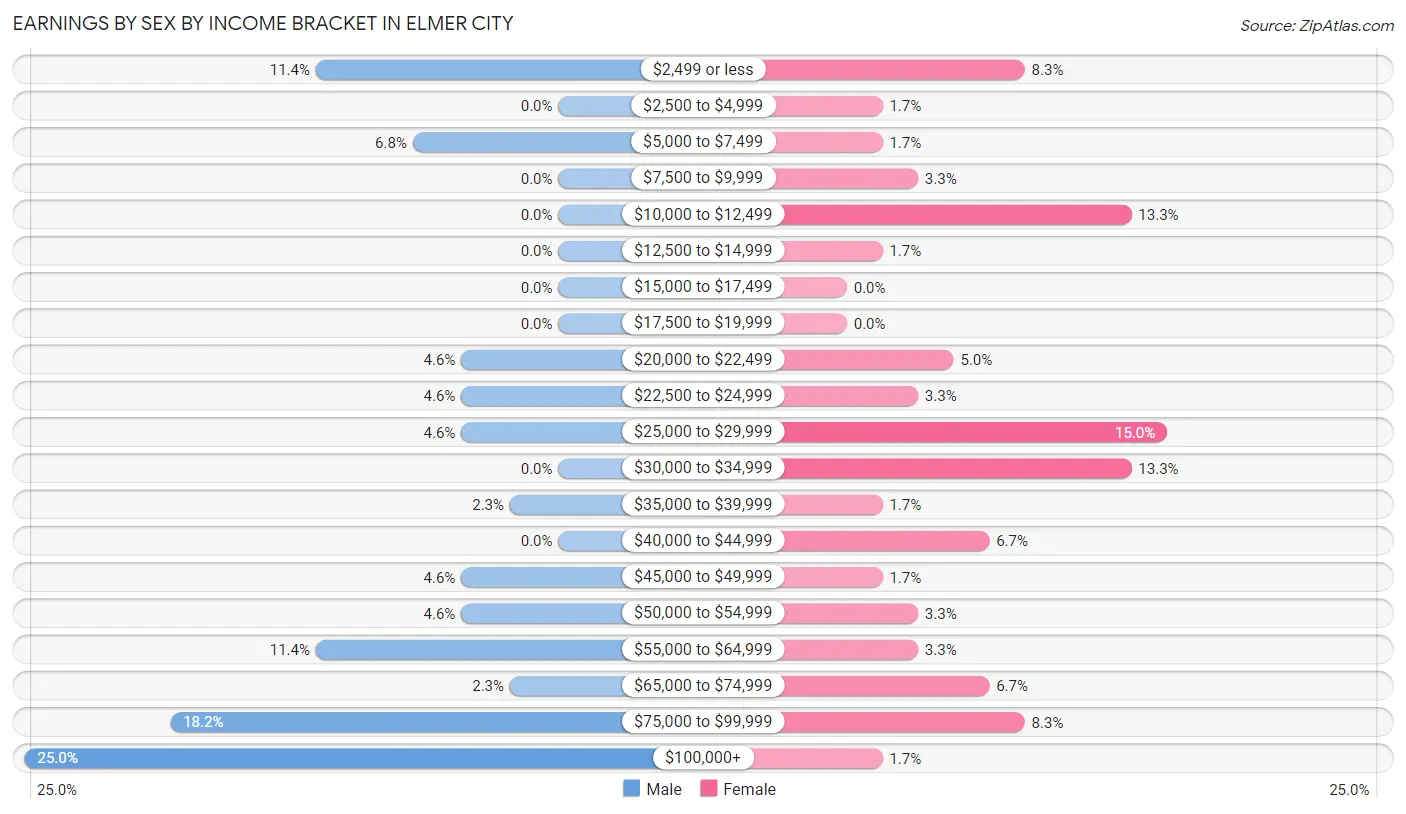
Earnings by Sex by Income Bracket in Elmer City
The most common earnings brackets in Elmer City are $100,000+ for men (11 | 25.0%) and $25,000 to $29,999 for women (9 | 15.0%).
| Income | Male | Female |
| $2,499 or less | 5 (11.4%) | 5 (8.3%) |
| $2,500 to $4,999 | 0 (0.0%) | 1 (1.7%) |
| $5,000 to $7,499 | 3 (6.8%) | 1 (1.7%) |
| $7,500 to $9,999 | 0 (0.0%) | 2 (3.3%) |
| $10,000 to $12,499 | 0 (0.0%) | 8 (13.3%) |
| $12,500 to $14,999 | 0 (0.0%) | 1 (1.7%) |
| $15,000 to $17,499 | 0 (0.0%) | 0 (0.0%) |
| $17,500 to $19,999 | 0 (0.0%) | 0 (0.0%) |
| $20,000 to $22,499 | 2 (4.5%) | 3 (5.0%) |
| $22,500 to $24,999 | 2 (4.5%) | 2 (3.3%) |
| $25,000 to $29,999 | 2 (4.5%) | 9 (15.0%) |
| $30,000 to $34,999 | 0 (0.0%) | 8 (13.3%) |
| $35,000 to $39,999 | 1 (2.3%) | 1 (1.7%) |
| $40,000 to $44,999 | 0 (0.0%) | 4 (6.7%) |
| $45,000 to $49,999 | 2 (4.5%) | 1 (1.7%) |
| $50,000 to $54,999 | 2 (4.5%) | 2 (3.3%) |
| $55,000 to $64,999 | 5 (11.4%) | 2 (3.3%) |
| $65,000 to $74,999 | 1 (2.3%) | 4 (6.7%) |
| $75,000 to $99,999 | 8 (18.2%) | 5 (8.3%) |
| $100,000+ | 11 (25.0%) | 1 (1.7%) |
| Total | 44 (100.0%) | 60 (100.0%) |
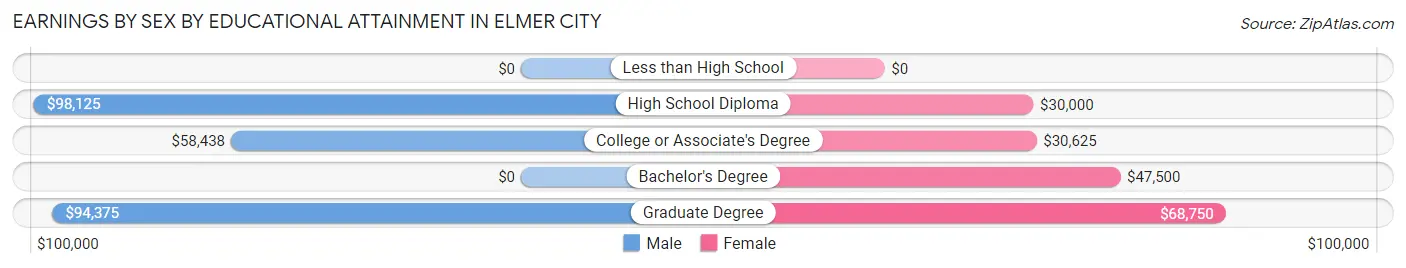
Earnings by Sex by Educational Attainment in Elmer City
Average earnings in Elmer City are $81,250 for men and $30,781 for women, a difference of 62.1%. Men with an educational attainment of high school diploma enjoy the highest average annual earnings of $98,125, while those with college or associate's degree education earn the least with $58,438. Women with an educational attainment of graduate degree earn the most with the average annual earnings of $68,750, while those with high school diploma education have the smallest earnings of $30,000.
| Educational Attainment | Male Income | Female Income |
| Less than High School | - | - |
| High School Diploma | $98,125 | $30,000 |
| College or Associate's Degree | $58,438 | $30,625 |
| Bachelor's Degree | - | - |
| Graduate Degree | $94,375 | $68,750 |
| Total | $81,250 | $30,781 |
Family Income in Elmer City
Family Income Brackets in Elmer City
According to the Elmer City family income data, there are 22 families falling into the $50,000 to $74,999 income range, which is the most common income bracket and makes up 27.5% of all families.
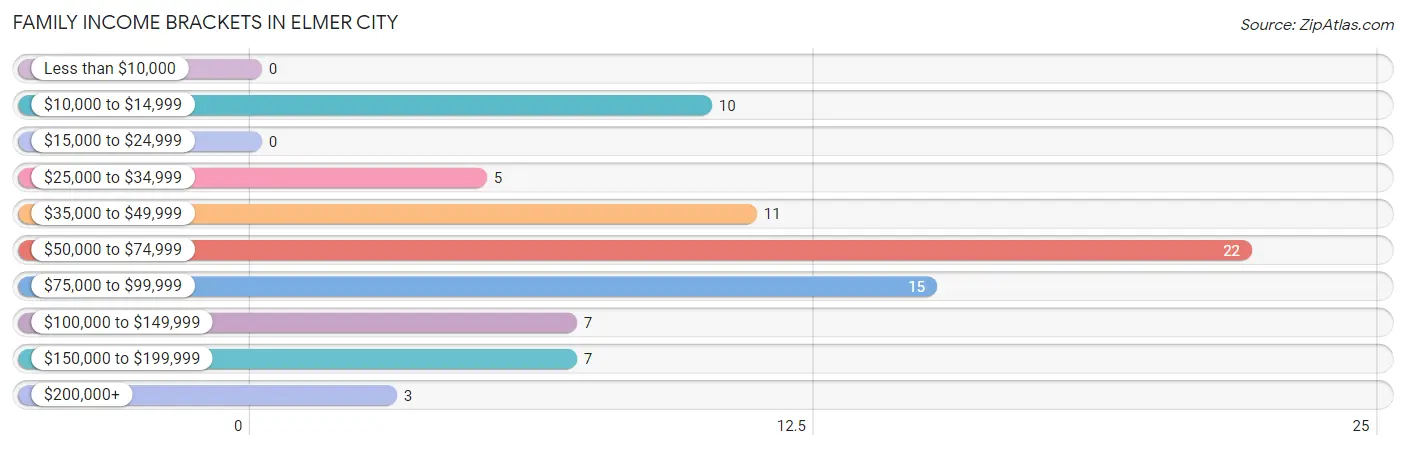
| Income Bracket | # Families | % Families |
| Less than $10,000 | 0 | 0.0% |
| $10,000 to $14,999 | 10 | 12.5% |
| $15,000 to $24,999 | 0 | 0.0% |
| $25,000 to $34,999 | 5 | 6.3% |
| $35,000 to $49,999 | 11 | 13.8% |
| $50,000 to $74,999 | 22 | 27.5% |
| $75,000 to $99,999 | 15 | 18.8% |
| $100,000 to $149,999 | 7 | 8.8% |
| $150,000 to $199,999 | 7 | 8.8% |
| $200,000+ | 3 | 3.8% |
Family Income by Famaliy Size in Elmer City
5-person families (8 | 10.0%) account for the highest median family income in Elmer City with $98,750 per family, while 2-person families (39 | 48.7%) have the highest median income of $27,188 per family member.
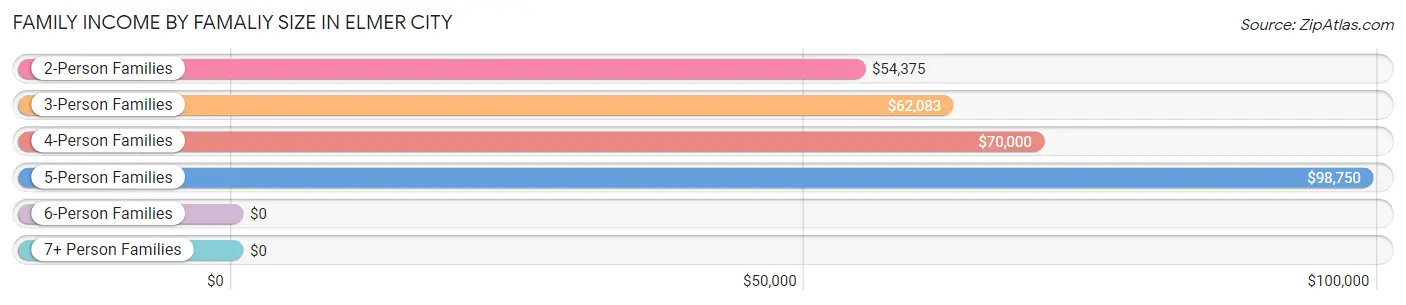
| Income Bracket | # Families | Median Income |
| 2-Person Families | 39 (48.7%) | $54,375 |
| 3-Person Families | 21 (26.3%) | $62,083 |
| 4-Person Families | 6 (7.5%) | $70,000 |
| 5-Person Families | 8 (10.0%) | $98,750 |
| 6-Person Families | 5 (6.2%) | $0 |
| 7+ Person Families | 1 (1.3%) | $0 |
| Total | 80 (100.0%) | $61,944 |
Family Income by Number of Earners in Elmer City
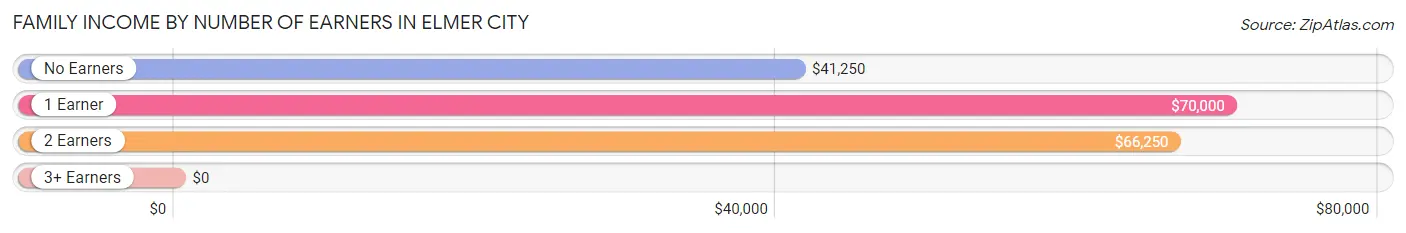
| Number of Earners | # Families | Median Income |
| No Earners | 22 (27.5%) | $41,250 |
| 1 Earner | 26 (32.5%) | $70,000 |
| 2 Earners | 32 (40.0%) | $66,250 |
| 3+ Earners | 0 (0.0%) | $0 |
| Total | 80 (100.0%) | $61,944 |
Household Income in Elmer City
Household Income Brackets in Elmer City
With 32 households falling in the category, the $50,000 to $74,999 income range is the most frequent in Elmer City, accounting for 28.3% of all households. In contrast, only 3 households (2.6%) fall into the less than $10,000 income bracket, making it the least populous group.
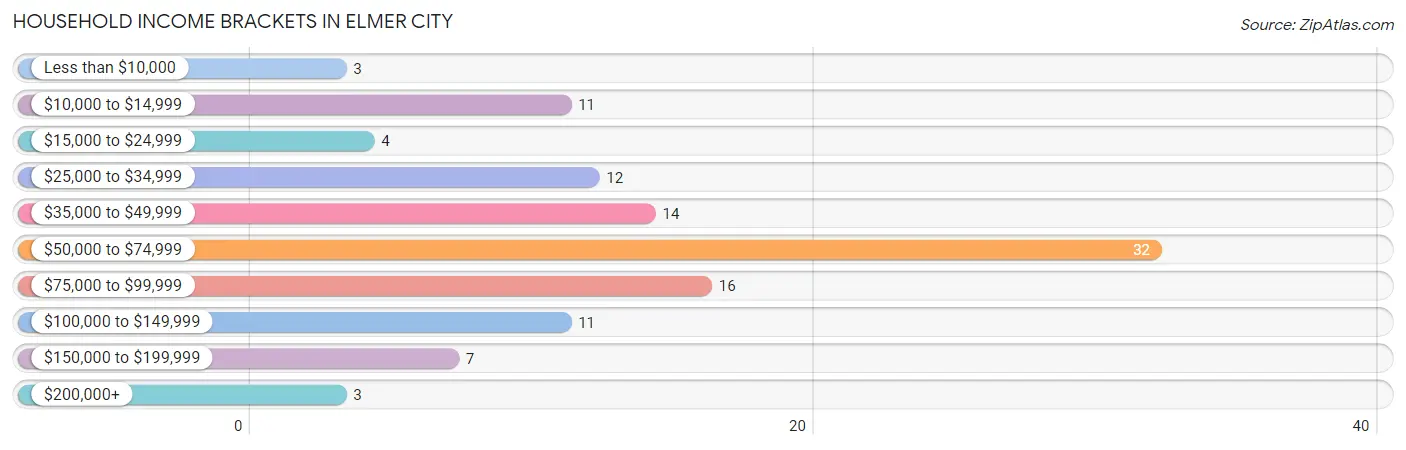
| Income Bracket | # Households | % Households |
| Less than $10,000 | 3 | 2.7% |
| $10,000 to $14,999 | 11 | 9.7% |
| $15,000 to $24,999 | 4 | 3.5% |
| $25,000 to $34,999 | 12 | 10.6% |
| $35,000 to $49,999 | 14 | 12.4% |
| $50,000 to $74,999 | 32 | 28.3% |
| $75,000 to $99,999 | 16 | 14.2% |
| $100,000 to $149,999 | 11 | 9.7% |
| $150,000 to $199,999 | 7 | 6.2% |
| $200,000+ | 3 | 2.7% |
Household Income by Householder Age in Elmer City
The median household income in Elmer City is $57,750, with the highest median household income of $65,000 found in the 45 to 64 years age bracket for the primary householder. A total of 30 households (26.6%) fall into this category. Meanwhile, the 15 to 24 years age bracket for the primary householder has the lowest median household income of $0, with 9 households (8.0%) in this group.
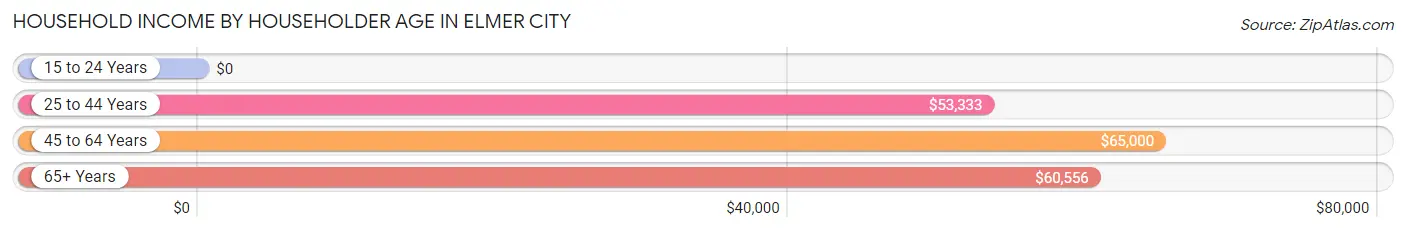
| Income Bracket | # Households | Median Income |
| 15 to 24 Years | 9 (8.0%) | $0 |
| 25 to 44 Years | 24 (21.2%) | $53,333 |
| 45 to 64 Years | 30 (26.6%) | $65,000 |
| 65+ Years | 50 (44.3%) | $60,556 |
| Total | 113 (100.0%) | $57,750 |
Poverty in Elmer City
Income Below Poverty by Sex and Age in Elmer City
With 16.5% poverty level for males and 17.3% for females among the residents of Elmer City, 6 to 11 year old males and 18 to 24 year old females are the most vulnerable to poverty, with 7 males (87.5%) and 9 females (64.3%) in their respective age groups living below the poverty level.
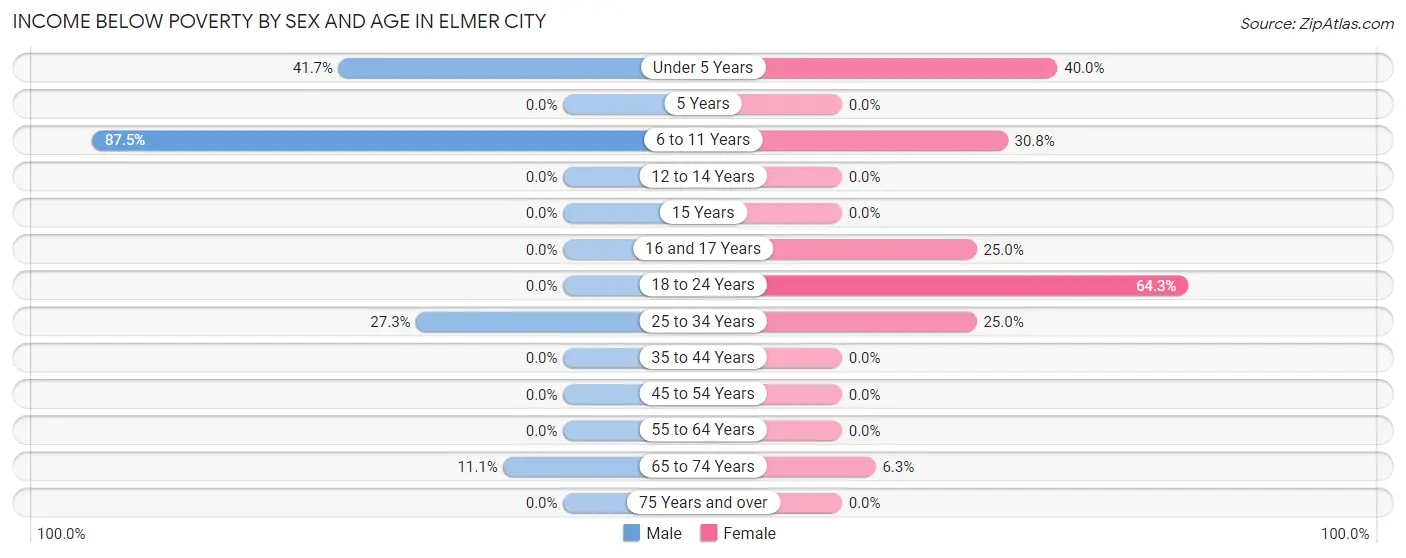
| Age Bracket | Male | Female |
| Under 5 Years | 5 (41.7%) | 6 (40.0%) |
| 5 Years | 0 (0.0%) | 0 (0.0%) |
| 6 to 11 Years | 7 (87.5%) | 4 (30.8%) |
| 12 to 14 Years | 0 (0.0%) | 0 (0.0%) |
| 15 Years | 0 (0.0%) | 0 (0.0%) |
| 16 and 17 Years | 0 (0.0%) | 1 (25.0%) |
| 18 to 24 Years | 0 (0.0%) | 9 (64.3%) |
| 25 to 34 Years | 3 (27.3%) | 6 (25.0%) |
| 35 to 44 Years | 0 (0.0%) | 0 (0.0%) |
| 45 to 54 Years | 0 (0.0%) | 0 (0.0%) |
| 55 to 64 Years | 0 (0.0%) | 0 (0.0%) |
| 65 to 74 Years | 3 (11.1%) | 1 (6.2%) |
| 75 Years and over | 0 (0.0%) | 0 (0.0%) |
| Total | 18 (16.5%) | 27 (17.3%) |
Income Above Poverty by Sex and Age in Elmer City
According to the poverty statistics in Elmer City, males aged 5 years and females aged 12 to 14 years are the age groups that are most secure financially, with 100.0% of males and 100.0% of females in these age groups living above the poverty line.
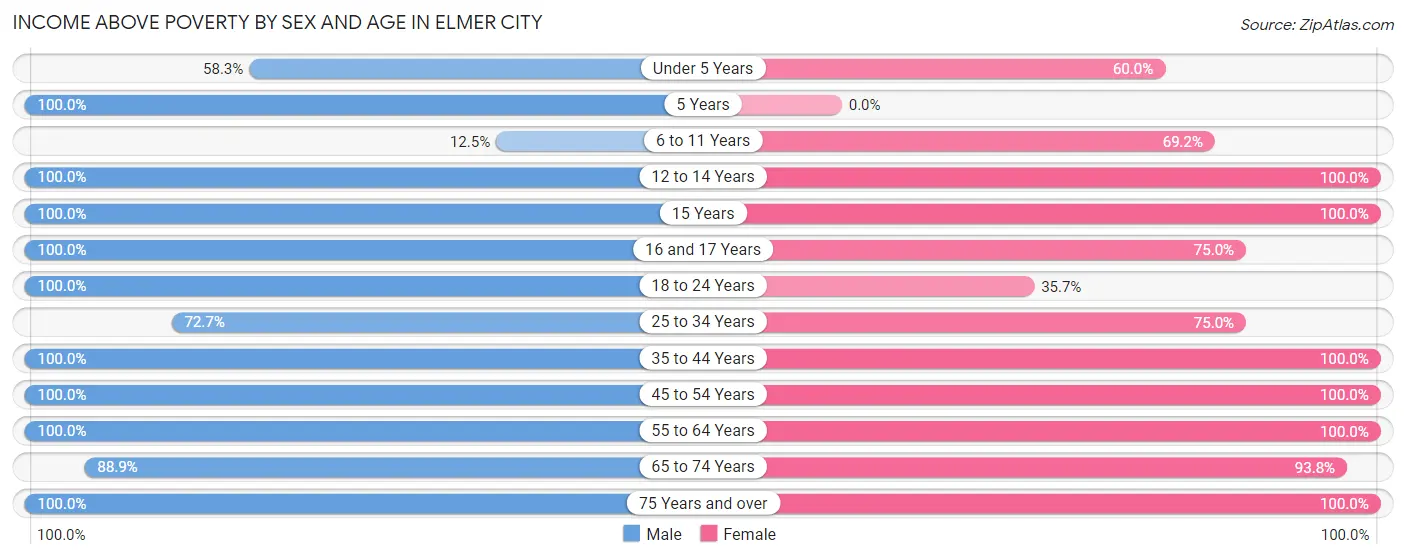
| Age Bracket | Male | Female |
| Under 5 Years | 7 (58.3%) | 9 (60.0%) |
| 5 Years | 2 (100.0%) | 0 (0.0%) |
| 6 to 11 Years | 1 (12.5%) | 9 (69.2%) |
| 12 to 14 Years | 7 (100.0%) | 4 (100.0%) |
| 15 Years | 1 (100.0%) | 3 (100.0%) |
| 16 and 17 Years | 4 (100.0%) | 3 (75.0%) |
| 18 to 24 Years | 5 (100.0%) | 5 (35.7%) |
| 25 to 34 Years | 8 (72.7%) | 18 (75.0%) |
| 35 to 44 Years | 6 (100.0%) | 9 (100.0%) |
| 45 to 54 Years | 13 (100.0%) | 13 (100.0%) |
| 55 to 64 Years | 7 (100.0%) | 17 (100.0%) |
| 65 to 74 Years | 24 (88.9%) | 15 (93.8%) |
| 75 Years and over | 6 (100.0%) | 24 (100.0%) |
| Total | 91 (83.5%) | 129 (82.7%) |
Income Below Poverty Among Married-Couple Families in Elmer City
The poverty statistics for married-couple families in Elmer City show that 5.1% or 2 of the total 39 families live below the poverty line. Families with no children have the highest poverty rate of 7.1%, comprising of 2 families. On the other hand, families with 1 or 2 children have the lowest poverty rate of 0.0%, which includes 0 families.
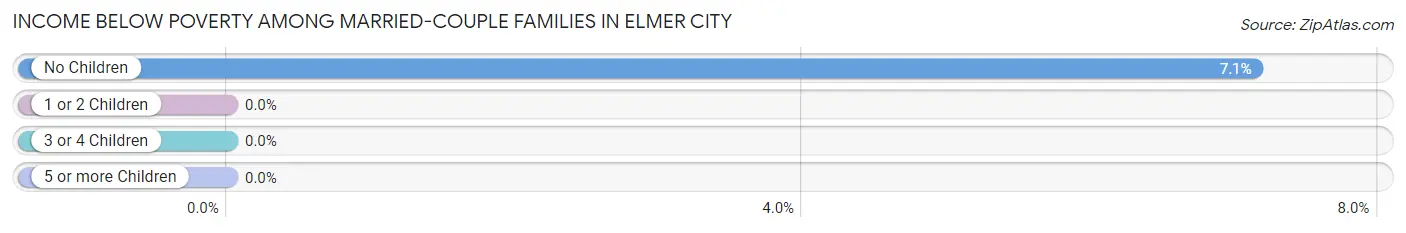
| Children | Above Poverty | Below Poverty |
| No Children | 26 (92.9%) | 2 (7.1%) |
| 1 or 2 Children | 5 (100.0%) | 0 (0.0%) |
| 3 or 4 Children | 6 (100.0%) | 0 (0.0%) |
| 5 or more Children | 0 (0.0%) | 0 (0.0%) |
| Total | 37 (94.9%) | 2 (5.1%) |
Income Below Poverty Among Single-Parent Households in Elmer City
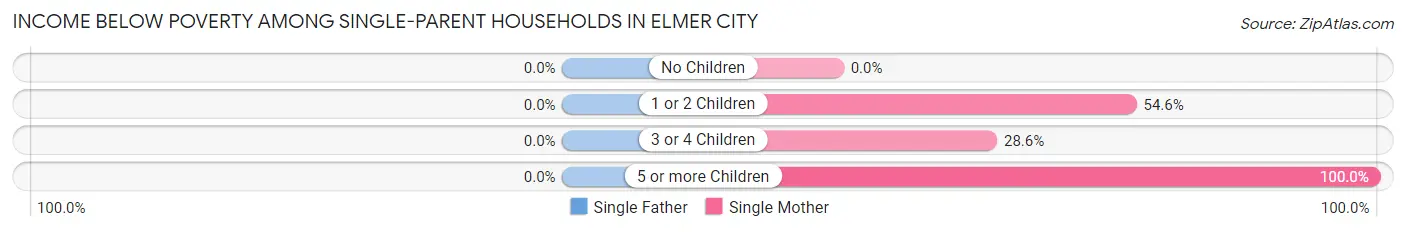
| Children | Single Father | Single Mother |
| No Children | 0 (0.0%) | 0 (0.0%) |
| 1 or 2 Children | 0 (0.0%) | 6 (54.5%) |
| 3 or 4 Children | 0 (0.0%) | 2 (28.6%) |
| 5 or more Children | 0 (0.0%) | 4 (100.0%) |
| Total | 0 (0.0%) | 12 (32.4%) |
Income Below Poverty Among Married-Couple vs Single-Parent Households in Elmer City
The poverty data for Elmer City shows that 2 of the married-couple family households (5.1%) and 12 of the single-parent households (29.3%) are living below the poverty level. Within the married-couple family households, those with no children have the highest poverty rate, with 2 households (7.1%) falling below the poverty line. Among the single-parent households, those with 5 or more children have the highest poverty rate, with 4 household (100.0%) living below poverty.
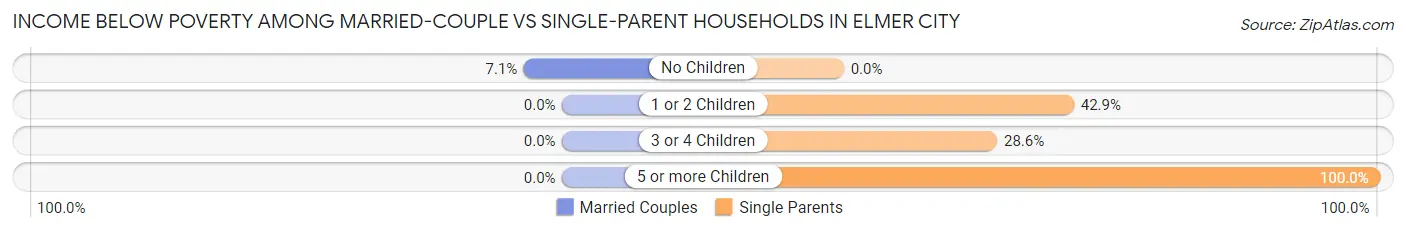
| Children | Married-Couple Families | Single-Parent Households |
| No Children | 2 (7.1%) | 0 (0.0%) |
| 1 or 2 Children | 0 (0.0%) | 6 (42.9%) |
| 3 or 4 Children | 0 (0.0%) | 2 (28.6%) |
| 5 or more Children | 0 (0.0%) | 4 (100.0%) |
| Total | 2 (5.1%) | 12 (29.3%) |
Race in Elmer City
The most populous races in Elmer City are White / Caucasian (133 | 48.2%), Native / Alaskan (119 | 43.1%), and Hispanic or Latino (25 | 9.1%).
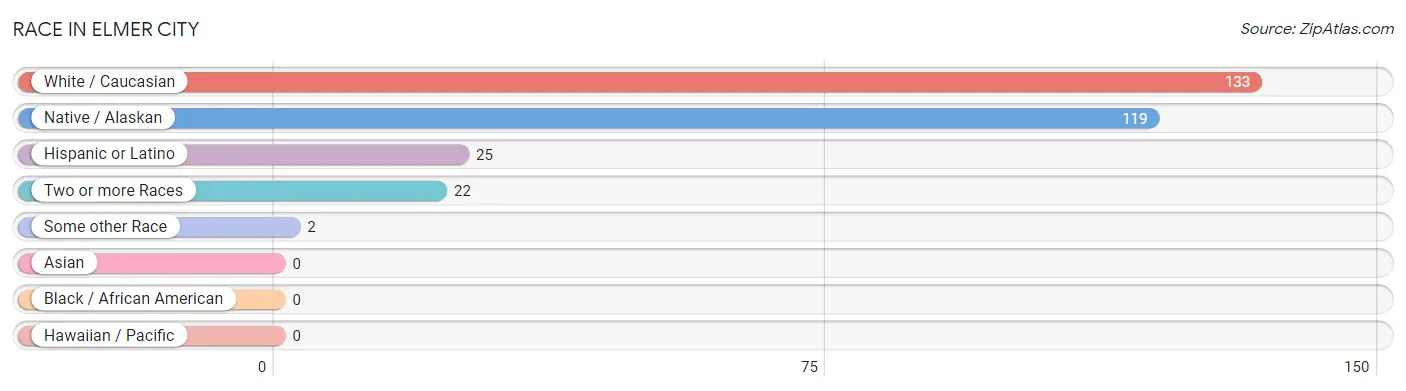
| Race | # Population | % Population |
| Asian | 0 | 0.0% |
| Black / African American | 0 | 0.0% |
| Hawaiian / Pacific | 0 | 0.0% |
| Hispanic or Latino | 25 | 9.1% |
| Native / Alaskan | 119 | 43.1% |
| White / Caucasian | 133 | 48.2% |
| Two or more Races | 22 | 8.0% |
| Some other Race | 2 | 0.7% |
| Total | 276 | 100.0% |
Ancestry in Elmer City
The most populous ancestries reported in Elmer City are Colville (127 | 46.0%), American (26 | 9.4%), English (25 | 9.1%), German (16 | 5.8%), and Mexican (13 | 4.7%), together accounting for 75.0% of all Elmer City residents.
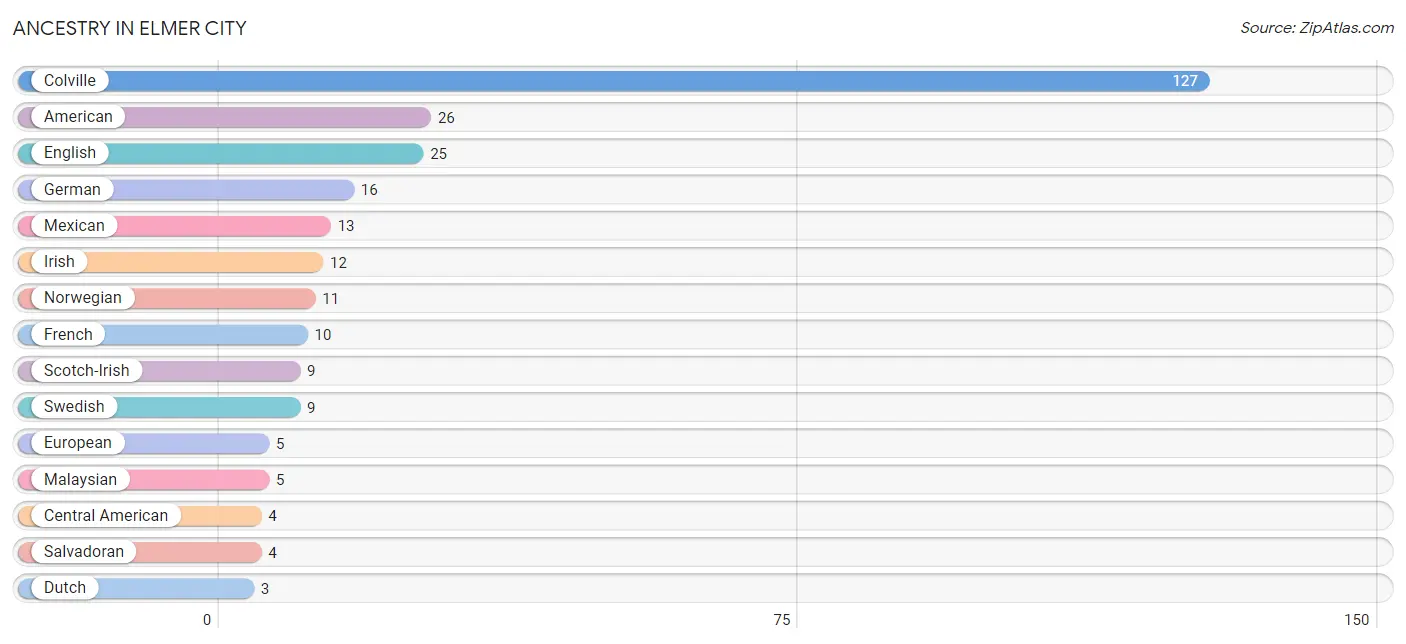
| Ancestry | # Population | % Population |
| American | 26 | 9.4% |
| Blackfeet | 1 | 0.4% |
| British | 2 | 0.7% |
| Central American | 4 | 1.5% |
| Chippewa | 1 | 0.4% |
| Colville | 127 | 46.0% |
| Danish | 2 | 0.7% |
| Dutch | 3 | 1.1% |
| English | 25 | 9.1% |
| European | 5 | 1.8% |
| Finnish | 2 | 0.7% |
| French | 10 | 3.6% |
| French Canadian | 1 | 0.4% |
| German | 16 | 5.8% |
| Irish | 12 | 4.3% |
| Malaysian | 5 | 1.8% |
| Mexican | 13 | 4.7% |
| Norwegian | 11 | 4.0% |
| Salvadoran | 4 | 1.5% |
| Scandinavian | 1 | 0.4% |
| Scotch-Irish | 9 | 3.3% |
| Swedish | 9 | 3.3% | View All 22 Rows |
Immigrants in Elmer City
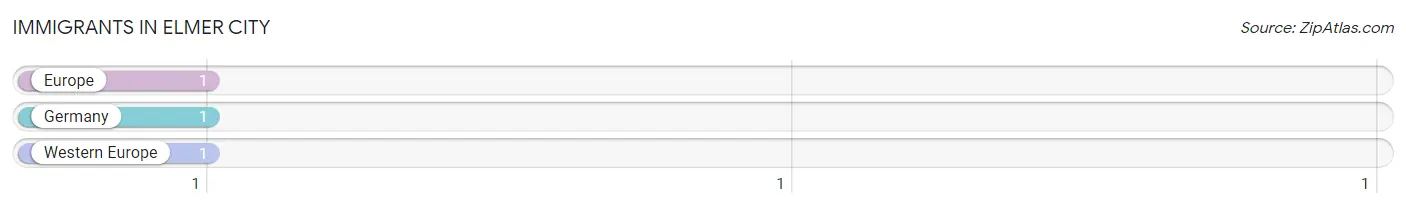
The most numerous immigrant groups reported in Elmer City came from Europe (1 | 0.4%), Germany (1 | 0.4%), and Western Europe (1 | 0.4%), together accounting for 1.1% of all Elmer City residents.
| Immigration Origin | # Population | % Population |
| Europe | 1 | 0.4% |
| Germany | 1 | 0.4% |
| Western Europe | 1 | 0.4% | View All 3 Rows |
Sex and Age in Elmer City
Sex and Age in Elmer City
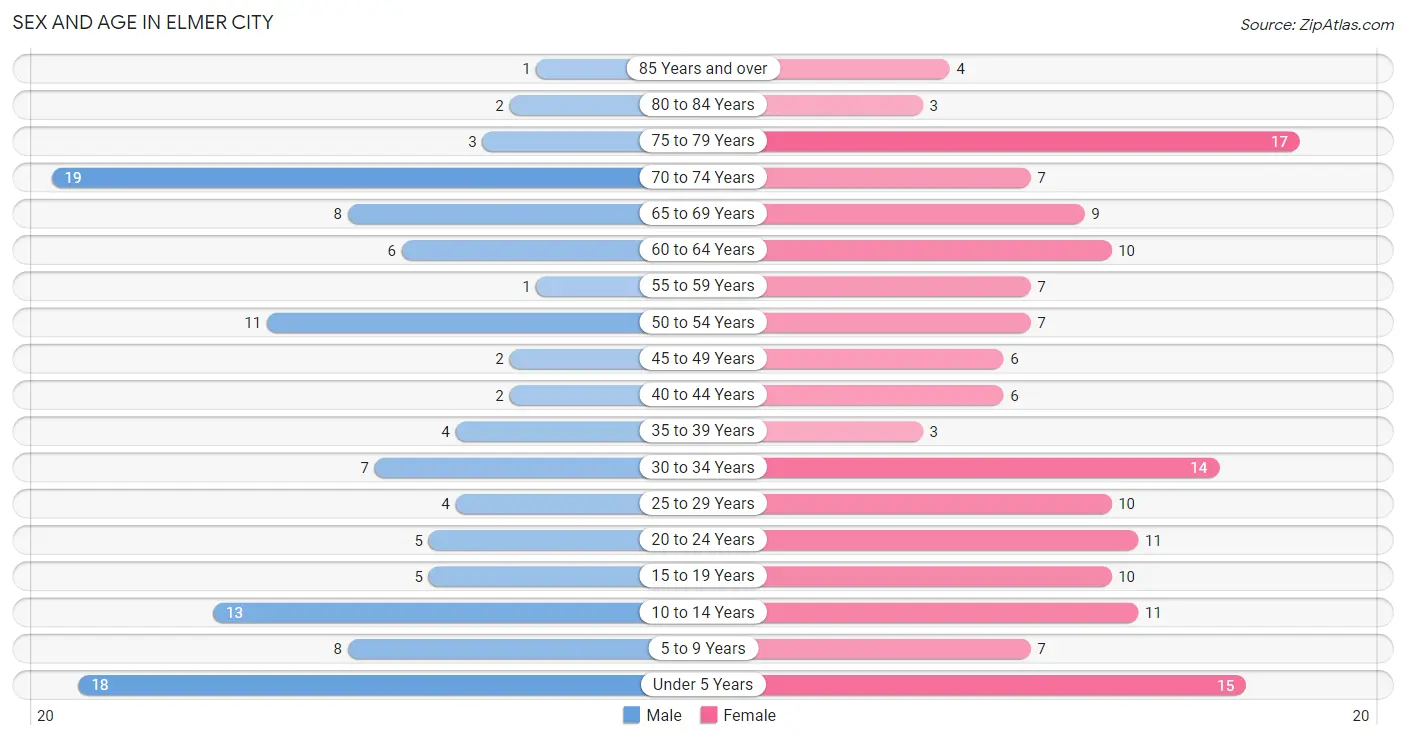
The most populous age groups in Elmer City are 70 to 74 Years (19 | 16.0%) for men and 75 to 79 Years (17 | 10.8%) for women.
| Age Bracket | Male | Female |
| Under 5 Years | 18 (15.1%) | 15 (9.6%) |
| 5 to 9 Years | 8 (6.7%) | 7 (4.5%) |
| 10 to 14 Years | 13 (10.9%) | 11 (7.0%) |
| 15 to 19 Years | 5 (4.2%) | 10 (6.4%) |
| 20 to 24 Years | 5 (4.2%) | 11 (7.0%) |
| 25 to 29 Years | 4 (3.4%) | 10 (6.4%) |
| 30 to 34 Years | 7 (5.9%) | 14 (8.9%) |
| 35 to 39 Years | 4 (3.4%) | 3 (1.9%) |
| 40 to 44 Years | 2 (1.7%) | 6 (3.8%) |
| 45 to 49 Years | 2 (1.7%) | 6 (3.8%) |
| 50 to 54 Years | 11 (9.2%) | 7 (4.5%) |
| 55 to 59 Years | 1 (0.8%) | 7 (4.5%) |
| 60 to 64 Years | 6 (5.0%) | 10 (6.4%) |
| 65 to 69 Years | 8 (6.7%) | 9 (5.7%) |
| 70 to 74 Years | 19 (16.0%) | 7 (4.5%) |
| 75 to 79 Years | 3 (2.5%) | 17 (10.8%) |
| 80 to 84 Years | 2 (1.7%) | 3 (1.9%) |
| 85 Years and over | 1 (0.8%) | 4 (2.5%) |
| Total | 119 (100.0%) | 157 (100.0%) |
Families and Households in Elmer City
Median Family Size in Elmer City
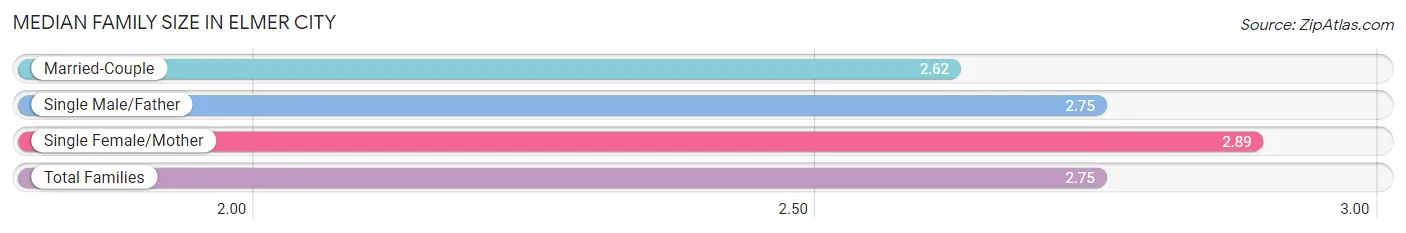
The median family size in Elmer City is 2.75 persons per family, with single female/mother families (37 | 46.3%) accounting for the largest median family size of 2.89 persons per family. On the other hand, married-couple families (39 | 48.7%) represent the smallest median family size with 2.62 persons per family.
| Family Type | # Families | Family Size |
| Married-Couple | 39 (48.7%) | 2.62 |
| Single Male/Father | 4 (5.0%) | 2.75 |
| Single Female/Mother | 37 (46.3%) | 2.89 |
| Total Families | 80 (100.0%) | 2.75 |
Median Household Size in Elmer City
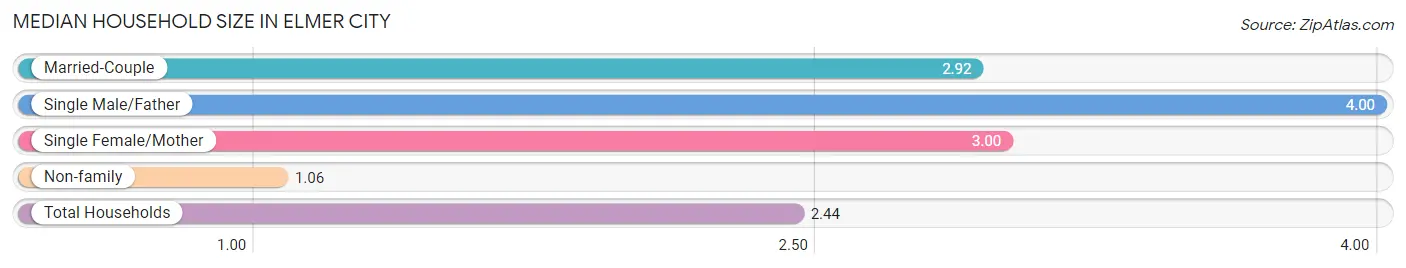
The median household size in Elmer City is 2.44 persons per household, with single male/father households (4 | 3.5%) accounting for the largest median household size of 4 persons per household. non-family households (33 | 29.2%) represent the smallest median household size with 1.06 persons per household.
| Household Type | # Households | Household Size |
| Married-Couple | 39 (34.5%) | 2.92 |
| Single Male/Father | 4 (3.5%) | 4.00 |
| Single Female/Mother | 37 (32.7%) | 3.00 |
| Non-family | 33 (29.2%) | 1.06 |
| Total Households | 113 (100.0%) | 2.44 |
Household Size by Marriage Status in Elmer City
Out of a total of 113 households in Elmer City, 80 (70.8%) are family households, while 33 (29.2%) are nonfamily households. The most numerous type of family households are 2-person households, comprising 36, and the most common type of nonfamily households are 1-person households, comprising 31.
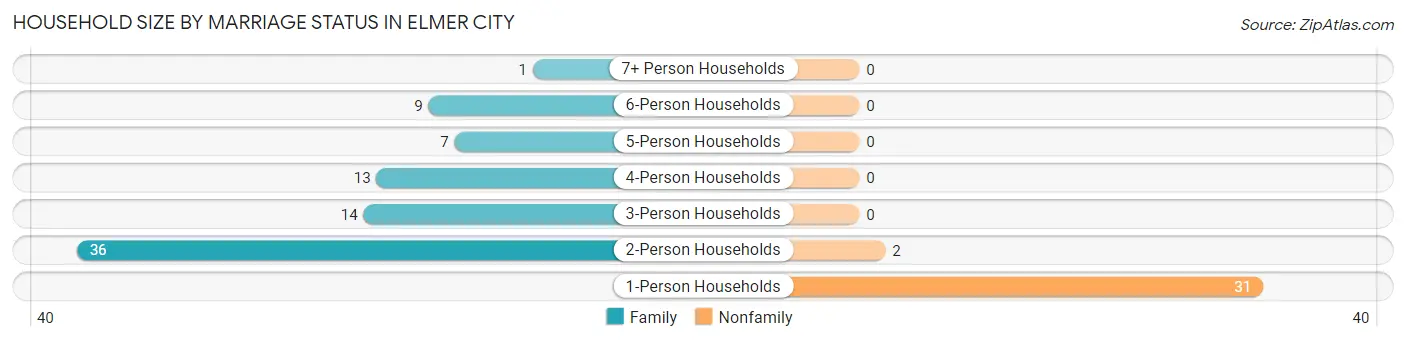
| Household Size | Family Households | Nonfamily Households |
| 1-Person Households | - | 31 (27.4%) |
| 2-Person Households | 36 (31.9%) | 2 (1.8%) |
| 3-Person Households | 14 (12.4%) | 0 (0.0%) |
| 4-Person Households | 13 (11.5%) | 0 (0.0%) |
| 5-Person Households | 7 (6.2%) | 0 (0.0%) |
| 6-Person Households | 9 (8.0%) | 0 (0.0%) |
| 7+ Person Households | 1 (0.9%) | 0 (0.0%) |
| Total | 80 (70.8%) | 33 (29.2%) |
Female Fertility in Elmer City
Fertility by Age in Elmer City
Average fertility rate in Elmer City is 183.0 births per 1,000 women. Women in the age bracket of 20 to 34 years have the highest fertility rate with 314.0 births per 1,000 women. Women in the age bracket of 20 to 34 years acount for 100.0% of all women with births.
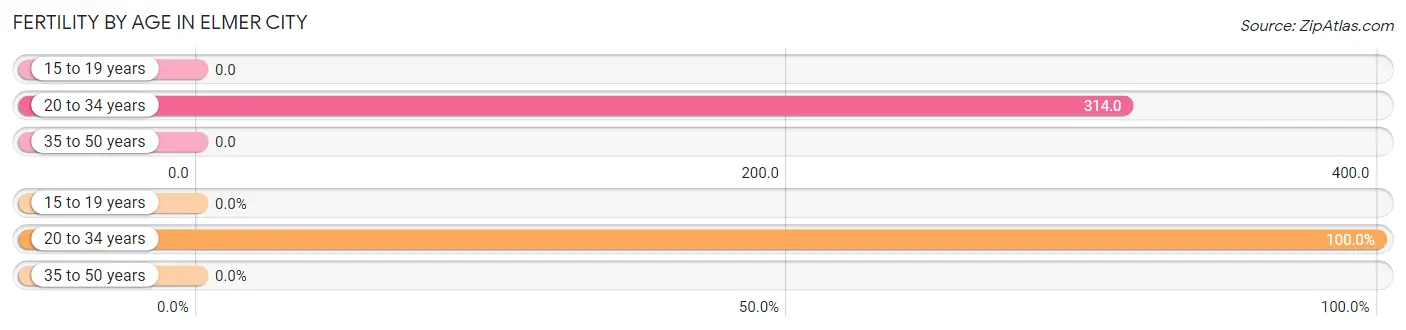
| Age Bracket | Women with Births | Births / 1,000 Women |
| 15 to 19 years | 0 (0.0%) | 0.0 |
| 20 to 34 years | 11 (100.0%) | 314.0 |
| 35 to 50 years | 0 (0.0%) | 0.0 |
| Total | 11 (100.0%) | 183.0 |
Fertility by Age by Marriage Status in Elmer City
18.2% of women with births (11) in Elmer City are married. The highest percentage of unmarried women with births falls into 20 to 34 years age bracket with 81.8% of them unmarried at the time of birth, while the lowest percentage of unmarried women with births belong to 20 to 34 years age bracket with 81.8% of them unmarried.
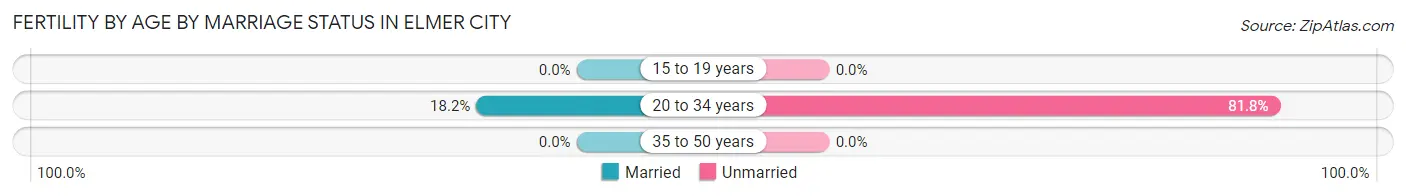
| Age Bracket | Married | Unmarried |
| 15 to 19 years | 0 (0.0%) | 0 (0.0%) |
| 20 to 34 years | 2 (18.2%) | 9 (81.8%) |
| 35 to 50 years | 0 (0.0%) | 0 (0.0%) |
| Total | 2 (18.2%) | 9 (81.8%) |
Fertility by Education in Elmer City
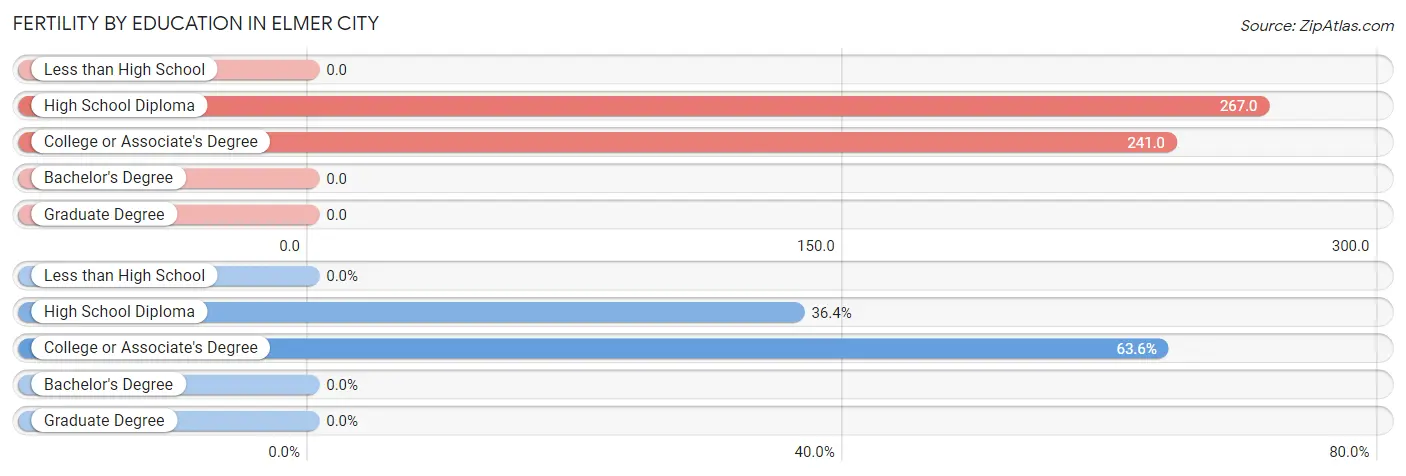
| Educational Attainment | Women with Births | Births / 1,000 Women |
| Less than High School | 0 (0.0%) | 0.0 |
| High School Diploma | 4 (36.4%) | 267.0 |
| College or Associate's Degree | 7 (63.6%) | 241.0 |
| Bachelor's Degree | 0 (0.0%) | 0.0 |
| Graduate Degree | 0 (0.0%) | 0.0 |
| Total | 11 (100.0%) | 183.0 |
Fertility by Education by Marriage Status in Elmer City
81.8% of women with births in Elmer City are unmarried. Women with the educational attainment of high school diploma are most likely to be married with 50.0% of them married at childbirth, while women with the educational attainment of college or associate's degree are least likely to be married with 100.0% of them unmarried at childbirth.
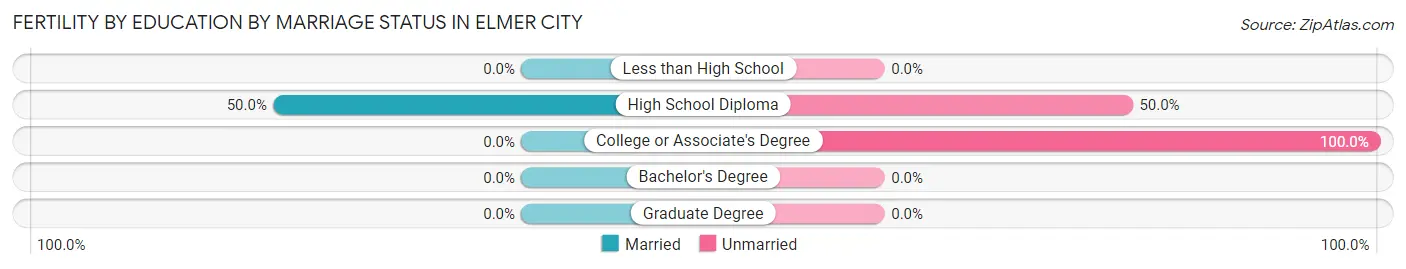
| Educational Attainment | Married | Unmarried |
| Less than High School | 0 (0.0%) | 0 (0.0%) |
| High School Diploma | 2 (50.0%) | 2 (50.0%) |
| College or Associate's Degree | 0 (0.0%) | 7 (100.0%) |
| Bachelor's Degree | 0 (0.0%) | 0 (0.0%) |
| Graduate Degree | 0 (0.0%) | 0 (0.0%) |
| Total | 2 (18.2%) | 9 (81.8%) |
Employment Characteristics in Elmer City
Employment by Class of Employer in Elmer City
Among the 88 employed individuals in Elmer City, local government employees (25 | 28.4%), private company employees (24 | 27.3%), and federal government employees (20 | 22.7%) make up the most common classes of employment.
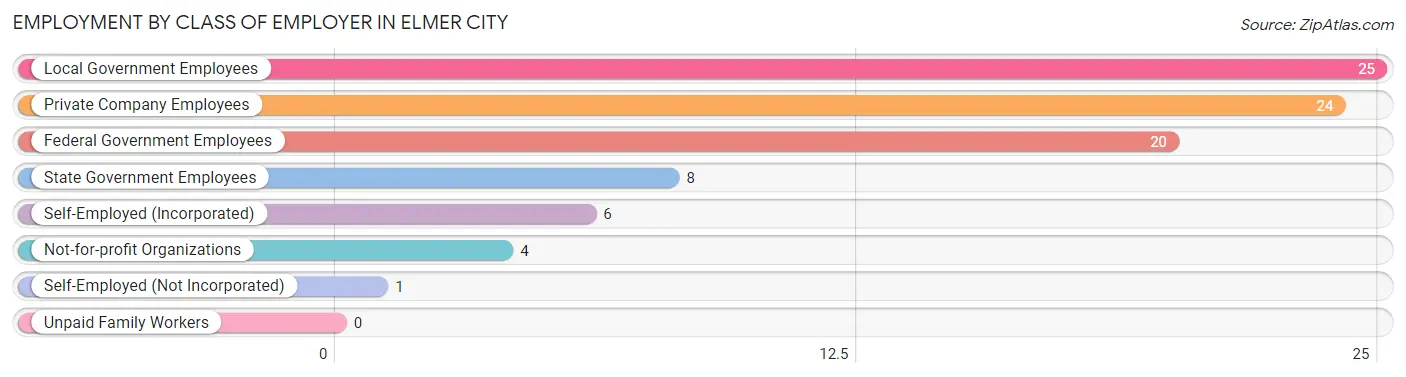
| Employer Class | # Employees | % Employees |
| Private Company Employees | 24 | 27.3% |
| Self-Employed (Incorporated) | 6 | 6.8% |
| Self-Employed (Not Incorporated) | 1 | 1.1% |
| Not-for-profit Organizations | 4 | 4.5% |
| Local Government Employees | 25 | 28.4% |
| State Government Employees | 8 | 9.1% |
| Federal Government Employees | 20 | 22.7% |
| Unpaid Family Workers | 0 | 0.0% |
| Total | 88 | 100.0% |
Employment Status by Age in Elmer City
According to the labor force statistics for Elmer City, out of the total population over 16 years of age (200), 47.5% or 95 individuals are in the labor force, with 5.3% or 5 of them unemployed. The age group with the highest labor force participation rate is 35 to 44 years, with 93.3% or 14 individuals in the labor force. Within the labor force, the 20 to 24 years age range has the highest percentage of unemployed individuals, with 21.4% or 3 of them being unemployed.
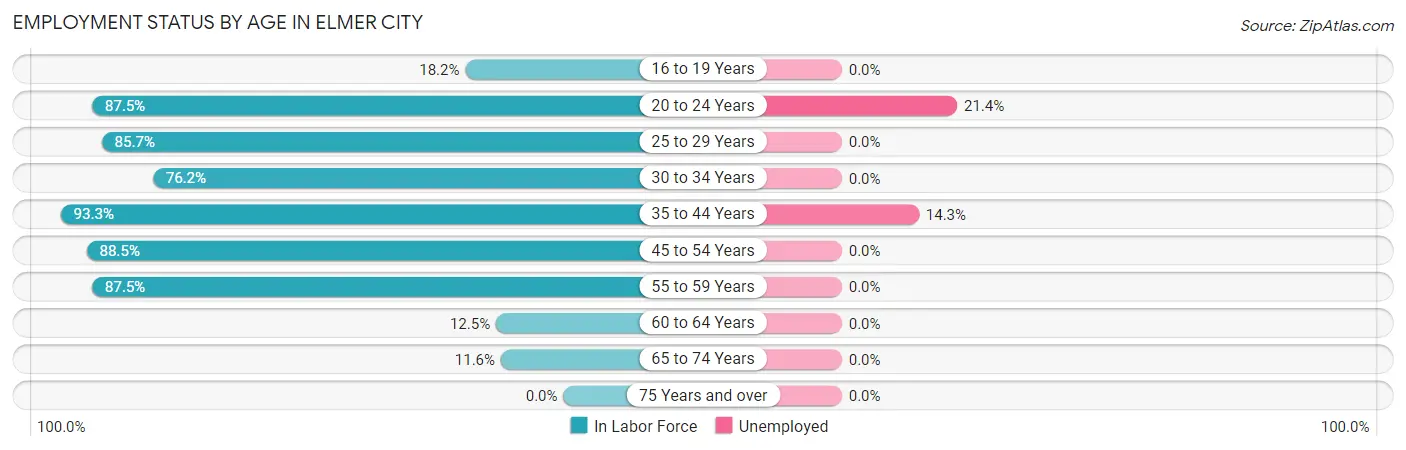
| Age Bracket | In Labor Force | Unemployed |
| 16 to 19 Years | 2 (18.2%) | 0 (0.0%) |
| 20 to 24 Years | 14 (87.5%) | 3 (21.4%) |
| 25 to 29 Years | 12 (85.7%) | 0 (0.0%) |
| 30 to 34 Years | 16 (76.2%) | 0 (0.0%) |
| 35 to 44 Years | 14 (93.3%) | 2 (14.3%) |
| 45 to 54 Years | 23 (88.5%) | 0 (0.0%) |
| 55 to 59 Years | 7 (87.5%) | 0 (0.0%) |
| 60 to 64 Years | 2 (12.5%) | 0 (0.0%) |
| 65 to 74 Years | 5 (11.6%) | 0 (0.0%) |
| 75 Years and over | 0 (0.0%) | 0 (0.0%) |
| Total | 95 (47.5%) | 5 (5.3%) |
Employment Status by Educational Attainment in Elmer City
According to labor force statistics for Elmer City, 74.0% of individuals (74) out of the total population between 25 and 64 years of age (100) are in the labor force, with 2.7% or 2 of them being unemployed. The group with the highest labor force participation rate are those with the educational attainment of less than high school, with 100.0% or 1 individuals in the labor force. Within the labor force, individuals with college / associate degree education have the highest percentage of unemployment, with 5.3% or 2 of them being unemployed.
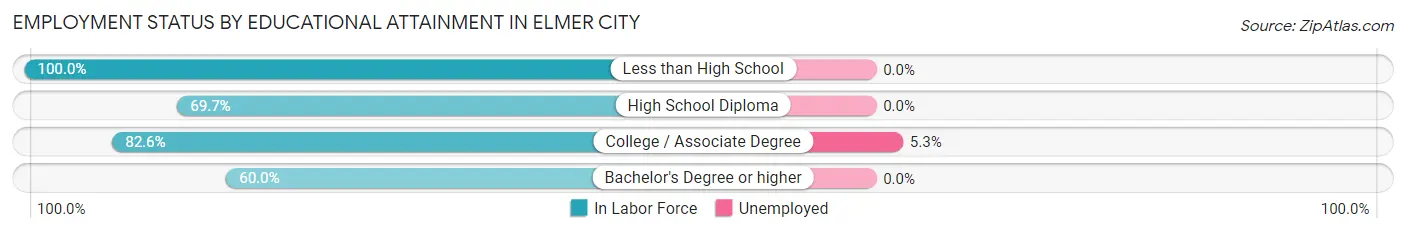
| Educational Attainment | In Labor Force | Unemployed |
| Less than High School | 1 (100.0%) | 0 (0.0%) |
| High School Diploma | 23 (69.7%) | 0 (0.0%) |
| College / Associate Degree | 38 (82.6%) | 2 (5.3%) |
| Bachelor's Degree or higher | 12 (60.0%) | 0 (0.0%) |
| Total | 74 (74.0%) | 3 (2.7%) |
Employment Occupations by Sex in Elmer City
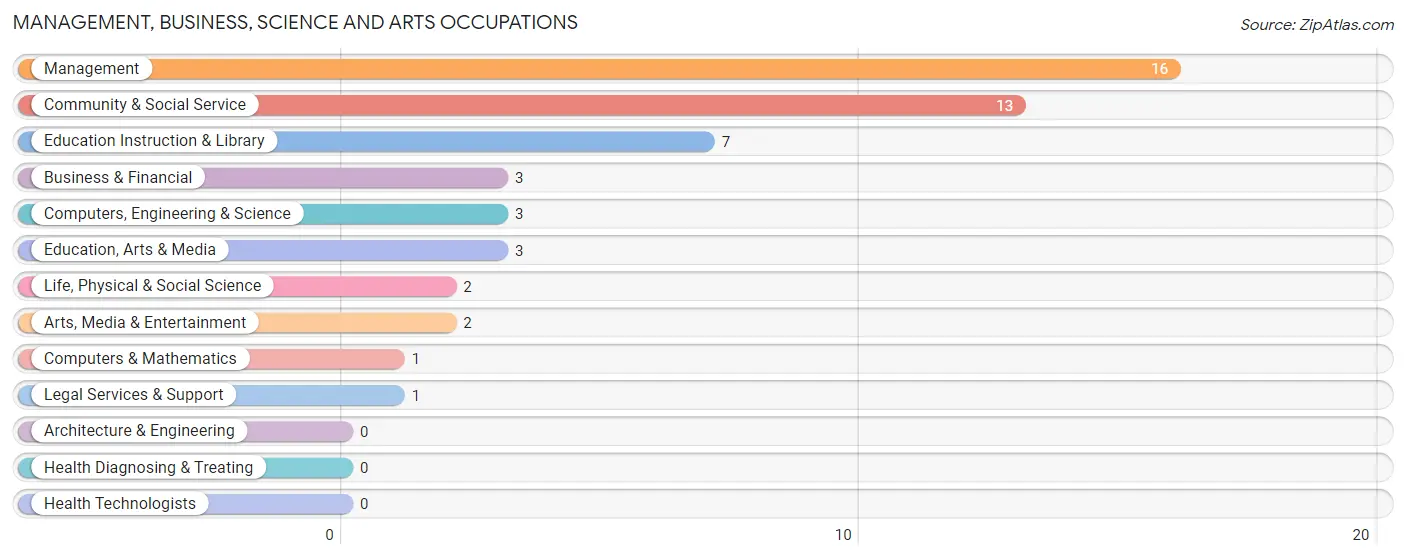
Management, Business, Science and Arts Occupations
The most common Management, Business, Science and Arts occupations in Elmer City are Management (16 | 17.8%), Community & Social Service (13 | 14.4%), Education Instruction & Library (7 | 7.8%), Business & Financial (3 | 3.3%), and Computers, Engineering & Science (3 | 3.3%).
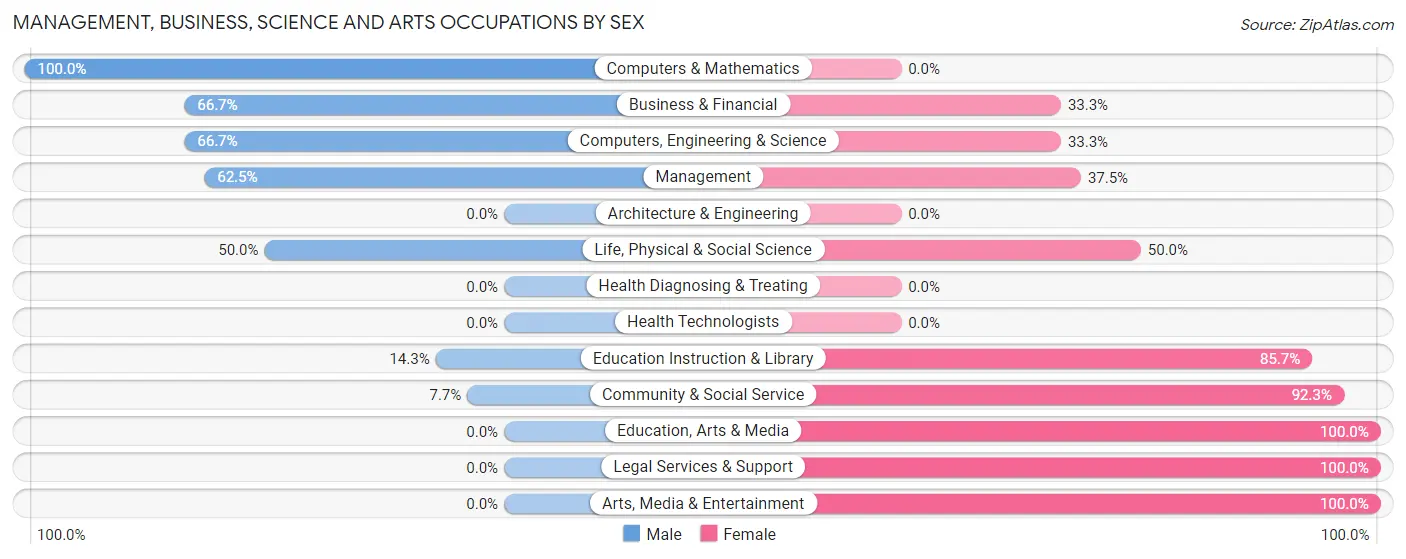
Management, Business, Science and Arts Occupations by Sex
Within the Management, Business, Science and Arts occupations in Elmer City, the most male-oriented occupations are Computers & Mathematics (100.0%), Business & Financial (66.7%), and Computers, Engineering & Science (66.7%), while the most female-oriented occupations are Education, Arts & Media (100.0%), Legal Services & Support (100.0%), and Arts, Media & Entertainment (100.0%).
| Occupation | Male | Female |
| Management | 10 (62.5%) | 6 (37.5%) |
| Business & Financial | 2 (66.7%) | 1 (33.3%) |
| Computers, Engineering & Science | 2 (66.7%) | 1 (33.3%) |
| Computers & Mathematics | 1 (100.0%) | 0 (0.0%) |
| Architecture & Engineering | 0 (0.0%) | 0 (0.0%) |
| Life, Physical & Social Science | 1 (50.0%) | 1 (50.0%) |
| Community & Social Service | 1 (7.7%) | 12 (92.3%) |
| Education, Arts & Media | 0 (0.0%) | 3 (100.0%) |
| Legal Services & Support | 0 (0.0%) | 1 (100.0%) |
| Education Instruction & Library | 1 (14.3%) | 6 (85.7%) |
| Arts, Media & Entertainment | 0 (0.0%) | 2 (100.0%) |
| Health Diagnosing & Treating | 0 (0.0%) | 0 (0.0%) |
| Health Technologists | 0 (0.0%) | 0 (0.0%) |
| Total (Category) | 15 (42.9%) | 20 (57.1%) |
| Total (Overall) | 39 (43.3%) | 51 (56.7%) |
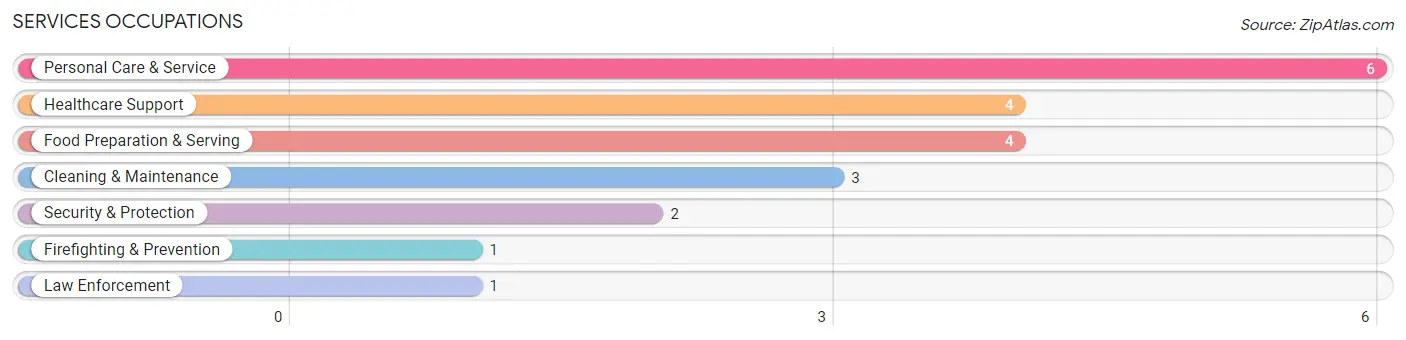
Services Occupations
The most common Services occupations in Elmer City are Personal Care & Service (6 | 6.7%), Healthcare Support (4 | 4.4%), Food Preparation & Serving (4 | 4.4%), Cleaning & Maintenance (3 | 3.3%), and Security & Protection (2 | 2.2%).
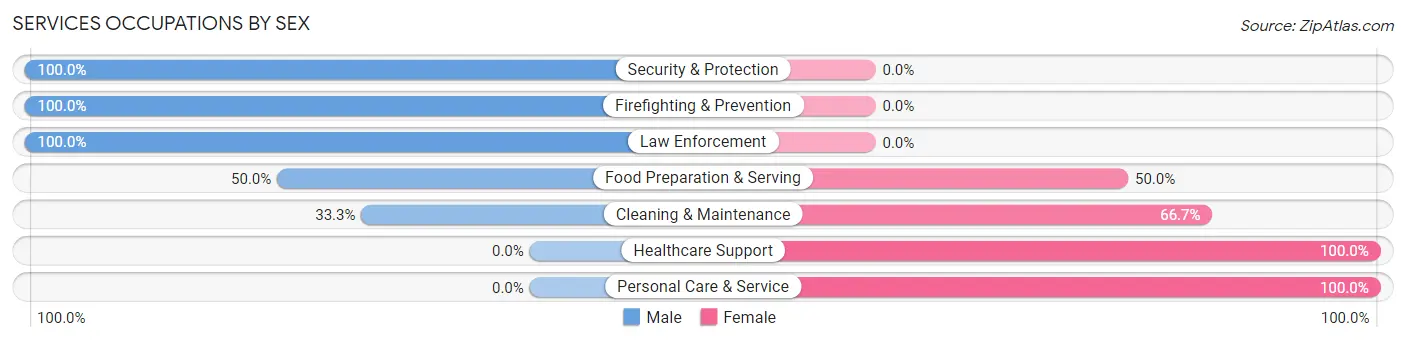
Services Occupations by Sex
Within the Services occupations in Elmer City, the most male-oriented occupations are Security & Protection (100.0%), Firefighting & Prevention (100.0%), and Law Enforcement (100.0%), while the most female-oriented occupations are Healthcare Support (100.0%), Personal Care & Service (100.0%), and Cleaning & Maintenance (66.7%).
| Occupation | Male | Female |
| Healthcare Support | 0 (0.0%) | 4 (100.0%) |
| Security & Protection | 2 (100.0%) | 0 (0.0%) |
| Firefighting & Prevention | 1 (100.0%) | 0 (0.0%) |
| Law Enforcement | 1 (100.0%) | 0 (0.0%) |
| Food Preparation & Serving | 2 (50.0%) | 2 (50.0%) |
| Cleaning & Maintenance | 1 (33.3%) | 2 (66.7%) |
| Personal Care & Service | 0 (0.0%) | 6 (100.0%) |
| Total (Category) | 5 (26.3%) | 14 (73.7%) |
| Total (Overall) | 39 (43.3%) | 51 (56.7%) |
Sales and Office Occupations
The most common Sales and Office occupations in Elmer City are Office & Administration (10 | 11.1%), and Sales & Related (4 | 4.4%).
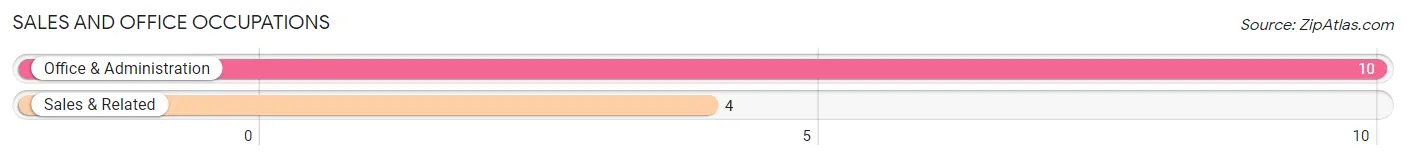
Sales and Office Occupations by Sex
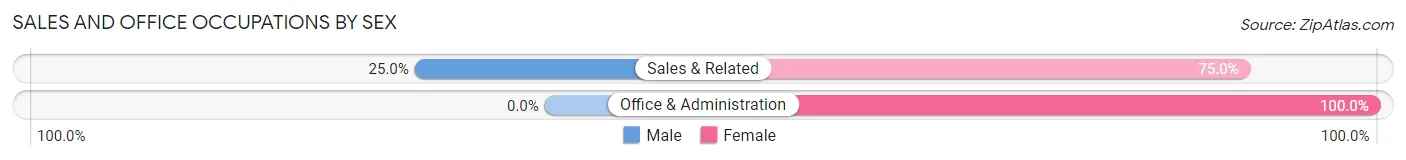
| Occupation | Male | Female |
| Sales & Related | 1 (25.0%) | 3 (75.0%) |
| Office & Administration | 0 (0.0%) | 10 (100.0%) |
| Total (Category) | 1 (7.1%) | 13 (92.9%) |
| Total (Overall) | 39 (43.3%) | 51 (56.7%) |
Natural Resources, Construction and Maintenance Occupations
The most common Natural Resources, Construction and Maintenance occupations in Elmer City are Construction & Extraction (7 | 7.8%), Farming, Fishing & Forestry (2 | 2.2%), and Installation, Maintenance & Repair (2 | 2.2%).
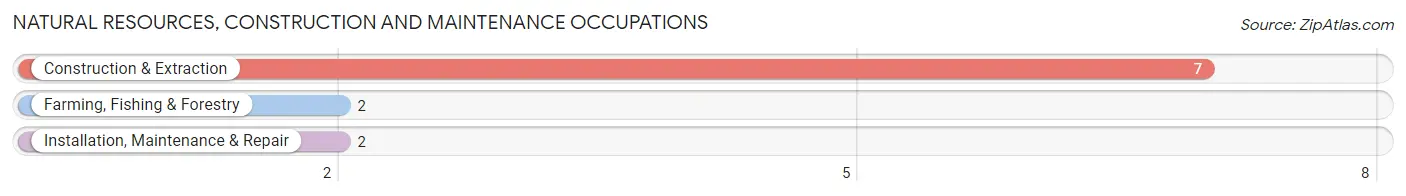
Natural Resources, Construction and Maintenance Occupations by Sex
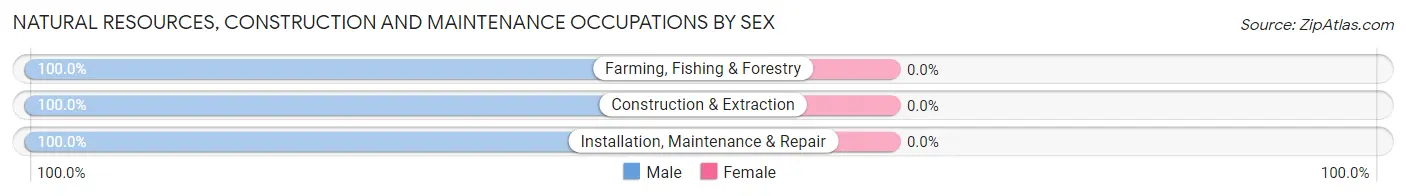
| Occupation | Male | Female |
| Farming, Fishing & Forestry | 2 (100.0%) | 0 (0.0%) |
| Construction & Extraction | 7 (100.0%) | 0 (0.0%) |
| Installation, Maintenance & Repair | 2 (100.0%) | 0 (0.0%) |
| Total (Category) | 11 (100.0%) | 0 (0.0%) |
| Total (Overall) | 39 (43.3%) | 51 (56.7%) |
Production, Transportation and Moving Occupations
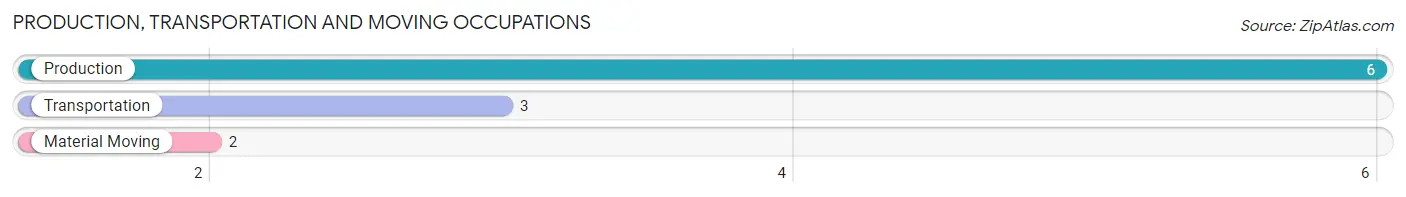
The most common Production, Transportation and Moving occupations in Elmer City are Production (6 | 6.7%), Transportation (3 | 3.3%), and Material Moving (2 | 2.2%).
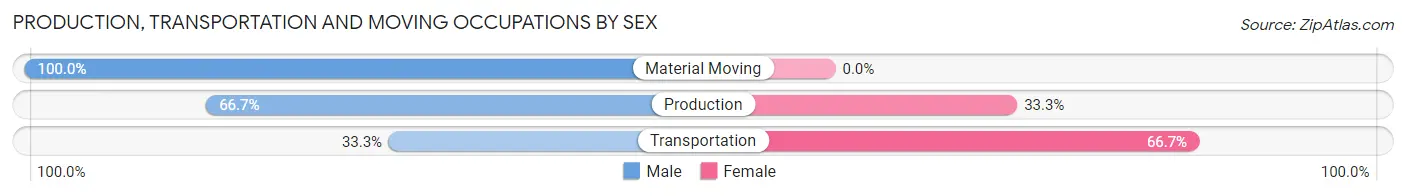
Production, Transportation and Moving Occupations by Sex
| Occupation | Male | Female |
| Production | 4 (66.7%) | 2 (33.3%) |
| Transportation | 1 (33.3%) | 2 (66.7%) |
| Material Moving | 2 (100.0%) | 0 (0.0%) |
| Total (Category) | 7 (63.6%) | 4 (36.4%) |
| Total (Overall) | 39 (43.3%) | 51 (56.7%) |
Employment Industries by Sex in Elmer City
Employment Industries in Elmer City
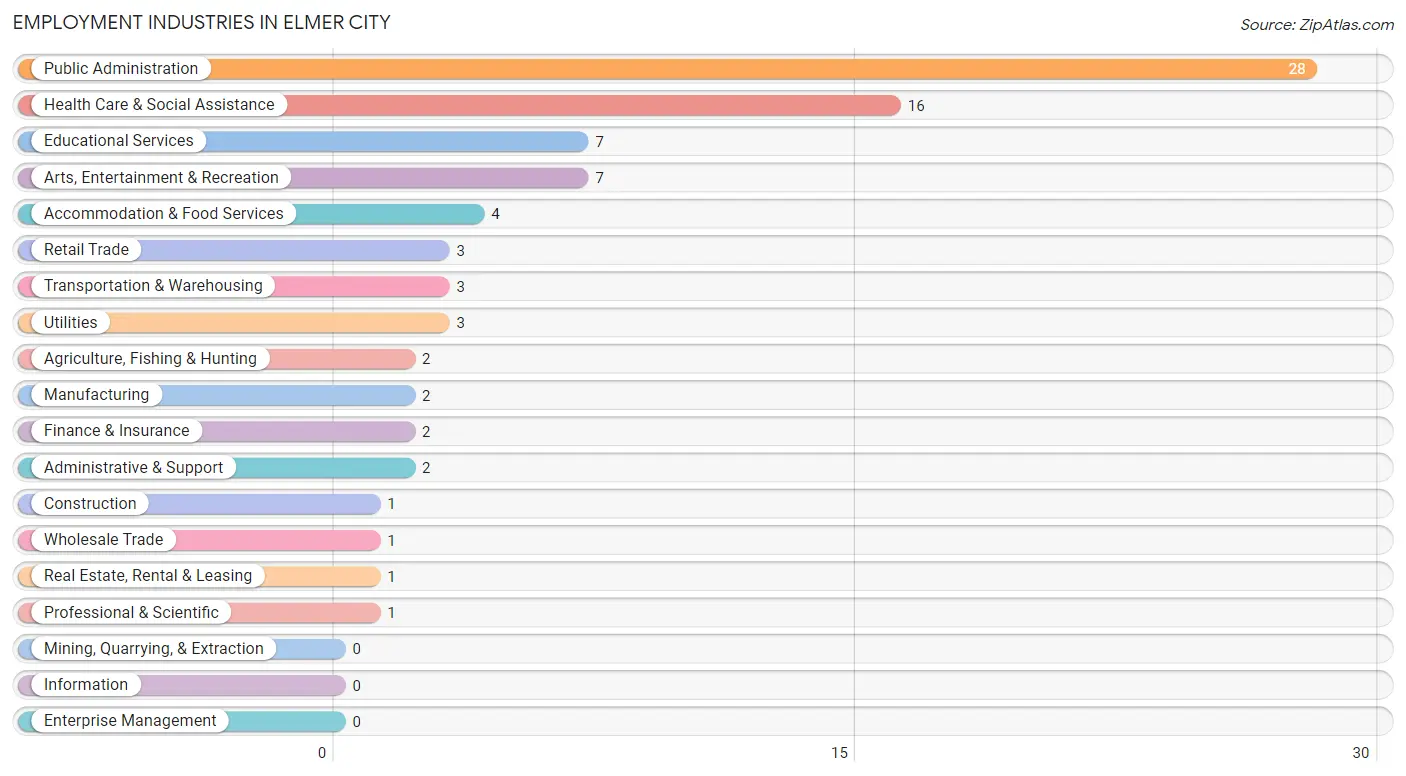
The major employment industries in Elmer City include Public Administration (28 | 31.1%), Health Care & Social Assistance (16 | 17.8%), Educational Services (7 | 7.8%), Arts, Entertainment & Recreation (7 | 7.8%), and Accommodation & Food Services (4 | 4.4%).
Employment Industries by Sex in Elmer City
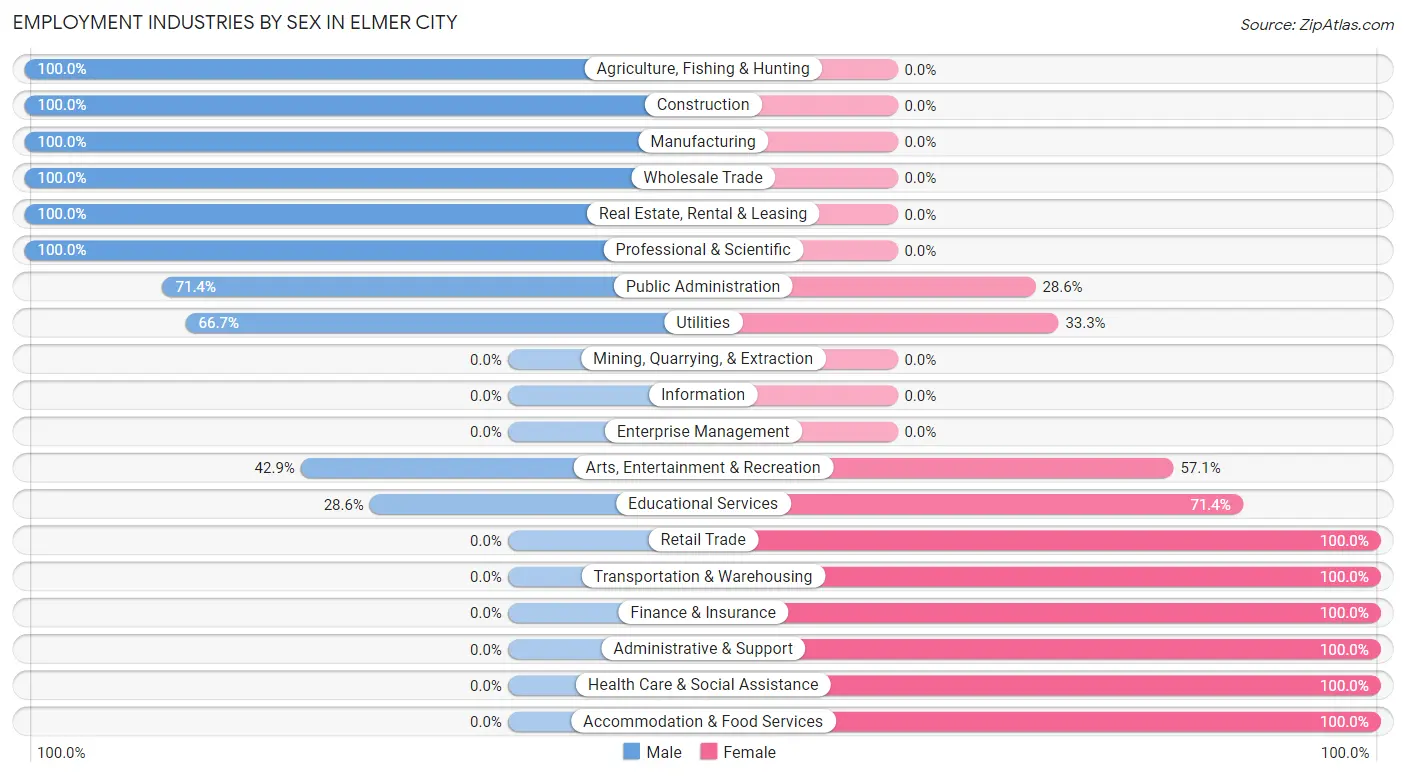
The Elmer City industries that see more men than women are Agriculture, Fishing & Hunting (100.0%), Construction (100.0%), and Manufacturing (100.0%), whereas the industries that tend to have a higher number of women are Retail Trade (100.0%), Transportation & Warehousing (100.0%), and Finance & Insurance (100.0%).
| Industry | Male | Female |
| Agriculture, Fishing & Hunting | 2 (100.0%) | 0 (0.0%) |
| Mining, Quarrying, & Extraction | 0 (0.0%) | 0 (0.0%) |
| Construction | 1 (100.0%) | 0 (0.0%) |
| Manufacturing | 2 (100.0%) | 0 (0.0%) |
| Wholesale Trade | 1 (100.0%) | 0 (0.0%) |
| Retail Trade | 0 (0.0%) | 3 (100.0%) |
| Transportation & Warehousing | 0 (0.0%) | 3 (100.0%) |
| Utilities | 2 (66.7%) | 1 (33.3%) |
| Information | 0 (0.0%) | 0 (0.0%) |
| Finance & Insurance | 0 (0.0%) | 2 (100.0%) |
| Real Estate, Rental & Leasing | 1 (100.0%) | 0 (0.0%) |
| Professional & Scientific | 1 (100.0%) | 0 (0.0%) |
| Enterprise Management | 0 (0.0%) | 0 (0.0%) |
| Administrative & Support | 0 (0.0%) | 2 (100.0%) |
| Educational Services | 2 (28.6%) | 5 (71.4%) |
| Health Care & Social Assistance | 0 (0.0%) | 16 (100.0%) |
| Arts, Entertainment & Recreation | 3 (42.9%) | 4 (57.1%) |
| Accommodation & Food Services | 0 (0.0%) | 4 (100.0%) |
| Public Administration | 20 (71.4%) | 8 (28.6%) |
| Total | 39 (43.3%) | 51 (56.7%) |
Education in Elmer City
School Enrollment in Elmer City
The most common levels of schooling among the 66 students in Elmer City are high school (23 | 34.8%), elementary school (17 | 25.8%), and middle school (12 | 18.2%).
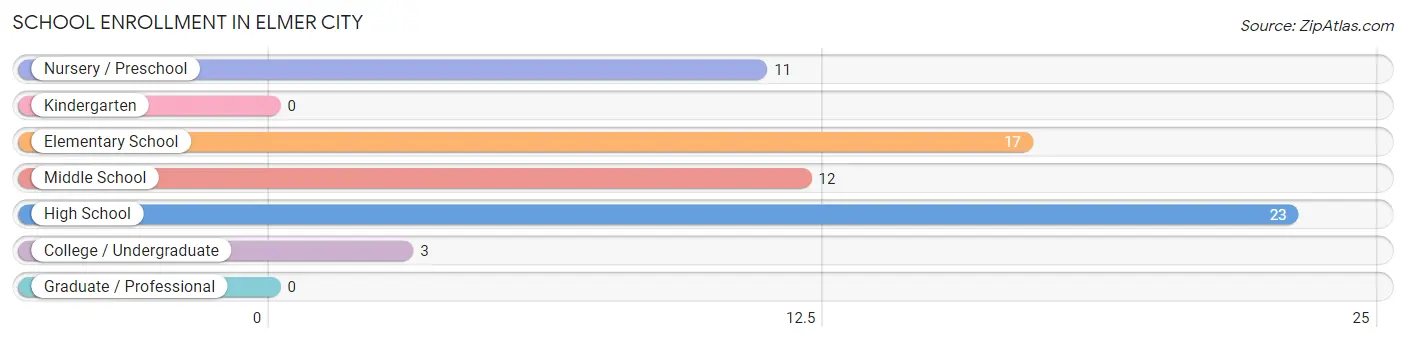
| School Level | # Students | % Students |
| Nursery / Preschool | 11 | 16.7% |
| Kindergarten | 0 | 0.0% |
| Elementary School | 17 | 25.8% |
| Middle School | 12 | 18.2% |
| High School | 23 | 34.8% |
| College / Undergraduate | 3 | 4.5% |
| Graduate / Professional | 0 | 0.0% |
| Total | 66 | 100.0% |
School Enrollment by Age by Funding Source in Elmer City
Out of a total of 66 students who are enrolled in schools in Elmer City, 3 (4.5%) attend a private institution, while the remaining 63 (95.5%) are enrolled in public schools. The age group of 3 to 4 year olds has the highest likelihood of being enrolled in private schools, with 2 (22.2% in the age bracket) enrolled. Conversely, the age group of 10 to 14 year olds has the lowest likelihood of being enrolled in a private school, with 22 (100.0% in the age bracket) attending a public institution.
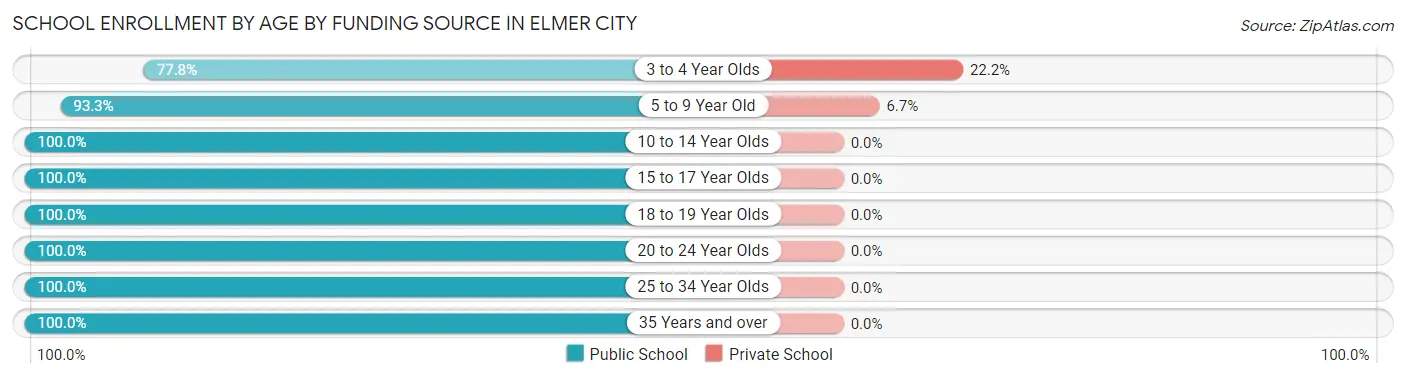
| Age Bracket | Public School | Private School |
| 3 to 4 Year Olds | 7 (77.8%) | 2 (22.2%) |
| 5 to 9 Year Old | 14 (93.3%) | 1 (6.7%) |
| 10 to 14 Year Olds | 22 (100.0%) | 0 (0.0%) |
| 15 to 17 Year Olds | 12 (100.0%) | 0 (0.0%) |
| 18 to 19 Year Olds | 2 (100.0%) | 0 (0.0%) |
| 20 to 24 Year Olds | 3 (100.0%) | 0 (0.0%) |
| 25 to 34 Year Olds | 1 (100.0%) | 0 (0.0%) |
| 35 Years and over | 2 (100.0%) | 0 (0.0%) |
| Total | 63 (95.5%) | 3 (4.5%) |
Educational Attainment by Field of Study in Elmer City
Education (11 | 27.5%), business (6 | 15.0%), science & technology (5 | 12.5%), bio, nature & agricultural (4 | 10.0%), and literature & languages (4 | 10.0%) are the most common fields of study among 40 individuals in Elmer City who have obtained a bachelor's degree or higher.
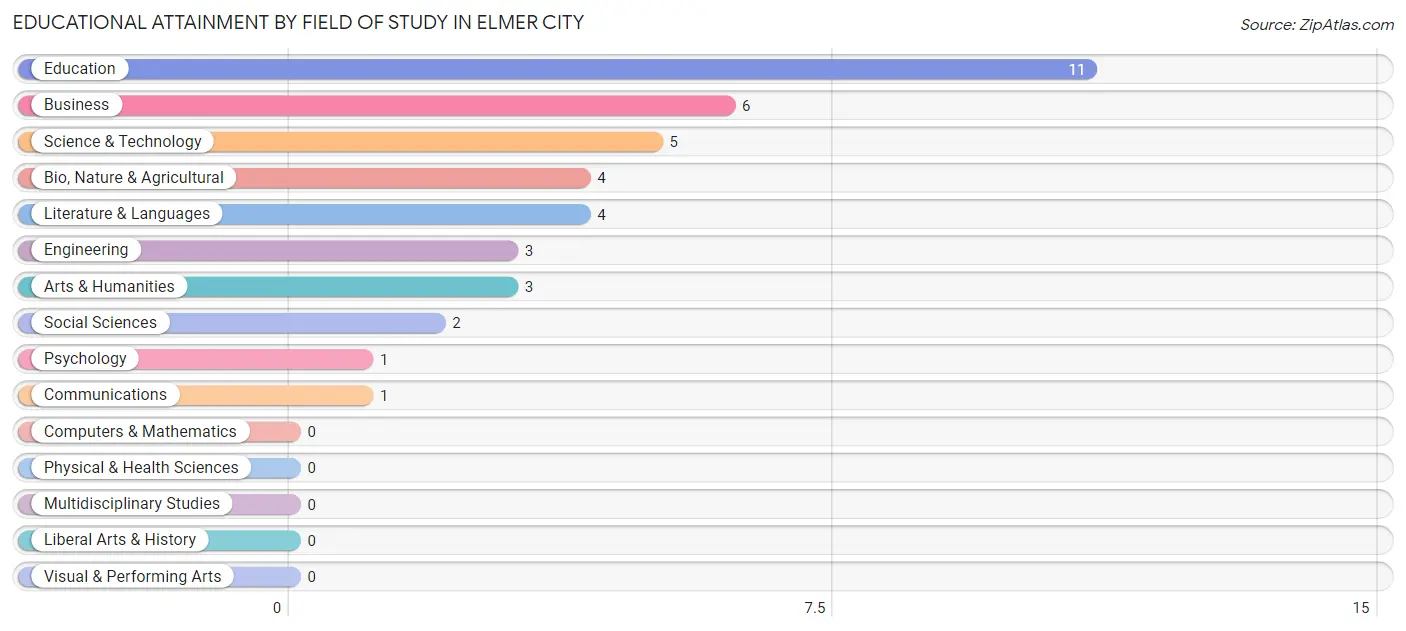
| Field of Study | # Graduates | % Graduates |
| Computers & Mathematics | 0 | 0.0% |
| Bio, Nature & Agricultural | 4 | 10.0% |
| Physical & Health Sciences | 0 | 0.0% |
| Psychology | 1 | 2.5% |
| Social Sciences | 2 | 5.0% |
| Engineering | 3 | 7.5% |
| Multidisciplinary Studies | 0 | 0.0% |
| Science & Technology | 5 | 12.5% |
| Business | 6 | 15.0% |
| Education | 11 | 27.5% |
| Literature & Languages | 4 | 10.0% |
| Liberal Arts & History | 0 | 0.0% |
| Visual & Performing Arts | 0 | 0.0% |
| Communications | 1 | 2.5% |
| Arts & Humanities | 3 | 7.5% |
| Total | 40 | 100.0% |
Transportation & Commute in Elmer City
Vehicle Availability by Sex in Elmer City
The most prevalent vehicle ownership categories in Elmer City are males with 3 vehicles (17, accounting for 43.6%) and females with 3 vehicles (18, making up 34.7%).
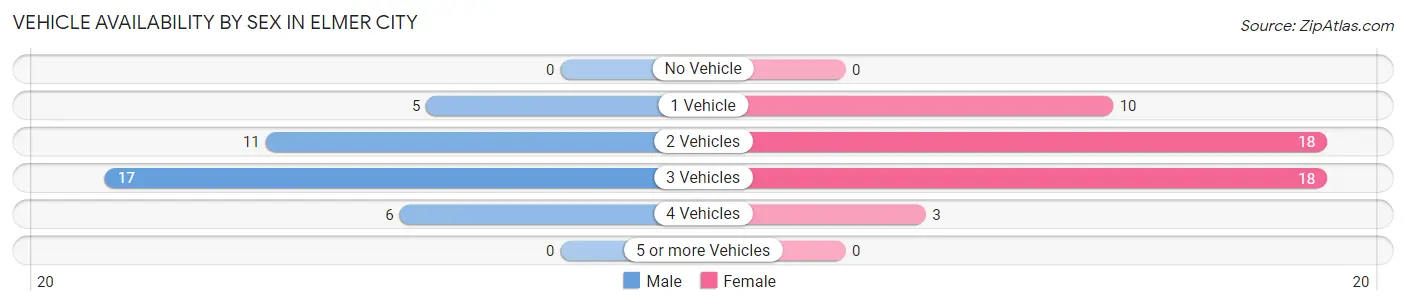
| Vehicles Available | Male | Female |
| No Vehicle | 0 (0.0%) | 0 (0.0%) |
| 1 Vehicle | 5 (12.8%) | 10 (20.4%) |
| 2 Vehicles | 11 (28.2%) | 18 (36.7%) |
| 3 Vehicles | 17 (43.6%) | 18 (36.7%) |
| 4 Vehicles | 6 (15.4%) | 3 (6.1%) |
| 5 or more Vehicles | 0 (0.0%) | 0 (0.0%) |
| Total | 39 (100.0%) | 49 (100.0%) |
Commute Time in Elmer City
The most frequently occuring commute durations in Elmer City are 15 to 19 minutes (27 commuters, 36.0%), 10 to 14 minutes (16 commuters, 21.3%), and 5 to 9 minutes (10 commuters, 13.3%).
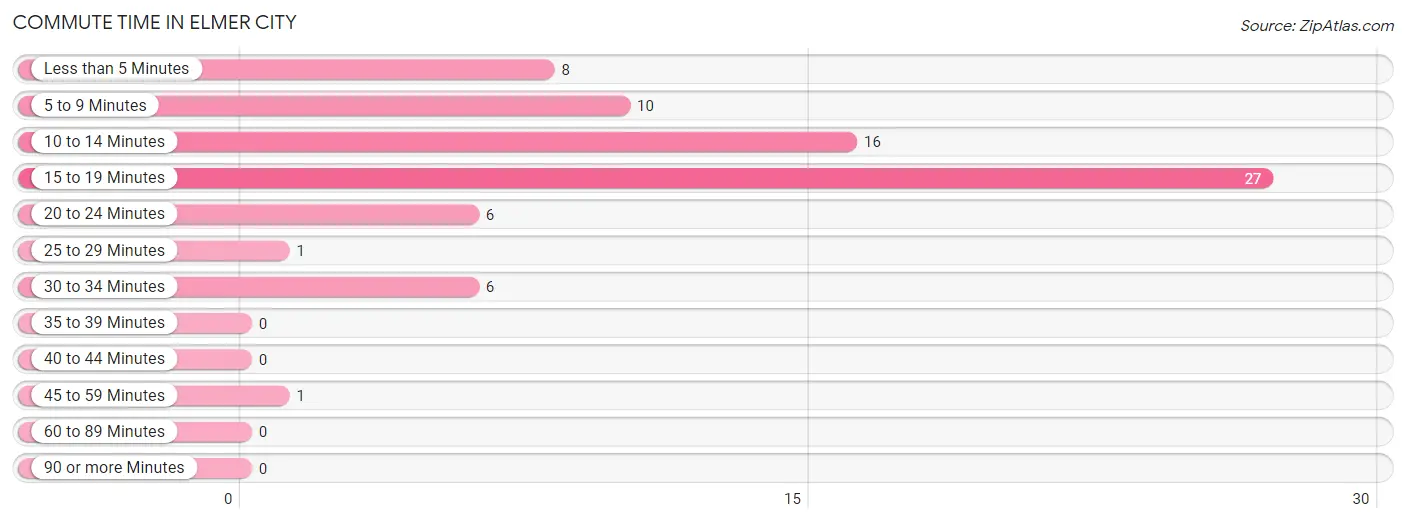
| Commute Time | # Commuters | % Commuters |
| Less than 5 Minutes | 8 | 10.7% |
| 5 to 9 Minutes | 10 | 13.3% |
| 10 to 14 Minutes | 16 | 21.3% |
| 15 to 19 Minutes | 27 | 36.0% |
| 20 to 24 Minutes | 6 | 8.0% |
| 25 to 29 Minutes | 1 | 1.3% |
| 30 to 34 Minutes | 6 | 8.0% |
| 35 to 39 Minutes | 0 | 0.0% |
| 40 to 44 Minutes | 0 | 0.0% |
| 45 to 59 Minutes | 1 | 1.3% |
| 60 to 89 Minutes | 0 | 0.0% |
| 90 or more Minutes | 0 | 0.0% |
Commute Time by Sex in Elmer City
The most common commute times in Elmer City are 15 to 19 minutes (10 commuters, 32.3%) for males and 15 to 19 minutes (17 commuters, 38.6%) for females.
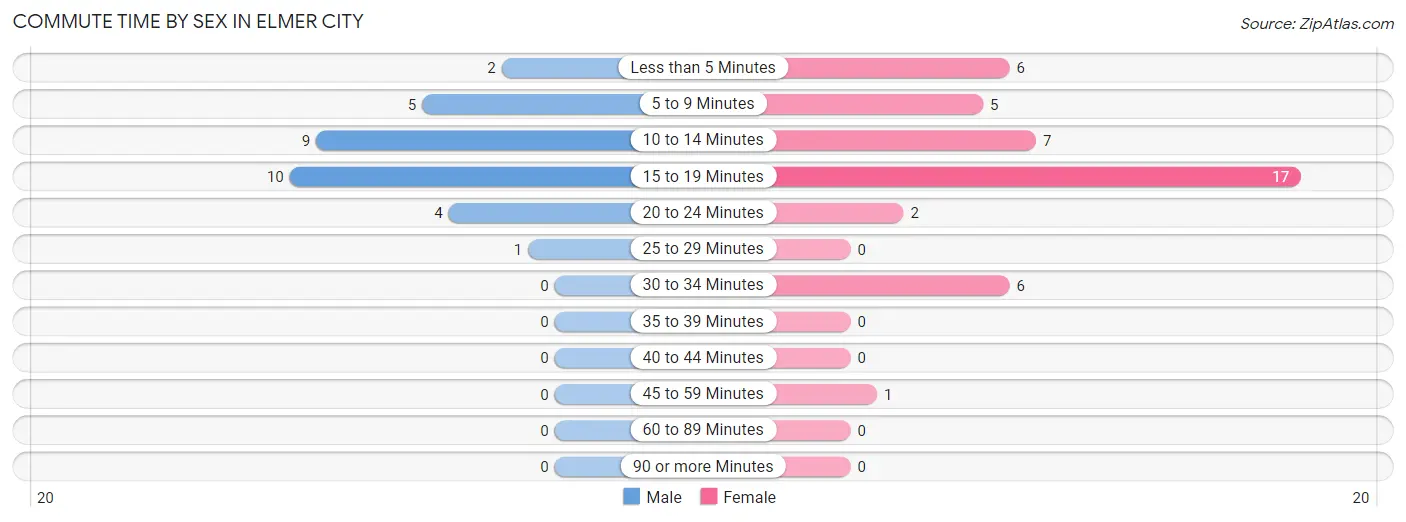
| Commute Time | Male | Female |
| Less than 5 Minutes | 2 (6.5%) | 6 (13.6%) |
| 5 to 9 Minutes | 5 (16.1%) | 5 (11.4%) |
| 10 to 14 Minutes | 9 (29.0%) | 7 (15.9%) |
| 15 to 19 Minutes | 10 (32.3%) | 17 (38.6%) |
| 20 to 24 Minutes | 4 (12.9%) | 2 (4.5%) |
| 25 to 29 Minutes | 1 (3.2%) | 0 (0.0%) |
| 30 to 34 Minutes | 0 (0.0%) | 6 (13.6%) |
| 35 to 39 Minutes | 0 (0.0%) | 0 (0.0%) |
| 40 to 44 Minutes | 0 (0.0%) | 0 (0.0%) |
| 45 to 59 Minutes | 0 (0.0%) | 1 (2.3%) |
| 60 to 89 Minutes | 0 (0.0%) | 0 (0.0%) |
| 90 or more Minutes | 0 (0.0%) | 0 (0.0%) |
Time of Departure to Work by Sex in Elmer City
The most frequent times of departure to work in Elmer City are 6:00 AM to 6:29 AM (8, 25.8%) for males and 6:00 AM to 6:29 AM (14, 31.8%) for females.
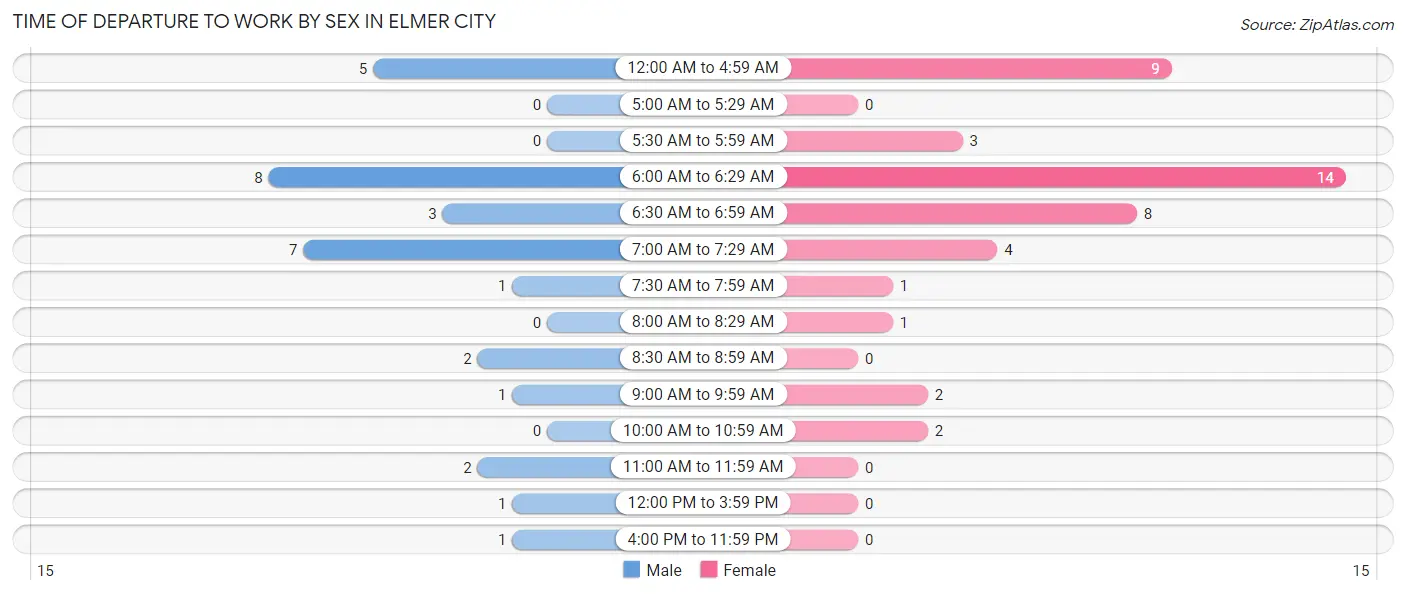
| Time of Departure | Male | Female |
| 12:00 AM to 4:59 AM | 5 (16.1%) | 9 (20.4%) |
| 5:00 AM to 5:29 AM | 0 (0.0%) | 0 (0.0%) |
| 5:30 AM to 5:59 AM | 0 (0.0%) | 3 (6.8%) |
| 6:00 AM to 6:29 AM | 8 (25.8%) | 14 (31.8%) |
| 6:30 AM to 6:59 AM | 3 (9.7%) | 8 (18.2%) |
| 7:00 AM to 7:29 AM | 7 (22.6%) | 4 (9.1%) |
| 7:30 AM to 7:59 AM | 1 (3.2%) | 1 (2.3%) |
| 8:00 AM to 8:29 AM | 0 (0.0%) | 1 (2.3%) |
| 8:30 AM to 8:59 AM | 2 (6.5%) | 0 (0.0%) |
| 9:00 AM to 9:59 AM | 1 (3.2%) | 2 (4.5%) |
| 10:00 AM to 10:59 AM | 0 (0.0%) | 2 (4.5%) |
| 11:00 AM to 11:59 AM | 2 (6.5%) | 0 (0.0%) |
| 12:00 PM to 3:59 PM | 1 (3.2%) | 0 (0.0%) |
| 4:00 PM to 11:59 PM | 1 (3.2%) | 0 (0.0%) |
| Total | 31 (100.0%) | 44 (100.0%) |
Housing Occupancy in Elmer City
Occupancy by Ownership in Elmer City
Of the total 113 dwellings in Elmer City, owner-occupied units account for 89 (78.8%), while renter-occupied units make up 24 (21.2%).
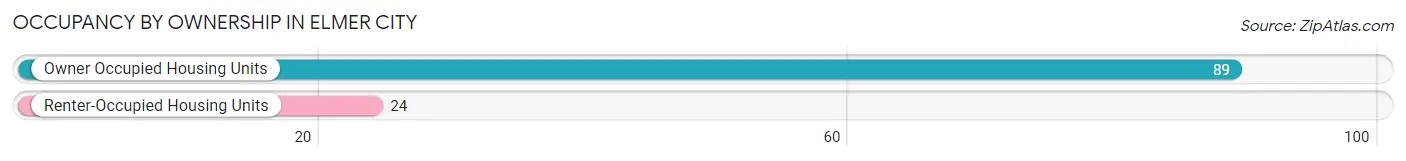
| Occupancy | # Housing Units | % Housing Units |
| Owner Occupied Housing Units | 89 | 78.8% |
| Renter-Occupied Housing Units | 24 | 21.2% |
| Total Occupied Housing Units | 113 | 100.0% |
Occupancy by Household Size in Elmer City
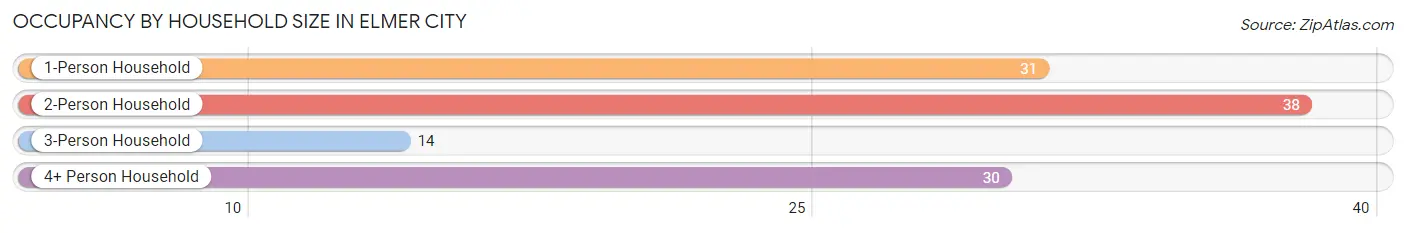
| Household Size | # Housing Units | % Housing Units |
| 1-Person Household | 31 | 27.4% |
| 2-Person Household | 38 | 33.6% |
| 3-Person Household | 14 | 12.4% |
| 4+ Person Household | 30 | 26.6% |
| Total Housing Units | 113 | 100.0% |
Occupancy by Ownership by Household Size in Elmer City
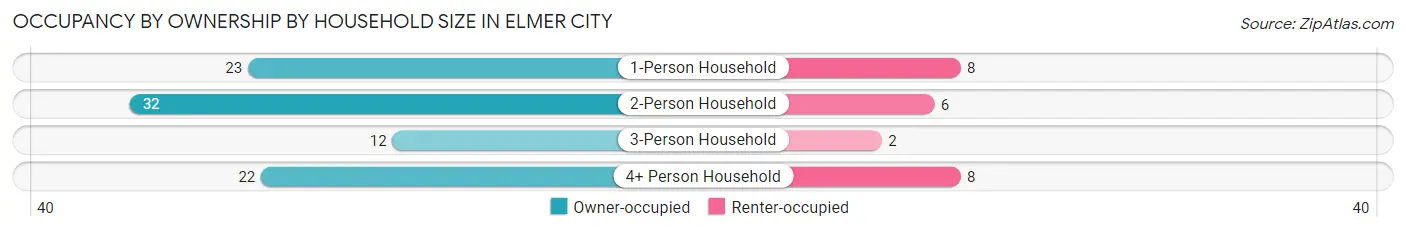
| Household Size | Owner-occupied | Renter-occupied |
| 1-Person Household | 23 (74.2%) | 8 (25.8%) |
| 2-Person Household | 32 (84.2%) | 6 (15.8%) |
| 3-Person Household | 12 (85.7%) | 2 (14.3%) |
| 4+ Person Household | 22 (73.3%) | 8 (26.7%) |
| Total Housing Units | 89 (78.8%) | 24 (21.2%) |
Occupancy by Educational Attainment in Elmer City
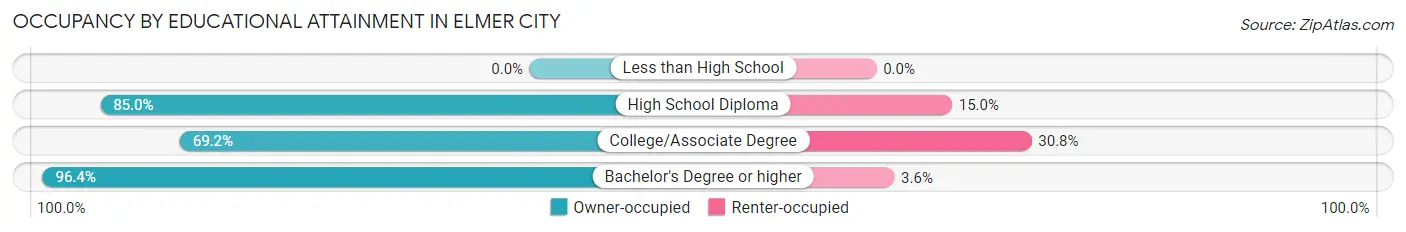
| Household Size | Owner-occupied | Renter-occupied |
| Less than High School | 0 (0.0%) | 0 (0.0%) |
| High School Diploma | 17 (85.0%) | 3 (15.0%) |
| College/Associate Degree | 45 (69.2%) | 20 (30.8%) |
| Bachelor's Degree or higher | 27 (96.4%) | 1 (3.6%) |
Occupancy by Age of Householder in Elmer City
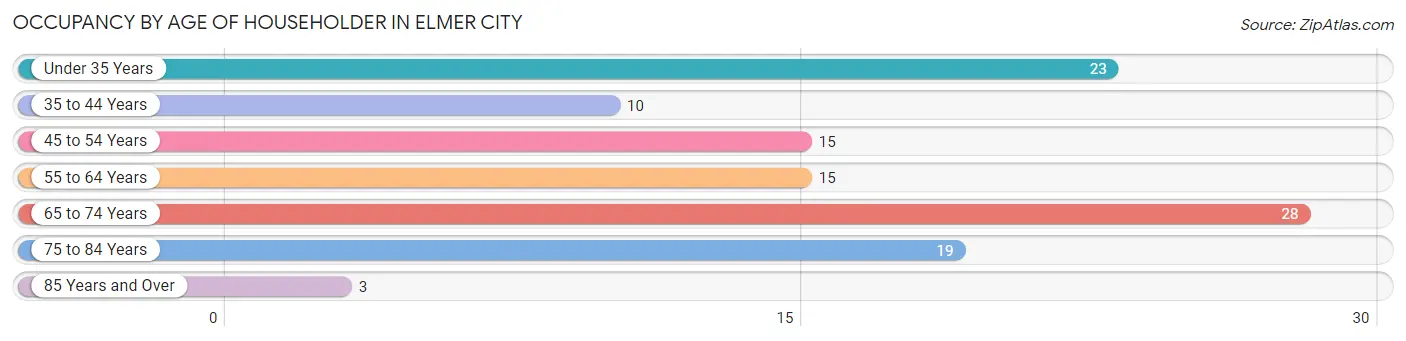
| Age Bracket | # Households | % Households |
| Under 35 Years | 23 | 20.3% |
| 35 to 44 Years | 10 | 8.8% |
| 45 to 54 Years | 15 | 13.3% |
| 55 to 64 Years | 15 | 13.3% |
| 65 to 74 Years | 28 | 24.8% |
| 75 to 84 Years | 19 | 16.8% |
| 85 Years and Over | 3 | 2.6% |
| Total | 113 | 100.0% |
Housing Finances in Elmer City
Median Income by Occupancy in Elmer City
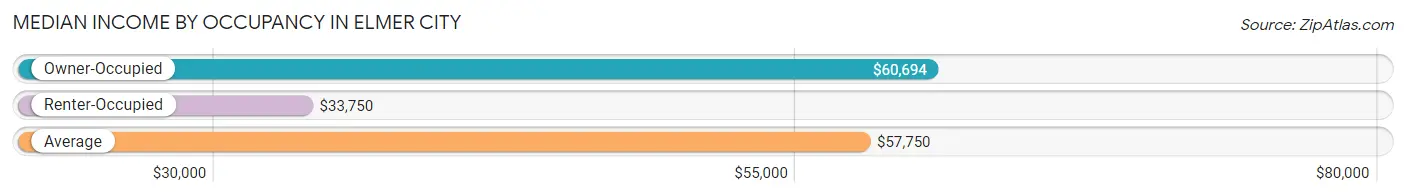
| Occupancy Type | # Households | Median Income |
| Owner-Occupied | 89 (78.8%) | $60,694 |
| Renter-Occupied | 24 (21.2%) | $33,750 |
| Average | 113 (100.0%) | $57,750 |
Occupancy by Householder Income Bracket in Elmer City
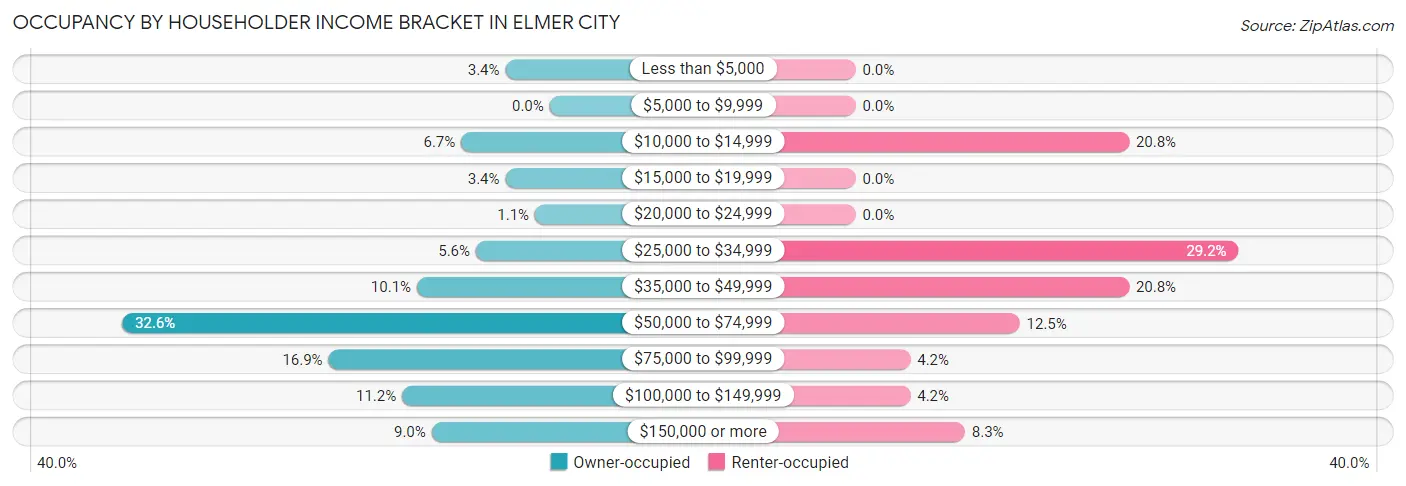
| Income Bracket | Owner-occupied | Renter-occupied |
| Less than $5,000 | 3 (3.4%) | 0 (0.0%) |
| $5,000 to $9,999 | 0 (0.0%) | 0 (0.0%) |
| $10,000 to $14,999 | 6 (6.7%) | 5 (20.8%) |
| $15,000 to $19,999 | 3 (3.4%) | 0 (0.0%) |
| $20,000 to $24,999 | 1 (1.1%) | 0 (0.0%) |
| $25,000 to $34,999 | 5 (5.6%) | 7 (29.2%) |
| $35,000 to $49,999 | 9 (10.1%) | 5 (20.8%) |
| $50,000 to $74,999 | 29 (32.6%) | 3 (12.5%) |
| $75,000 to $99,999 | 15 (16.9%) | 1 (4.2%) |
| $100,000 to $149,999 | 10 (11.2%) | 1 (4.2%) |
| $150,000 or more | 8 (9.0%) | 2 (8.3%) |
| Total | 89 (100.0%) | 24 (100.0%) |
Monthly Housing Cost Tiers in Elmer City
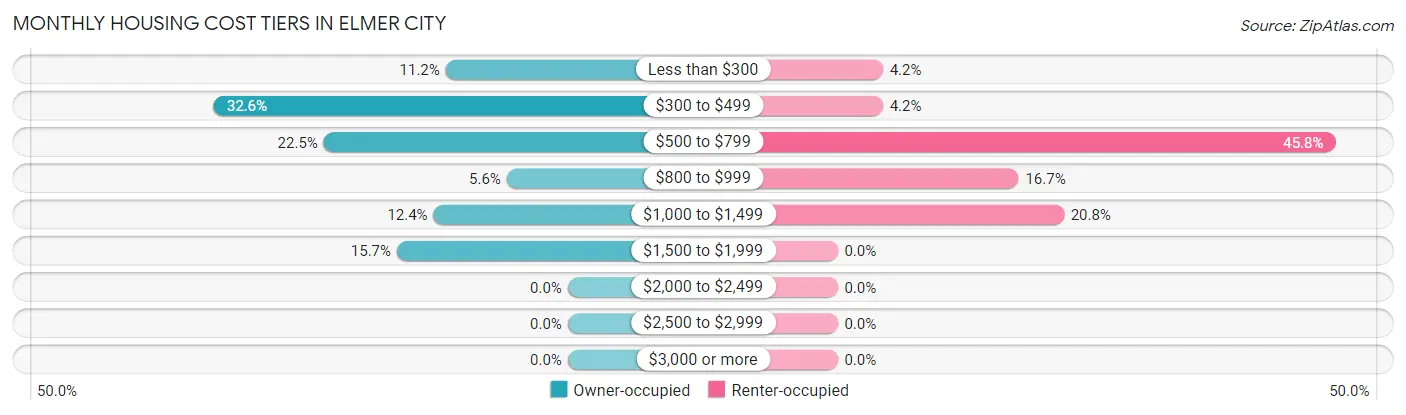
| Monthly Cost | Owner-occupied | Renter-occupied |
| Less than $300 | 10 (11.2%) | 1 (4.2%) |
| $300 to $499 | 29 (32.6%) | 1 (4.2%) |
| $500 to $799 | 20 (22.5%) | 11 (45.8%) |
| $800 to $999 | 5 (5.6%) | 4 (16.7%) |
| $1,000 to $1,499 | 11 (12.4%) | 5 (20.8%) |
| $1,500 to $1,999 | 14 (15.7%) | 0 (0.0%) |
| $2,000 to $2,499 | 0 (0.0%) | 0 (0.0%) |
| $2,500 to $2,999 | 0 (0.0%) | 0 (0.0%) |
| $3,000 or more | 0 (0.0%) | 0 (0.0%) |
| Total | 89 (100.0%) | 24 (100.0%) |
Physical Housing Characteristics in Elmer City
Housing Structures in Elmer City
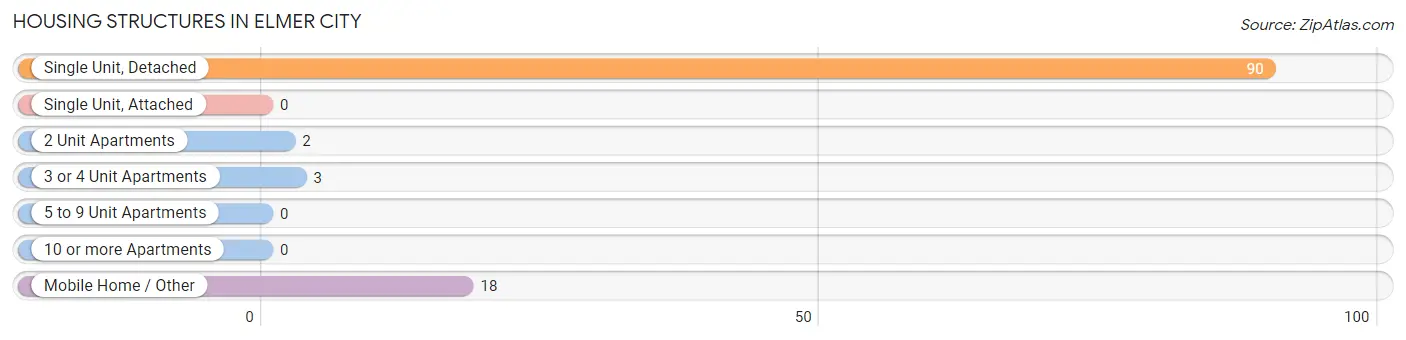
| Structure Type | # Housing Units | % Housing Units |
| Single Unit, Detached | 90 | 79.6% |
| Single Unit, Attached | 0 | 0.0% |
| 2 Unit Apartments | 2 | 1.8% |
| 3 or 4 Unit Apartments | 3 | 2.6% |
| 5 to 9 Unit Apartments | 0 | 0.0% |
| 10 or more Apartments | 0 | 0.0% |
| Mobile Home / Other | 18 | 15.9% |
| Total | 113 | 100.0% |
Housing Structures by Occupancy in Elmer City
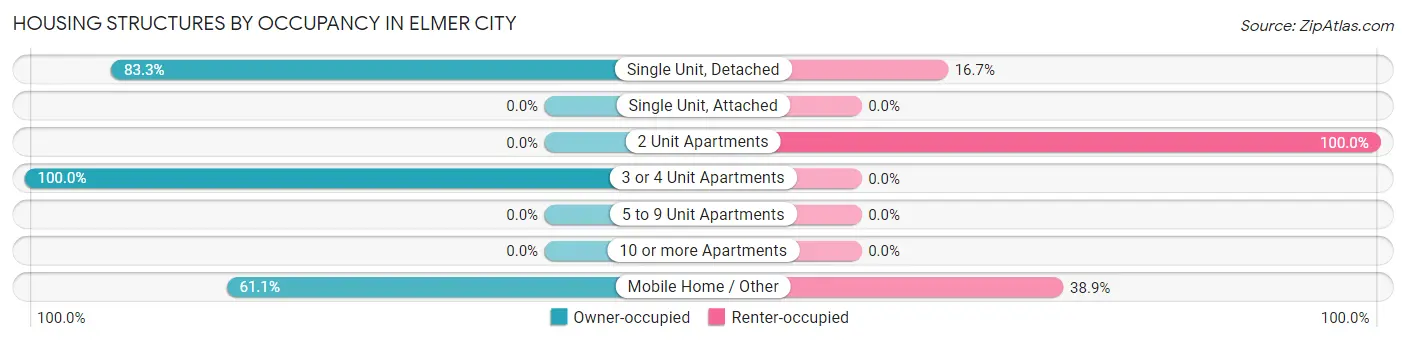
| Structure Type | Owner-occupied | Renter-occupied |
| Single Unit, Detached | 75 (83.3%) | 15 (16.7%) |
| Single Unit, Attached | 0 (0.0%) | 0 (0.0%) |
| 2 Unit Apartments | 0 (0.0%) | 2 (100.0%) |
| 3 or 4 Unit Apartments | 3 (100.0%) | 0 (0.0%) |
| 5 to 9 Unit Apartments | 0 (0.0%) | 0 (0.0%) |
| 10 or more Apartments | 0 (0.0%) | 0 (0.0%) |
| Mobile Home / Other | 11 (61.1%) | 7 (38.9%) |
| Total | 89 (78.8%) | 24 (21.2%) |
Housing Structures by Number of Rooms in Elmer City
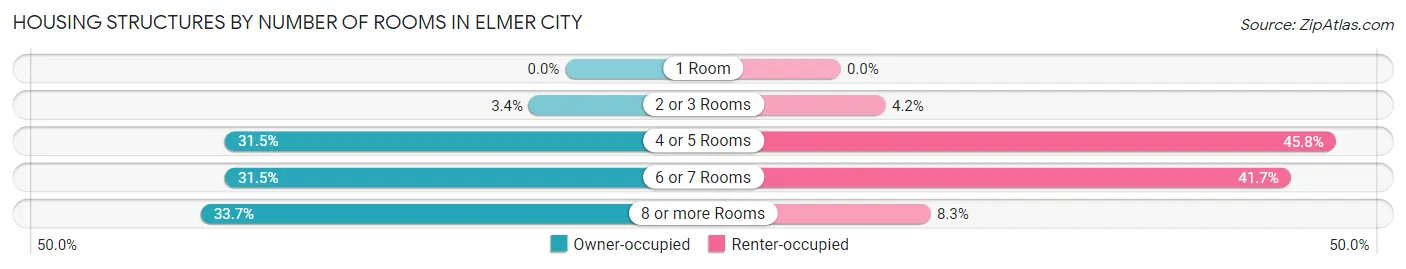
| Number of Rooms | Owner-occupied | Renter-occupied |
| 1 Room | 0 (0.0%) | 0 (0.0%) |
| 2 or 3 Rooms | 3 (3.4%) | 1 (4.2%) |
| 4 or 5 Rooms | 28 (31.5%) | 11 (45.8%) |
| 6 or 7 Rooms | 28 (31.5%) | 10 (41.7%) |
| 8 or more Rooms | 30 (33.7%) | 2 (8.3%) |
| Total | 89 (100.0%) | 24 (100.0%) |
Housing Structure by Heating Type in Elmer City
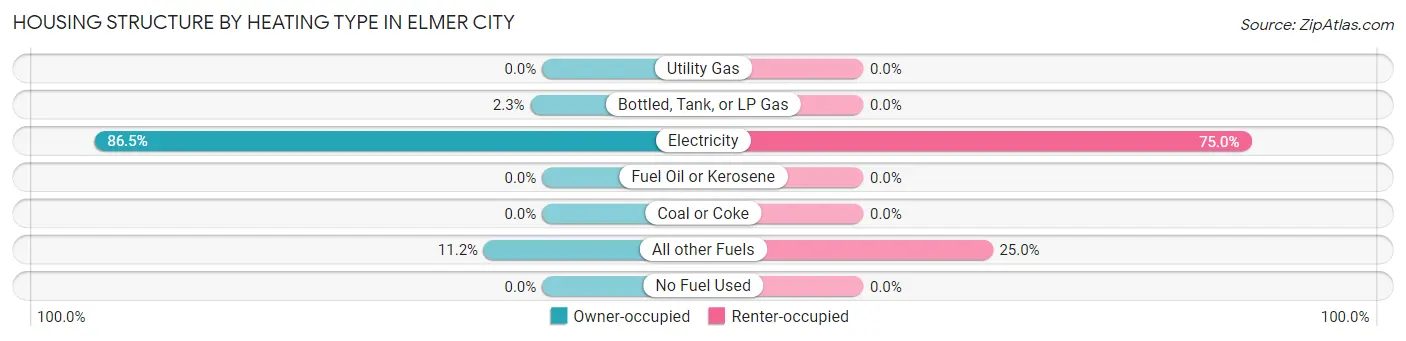
| Heating Type | Owner-occupied | Renter-occupied |
| Utility Gas | 0 (0.0%) | 0 (0.0%) |
| Bottled, Tank, or LP Gas | 2 (2.2%) | 0 (0.0%) |
| Electricity | 77 (86.5%) | 18 (75.0%) |
| Fuel Oil or Kerosene | 0 (0.0%) | 0 (0.0%) |
| Coal or Coke | 0 (0.0%) | 0 (0.0%) |
| All other Fuels | 10 (11.2%) | 6 (25.0%) |
| No Fuel Used | 0 (0.0%) | 0 (0.0%) |
| Total | 89 (100.0%) | 24 (100.0%) |
Household Vehicle Usage in Elmer City
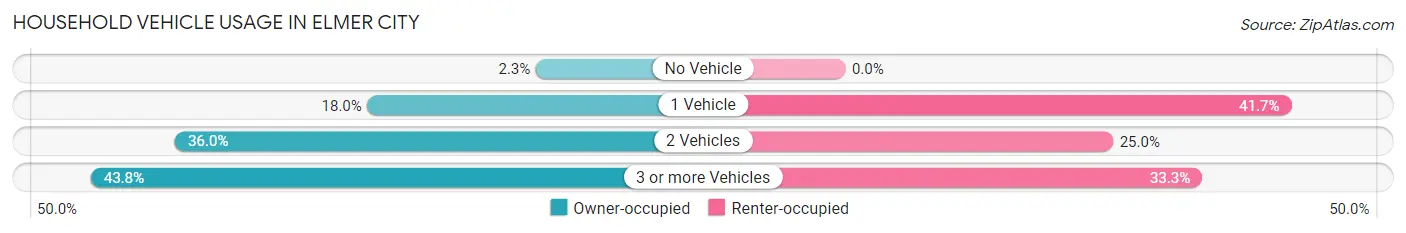
| Vehicles per Household | Owner-occupied | Renter-occupied |
| No Vehicle | 2 (2.2%) | 0 (0.0%) |
| 1 Vehicle | 16 (18.0%) | 10 (41.7%) |
| 2 Vehicles | 32 (36.0%) | 6 (25.0%) |
| 3 or more Vehicles | 39 (43.8%) | 8 (33.3%) |
| Total | 89 (100.0%) | 24 (100.0%) |
Real Estate & Mortgages in Elmer City
Real Estate and Mortgage Overview in Elmer City
| Characteristic | Without Mortgage | With Mortgage |
| Housing Units | 60 | 29 |
| Median Property Value | $195,000 | $159,400 |
| Median Household Income | $60,556 | $4 |
| Monthly Housing Costs | $418 | $0 |
| Real Estate Taxes | $1,406 | $2 |
Property Value by Mortgage Status in Elmer City
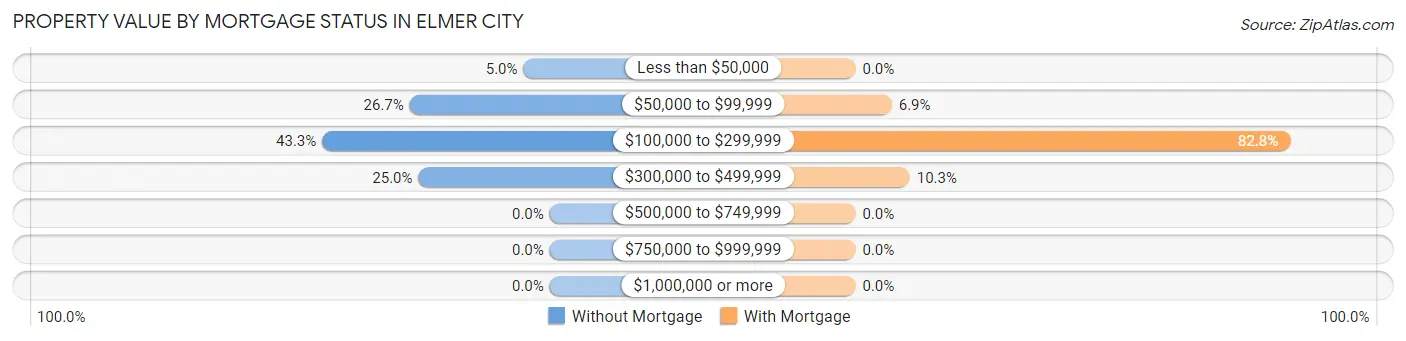
| Property Value | Without Mortgage | With Mortgage |
| Less than $50,000 | 3 (5.0%) | 0 (0.0%) |
| $50,000 to $99,999 | 16 (26.7%) | 2 (6.9%) |
| $100,000 to $299,999 | 26 (43.3%) | 24 (82.8%) |
| $300,000 to $499,999 | 15 (25.0%) | 3 (10.3%) |
| $500,000 to $749,999 | 0 (0.0%) | 0 (0.0%) |
| $750,000 to $999,999 | 0 (0.0%) | 0 (0.0%) |
| $1,000,000 or more | 0 (0.0%) | 0 (0.0%) |
| Total | 60 (100.0%) | 29 (100.0%) |
Household Income by Mortgage Status in Elmer City
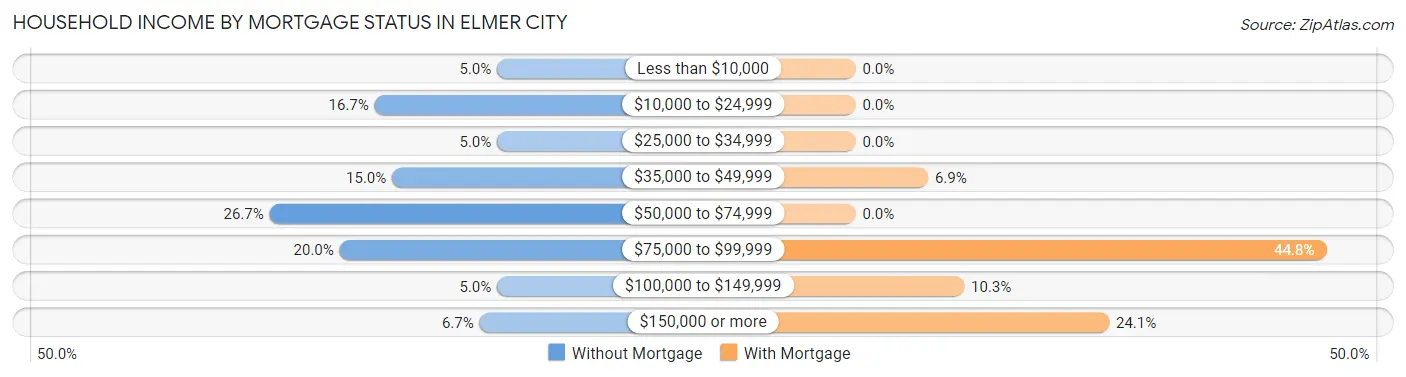
| Household Income | Without Mortgage | With Mortgage |
| Less than $10,000 | 3 (5.0%) | 0 (0.0%) |
| $10,000 to $24,999 | 10 (16.7%) | 0 (0.0%) |
| $25,000 to $34,999 | 3 (5.0%) | 0 (0.0%) |
| $35,000 to $49,999 | 9 (15.0%) | 2 (6.9%) |
| $50,000 to $74,999 | 16 (26.7%) | 0 (0.0%) |
| $75,000 to $99,999 | 12 (20.0%) | 13 (44.8%) |
| $100,000 to $149,999 | 3 (5.0%) | 3 (10.3%) |
| $150,000 or more | 4 (6.7%) | 7 (24.1%) |
| Total | 60 (100.0%) | 29 (100.0%) |
Property Value to Household Income Ratio in Elmer City
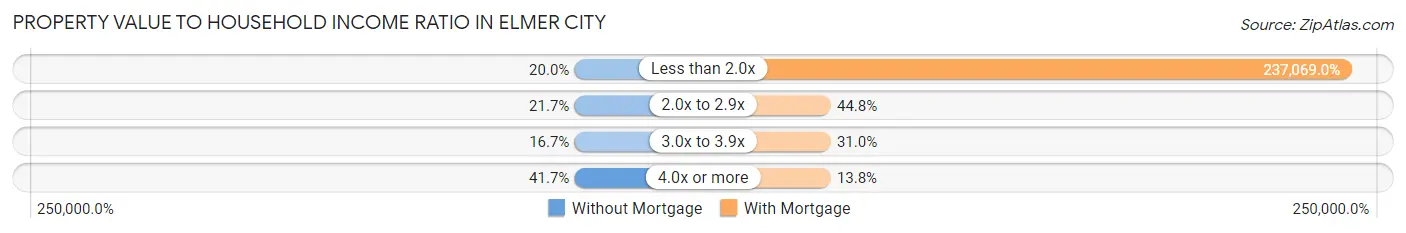
| Value-to-Income Ratio | Without Mortgage | With Mortgage |
| Less than 2.0x | 12 (20.0%) | 68,750 (237,069.0%) |
| 2.0x to 2.9x | 13 (21.7%) | 13 (44.8%) |
| 3.0x to 3.9x | 10 (16.7%) | 9 (31.0%) |
| 4.0x or more | 25 (41.7%) | 4 (13.8%) |
| Total | 60 (100.0%) | 29 (100.0%) |
Real Estate Taxes by Mortgage Status in Elmer City
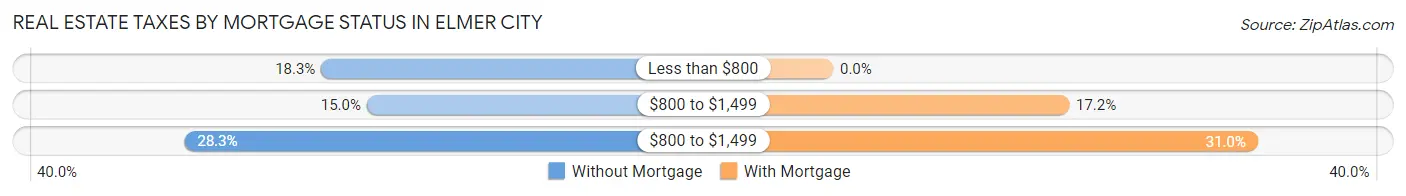
| Property Taxes | Without Mortgage | With Mortgage |
| Less than $800 | 11 (18.3%) | 0 (0.0%) |
| $800 to $1,499 | 9 (15.0%) | 5 (17.2%) |
| $800 to $1,499 | 17 (28.3%) | 9 (31.0%) |
| Total | 60 (100.0%) | 29 (100.0%) |
Health & Disability in Elmer City
Health Insurance Coverage by Age in Elmer City
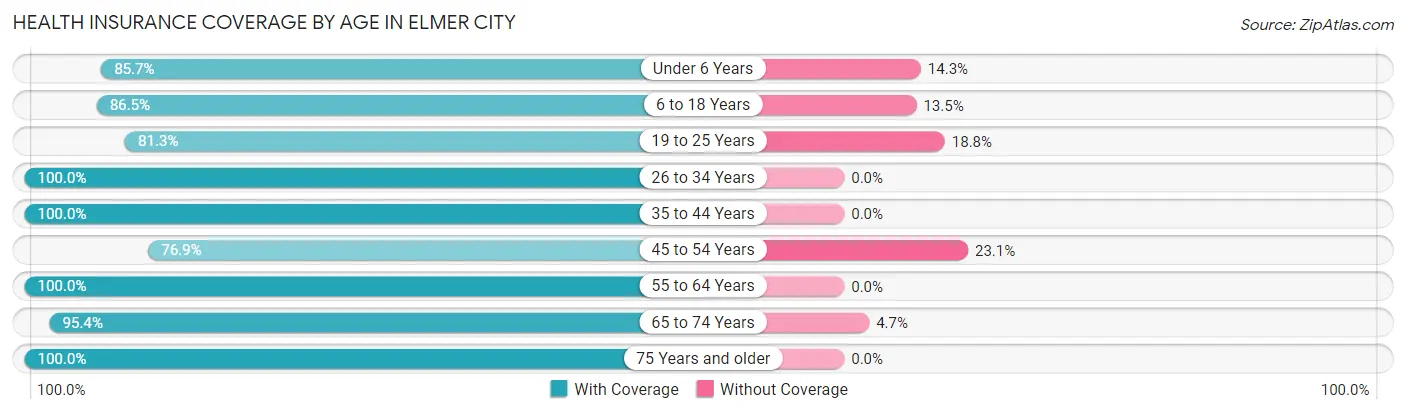
| Age Bracket | With Coverage | Without Coverage |
| Under 6 Years | 30 (85.7%) | 5 (14.3%) |
| 6 to 18 Years | 45 (86.5%) | 7 (13.5%) |
| 19 to 25 Years | 13 (81.2%) | 3 (18.8%) |
| 26 to 34 Years | 35 (100.0%) | 0 (0.0%) |
| 35 to 44 Years | 15 (100.0%) | 0 (0.0%) |
| 45 to 54 Years | 20 (76.9%) | 6 (23.1%) |
| 55 to 64 Years | 24 (100.0%) | 0 (0.0%) |
| 65 to 74 Years | 41 (95.4%) | 2 (4.6%) |
| 75 Years and older | 30 (100.0%) | 0 (0.0%) |
| Total | 253 (91.7%) | 23 (8.3%) |
Health Insurance Coverage by Citizenship Status in Elmer City
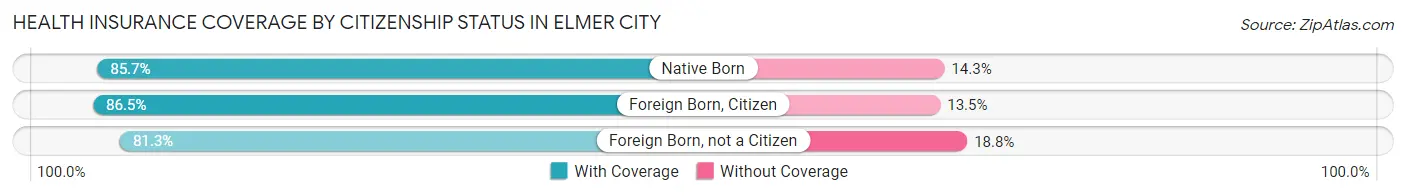
| Citizenship Status | With Coverage | Without Coverage |
| Native Born | 30 (85.7%) | 5 (14.3%) |
| Foreign Born, Citizen | 45 (86.5%) | 7 (13.5%) |
| Foreign Born, not a Citizen | 13 (81.2%) | 3 (18.8%) |
Health Insurance Coverage by Household Income in Elmer City
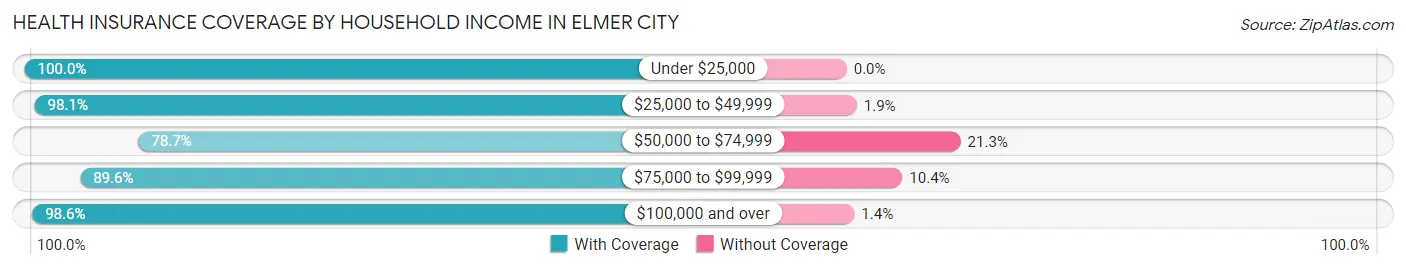
| Household Income | With Coverage | Without Coverage |
| Under $25,000 | 30 (100.0%) | 0 (0.0%) |
| $25,000 to $49,999 | 52 (98.1%) | 1 (1.9%) |
| $50,000 to $74,999 | 59 (78.7%) | 16 (21.3%) |
| $75,000 to $99,999 | 43 (89.6%) | 5 (10.4%) |
| $100,000 and over | 69 (98.6%) | 1 (1.4%) |
Public vs Private Health Insurance Coverage by Age in Elmer City
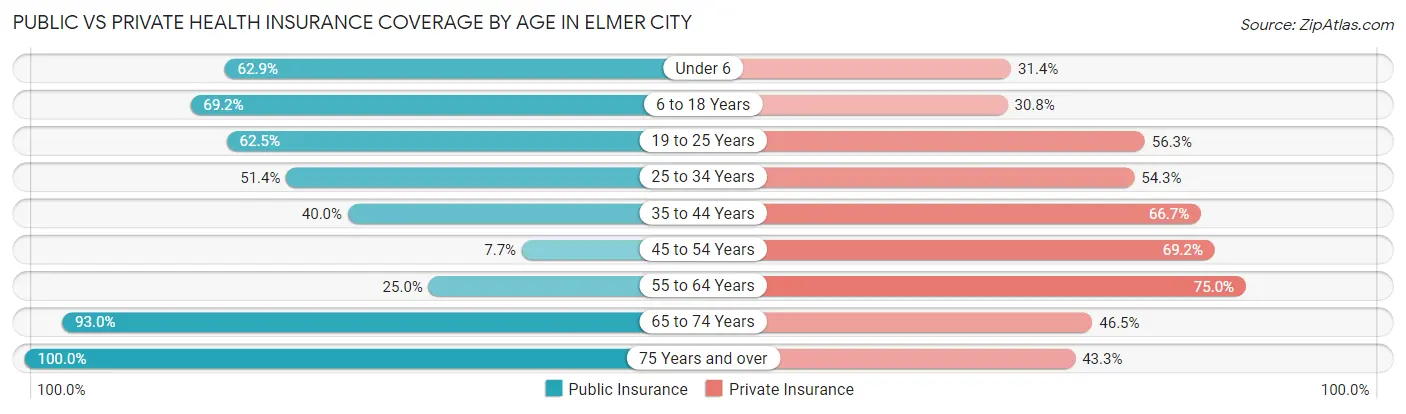
| Age Bracket | Public Insurance | Private Insurance |
| Under 6 | 22 (62.9%) | 11 (31.4%) |
| 6 to 18 Years | 36 (69.2%) | 16 (30.8%) |
| 19 to 25 Years | 10 (62.5%) | 9 (56.2%) |
| 25 to 34 Years | 18 (51.4%) | 19 (54.3%) |
| 35 to 44 Years | 6 (40.0%) | 10 (66.7%) |
| 45 to 54 Years | 2 (7.7%) | 18 (69.2%) |
| 55 to 64 Years | 6 (25.0%) | 18 (75.0%) |
| 65 to 74 Years | 40 (93.0%) | 20 (46.5%) |
| 75 Years and over | 30 (100.0%) | 13 (43.3%) |
| Total | 170 (61.6%) | 134 (48.5%) |
Disability Status by Sex by Age in Elmer City
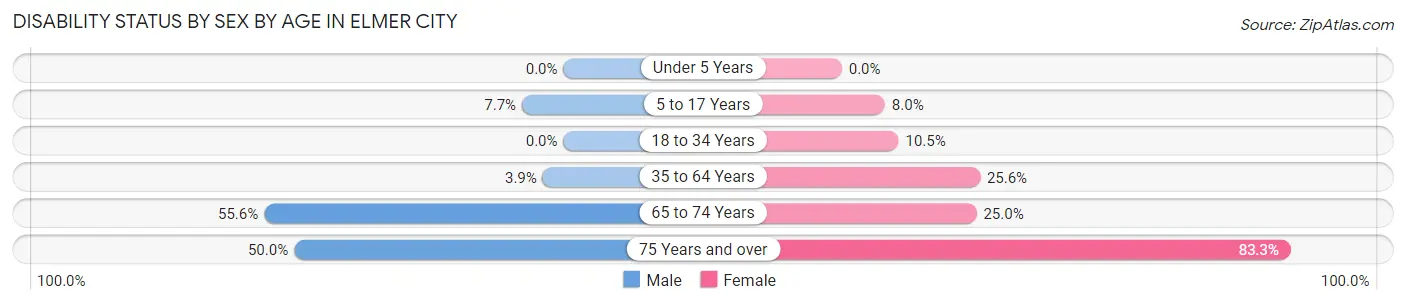
| Age Bracket | Male | Female |
| Under 5 Years | 0 (0.0%) | 0 (0.0%) |
| 5 to 17 Years | 2 (7.7%) | 2 (8.0%) |
| 18 to 34 Years | 0 (0.0%) | 4 (10.5%) |
| 35 to 64 Years | 1 (3.8%) | 10 (25.6%) |
| 65 to 74 Years | 15 (55.6%) | 4 (25.0%) |
| 75 Years and over | 3 (50.0%) | 20 (83.3%) |
Disability Class by Sex by Age in Elmer City
Disability Class: Hearing Difficulty
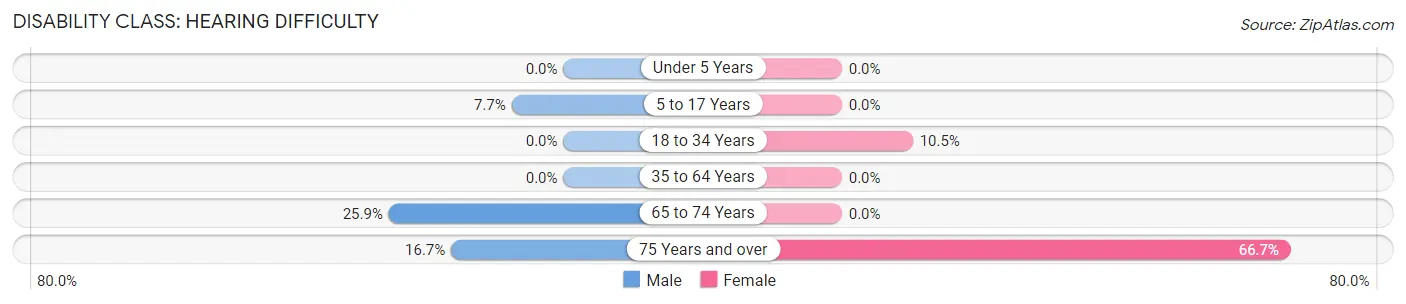
| Age Bracket | Male | Female |
| Under 5 Years | 0 (0.0%) | 0 (0.0%) |
| 5 to 17 Years | 2 (7.7%) | 0 (0.0%) |
| 18 to 34 Years | 0 (0.0%) | 4 (10.5%) |
| 35 to 64 Years | 0 (0.0%) | 0 (0.0%) |
| 65 to 74 Years | 7 (25.9%) | 0 (0.0%) |
| 75 Years and over | 1 (16.7%) | 16 (66.7%) |
Disability Class: Vision Difficulty
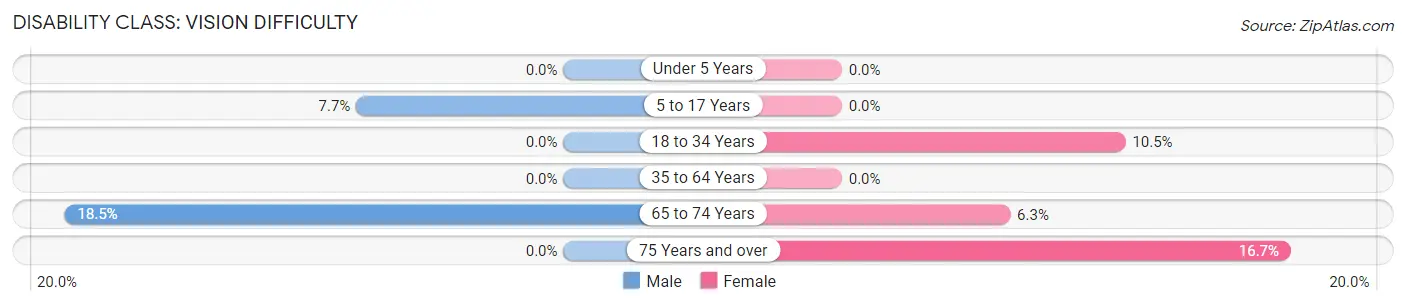
| Age Bracket | Male | Female |
| Under 5 Years | 0 (0.0%) | 0 (0.0%) |
| 5 to 17 Years | 2 (7.7%) | 0 (0.0%) |
| 18 to 34 Years | 0 (0.0%) | 4 (10.5%) |
| 35 to 64 Years | 0 (0.0%) | 0 (0.0%) |
| 65 to 74 Years | 5 (18.5%) | 1 (6.2%) |
| 75 Years and over | 0 (0.0%) | 4 (16.7%) |
Disability Class: Cognitive Difficulty
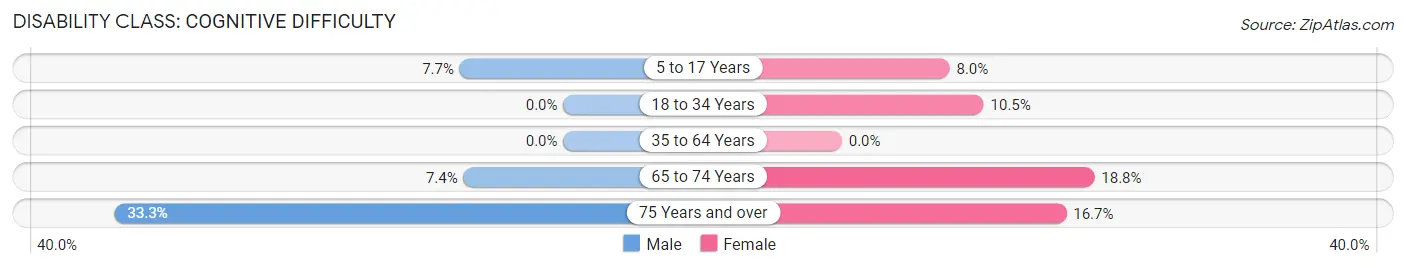
| Age Bracket | Male | Female |
| 5 to 17 Years | 2 (7.7%) | 2 (8.0%) |
| 18 to 34 Years | 0 (0.0%) | 4 (10.5%) |
| 35 to 64 Years | 0 (0.0%) | 0 (0.0%) |
| 65 to 74 Years | 2 (7.4%) | 3 (18.8%) |
| 75 Years and over | 2 (33.3%) | 4 (16.7%) |
Disability Class: Ambulatory Difficulty
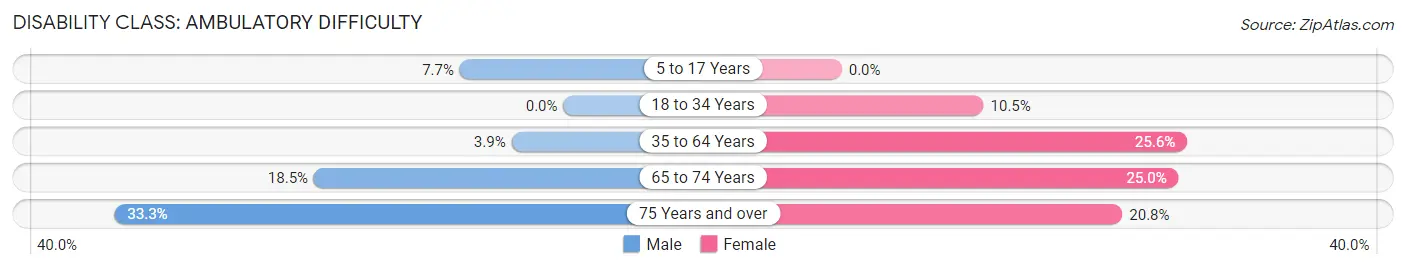
| Age Bracket | Male | Female |
| 5 to 17 Years | 2 (7.7%) | 0 (0.0%) |
| 18 to 34 Years | 0 (0.0%) | 4 (10.5%) |
| 35 to 64 Years | 1 (3.8%) | 10 (25.6%) |
| 65 to 74 Years | 5 (18.5%) | 4 (25.0%) |
| 75 Years and over | 2 (33.3%) | 5 (20.8%) |
Disability Class: Self-Care Difficulty
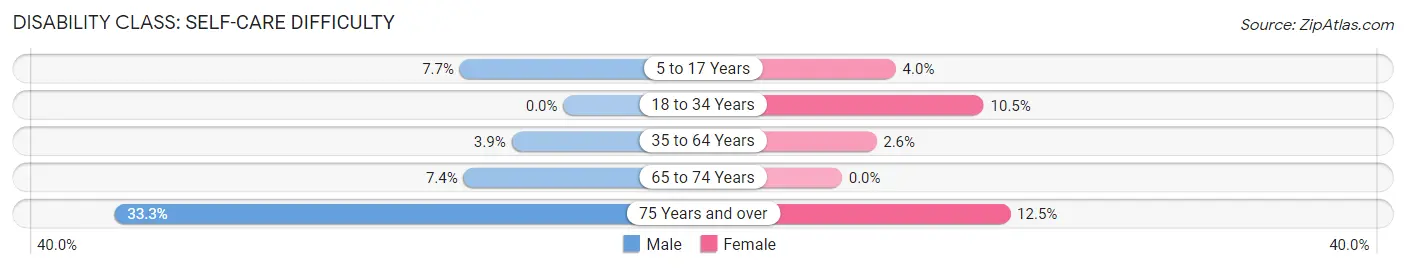
| Age Bracket | Male | Female |
| 5 to 17 Years | 2 (7.7%) | 1 (4.0%) |
| 18 to 34 Years | 0 (0.0%) | 4 (10.5%) |
| 35 to 64 Years | 1 (3.8%) | 1 (2.6%) |
| 65 to 74 Years | 2 (7.4%) | 0 (0.0%) |
| 75 Years and over | 2 (33.3%) | 3 (12.5%) |
Technology Access in Elmer City
Computing Device Access in Elmer City
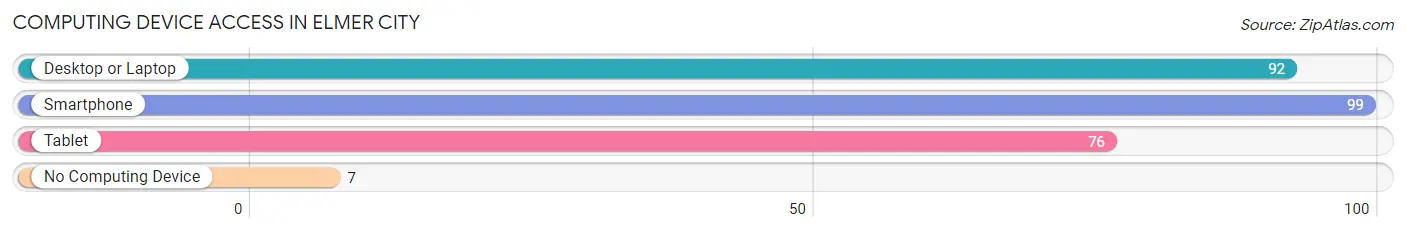
| Device Type | # Households | % Households |
| Desktop or Laptop | 92 | 81.4% |
| Smartphone | 99 | 87.6% |
| Tablet | 76 | 67.3% |
| No Computing Device | 7 | 6.2% |
| Total | 113 | 100.0% |
Internet Access in Elmer City
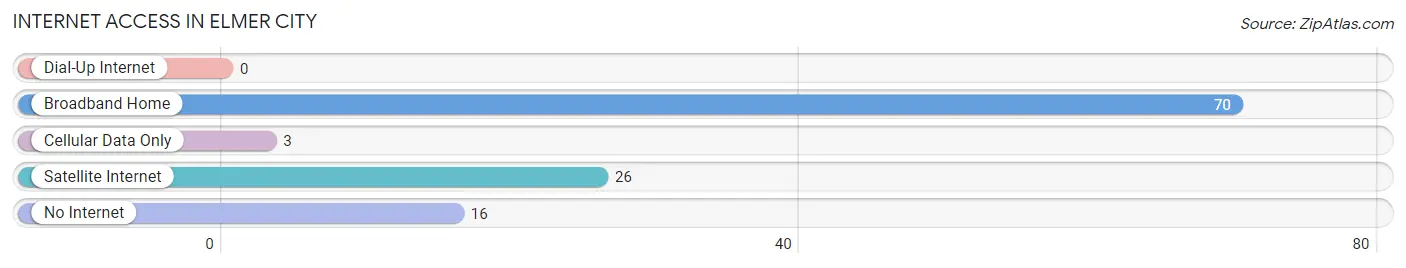
| Internet Type | # Households | % Households |
| Dial-Up Internet | 0 | 0.0% |
| Broadband Home | 70 | 62.0% |
| Cellular Data Only | 3 | 2.6% |
| Satellite Internet | 26 | 23.0% |
| No Internet | 16 | 14.2% |
| Total | 113 | 100.0% |
Elmer City Summary
Elmer City is a small town located in the state of Washington, United States. It is situated in the Okanogan County, and is part of the Okanogan Valley. The town is located on the banks of the Columbia River, and is surrounded by the Grand Coulee Dam, the Columbia River, and the Okanogan National Forest. The town has a population of approximately 500 people, and is a popular tourist destination due to its proximity to the Grand Coulee Dam and the Columbia River.
History
Elmer City was founded in the early 1900s by a group of settlers from the Midwest. The settlers were looking for a place to settle and start a new life, and they chose the area around the Columbia River. The town was named after Elmer E. Smith, who was the first settler to arrive in the area. The town was officially incorporated in 1909, and the first mayor was elected in 1910.
The town grew slowly over the years, and by the 1950s it had a population of around 500 people. The town was mainly a farming community, and the main crops grown were wheat, barley, and potatoes. The town also had a small sawmill, which provided employment for many of the residents.
In the 1960s, the Grand Coulee Dam was built, and the town was flooded. The town was relocated to higher ground, and the new town was named Elmer City. The town has since grown and developed, and today it is a popular tourist destination due to its proximity to the Grand Coulee Dam and the Columbia River.
Geography
Elmer City is located in the Okanogan Valley, and is surrounded by the Grand Coulee Dam, the Columbia River, and the Okanogan National Forest. The town is situated at an elevation of 1,890 feet, and has a total area of 0.7 square miles. The town is located in a semi-arid climate, and has hot summers and cold winters.
The town is located on the banks of the Columbia River, and is a popular destination for fishing, boating, and other outdoor activities. The town is also home to several parks, including the Elmer City Park, which features a playground, picnic areas, and a boat launch.
Economy
The economy of Elmer City is mainly based on tourism and agriculture. The town is a popular destination for fishing, boating, and other outdoor activities, and the town also has several parks and recreational areas. The town is also home to several businesses, including restaurants, hotels, and retail stores.
Agriculture is also an important part of the economy, and the main crops grown in the area are wheat, barley, and potatoes. The town also has a small sawmill, which provides employment for many of the residents.
Demographics
As of the 2010 census, the population of Elmer City was 498 people. The racial makeup of the town was 94.4% White, 0.2% African American, 0.4% Native American, 0.2% Asian, 0.2% Pacific Islander, and 4.8% from other races. The median household income was $35,625, and the median family income was $41,250. The per capita income was $17,845.
Conclusion
Elmer City is a small town located in the state of Washington, United States. It is situated in the Okanogan County, and is part of the Okanogan Valley. The town is located on the banks of the Columbia River, and is surrounded by the Grand Coulee Dam, the Columbia River, and the Okanogan National Forest. The town has a population of approximately 500 people, and is a popular tourist destination due to its proximity to the Grand Coulee Dam and the Columbia River. The economy of Elmer City is mainly based on tourism and agriculture, and the town is also home to several businesses, including restaurants, hotels, and retail stores. The racial makeup of the town is 94.4% White, 0.2% African American, 0.4% Native American, 0.2% Asian, 0.2% Pacific Islander, and 4.8% from other races. The median household income was $35,625, and the median family income was $41,250.
Common Questions
What is Per Capita Income in Elmer City?
Per Capita income in Elmer City is $28,297.
What is the Median Family Income in Elmer City?
Median Family Income in Elmer City is $61,944.
What is the Median Household income in Elmer City?
Median Household Income in Elmer City is $57,750.
What is Income or Wage Gap in Elmer City?
Income or Wage Gap in Elmer City is 51.8%.
Women in Elmer City earn 48.2 cents for every dollar earned by a man.
What is Inequality or Gini Index in Elmer City?
Inequality or Gini Index in Elmer City is 0.40.
What is the Total Population of Elmer City?
Total Population of Elmer City is 276.
What is the Total Male Population of Elmer City?
Total Male Population of Elmer City is 119.
What is the Total Female Population of Elmer City?
Total Female Population of Elmer City is 157.
What is the Ratio of Males per 100 Females in Elmer City?
There are 75.80 Males per 100 Females in Elmer City.
What is the Ratio of Females per 100 Males in Elmer City?
There are 131.93 Females per 100 Males in Elmer City.
What is the Median Population Age in Elmer City?
Median Population Age in Elmer City is 35.0 Years.
What is the Average Family Size in Elmer City
Average Family Size in Elmer City is 2.8 People.
What is the Average Household Size in Elmer City
Average Household Size in Elmer City is 2.4 People.
How Large is the Labor Force in Elmer City?
There are 95 People in the Labor Forcein in Elmer City.
What is the Percentage of People in the Labor Force in Elmer City?
47.5% of People are in the Labor Force in Elmer City.
What is the Unemployment Rate in Elmer City?
Unemployment Rate in Elmer City is 5.3%.