Cusick, WA Map & Demographics
Cusick Map
Cusick Overview
$19,794
PER CAPITA INCOME
$59,107
AVG FAMILY INCOME
$55,625
AVG HOUSEHOLD INCOME
58.3%
WAGE / INCOME GAP [ % ]
41.7¢/ $1
WAGE / INCOME GAP [ $ ]
0.34
INEQUALITY / GINI INDEX
185
TOTAL POPULATION
91
MALE POPULATION
94
FEMALE POPULATION
96.81
MALES / 100 FEMALES
103.30
FEMALES / 100 MALES
49.8
MEDIAN AGE
3.2
AVG FAMILY SIZE
2.6
AVG HOUSEHOLD SIZE
61
LABOR FORCE [ PEOPLE ]
50.0%
PERCENT IN LABOR FORCE
9.8%
UNEMPLOYMENT RATE
Cusick Zip Codes
Cusick Area Codes
Income in Cusick
Income Overview in Cusick
Per Capita Income in Cusick is $19,794, while median incomes of families and households are $59,107 and $55,625 respectively.
| Characteristic | Number | Measure |
| Per Capita Income | 185 | $19,794 |
| Median Family Income | 47 | $59,107 |
| Mean Family Income | 47 | $60,498 |
| Median Household Income | 70 | $55,625 |
| Mean Household Income | 70 | $51,369 |
| Income Deficit | 47 | $0 |
| Wage / Income Gap (%) | 185 | 58.27% |
| Wage / Income Gap ($) | 185 | 41.73¢ per $1 |
| Gini / Inequality Index | 185 | 0.34 |
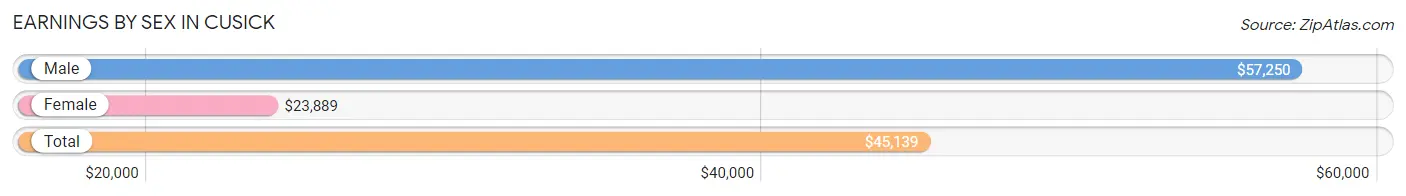
Earnings by Sex in Cusick
Average Earnings in Cusick are $45,139, $57,250 for men and $23,889 for women, a difference of 58.3%.
| Sex | Number | Average Earnings |
| Male | 29 (52.7%) | $57,250 |
| Female | 26 (47.3%) | $23,889 |
| Total | 55 (100.0%) | $45,139 |
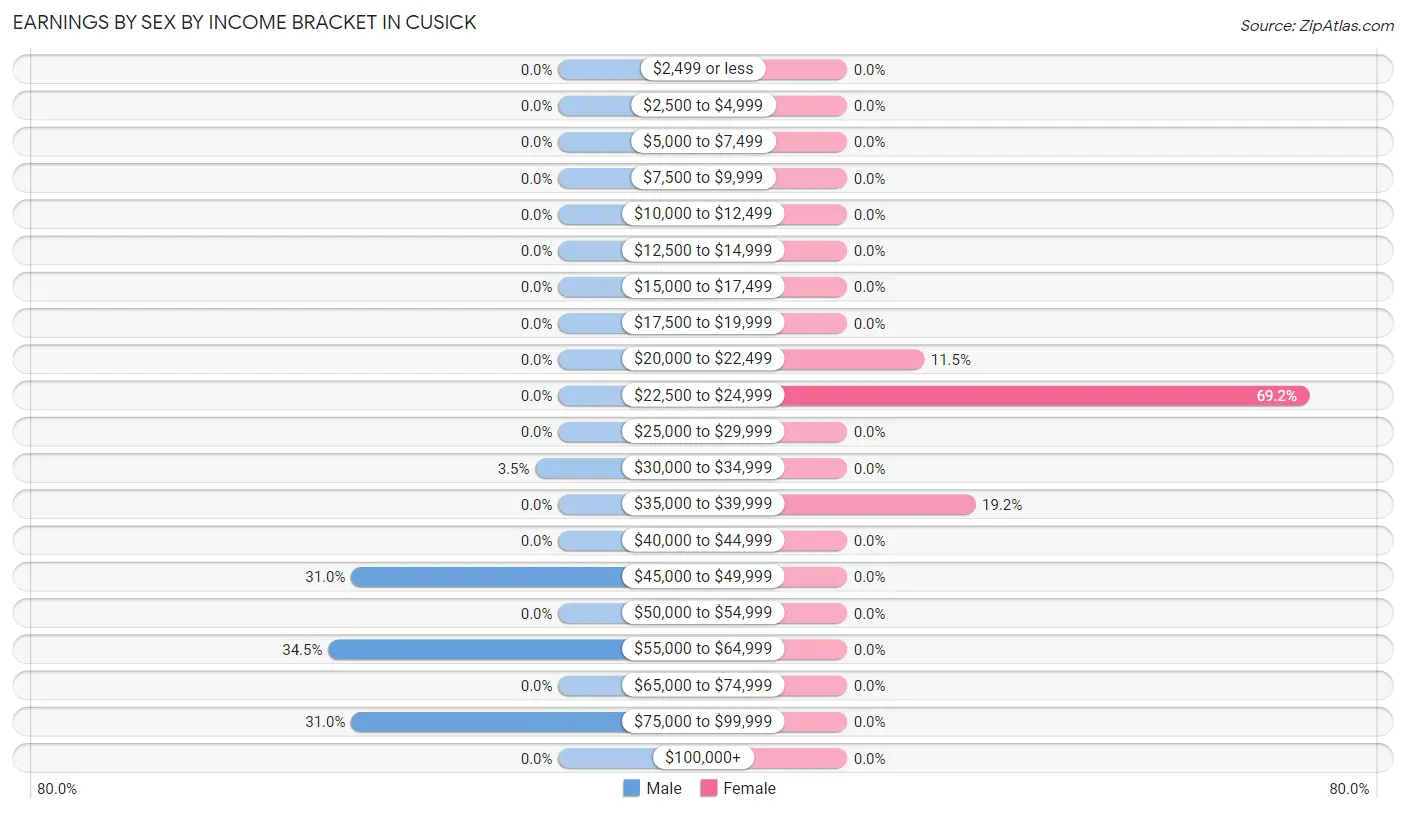
Earnings by Sex by Income Bracket in Cusick
The most common earnings brackets in Cusick are $55,000 to $64,999 for men (10 | 34.5%) and $22,500 to $24,999 for women (18 | 69.2%).
| Income | Male | Female |
| $2,499 or less | 0 (0.0%) | 0 (0.0%) |
| $2,500 to $4,999 | 0 (0.0%) | 0 (0.0%) |
| $5,000 to $7,499 | 0 (0.0%) | 0 (0.0%) |
| $7,500 to $9,999 | 0 (0.0%) | 0 (0.0%) |
| $10,000 to $12,499 | 0 (0.0%) | 0 (0.0%) |
| $12,500 to $14,999 | 0 (0.0%) | 0 (0.0%) |
| $15,000 to $17,499 | 0 (0.0%) | 0 (0.0%) |
| $17,500 to $19,999 | 0 (0.0%) | 0 (0.0%) |
| $20,000 to $22,499 | 0 (0.0%) | 3 (11.5%) |
| $22,500 to $24,999 | 0 (0.0%) | 18 (69.2%) |
| $25,000 to $29,999 | 0 (0.0%) | 0 (0.0%) |
| $30,000 to $34,999 | 1 (3.5%) | 0 (0.0%) |
| $35,000 to $39,999 | 0 (0.0%) | 5 (19.2%) |
| $40,000 to $44,999 | 0 (0.0%) | 0 (0.0%) |
| $45,000 to $49,999 | 9 (31.0%) | 0 (0.0%) |
| $50,000 to $54,999 | 0 (0.0%) | 0 (0.0%) |
| $55,000 to $64,999 | 10 (34.5%) | 0 (0.0%) |
| $65,000 to $74,999 | 0 (0.0%) | 0 (0.0%) |
| $75,000 to $99,999 | 9 (31.0%) | 0 (0.0%) |
| $100,000+ | 0 (0.0%) | 0 (0.0%) |
| Total | 29 (100.0%) | 26 (100.0%) |
Earnings by Sex by Educational Attainment in Cusick
| Educational Attainment | Male Income | Female Income |
| Less than High School | - | - |
| High School Diploma | - | - |
| College or Associate's Degree | - | - |
| Bachelor's Degree | - | - |
| Graduate Degree | - | - |
| Total | $57,250 | $23,889 |
Family Income in Cusick
Family Income Brackets in Cusick
According to the Cusick family income data, there are 16 families falling into the $50,000 to $74,999 income range, which is the most common income bracket and makes up 34.0% of all families.
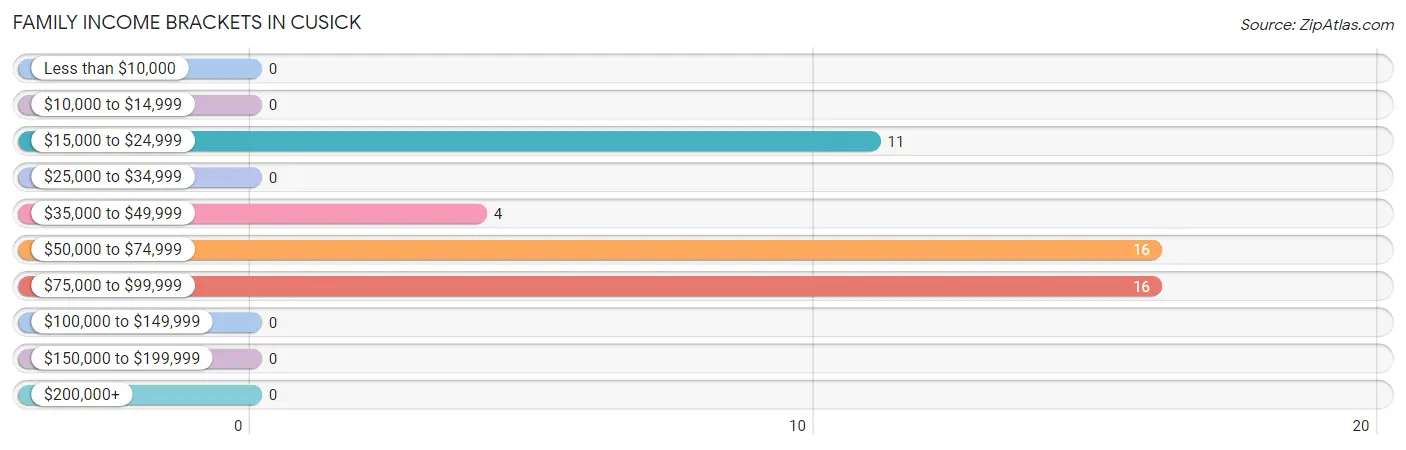
| Income Bracket | # Families | % Families |
| Less than $10,000 | 0 | 0.0% |
| $10,000 to $14,999 | 0 | 0.0% |
| $15,000 to $24,999 | 11 | 23.4% |
| $25,000 to $34,999 | 0 | 0.0% |
| $35,000 to $49,999 | 4 | 8.5% |
| $50,000 to $74,999 | 16 | 34.0% |
| $75,000 to $99,999 | 16 | 34.0% |
| $100,000 to $149,999 | 0 | 0.0% |
| $150,000 to $199,999 | 0 | 0.0% |
| $200,000+ | 0 | 0.0% |
Family Income by Famaliy Size in Cusick
2-person families (32 | 68.1%) account for the highest median family income in Cusick with $68,750 per family, while 2-person families (32 | 68.1%) have the highest median income of $34,375 per family member.
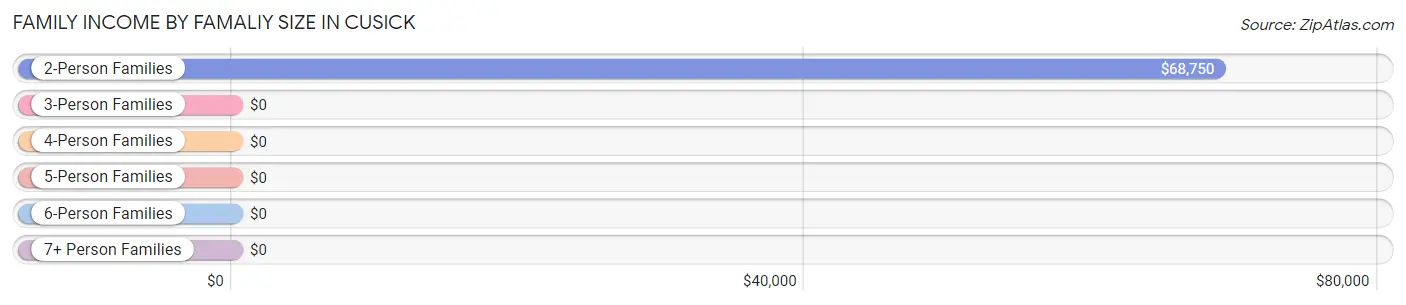
| Income Bracket | # Families | Median Income |
| 2-Person Families | 32 (68.1%) | $68,750 |
| 3-Person Families | 0 (0.0%) | $0 |
| 4-Person Families | 7 (14.9%) | $0 |
| 5-Person Families | 8 (17.0%) | $0 |
| 6-Person Families | 0 (0.0%) | $0 |
| 7+ Person Families | 0 (0.0%) | $0 |
| Total | 47 (100.0%) | $59,107 |
Family Income by Number of Earners in Cusick
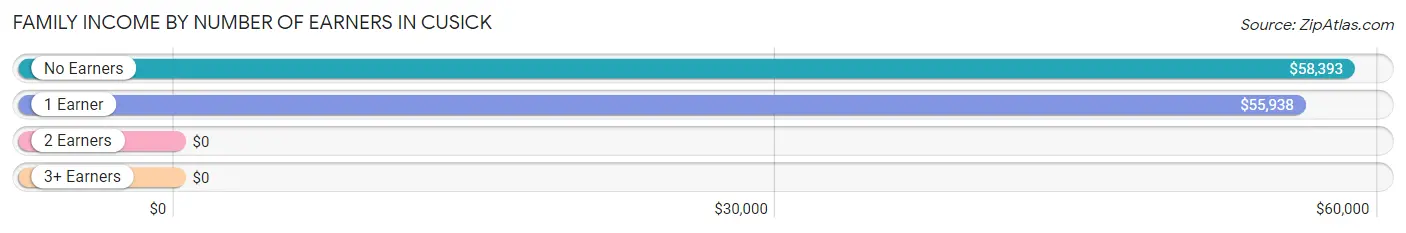
| Number of Earners | # Families | Median Income |
| No Earners | 13 (27.7%) | $58,393 |
| 1 Earner | 25 (53.2%) | $55,938 |
| 2 Earners | 9 (19.2%) | $0 |
| 3+ Earners | 0 (0.0%) | $0 |
| Total | 47 (100.0%) | $59,107 |
Household Income in Cusick
Household Income Brackets in Cusick
With 20 households falling in the category, the $75,000 to $99,999 income range is the most frequent in Cusick, accounting for 28.6% of all households.
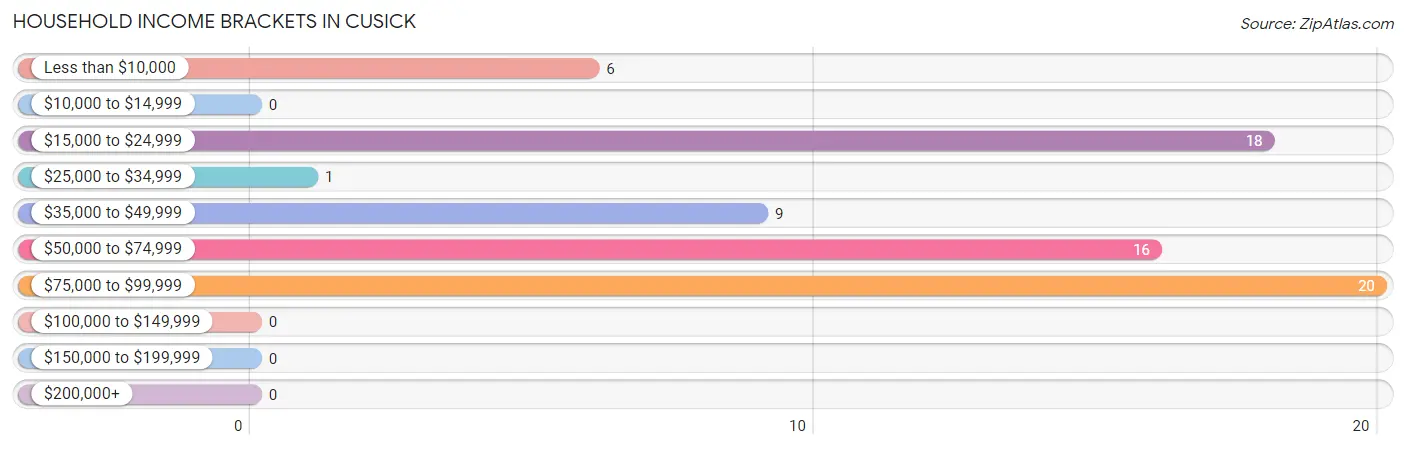
| Income Bracket | # Households | % Households |
| Less than $10,000 | 6 | 8.6% |
| $10,000 to $14,999 | 0 | 0.0% |
| $15,000 to $24,999 | 18 | 25.7% |
| $25,000 to $34,999 | 1 | 1.4% |
| $35,000 to $49,999 | 9 | 12.9% |
| $50,000 to $74,999 | 16 | 22.9% |
| $75,000 to $99,999 | 20 | 28.6% |
| $100,000 to $149,999 | 0 | 0.0% |
| $150,000 to $199,999 | 0 | 0.0% |
| $200,000+ | 0 | 0.0% |
Household Income by Householder Age in Cusick
The median household income in Cusick is $55,625, with the highest median household income of $57,857 found in the 45 to 64 years age bracket for the primary householder. A total of 40 households (57.1%) fall into this category.
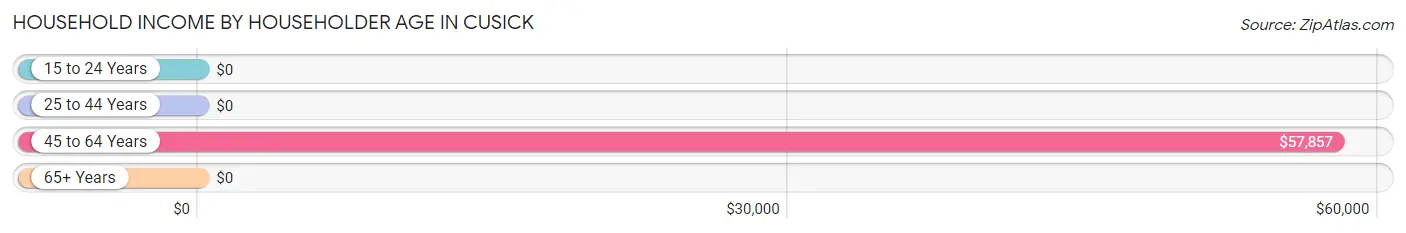
| Income Bracket | # Households | Median Income |
| 15 to 24 Years | 0 (0.0%) | $0 |
| 25 to 44 Years | 8 (11.4%) | $0 |
| 45 to 64 Years | 40 (57.1%) | $57,857 |
| 65+ Years | 22 (31.4%) | $0 |
| Total | 70 (100.0%) | $55,625 |
Poverty in Cusick
Income Below Poverty by Sex and Age in Cusick
With 41.8% poverty level for males and 51.1% for females among the residents of Cusick, 6 to 11 year old males and 6 to 11 year old females are the most vulnerable to poverty, with 17 males (100.0%) and 15 females (100.0%) in their respective age groups living below the poverty level.
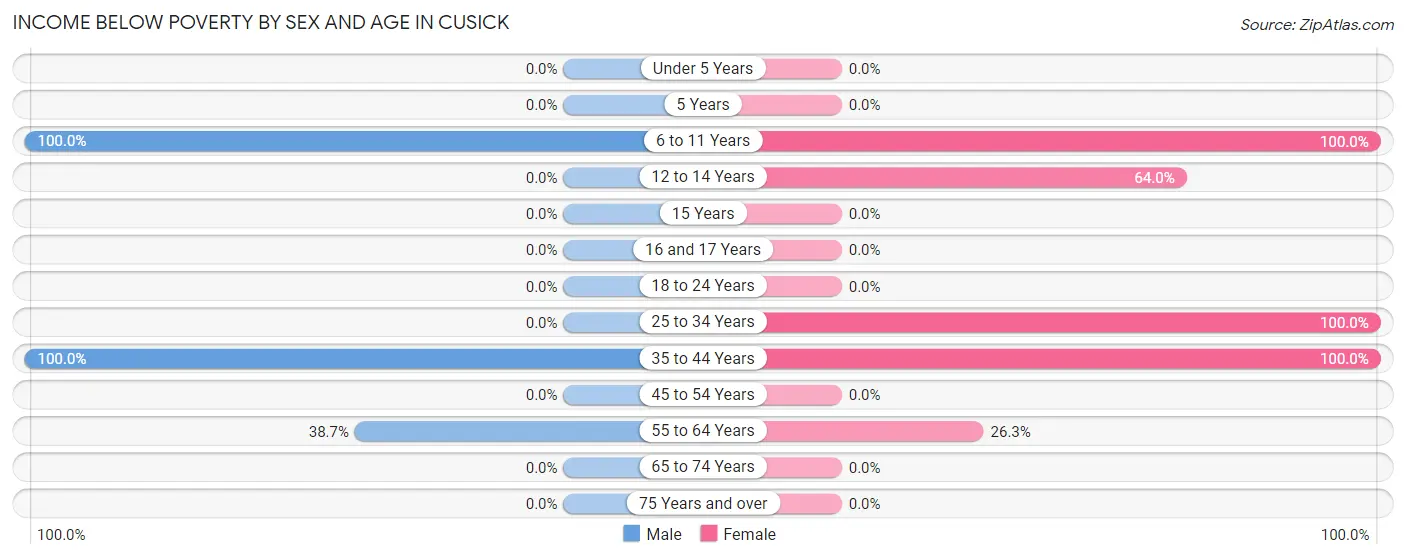
| Age Bracket | Male | Female |
| Under 5 Years | 0 (0.0%) | 0 (0.0%) |
| 5 Years | 0 (0.0%) | 0 (0.0%) |
| 6 to 11 Years | 17 (100.0%) | 15 (100.0%) |
| 12 to 14 Years | 0 (0.0%) | 16 (64.0%) |
| 15 Years | 0 (0.0%) | 0 (0.0%) |
| 16 and 17 Years | 0 (0.0%) | 0 (0.0%) |
| 18 to 24 Years | 0 (0.0%) | 0 (0.0%) |
| 25 to 34 Years | 0 (0.0%) | 8 (100.0%) |
| 35 to 44 Years | 9 (100.0%) | 4 (100.0%) |
| 45 to 54 Years | 0 (0.0%) | 0 (0.0%) |
| 55 to 64 Years | 12 (38.7%) | 5 (26.3%) |
| 65 to 74 Years | 0 (0.0%) | 0 (0.0%) |
| 75 Years and over | 0 (0.0%) | 0 (0.0%) |
| Total | 38 (41.8%) | 48 (51.1%) |
Income Above Poverty by Sex and Age in Cusick
According to the poverty statistics in Cusick, males aged 15 years and females aged 16 and 17 years are the age groups that are most secure financially, with 100.0% of males and 100.0% of females in these age groups living above the poverty line.
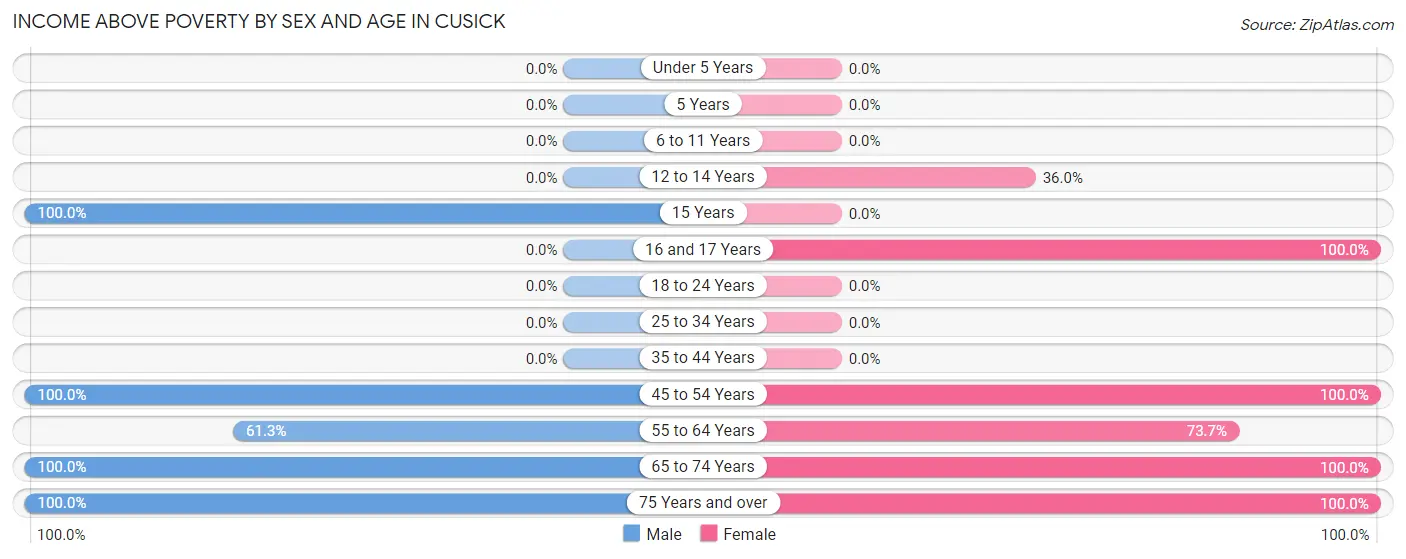
| Age Bracket | Male | Female |
| Under 5 Years | 0 (0.0%) | 0 (0.0%) |
| 5 Years | 0 (0.0%) | 0 (0.0%) |
| 6 to 11 Years | 0 (0.0%) | 0 (0.0%) |
| 12 to 14 Years | 0 (0.0%) | 9 (36.0%) |
| 15 Years | 6 (100.0%) | 0 (0.0%) |
| 16 and 17 Years | 0 (0.0%) | 5 (100.0%) |
| 18 to 24 Years | 0 (0.0%) | 0 (0.0%) |
| 25 to 34 Years | 0 (0.0%) | 0 (0.0%) |
| 35 to 44 Years | 0 (0.0%) | 0 (0.0%) |
| 45 to 54 Years | 11 (100.0%) | 7 (100.0%) |
| 55 to 64 Years | 19 (61.3%) | 14 (73.7%) |
| 65 to 74 Years | 13 (100.0%) | 7 (100.0%) |
| 75 Years and over | 4 (100.0%) | 4 (100.0%) |
| Total | 53 (58.2%) | 46 (48.9%) |
Income Below Poverty Among Married-Couple Families in Cusick
The poverty statistics for married-couple families in Cusick show that 22.9% or 8 of the total 35 families live below the poverty line. Families with 3 or 4 children have the highest poverty rate of 100.0%, comprising of 8 families. On the other hand, families with no children have the lowest poverty rate of 0.0%, which includes 0 families.
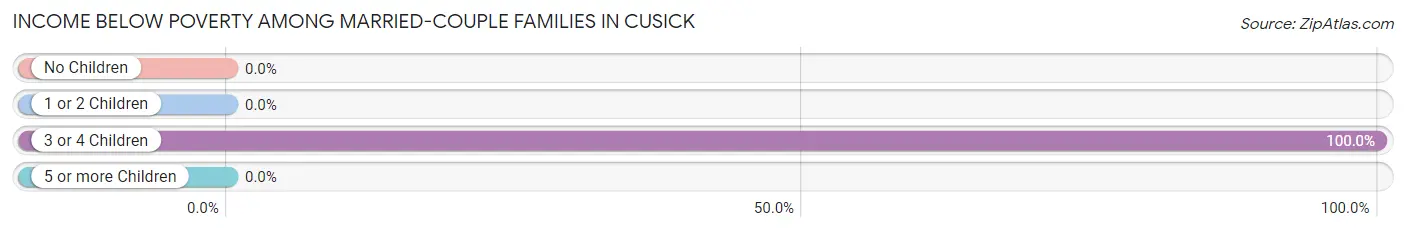
| Children | Above Poverty | Below Poverty |
| No Children | 27 (100.0%) | 0 (0.0%) |
| 1 or 2 Children | 0 (0.0%) | 0 (0.0%) |
| 3 or 4 Children | 0 (0.0%) | 8 (100.0%) |
| 5 or more Children | 0 (0.0%) | 0 (0.0%) |
| Total | 27 (77.1%) | 8 (22.9%) |
Income Below Poverty Among Single-Parent Households in Cusick
| Children | Single Father | Single Mother |
| No Children | 0 (0.0%) | 0 (0.0%) |
| 1 or 2 Children | 0 (0.0%) | 0 (0.0%) |
| 3 or 4 Children | 0 (0.0%) | 0 (0.0%) |
| 5 or more Children | 0 (0.0%) | 0 (0.0%) |
| Total | 0 (0.0%) | 0 (0.0%) |
Income Below Poverty Among Married-Couple vs Single-Parent Households in Cusick
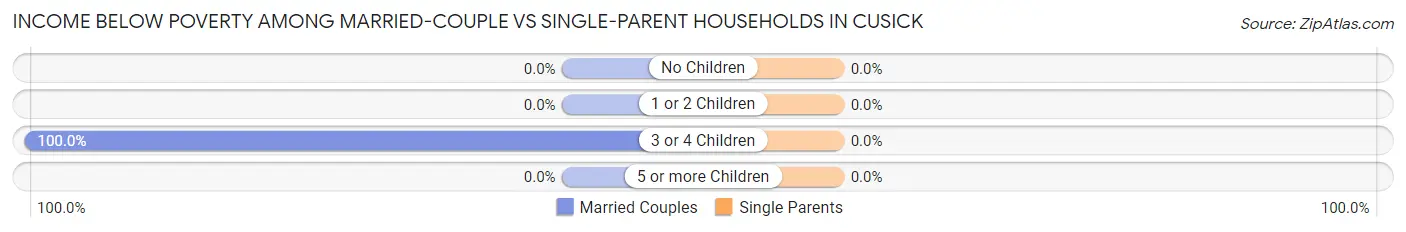
| Children | Married-Couple Families | Single-Parent Households |
| No Children | 0 (0.0%) | 0 (0.0%) |
| 1 or 2 Children | 0 (0.0%) | 0 (0.0%) |
| 3 or 4 Children | 8 (100.0%) | 0 (0.0%) |
| 5 or more Children | 0 (0.0%) | 0 (0.0%) |
| Total | 8 (22.9%) | 0 (0.0%) |
Race in Cusick
The most populous races in Cusick are White / Caucasian (99 | 53.5%), Two or more Races (67 | 36.2%), and Hispanic or Latino (61 | 33.0%).
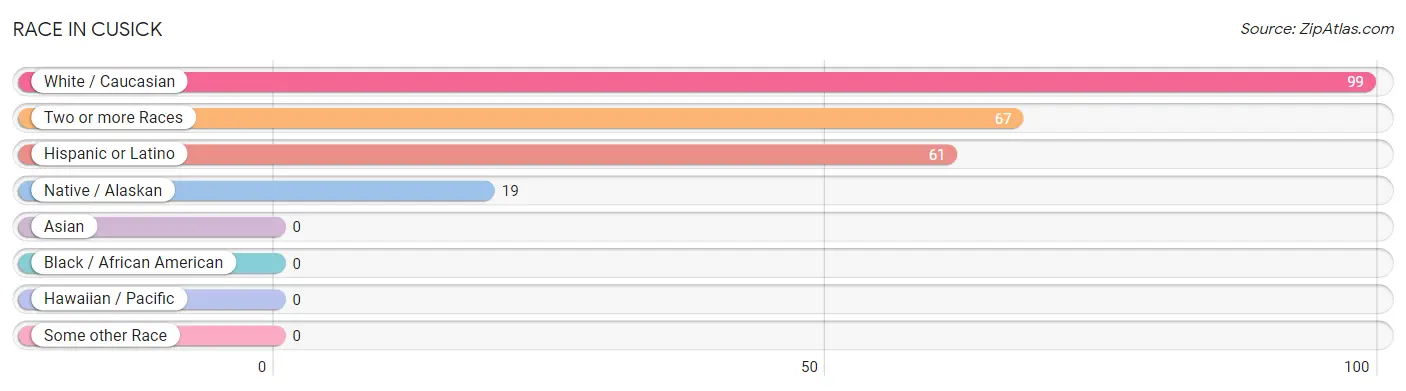
| Race | # Population | % Population |
| Asian | 0 | 0.0% |
| Black / African American | 0 | 0.0% |
| Hawaiian / Pacific | 0 | 0.0% |
| Hispanic or Latino | 61 | 33.0% |
| Native / Alaskan | 19 | 10.3% |
| White / Caucasian | 99 | 53.5% |
| Two or more Races | 67 | 36.2% |
| Some other Race | 0 | 0.0% |
| Total | 185 | 100.0% |
Ancestry in Cusick
The most populous ancestries reported in Cusick are German (74 | 40.0%), Spaniard (61 | 33.0%), British (57 | 30.8%), English (15 | 8.1%), and Blackfeet (9 | 4.9%), together accounting for 116.7% of all Cusick residents.
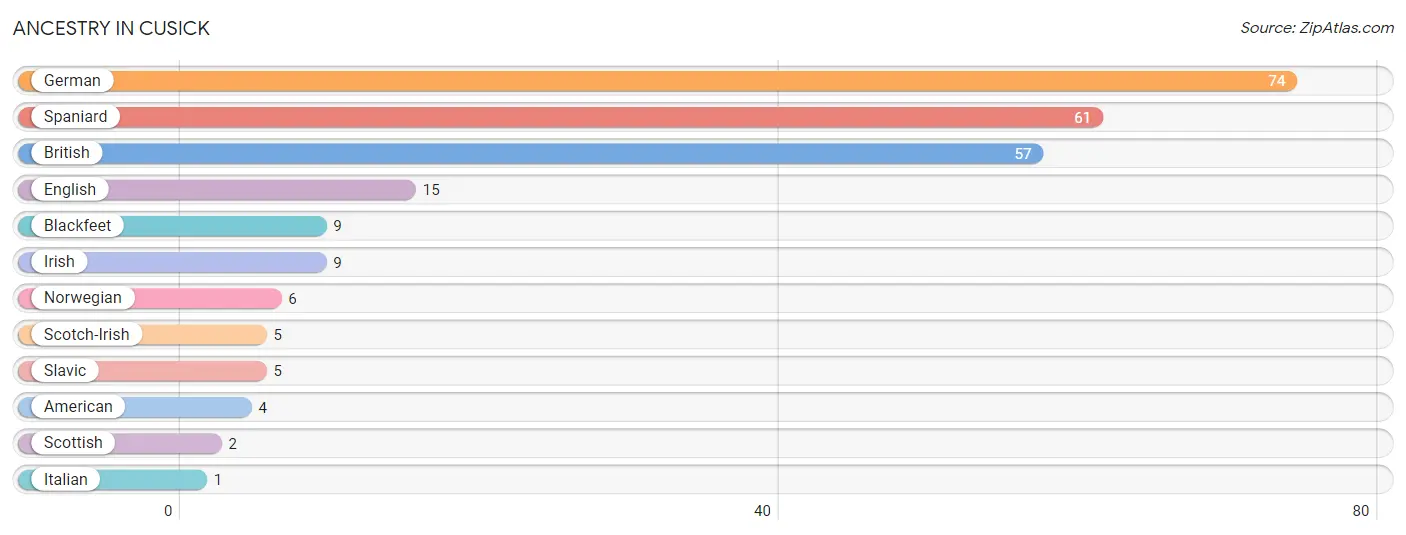
| Ancestry | # Population | % Population |
| American | 4 | 2.2% |
| Blackfeet | 9 | 4.9% |
| British | 57 | 30.8% |
| English | 15 | 8.1% |
| German | 74 | 40.0% |
| Irish | 9 | 4.9% |
| Italian | 1 | 0.5% |
| Norwegian | 6 | 3.2% |
| Scotch-Irish | 5 | 2.7% |
| Scottish | 2 | 1.1% |
| Slavic | 5 | 2.7% |
| Spaniard | 61 | 33.0% | View All 12 Rows |
Immigrants in Cusick

| Immigration Origin | # Population | % Population | View All 0 Rows |
Sex and Age in Cusick
Sex and Age in Cusick
The most populous age groups in Cusick are 55 to 59 Years (25 | 27.5%) for men and 10 to 14 Years (25 | 26.6%) for women.
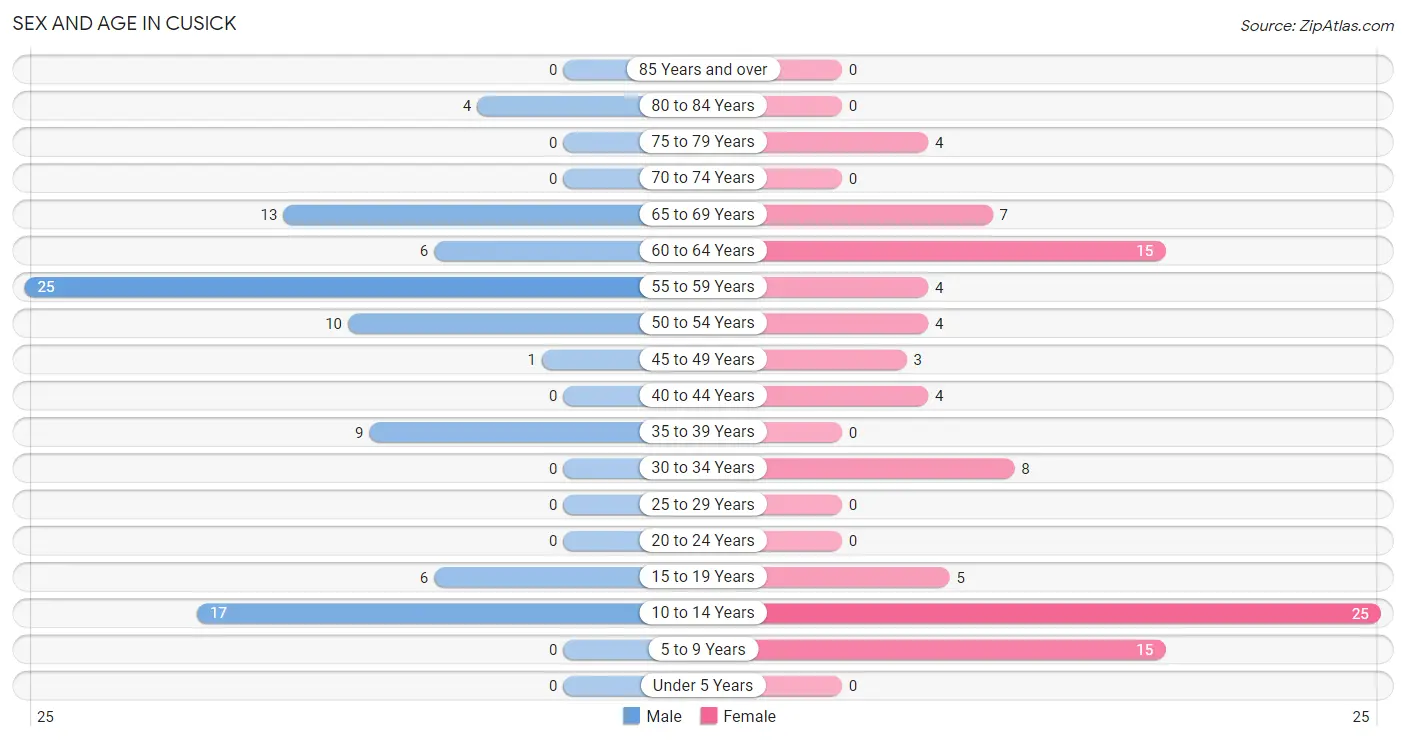
| Age Bracket | Male | Female |
| Under 5 Years | 0 (0.0%) | 0 (0.0%) |
| 5 to 9 Years | 0 (0.0%) | 15 (16.0%) |
| 10 to 14 Years | 17 (18.7%) | 25 (26.6%) |
| 15 to 19 Years | 6 (6.6%) | 5 (5.3%) |
| 20 to 24 Years | 0 (0.0%) | 0 (0.0%) |
| 25 to 29 Years | 0 (0.0%) | 0 (0.0%) |
| 30 to 34 Years | 0 (0.0%) | 8 (8.5%) |
| 35 to 39 Years | 9 (9.9%) | 0 (0.0%) |
| 40 to 44 Years | 0 (0.0%) | 4 (4.3%) |
| 45 to 49 Years | 1 (1.1%) | 3 (3.2%) |
| 50 to 54 Years | 10 (11.0%) | 4 (4.3%) |
| 55 to 59 Years | 25 (27.5%) | 4 (4.3%) |
| 60 to 64 Years | 6 (6.6%) | 15 (16.0%) |
| 65 to 69 Years | 13 (14.3%) | 7 (7.4%) |
| 70 to 74 Years | 0 (0.0%) | 0 (0.0%) |
| 75 to 79 Years | 0 (0.0%) | 4 (4.3%) |
| 80 to 84 Years | 4 (4.4%) | 0 (0.0%) |
| 85 Years and over | 0 (0.0%) | 0 (0.0%) |
| Total | 91 (100.0%) | 94 (100.0%) |
Families and Households in Cusick
Median Family Size in Cusick
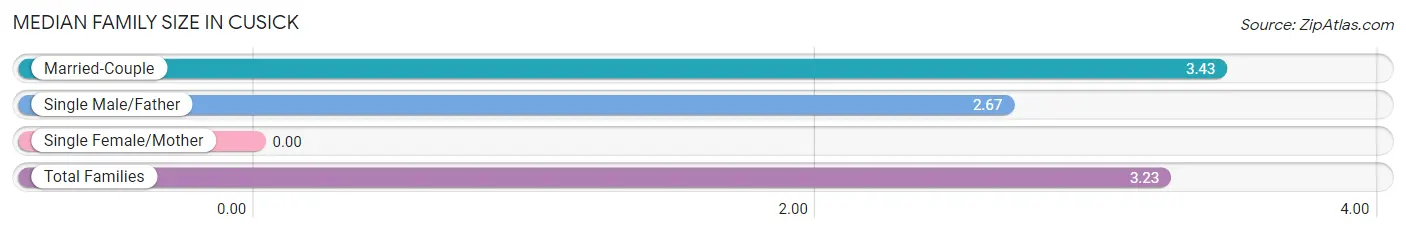
| Family Type | # Families | Family Size |
| Married-Couple | 35 (74.5%) | 3.43 |
| Single Male/Father | 12 (25.5%) | 2.67 |
| Single Female/Mother | 0 (0.0%) | - |
| Total Families | 47 (100.0%) | 3.23 |
Median Household Size in Cusick
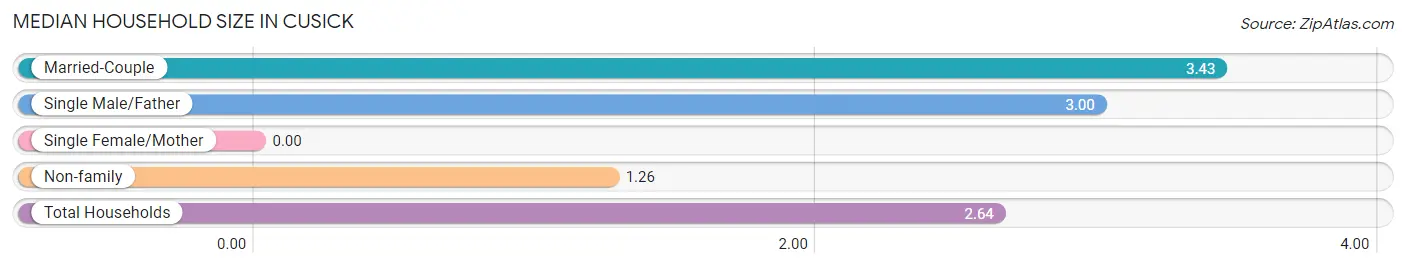
| Household Type | # Households | Household Size |
| Married-Couple | 35 (50.0%) | 3.43 |
| Single Male/Father | 12 (17.1%) | 3.00 |
| Single Female/Mother | 0 (0.0%) | - |
| Non-family | 23 (32.9%) | 1.26 |
| Total Households | 70 (100.0%) | 2.64 |
Household Size by Marriage Status in Cusick
Out of a total of 70 households in Cusick, 47 (67.1%) are family households, while 23 (32.9%) are nonfamily households. The most numerous type of family households are 2-person households, comprising 32, and the most common type of nonfamily households are 1-person households, comprising 18.
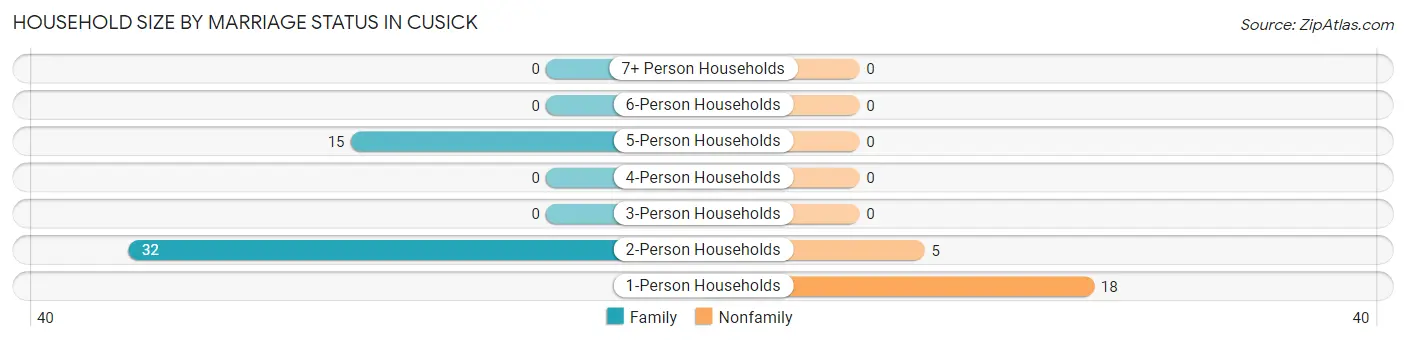
| Household Size | Family Households | Nonfamily Households |
| 1-Person Households | - | 18 (25.7%) |
| 2-Person Households | 32 (45.7%) | 5 (7.1%) |
| 3-Person Households | 0 (0.0%) | 0 (0.0%) |
| 4-Person Households | 0 (0.0%) | 0 (0.0%) |
| 5-Person Households | 15 (21.4%) | 0 (0.0%) |
| 6-Person Households | 0 (0.0%) | 0 (0.0%) |
| 7+ Person Households | 0 (0.0%) | 0 (0.0%) |
| Total | 47 (67.1%) | 23 (32.9%) |
Female Fertility in Cusick
Fertility by Age in Cusick
| Age Bracket | Women with Births | Births / 1,000 Women |
| 15 to 19 years | 0 (0.0%) | 0.0 |
| 20 to 34 years | 0 (0.0%) | 0.0 |
| 35 to 50 years | 0 (0.0%) | 0.0 |
| Total | 0 (0.0%) | 0.0 |
Fertility by Age by Marriage Status in Cusick
| Age Bracket | Married | Unmarried |
| 15 to 19 years | 0 (0.0%) | 0 (0.0%) |
| 20 to 34 years | 0 (0.0%) | 0 (0.0%) |
| 35 to 50 years | 0 (0.0%) | 0 (0.0%) |
| Total | 0 (0.0%) | 0 (0.0%) |
Fertility by Education in Cusick
| Educational Attainment | Women with Births | Births / 1,000 Women |
| Less than High School | 0 (0.0%) | 0.0 |
| High School Diploma | 0 (0.0%) | 0.0 |
| College or Associate's Degree | 0 (0.0%) | 0.0 |
| Bachelor's Degree | 0 (0.0%) | 0.0 |
| Graduate Degree | 0 (0.0%) | 0.0 |
| Total | 0 (0.0%) | 0.0 |
Fertility by Education by Marriage Status in Cusick
| Educational Attainment | Married | Unmarried |
| Less than High School | 0 (0.0%) | 0 (0.0%) |
| High School Diploma | 0 (0.0%) | 0 (0.0%) |
| College or Associate's Degree | 0 (0.0%) | 0 (0.0%) |
| Bachelor's Degree | 0 (0.0%) | 0 (0.0%) |
| Graduate Degree | 0 (0.0%) | 0 (0.0%) |
| Total | 0 (0.0%) | 0 (0.0%) |
Employment Characteristics in Cusick
Employment by Class of Employer in Cusick
Among the 55 employed individuals in Cusick, private company employees (34 | 61.8%), not-for-profit organizations (8 | 14.5%), and federal government employees (8 | 14.5%) make up the most common classes of employment.
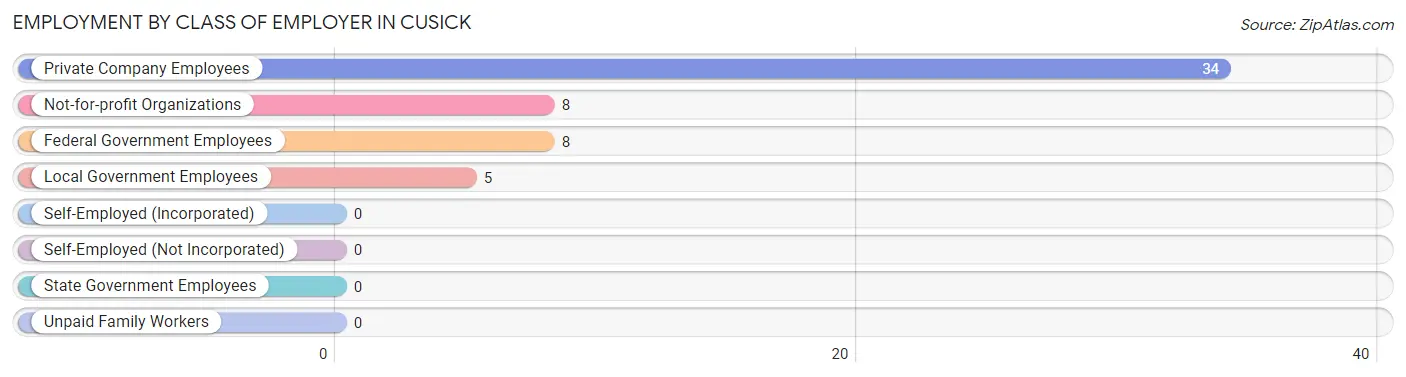
| Employer Class | # Employees | % Employees |
| Private Company Employees | 34 | 61.8% |
| Self-Employed (Incorporated) | 0 | 0.0% |
| Self-Employed (Not Incorporated) | 0 | 0.0% |
| Not-for-profit Organizations | 8 | 14.5% |
| Local Government Employees | 5 | 9.1% |
| State Government Employees | 0 | 0.0% |
| Federal Government Employees | 8 | 14.5% |
| Unpaid Family Workers | 0 | 0.0% |
| Total | 55 | 100.0% |
Employment Status by Age in Cusick
According to the labor force statistics for Cusick, out of the total population over 16 years of age (122), 50.0% or 61 individuals are in the labor force, with 9.8% or 6 of them unemployed. The age group with the highest labor force participation rate is 30 to 34 years, with 100.0% or 8 individuals in the labor force. Within the labor force, the 60 to 64 years age range has the highest percentage of unemployed individuals, with 37.5% or 6 of them being unemployed.
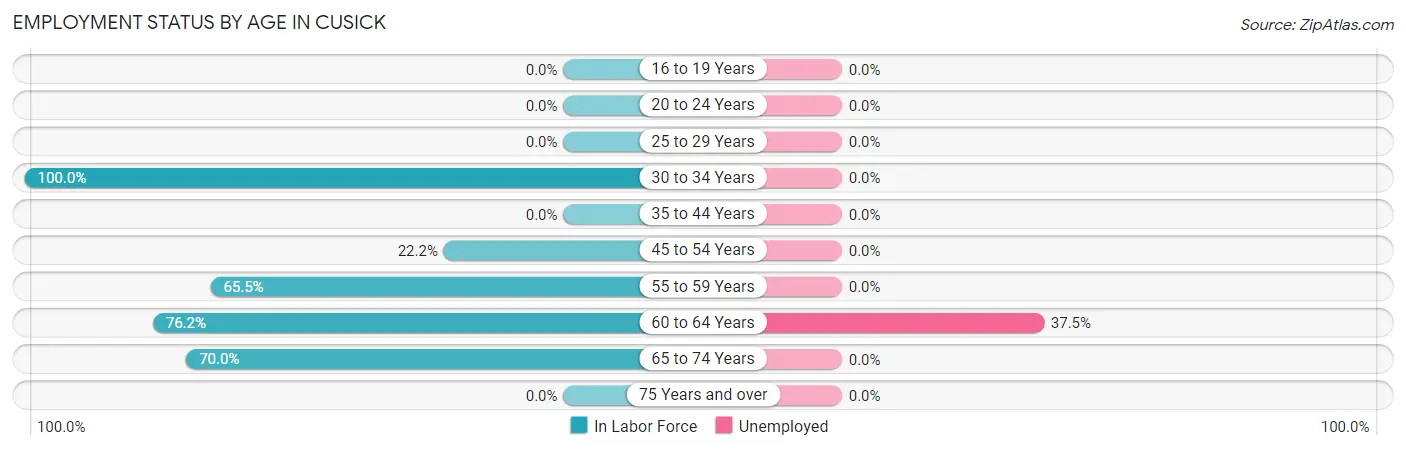
| Age Bracket | In Labor Force | Unemployed |
| 16 to 19 Years | 0 (0.0%) | 0 (0.0%) |
| 20 to 24 Years | 0 (0.0%) | 0 (0.0%) |
| 25 to 29 Years | 0 (0.0%) | 0 (0.0%) |
| 30 to 34 Years | 8 (100.0%) | 0 (0.0%) |
| 35 to 44 Years | 0 (0.0%) | 0 (0.0%) |
| 45 to 54 Years | 4 (22.2%) | 0 (0.0%) |
| 55 to 59 Years | 19 (65.5%) | 0 (0.0%) |
| 60 to 64 Years | 16 (76.2%) | 6 (37.5%) |
| 65 to 74 Years | 14 (70.0%) | 0 (0.0%) |
| 75 Years and over | 0 (0.0%) | 0 (0.0%) |
| Total | 61 (50.0%) | 6 (9.8%) |
Employment Status by Educational Attainment in Cusick
According to labor force statistics for Cusick, 52.8% of individuals (47) out of the total population between 25 and 64 years of age (89) are in the labor force, with 12.8% or 6 of them being unemployed. The group with the highest labor force participation rate are those with the educational attainment of bachelor's degree or higher, with 100.0% or 8 individuals in the labor force. Within the labor force, individuals with college / associate degree education have the highest percentage of unemployment, with 30.0% or 6 of them being unemployed.
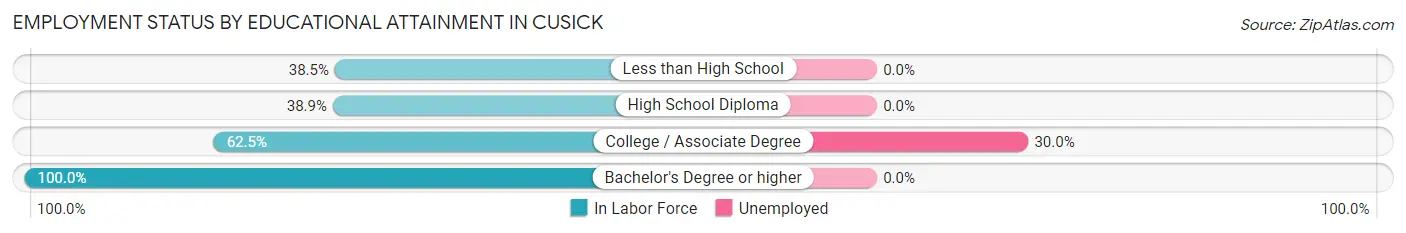
| Educational Attainment | In Labor Force | Unemployed |
| Less than High School | 5 (38.5%) | 0 (0.0%) |
| High School Diploma | 14 (38.9%) | 0 (0.0%) |
| College / Associate Degree | 20 (62.5%) | 10 (30.0%) |
| Bachelor's Degree or higher | 8 (100.0%) | 0 (0.0%) |
| Total | 47 (52.8%) | 11 (12.8%) |
Employment Occupations by Sex in Cusick
Management, Business, Science and Arts Occupations
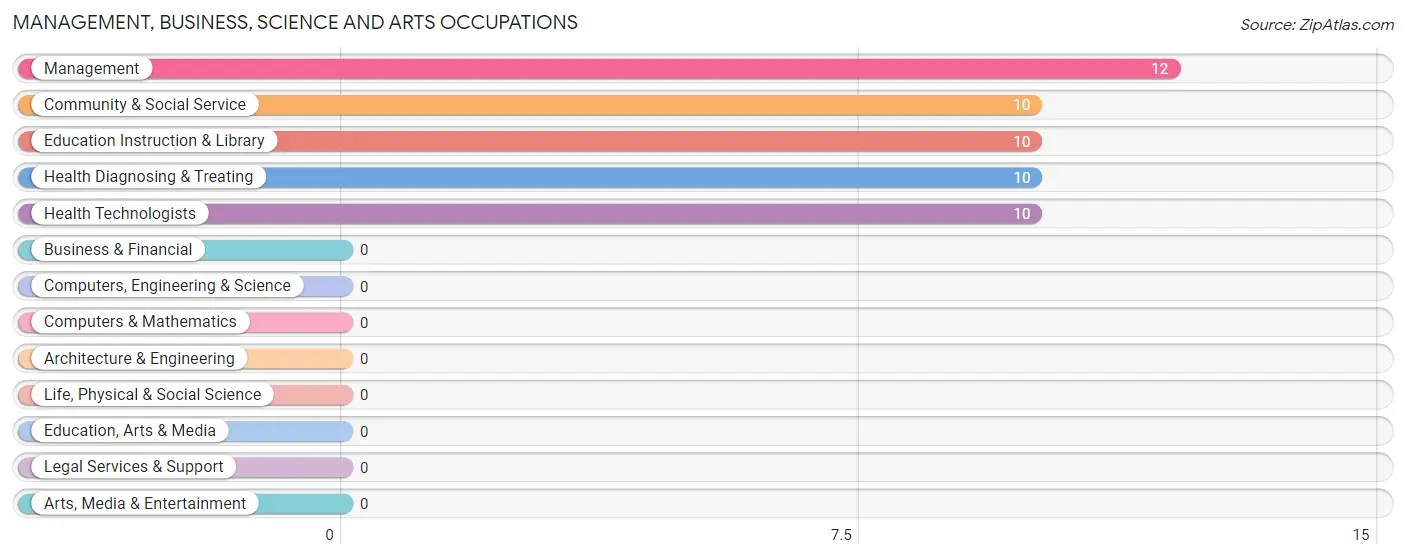
The most common Management, Business, Science and Arts occupations in Cusick are Management (12 | 21.8%), Community & Social Service (10 | 18.2%), Education Instruction & Library (10 | 18.2%), Health Diagnosing & Treating (10 | 18.2%), and Health Technologists (10 | 18.2%).
Management, Business, Science and Arts Occupations by Sex
Within the Management, Business, Science and Arts occupations in Cusick, the most male-oriented occupations are Health Diagnosing & Treating (50.0%), Health Technologists (50.0%), and Management (33.3%), while the most female-oriented occupations are Community & Social Service (100.0%), Education Instruction & Library (100.0%), and Management (66.7%).
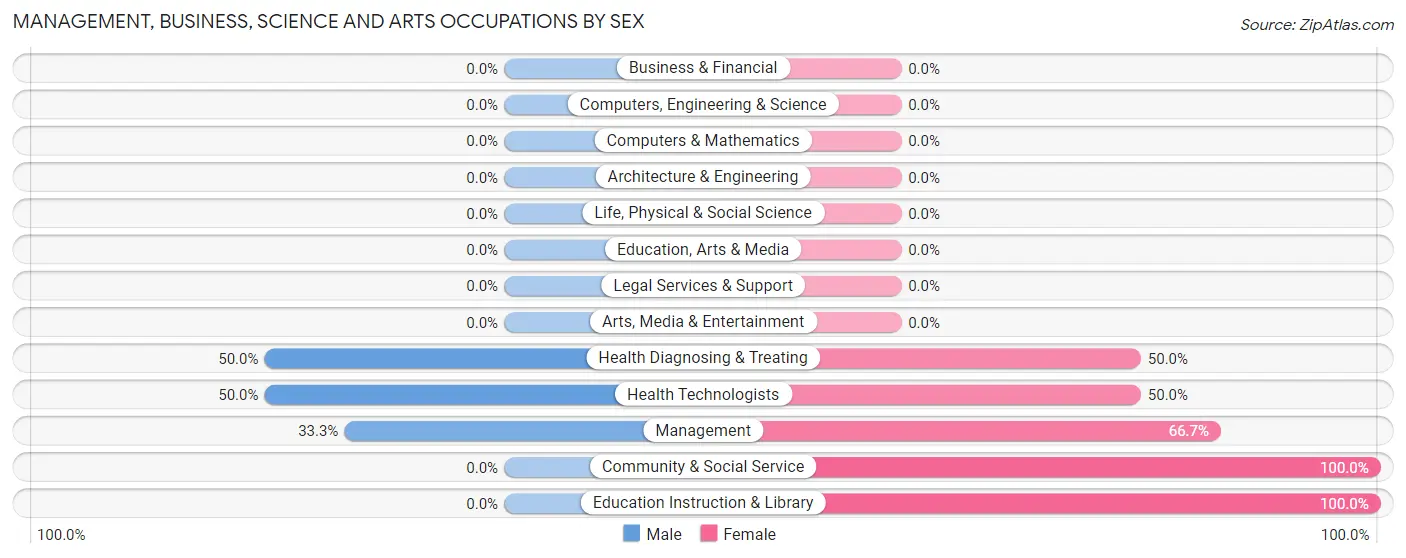
| Occupation | Male | Female |
| Management | 4 (33.3%) | 8 (66.7%) |
| Business & Financial | 0 (0.0%) | 0 (0.0%) |
| Computers, Engineering & Science | 0 (0.0%) | 0 (0.0%) |
| Computers & Mathematics | 0 (0.0%) | 0 (0.0%) |
| Architecture & Engineering | 0 (0.0%) | 0 (0.0%) |
| Life, Physical & Social Science | 0 (0.0%) | 0 (0.0%) |
| Community & Social Service | 0 (0.0%) | 10 (100.0%) |
| Education, Arts & Media | 0 (0.0%) | 0 (0.0%) |
| Legal Services & Support | 0 (0.0%) | 0 (0.0%) |
| Education Instruction & Library | 0 (0.0%) | 10 (100.0%) |
| Arts, Media & Entertainment | 0 (0.0%) | 0 (0.0%) |
| Health Diagnosing & Treating | 5 (50.0%) | 5 (50.0%) |
| Health Technologists | 5 (50.0%) | 5 (50.0%) |
| Total (Category) | 9 (28.1%) | 23 (71.9%) |
| Total (Overall) | 29 (52.7%) | 26 (47.3%) |
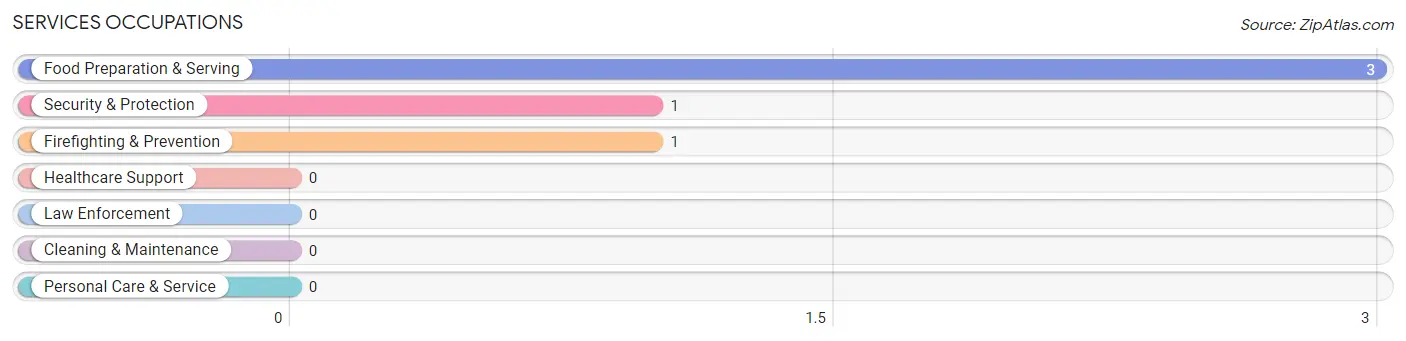
Services Occupations
The most common Services occupations in Cusick are Food Preparation & Serving (3 | 5.4%), Security & Protection (1 | 1.8%), and Firefighting & Prevention (1 | 1.8%).
Services Occupations by Sex
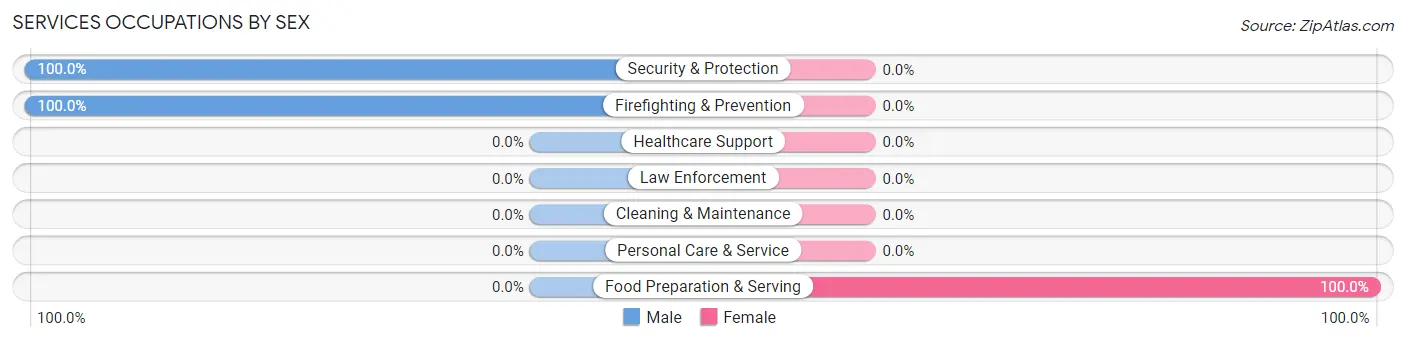
| Occupation | Male | Female |
| Healthcare Support | 0 (0.0%) | 0 (0.0%) |
| Security & Protection | 1 (100.0%) | 0 (0.0%) |
| Firefighting & Prevention | 1 (100.0%) | 0 (0.0%) |
| Law Enforcement | 0 (0.0%) | 0 (0.0%) |
| Food Preparation & Serving | 0 (0.0%) | 3 (100.0%) |
| Cleaning & Maintenance | 0 (0.0%) | 0 (0.0%) |
| Personal Care & Service | 0 (0.0%) | 0 (0.0%) |
| Total (Category) | 1 (25.0%) | 3 (75.0%) |
| Total (Overall) | 29 (52.7%) | 26 (47.3%) |
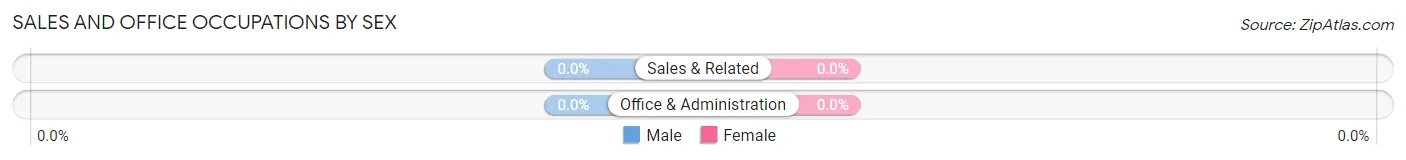
Sales and Office Occupations

Sales and Office Occupations by Sex
| Occupation | Male | Female |
| Sales & Related | 0 (0.0%) | 0 (0.0%) |
| Office & Administration | 0 (0.0%) | 0 (0.0%) |
| Total (Category) | 0 (0.0%) | 0 (0.0%) |
| Total (Overall) | 29 (52.7%) | 26 (47.3%) |
Natural Resources, Construction and Maintenance Occupations
The most common Natural Resources, Construction and Maintenance occupations in Cusick are Installation, Maintenance & Repair (10 | 18.2%), and Construction & Extraction (9 | 16.4%).
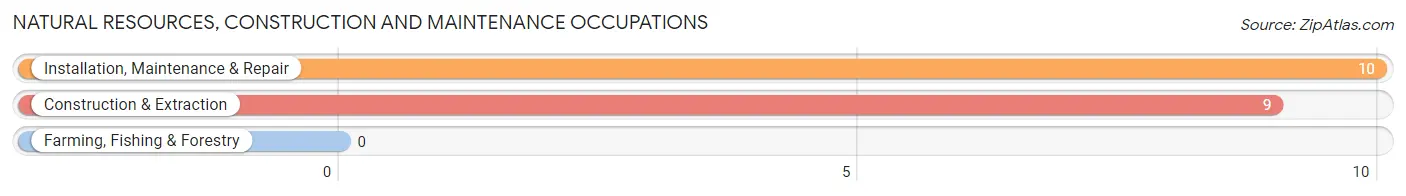
Natural Resources, Construction and Maintenance Occupations by Sex
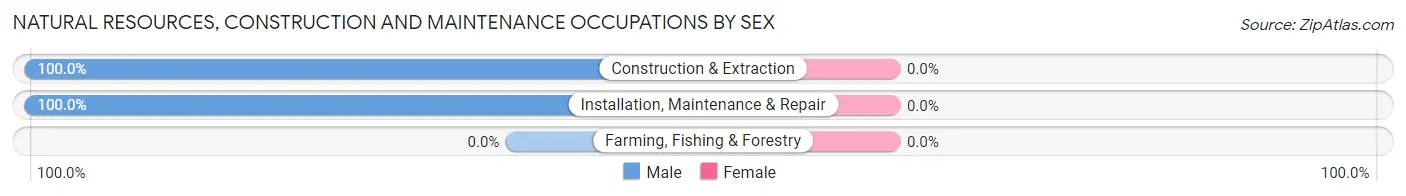
| Occupation | Male | Female |
| Farming, Fishing & Forestry | 0 (0.0%) | 0 (0.0%) |
| Construction & Extraction | 9 (100.0%) | 0 (0.0%) |
| Installation, Maintenance & Repair | 10 (100.0%) | 0 (0.0%) |
| Total (Category) | 19 (100.0%) | 0 (0.0%) |
| Total (Overall) | 29 (52.7%) | 26 (47.3%) |
Production, Transportation and Moving Occupations
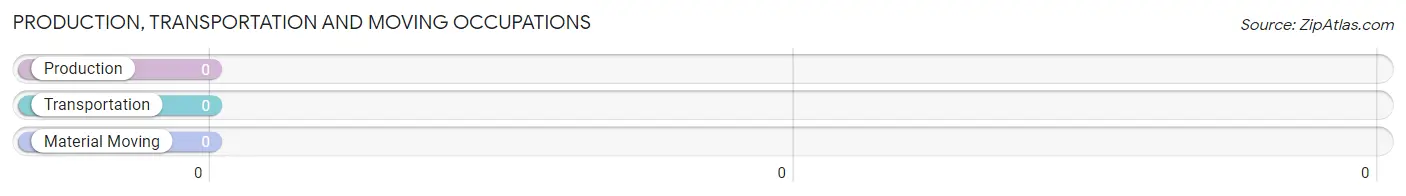
Production, Transportation and Moving Occupations by Sex
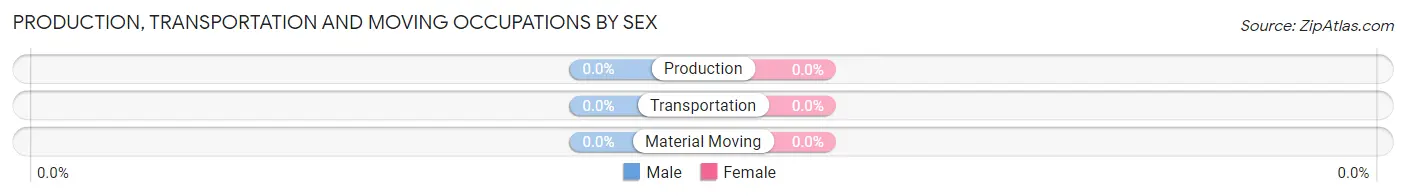
| Occupation | Male | Female |
| Production | 0 (0.0%) | 0 (0.0%) |
| Transportation | 0 (0.0%) | 0 (0.0%) |
| Material Moving | 0 (0.0%) | 0 (0.0%) |
| Total (Category) | 0 (0.0%) | 0 (0.0%) |
| Total (Overall) | 29 (52.7%) | 26 (47.3%) |
Employment Industries by Sex in Cusick
Employment Industries in Cusick
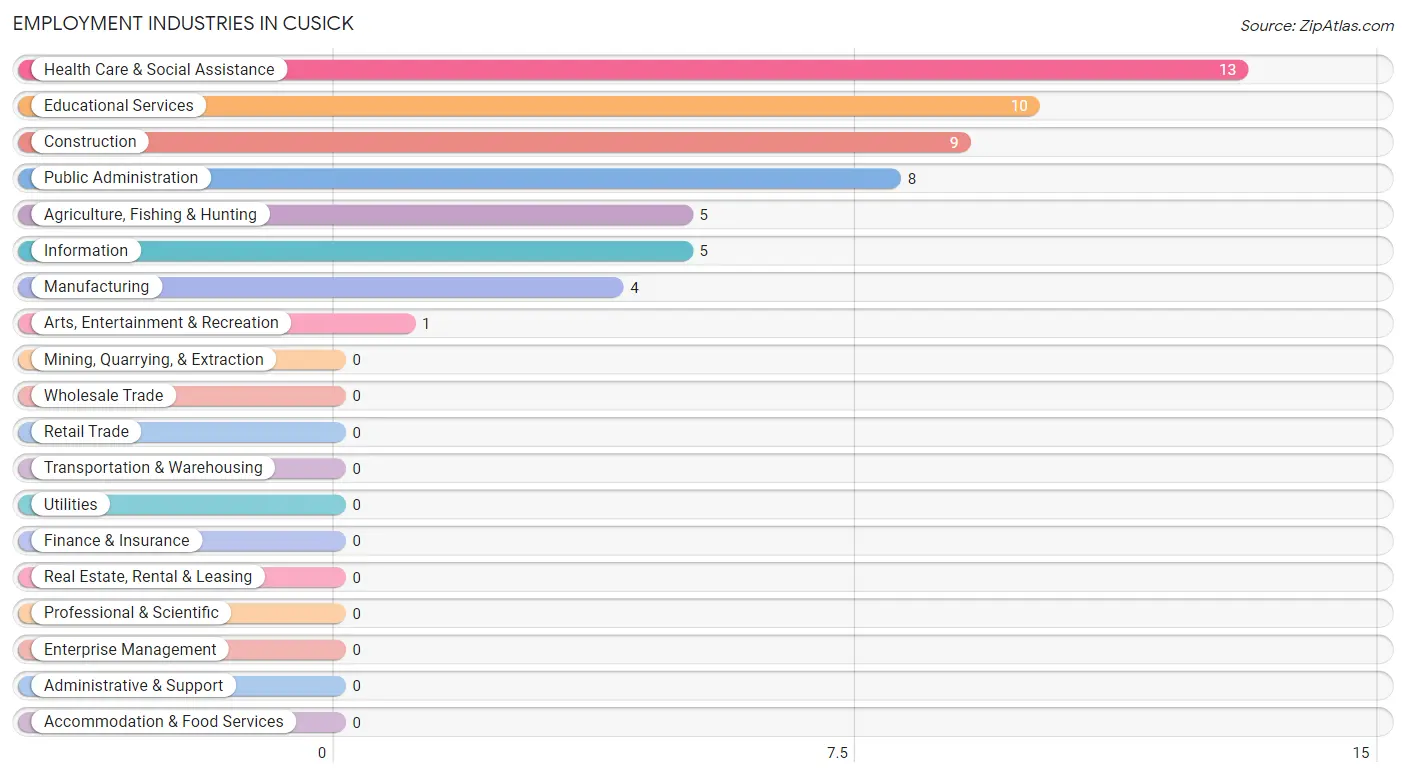
The major employment industries in Cusick include Health Care & Social Assistance (13 | 23.6%), Educational Services (10 | 18.2%), Construction (9 | 16.4%), Public Administration (8 | 14.5%), and Agriculture, Fishing & Hunting (5 | 9.1%).
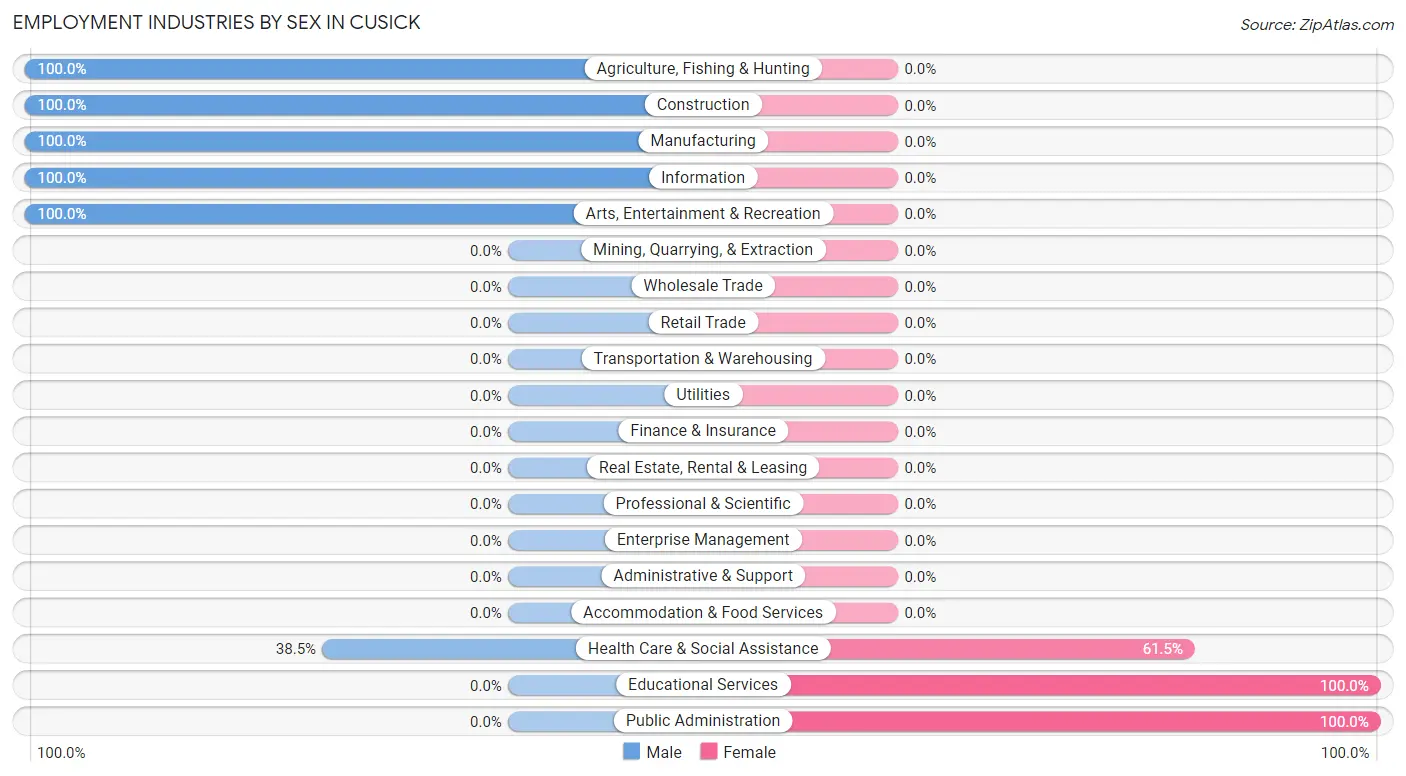
Employment Industries by Sex in Cusick
The Cusick industries that see more men than women are Agriculture, Fishing & Hunting (100.0%), Construction (100.0%), and Manufacturing (100.0%), whereas the industries that tend to have a higher number of women are Educational Services (100.0%), Public Administration (100.0%), and Health Care & Social Assistance (61.5%).
| Industry | Male | Female |
| Agriculture, Fishing & Hunting | 5 (100.0%) | 0 (0.0%) |
| Mining, Quarrying, & Extraction | 0 (0.0%) | 0 (0.0%) |
| Construction | 9 (100.0%) | 0 (0.0%) |
| Manufacturing | 4 (100.0%) | 0 (0.0%) |
| Wholesale Trade | 0 (0.0%) | 0 (0.0%) |
| Retail Trade | 0 (0.0%) | 0 (0.0%) |
| Transportation & Warehousing | 0 (0.0%) | 0 (0.0%) |
| Utilities | 0 (0.0%) | 0 (0.0%) |
| Information | 5 (100.0%) | 0 (0.0%) |
| Finance & Insurance | 0 (0.0%) | 0 (0.0%) |
| Real Estate, Rental & Leasing | 0 (0.0%) | 0 (0.0%) |
| Professional & Scientific | 0 (0.0%) | 0 (0.0%) |
| Enterprise Management | 0 (0.0%) | 0 (0.0%) |
| Administrative & Support | 0 (0.0%) | 0 (0.0%) |
| Educational Services | 0 (0.0%) | 10 (100.0%) |
| Health Care & Social Assistance | 5 (38.5%) | 8 (61.5%) |
| Arts, Entertainment & Recreation | 1 (100.0%) | 0 (0.0%) |
| Accommodation & Food Services | 0 (0.0%) | 0 (0.0%) |
| Public Administration | 0 (0.0%) | 8 (100.0%) |
| Total | 29 (52.7%) | 26 (47.3%) |
Education in Cusick
School Enrollment in Cusick
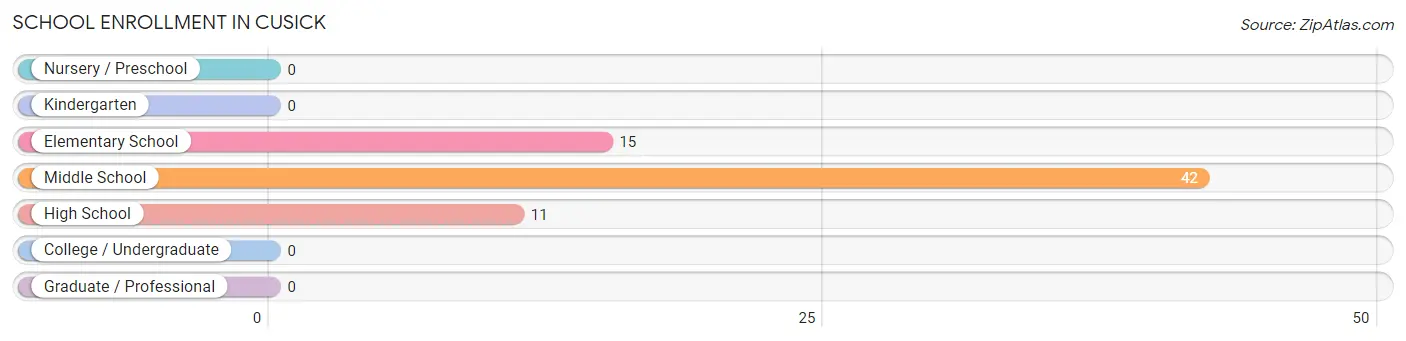
The most common levels of schooling among the 68 students in Cusick are middle school (42 | 61.8%), elementary school (15 | 22.1%), and high school (11 | 16.2%).
| School Level | # Students | % Students |
| Nursery / Preschool | 0 | 0.0% |
| Kindergarten | 0 | 0.0% |
| Elementary School | 15 | 22.1% |
| Middle School | 42 | 61.8% |
| High School | 11 | 16.2% |
| College / Undergraduate | 0 | 0.0% |
| Graduate / Professional | 0 | 0.0% |
| Total | 68 | 100.0% |
School Enrollment by Age by Funding Source in Cusick
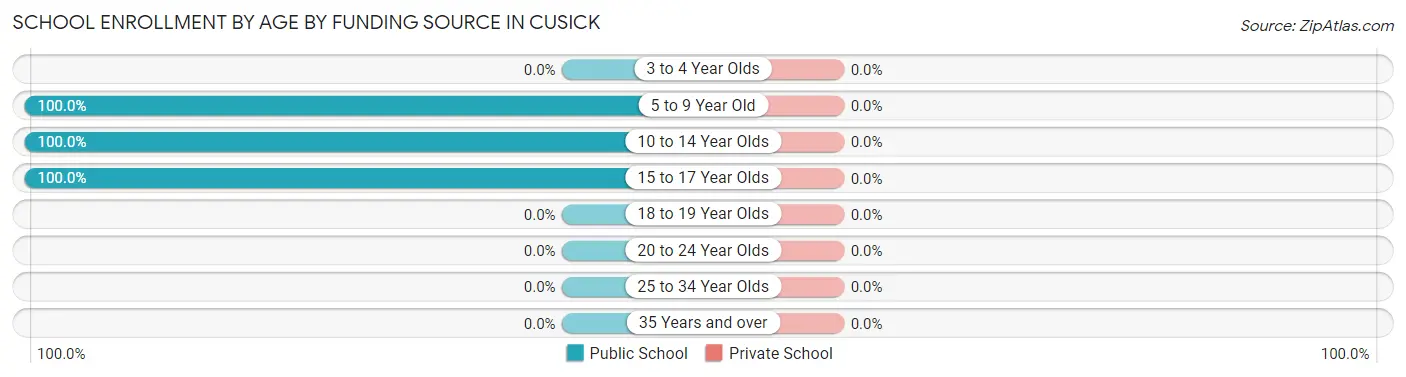
| Age Bracket | Public School | Private School |
| 3 to 4 Year Olds | 0 (0.0%) | 0 (0.0%) |
| 5 to 9 Year Old | 15 (100.0%) | 0 (0.0%) |
| 10 to 14 Year Olds | 42 (100.0%) | 0 (0.0%) |
| 15 to 17 Year Olds | 11 (100.0%) | 0 (0.0%) |
| 18 to 19 Year Olds | 0 (0.0%) | 0 (0.0%) |
| 20 to 24 Year Olds | 0 (0.0%) | 0 (0.0%) |
| 25 to 34 Year Olds | 0 (0.0%) | 0 (0.0%) |
| 35 Years and over | 0 (0.0%) | 0 (0.0%) |
| Total | 68 (100.0%) | 0 (0.0%) |
Educational Attainment by Field of Study in Cusick
Bio, nature & agricultural (7 | 33.3%), science & technology (7 | 33.3%), education (3 | 14.3%), multidisciplinary studies (2 | 9.5%), and arts & humanities (2 | 9.5%) are the most common fields of study among 21 individuals in Cusick who have obtained a bachelor's degree or higher.
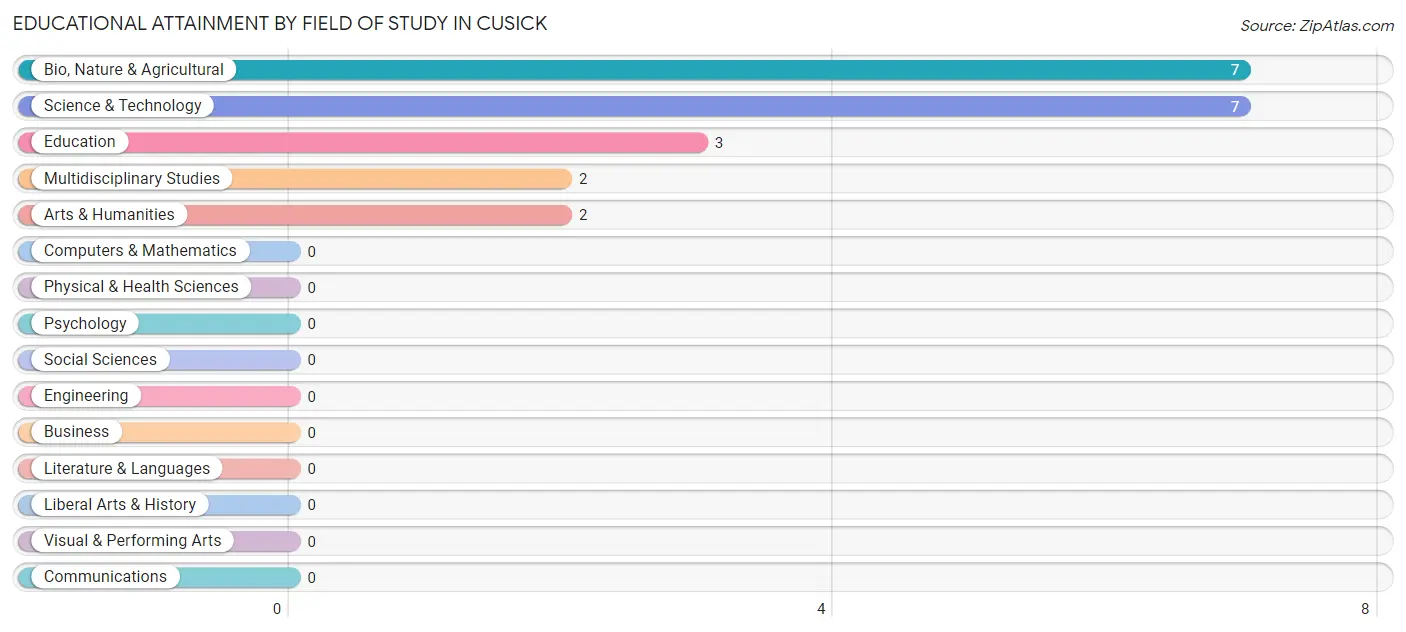
| Field of Study | # Graduates | % Graduates |
| Computers & Mathematics | 0 | 0.0% |
| Bio, Nature & Agricultural | 7 | 33.3% |
| Physical & Health Sciences | 0 | 0.0% |
| Psychology | 0 | 0.0% |
| Social Sciences | 0 | 0.0% |
| Engineering | 0 | 0.0% |
| Multidisciplinary Studies | 2 | 9.5% |
| Science & Technology | 7 | 33.3% |
| Business | 0 | 0.0% |
| Education | 3 | 14.3% |
| Literature & Languages | 0 | 0.0% |
| Liberal Arts & History | 0 | 0.0% |
| Visual & Performing Arts | 0 | 0.0% |
| Communications | 0 | 0.0% |
| Arts & Humanities | 2 | 9.5% |
| Total | 21 | 100.0% |
Transportation & Commute in Cusick
Vehicle Availability by Sex in Cusick
The most prevalent vehicle ownership categories in Cusick are males with 3 vehicles (19, accounting for 65.5%) and females with 3 vehicles (13, making up 73.1%).
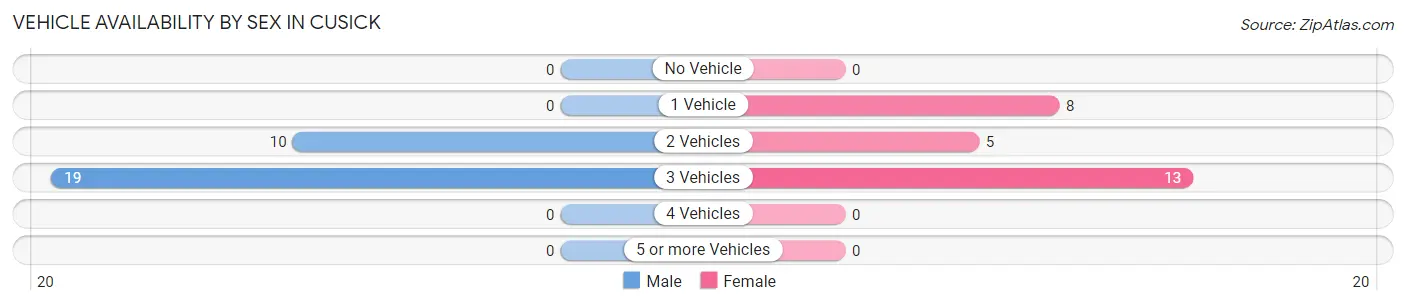
| Vehicles Available | Male | Female |
| No Vehicle | 0 (0.0%) | 0 (0.0%) |
| 1 Vehicle | 0 (0.0%) | 8 (30.8%) |
| 2 Vehicles | 10 (34.5%) | 5 (19.2%) |
| 3 Vehicles | 19 (65.5%) | 13 (50.0%) |
| 4 Vehicles | 0 (0.0%) | 0 (0.0%) |
| 5 or more Vehicles | 0 (0.0%) | 0 (0.0%) |
| Total | 29 (100.0%) | 26 (100.0%) |
Commute Time in Cusick
The most frequently occuring commute durations in Cusick are 10 to 14 minutes (24 commuters, 43.6%), less than 5 minutes (10 commuters, 18.2%), and 15 to 19 minutes (6 commuters, 10.9%).
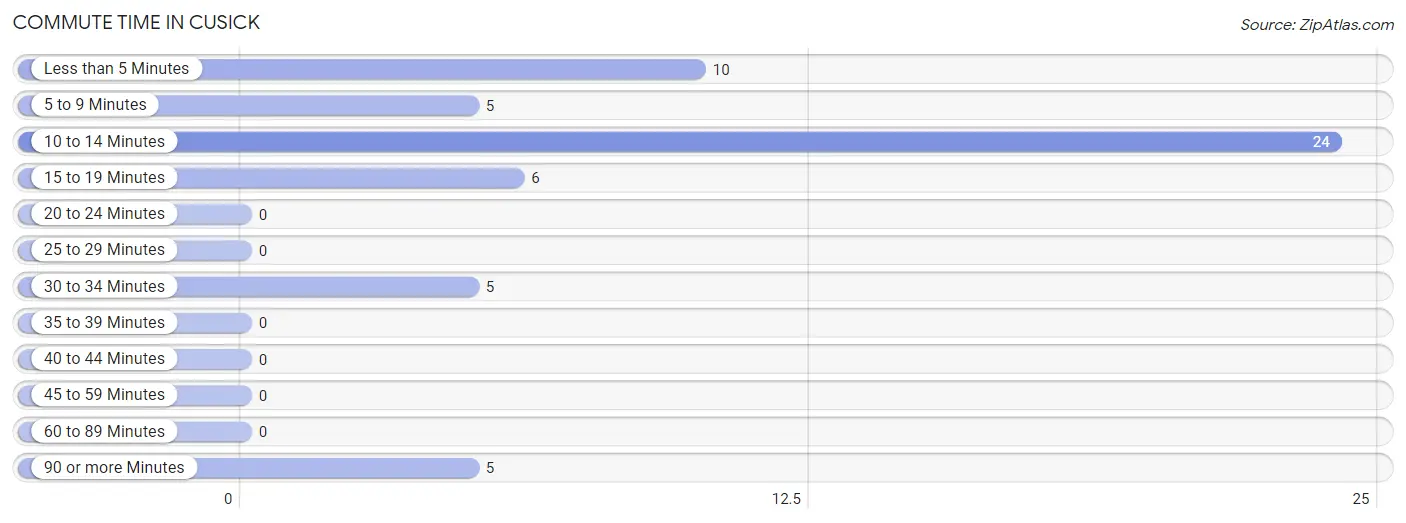
| Commute Time | # Commuters | % Commuters |
| Less than 5 Minutes | 10 | 18.2% |
| 5 to 9 Minutes | 5 | 9.1% |
| 10 to 14 Minutes | 24 | 43.6% |
| 15 to 19 Minutes | 6 | 10.9% |
| 20 to 24 Minutes | 0 | 0.0% |
| 25 to 29 Minutes | 0 | 0.0% |
| 30 to 34 Minutes | 5 | 9.1% |
| 35 to 39 Minutes | 0 | 0.0% |
| 40 to 44 Minutes | 0 | 0.0% |
| 45 to 59 Minutes | 0 | 0.0% |
| 60 to 89 Minutes | 0 | 0.0% |
| 90 or more Minutes | 5 | 9.1% |
Commute Time by Sex in Cusick
The most common commute times in Cusick are 10 to 14 minutes (13 commuters, 44.8%) for males and 10 to 14 minutes (11 commuters, 42.3%) for females.
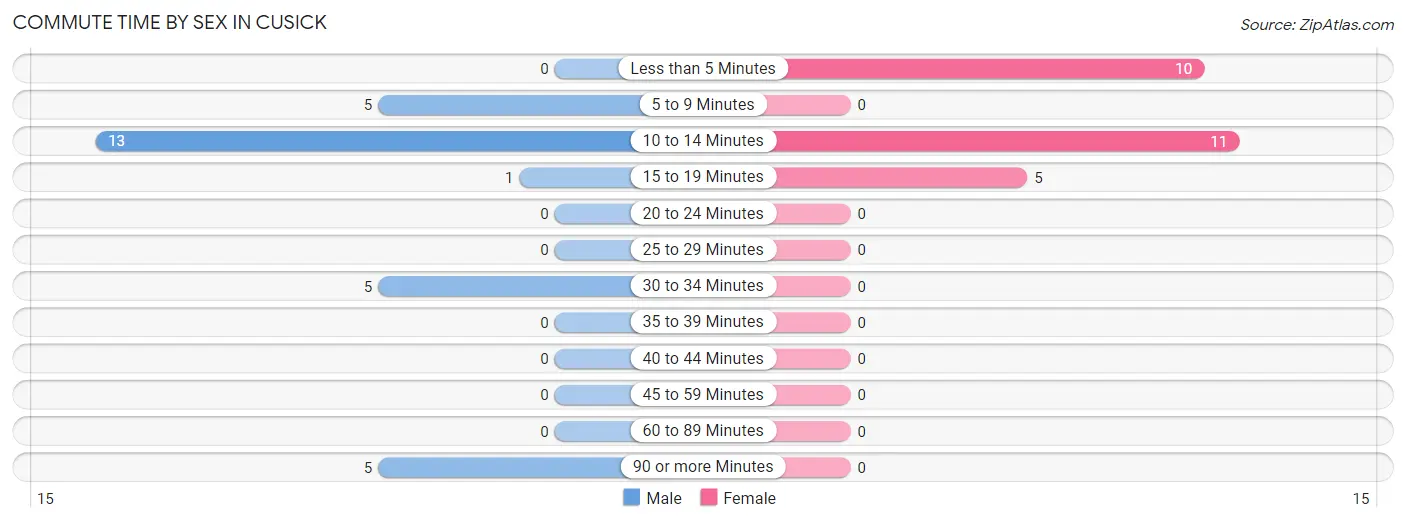
| Commute Time | Male | Female |
| Less than 5 Minutes | 0 (0.0%) | 10 (38.5%) |
| 5 to 9 Minutes | 5 (17.2%) | 0 (0.0%) |
| 10 to 14 Minutes | 13 (44.8%) | 11 (42.3%) |
| 15 to 19 Minutes | 1 (3.5%) | 5 (19.2%) |
| 20 to 24 Minutes | 0 (0.0%) | 0 (0.0%) |
| 25 to 29 Minutes | 0 (0.0%) | 0 (0.0%) |
| 30 to 34 Minutes | 5 (17.2%) | 0 (0.0%) |
| 35 to 39 Minutes | 0 (0.0%) | 0 (0.0%) |
| 40 to 44 Minutes | 0 (0.0%) | 0 (0.0%) |
| 45 to 59 Minutes | 0 (0.0%) | 0 (0.0%) |
| 60 to 89 Minutes | 0 (0.0%) | 0 (0.0%) |
| 90 or more Minutes | 5 (17.2%) | 0 (0.0%) |
Time of Departure to Work by Sex in Cusick
The most frequent times of departure to work in Cusick are 7:00 AM to 7:29 AM (13, 44.8%) for males and 6:30 AM to 6:59 AM (15, 57.7%) for females.
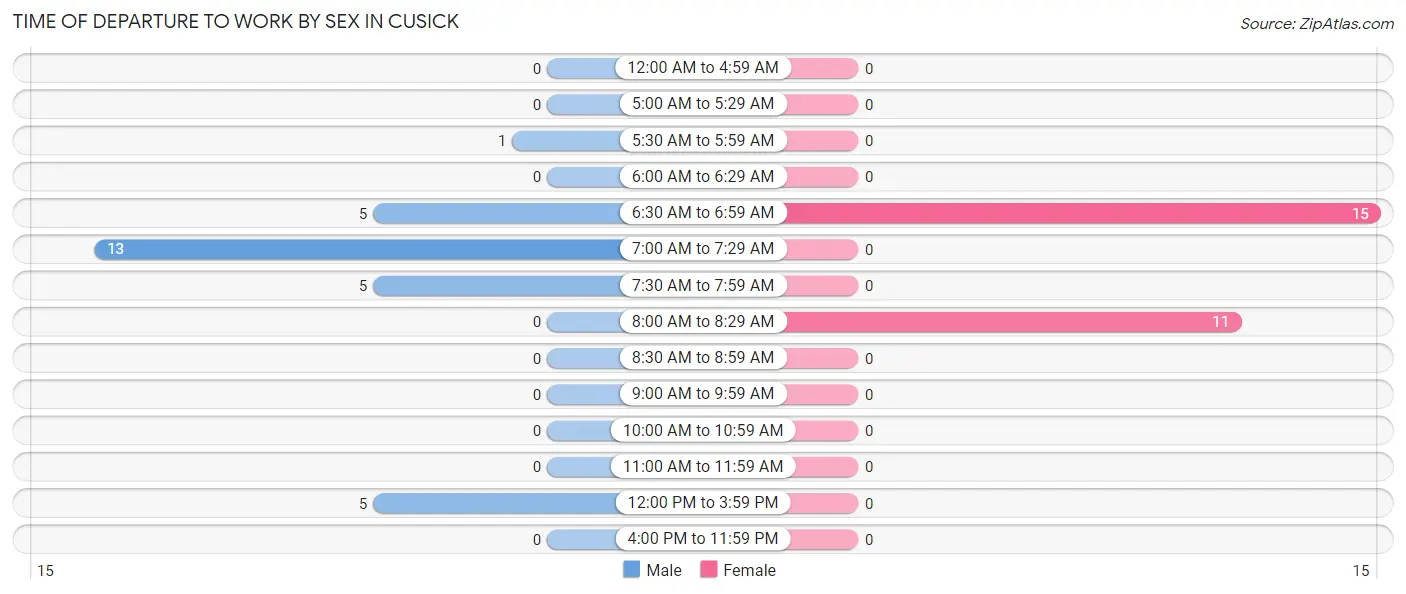
| Time of Departure | Male | Female |
| 12:00 AM to 4:59 AM | 0 (0.0%) | 0 (0.0%) |
| 5:00 AM to 5:29 AM | 0 (0.0%) | 0 (0.0%) |
| 5:30 AM to 5:59 AM | 1 (3.5%) | 0 (0.0%) |
| 6:00 AM to 6:29 AM | 0 (0.0%) | 0 (0.0%) |
| 6:30 AM to 6:59 AM | 5 (17.2%) | 15 (57.7%) |
| 7:00 AM to 7:29 AM | 13 (44.8%) | 0 (0.0%) |
| 7:30 AM to 7:59 AM | 5 (17.2%) | 0 (0.0%) |
| 8:00 AM to 8:29 AM | 0 (0.0%) | 11 (42.3%) |
| 8:30 AM to 8:59 AM | 0 (0.0%) | 0 (0.0%) |
| 9:00 AM to 9:59 AM | 0 (0.0%) | 0 (0.0%) |
| 10:00 AM to 10:59 AM | 0 (0.0%) | 0 (0.0%) |
| 11:00 AM to 11:59 AM | 0 (0.0%) | 0 (0.0%) |
| 12:00 PM to 3:59 PM | 5 (17.2%) | 0 (0.0%) |
| 4:00 PM to 11:59 PM | 0 (0.0%) | 0 (0.0%) |
| Total | 29 (100.0%) | 26 (100.0%) |
Housing Occupancy in Cusick
Occupancy by Ownership in Cusick
Of the total 70 dwellings in Cusick, owner-occupied units account for 41 (58.6%), while renter-occupied units make up 29 (41.4%).
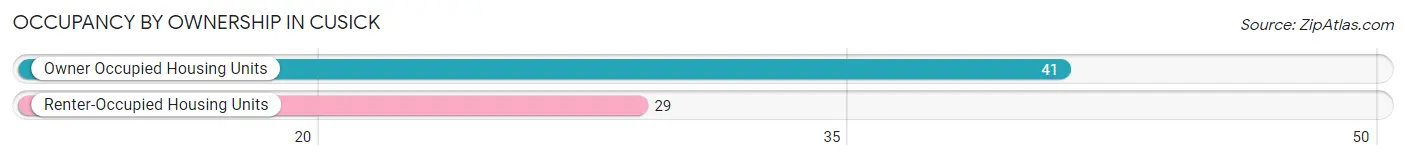
| Occupancy | # Housing Units | % Housing Units |
| Owner Occupied Housing Units | 41 | 58.6% |
| Renter-Occupied Housing Units | 29 | 41.4% |
| Total Occupied Housing Units | 70 | 100.0% |
Occupancy by Household Size in Cusick
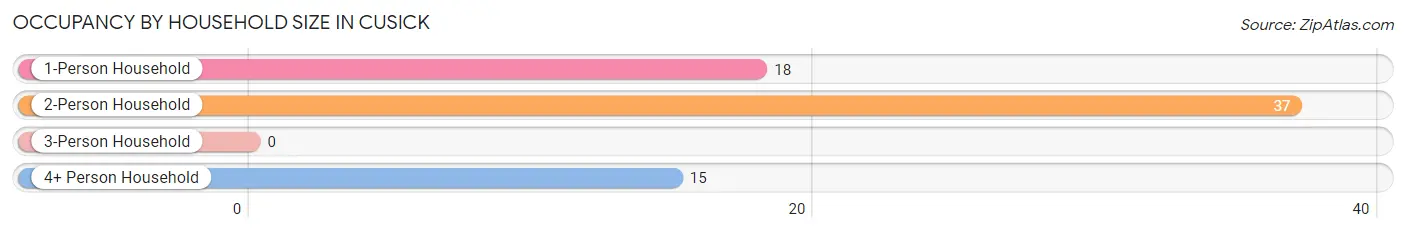
| Household Size | # Housing Units | % Housing Units |
| 1-Person Household | 18 | 25.7% |
| 2-Person Household | 37 | 52.9% |
| 3-Person Household | 0 | 0.0% |
| 4+ Person Household | 15 | 21.4% |
| Total Housing Units | 70 | 100.0% |
Occupancy by Ownership by Household Size in Cusick
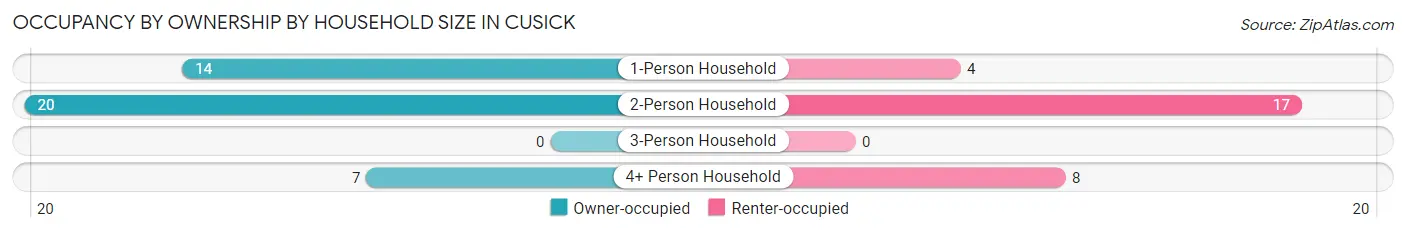
| Household Size | Owner-occupied | Renter-occupied |
| 1-Person Household | 14 (77.8%) | 4 (22.2%) |
| 2-Person Household | 20 (54.0%) | 17 (46.0%) |
| 3-Person Household | 0 (0.0%) | 0 (0.0%) |
| 4+ Person Household | 7 (46.7%) | 8 (53.3%) |
| Total Housing Units | 41 (58.6%) | 29 (41.4%) |
Occupancy by Educational Attainment in Cusick
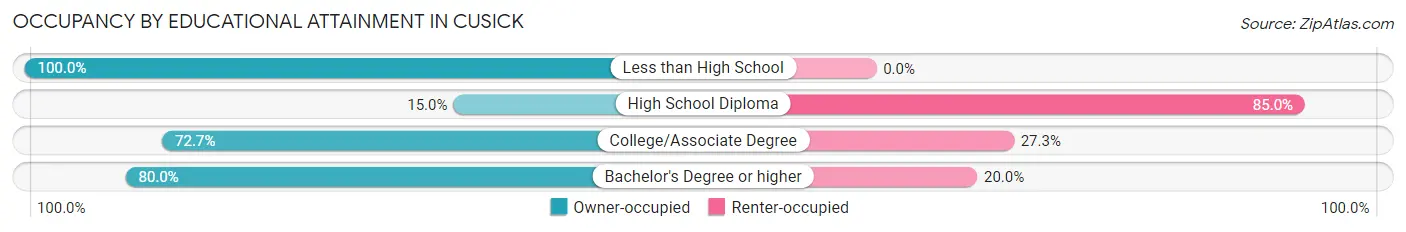
| Household Size | Owner-occupied | Renter-occupied |
| Less than High School | 2 (100.0%) | 0 (0.0%) |
| High School Diploma | 3 (15.0%) | 17 (85.0%) |
| College/Associate Degree | 24 (72.7%) | 9 (27.3%) |
| Bachelor's Degree or higher | 12 (80.0%) | 3 (20.0%) |
Occupancy by Age of Householder in Cusick
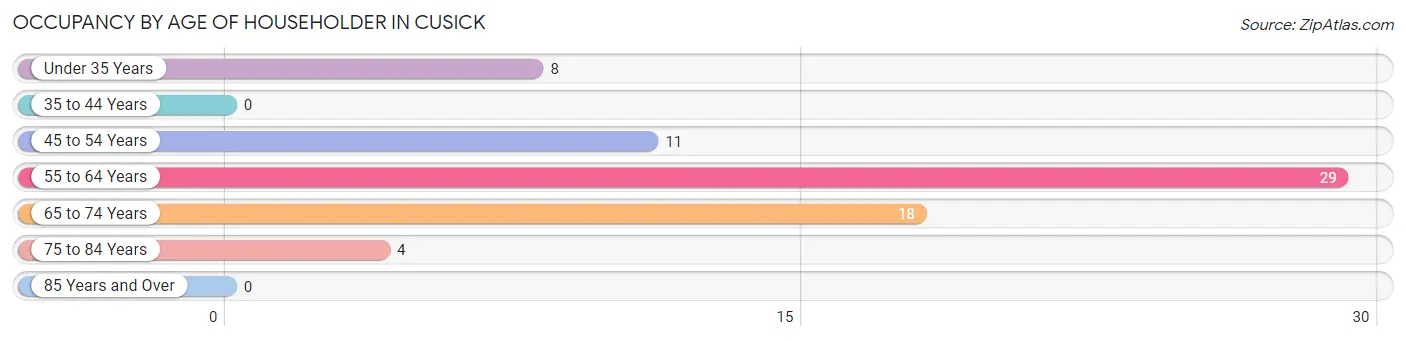
| Age Bracket | # Households | % Households |
| Under 35 Years | 8 | 11.4% |
| 35 to 44 Years | 0 | 0.0% |
| 45 to 54 Years | 11 | 15.7% |
| 55 to 64 Years | 29 | 41.4% |
| 65 to 74 Years | 18 | 25.7% |
| 75 to 84 Years | 4 | 5.7% |
| 85 Years and Over | 0 | 0.0% |
| Total | 70 | 100.0% |
Housing Finances in Cusick
Median Income by Occupancy in Cusick
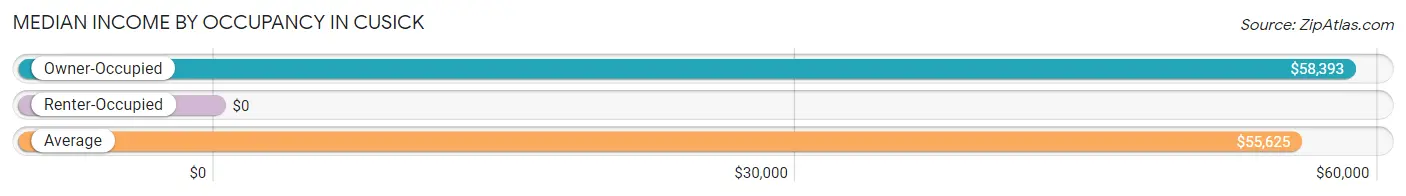
| Occupancy Type | # Households | Median Income |
| Owner-Occupied | 41 (58.6%) | $58,393 |
| Renter-Occupied | 29 (41.4%) | $0 |
| Average | 70 (100.0%) | $55,625 |
Occupancy by Householder Income Bracket in Cusick
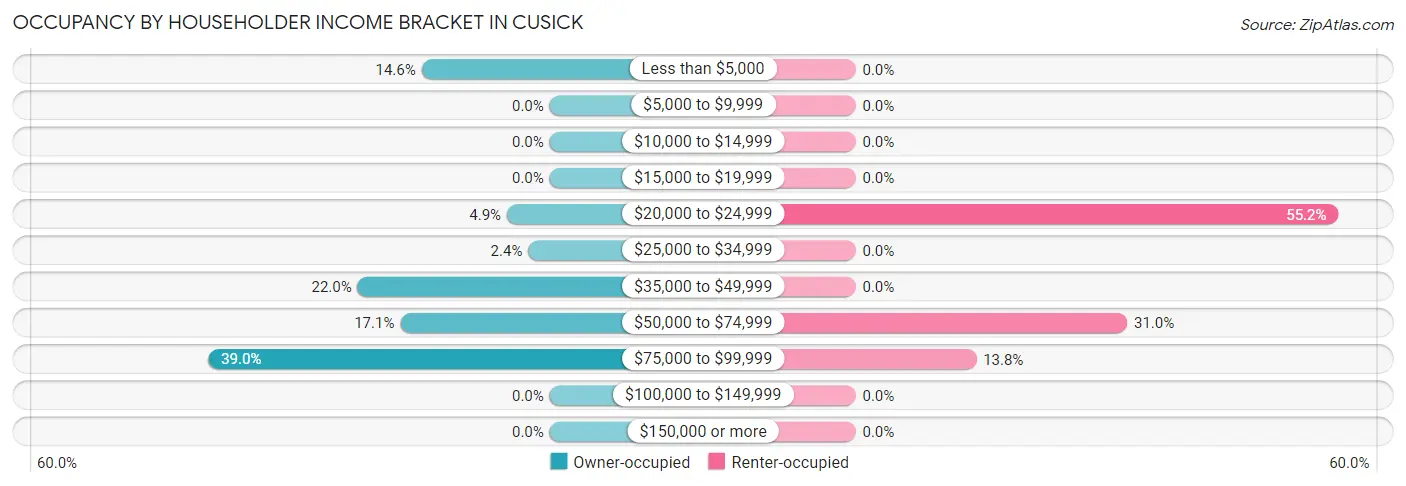
| Income Bracket | Owner-occupied | Renter-occupied |
| Less than $5,000 | 6 (14.6%) | 0 (0.0%) |
| $5,000 to $9,999 | 0 (0.0%) | 0 (0.0%) |
| $10,000 to $14,999 | 0 (0.0%) | 0 (0.0%) |
| $15,000 to $19,999 | 0 (0.0%) | 0 (0.0%) |
| $20,000 to $24,999 | 2 (4.9%) | 16 (55.2%) |
| $25,000 to $34,999 | 1 (2.4%) | 0 (0.0%) |
| $35,000 to $49,999 | 9 (22.0%) | 0 (0.0%) |
| $50,000 to $74,999 | 7 (17.1%) | 9 (31.0%) |
| $75,000 to $99,999 | 16 (39.0%) | 4 (13.8%) |
| $100,000 to $149,999 | 0 (0.0%) | 0 (0.0%) |
| $150,000 or more | 0 (0.0%) | 0 (0.0%) |
| Total | 41 (100.0%) | 29 (100.0%) |
Monthly Housing Cost Tiers in Cusick
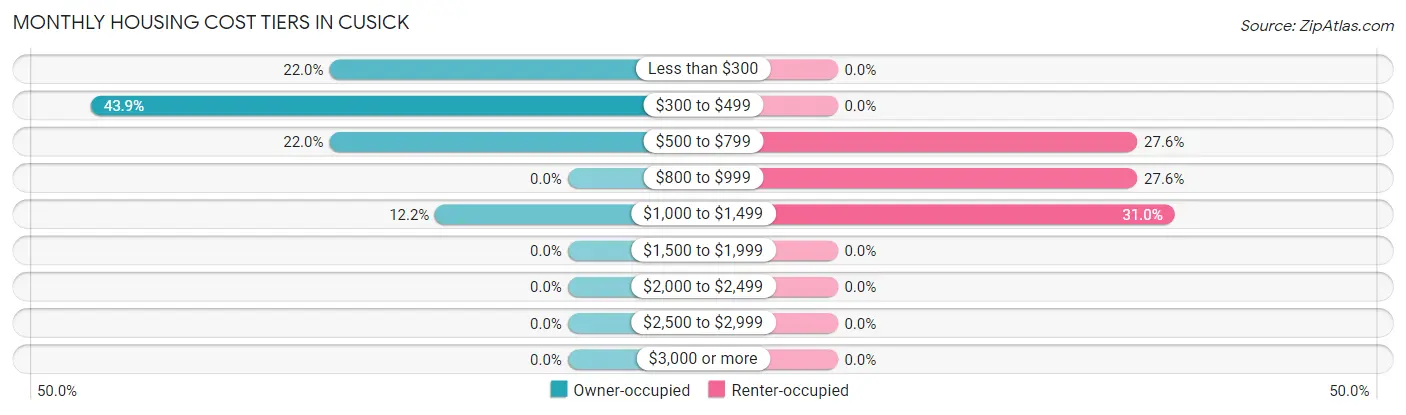
| Monthly Cost | Owner-occupied | Renter-occupied |
| Less than $300 | 9 (22.0%) | 0 (0.0%) |
| $300 to $499 | 18 (43.9%) | 0 (0.0%) |
| $500 to $799 | 9 (22.0%) | 8 (27.6%) |
| $800 to $999 | 0 (0.0%) | 8 (27.6%) |
| $1,000 to $1,499 | 5 (12.2%) | 9 (31.0%) |
| $1,500 to $1,999 | 0 (0.0%) | 0 (0.0%) |
| $2,000 to $2,499 | 0 (0.0%) | 0 (0.0%) |
| $2,500 to $2,999 | 0 (0.0%) | 0 (0.0%) |
| $3,000 or more | 0 (0.0%) | 0 (0.0%) |
| Total | 41 (100.0%) | 29 (100.0%) |
Physical Housing Characteristics in Cusick
Housing Structures in Cusick
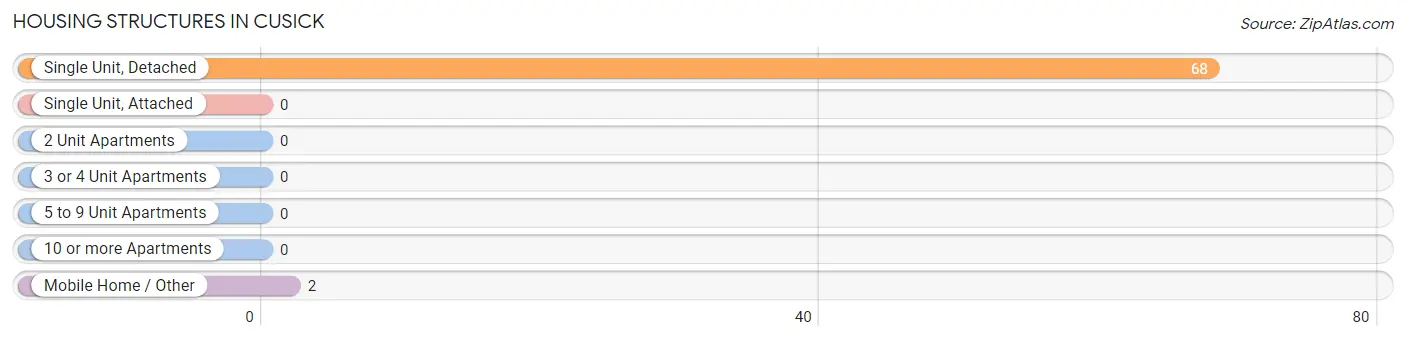
| Structure Type | # Housing Units | % Housing Units |
| Single Unit, Detached | 68 | 97.1% |
| Single Unit, Attached | 0 | 0.0% |
| 2 Unit Apartments | 0 | 0.0% |
| 3 or 4 Unit Apartments | 0 | 0.0% |
| 5 to 9 Unit Apartments | 0 | 0.0% |
| 10 or more Apartments | 0 | 0.0% |
| Mobile Home / Other | 2 | 2.9% |
| Total | 70 | 100.0% |
Housing Structures by Occupancy in Cusick
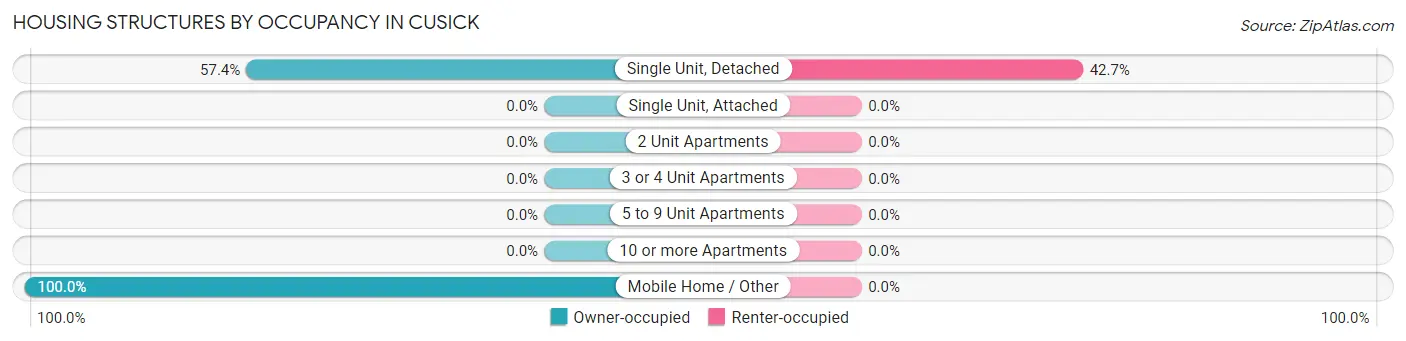
| Structure Type | Owner-occupied | Renter-occupied |
| Single Unit, Detached | 39 (57.4%) | 29 (42.6%) |
| Single Unit, Attached | 0 (0.0%) | 0 (0.0%) |
| 2 Unit Apartments | 0 (0.0%) | 0 (0.0%) |
| 3 or 4 Unit Apartments | 0 (0.0%) | 0 (0.0%) |
| 5 to 9 Unit Apartments | 0 (0.0%) | 0 (0.0%) |
| 10 or more Apartments | 0 (0.0%) | 0 (0.0%) |
| Mobile Home / Other | 2 (100.0%) | 0 (0.0%) |
| Total | 41 (58.6%) | 29 (41.4%) |
Housing Structures by Number of Rooms in Cusick
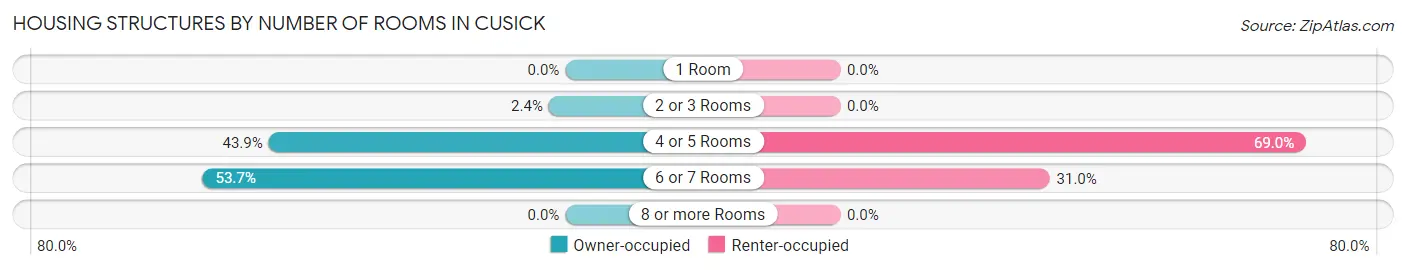
| Number of Rooms | Owner-occupied | Renter-occupied |
| 1 Room | 0 (0.0%) | 0 (0.0%) |
| 2 or 3 Rooms | 1 (2.4%) | 0 (0.0%) |
| 4 or 5 Rooms | 18 (43.9%) | 20 (69.0%) |
| 6 or 7 Rooms | 22 (53.7%) | 9 (31.0%) |
| 8 or more Rooms | 0 (0.0%) | 0 (0.0%) |
| Total | 41 (100.0%) | 29 (100.0%) |
Housing Structure by Heating Type in Cusick
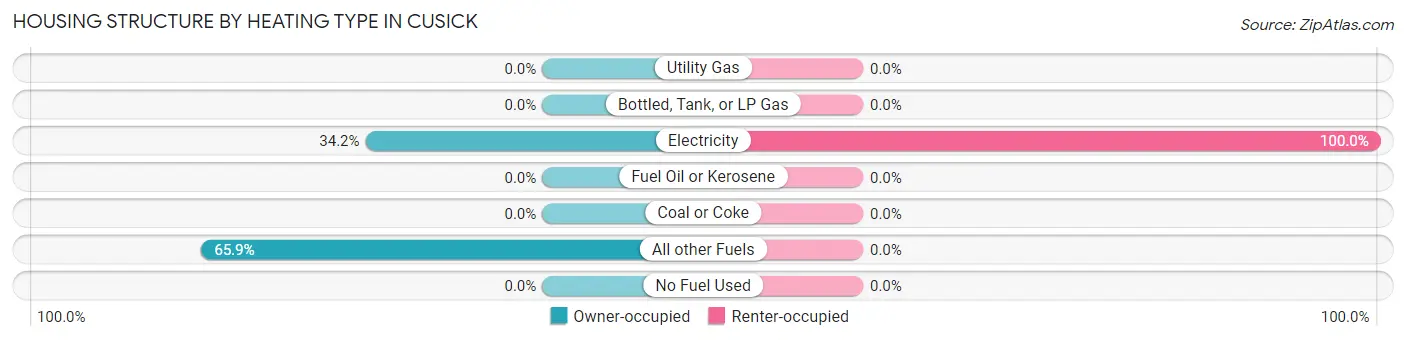
| Heating Type | Owner-occupied | Renter-occupied |
| Utility Gas | 0 (0.0%) | 0 (0.0%) |
| Bottled, Tank, or LP Gas | 0 (0.0%) | 0 (0.0%) |
| Electricity | 14 (34.2%) | 29 (100.0%) |
| Fuel Oil or Kerosene | 0 (0.0%) | 0 (0.0%) |
| Coal or Coke | 0 (0.0%) | 0 (0.0%) |
| All other Fuels | 27 (65.8%) | 0 (0.0%) |
| No Fuel Used | 0 (0.0%) | 0 (0.0%) |
| Total | 41 (100.0%) | 29 (100.0%) |
Household Vehicle Usage in Cusick
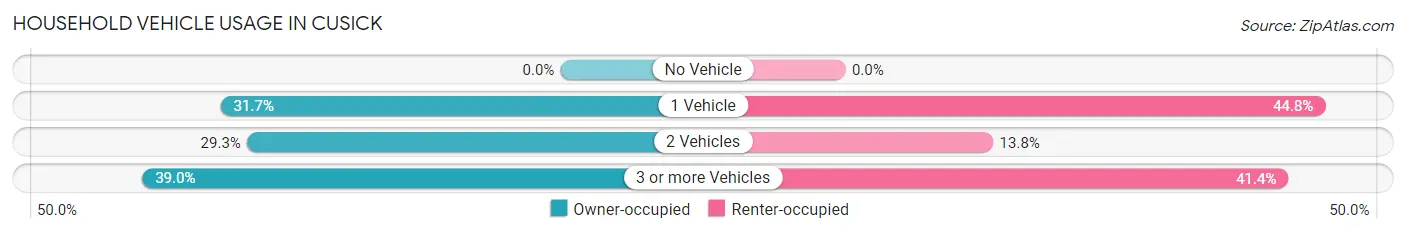
| Vehicles per Household | Owner-occupied | Renter-occupied |
| No Vehicle | 0 (0.0%) | 0 (0.0%) |
| 1 Vehicle | 13 (31.7%) | 13 (44.8%) |
| 2 Vehicles | 12 (29.3%) | 4 (13.8%) |
| 3 or more Vehicles | 16 (39.0%) | 12 (41.4%) |
| Total | 41 (100.0%) | 29 (100.0%) |
Real Estate & Mortgages in Cusick
Real Estate and Mortgage Overview in Cusick
| Characteristic | Without Mortgage | With Mortgage |
| Housing Units | 36 | 5 |
| Median Property Value | - | - |
| Median Household Income | $53,750 | $0 |
| Monthly Housing Costs | $350 | $0 |
| Real Estate Taxes | $533 | $0 |
Property Value by Mortgage Status in Cusick
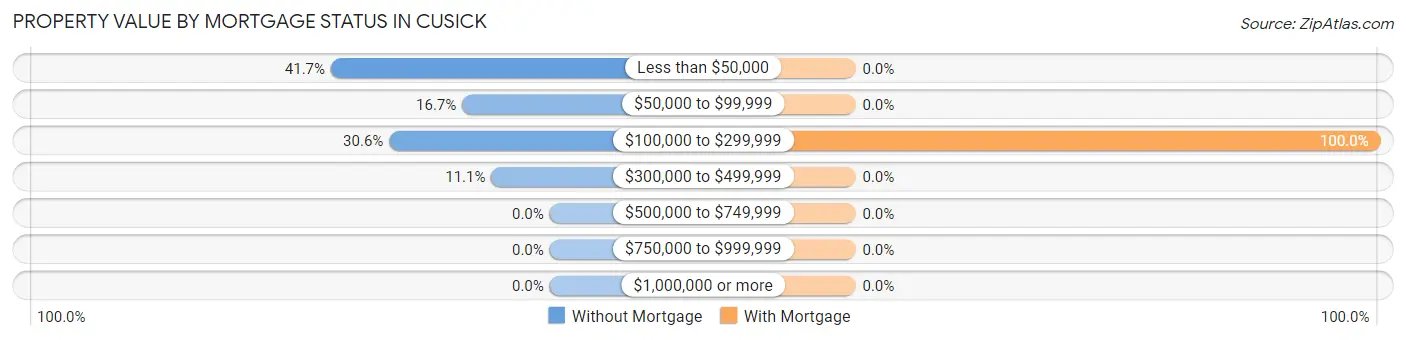
| Property Value | Without Mortgage | With Mortgage |
| Less than $50,000 | 15 (41.7%) | 0 (0.0%) |
| $50,000 to $99,999 | 6 (16.7%) | 0 (0.0%) |
| $100,000 to $299,999 | 11 (30.6%) | 5 (100.0%) |
| $300,000 to $499,999 | 4 (11.1%) | 0 (0.0%) |
| $500,000 to $749,999 | 0 (0.0%) | 0 (0.0%) |
| $750,000 to $999,999 | 0 (0.0%) | 0 (0.0%) |
| $1,000,000 or more | 0 (0.0%) | 0 (0.0%) |
| Total | 36 (100.0%) | 5 (100.0%) |
Household Income by Mortgage Status in Cusick
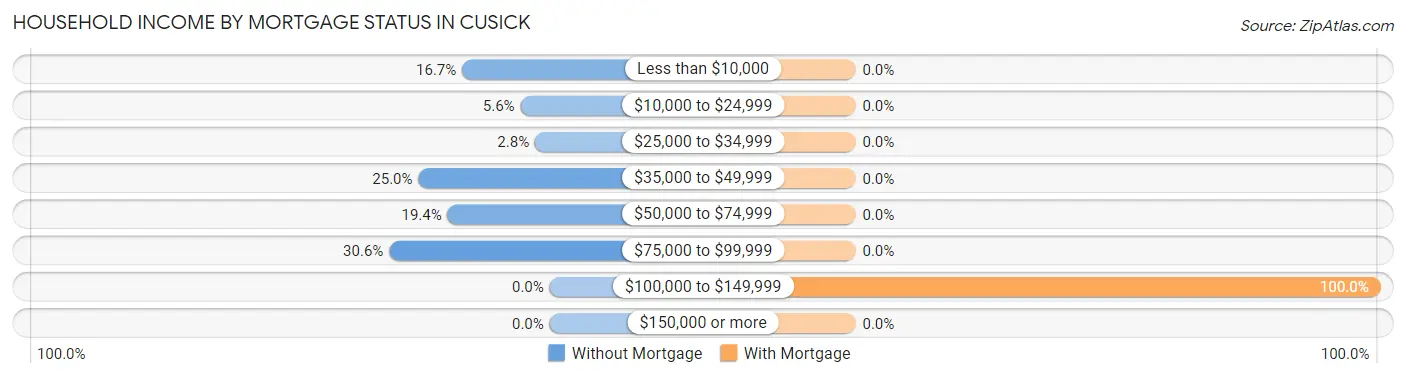
| Household Income | Without Mortgage | With Mortgage |
| Less than $10,000 | 6 (16.7%) | 0 (0.0%) |
| $10,000 to $24,999 | 2 (5.6%) | 0 (0.0%) |
| $25,000 to $34,999 | 1 (2.8%) | 0 (0.0%) |
| $35,000 to $49,999 | 9 (25.0%) | 0 (0.0%) |
| $50,000 to $74,999 | 7 (19.4%) | 0 (0.0%) |
| $75,000 to $99,999 | 11 (30.6%) | 0 (0.0%) |
| $100,000 to $149,999 | 0 (0.0%) | 5 (100.0%) |
| $150,000 or more | 0 (0.0%) | 0 (0.0%) |
| Total | 36 (100.0%) | 5 (100.0%) |
Property Value to Household Income Ratio in Cusick
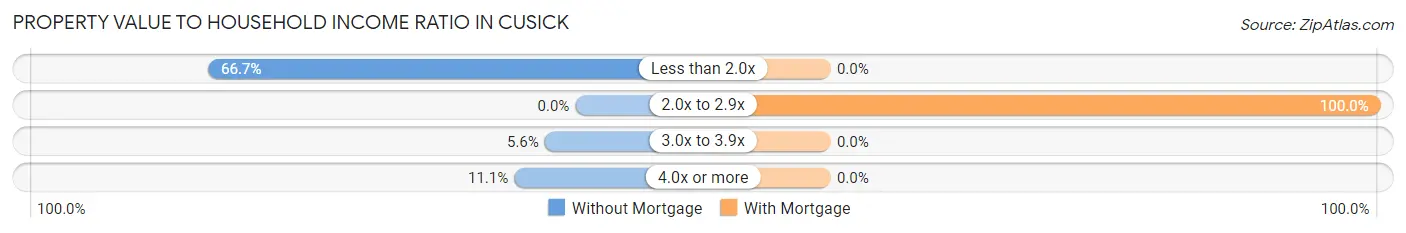
| Value-to-Income Ratio | Without Mortgage | With Mortgage |
| Less than 2.0x | 24 (66.7%) | 0 (0.0%) |
| 2.0x to 2.9x | 0 (0.0%) | 5 (100.0%) |
| 3.0x to 3.9x | 2 (5.6%) | 0 (0.0%) |
| 4.0x or more | 4 (11.1%) | 0 (0.0%) |
| Total | 36 (100.0%) | 5 (100.0%) |
Real Estate Taxes by Mortgage Status in Cusick
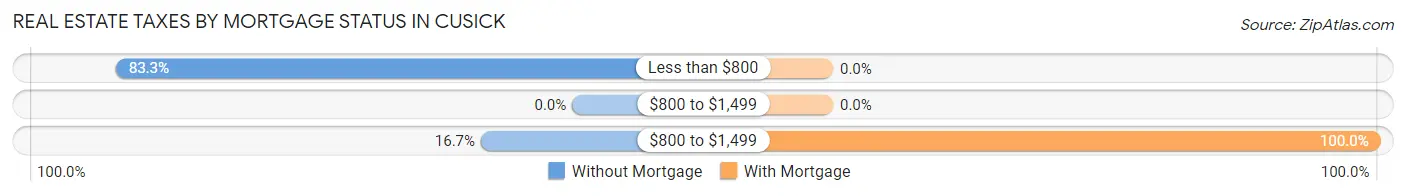
| Property Taxes | Without Mortgage | With Mortgage |
| Less than $800 | 30 (83.3%) | 0 (0.0%) |
| $800 to $1,499 | 0 (0.0%) | 0 (0.0%) |
| $800 to $1,499 | 6 (16.7%) | 5 (100.0%) |
| Total | 36 (100.0%) | 5 (100.0%) |
Health & Disability in Cusick
Health Insurance Coverage by Age in Cusick
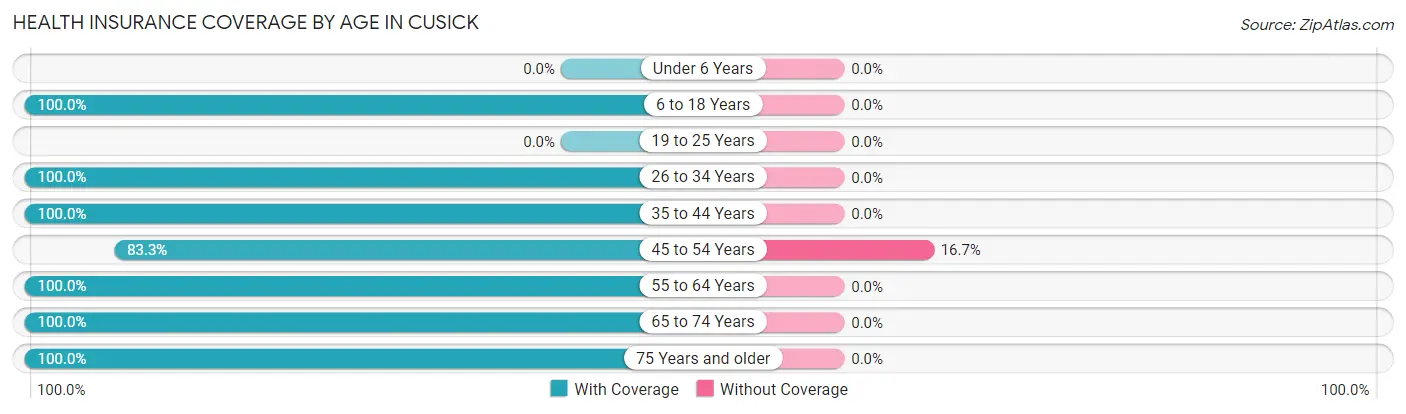
| Age Bracket | With Coverage | Without Coverage |
| Under 6 Years | 0 (0.0%) | 0 (0.0%) |
| 6 to 18 Years | 68 (100.0%) | 0 (0.0%) |
| 19 to 25 Years | 0 (0.0%) | 0 (0.0%) |
| 26 to 34 Years | 8 (100.0%) | 0 (0.0%) |
| 35 to 44 Years | 13 (100.0%) | 0 (0.0%) |
| 45 to 54 Years | 15 (83.3%) | 3 (16.7%) |
| 55 to 64 Years | 50 (100.0%) | 0 (0.0%) |
| 65 to 74 Years | 20 (100.0%) | 0 (0.0%) |
| 75 Years and older | 8 (100.0%) | 0 (0.0%) |
| Total | 182 (98.4%) | 3 (1.6%) |
Health Insurance Coverage by Citizenship Status in Cusick
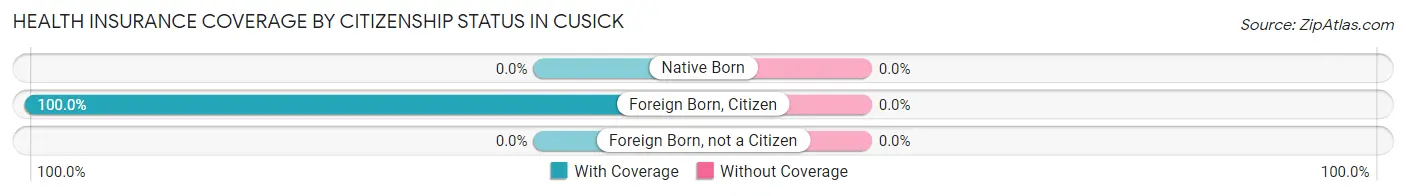
| Citizenship Status | With Coverage | Without Coverage |
| Native Born | 0 (0.0%) | 0 (0.0%) |
| Foreign Born, Citizen | 68 (100.0%) | 0 (0.0%) |
| Foreign Born, not a Citizen | 0 (0.0%) | 0 (0.0%) |
Health Insurance Coverage by Household Income in Cusick
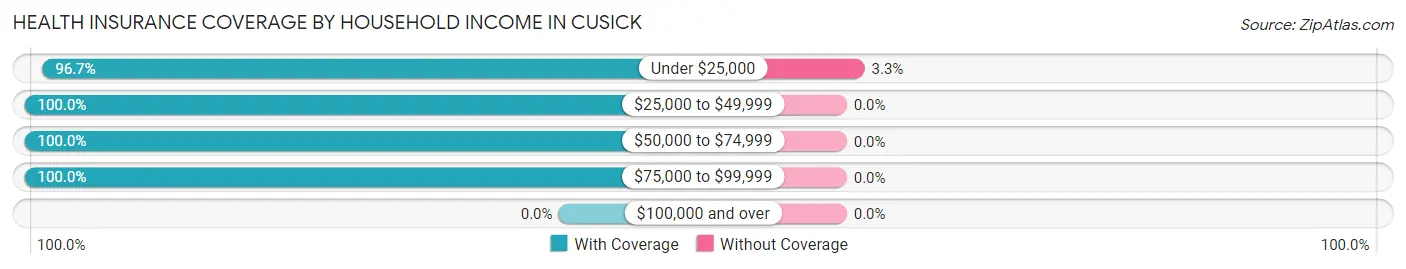
| Household Income | With Coverage | Without Coverage |
| Under $25,000 | 87 (96.7%) | 3 (3.3%) |
| $25,000 to $49,999 | 14 (100.0%) | 0 (0.0%) |
| $50,000 to $74,999 | 43 (100.0%) | 0 (0.0%) |
| $75,000 to $99,999 | 38 (100.0%) | 0 (0.0%) |
| $100,000 and over | 0 (0.0%) | 0 (0.0%) |
Public vs Private Health Insurance Coverage by Age in Cusick
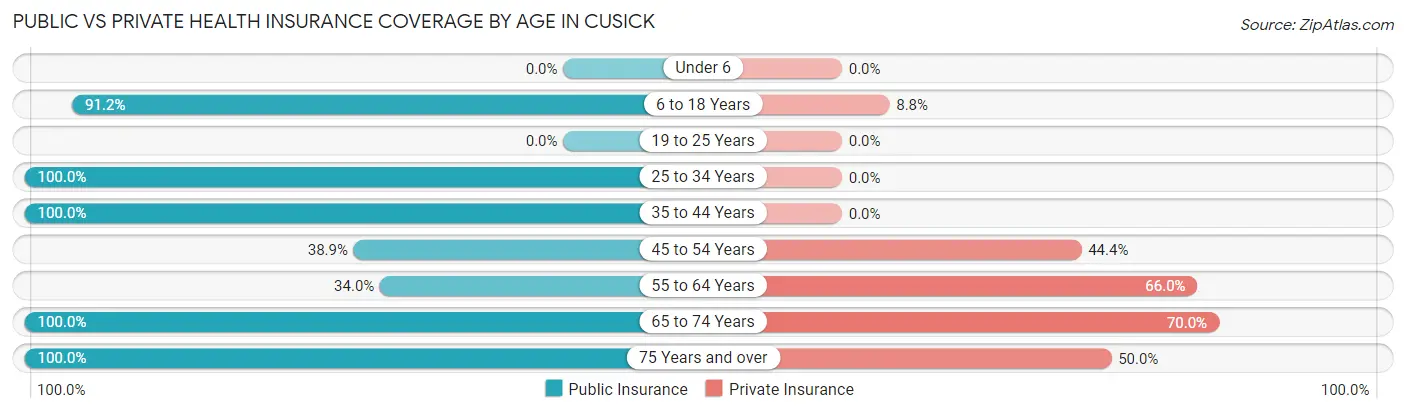
| Age Bracket | Public Insurance | Private Insurance |
| Under 6 | 0 (0.0%) | 0 (0.0%) |
| 6 to 18 Years | 62 (91.2%) | 6 (8.8%) |
| 19 to 25 Years | 0 (0.0%) | 0 (0.0%) |
| 25 to 34 Years | 8 (100.0%) | 0 (0.0%) |
| 35 to 44 Years | 13 (100.0%) | 0 (0.0%) |
| 45 to 54 Years | 7 (38.9%) | 8 (44.4%) |
| 55 to 64 Years | 17 (34.0%) | 33 (66.0%) |
| 65 to 74 Years | 20 (100.0%) | 14 (70.0%) |
| 75 Years and over | 8 (100.0%) | 4 (50.0%) |
| Total | 135 (73.0%) | 65 (35.1%) |
Disability Status by Sex by Age in Cusick
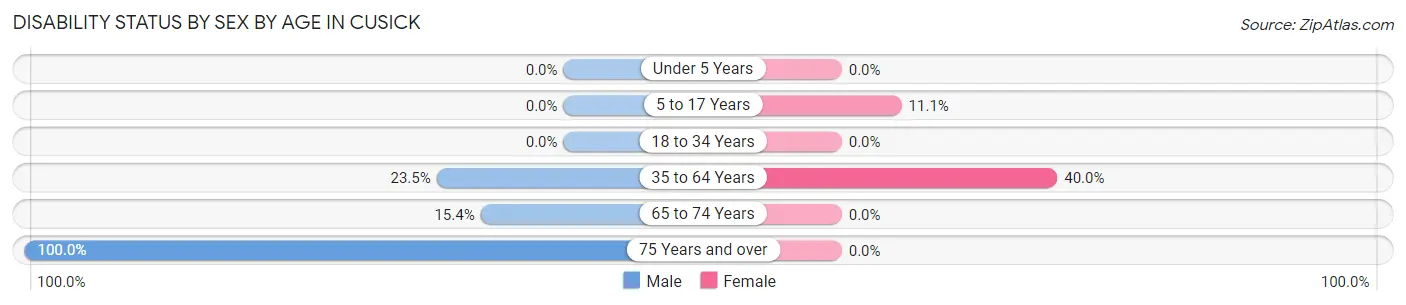
| Age Bracket | Male | Female |
| Under 5 Years | 0 (0.0%) | 0 (0.0%) |
| 5 to 17 Years | 0 (0.0%) | 5 (11.1%) |
| 18 to 34 Years | 0 (0.0%) | 0 (0.0%) |
| 35 to 64 Years | 12 (23.5%) | 12 (40.0%) |
| 65 to 74 Years | 2 (15.4%) | 0 (0.0%) |
| 75 Years and over | 4 (100.0%) | 0 (0.0%) |
Disability Class by Sex by Age in Cusick
Disability Class: Hearing Difficulty
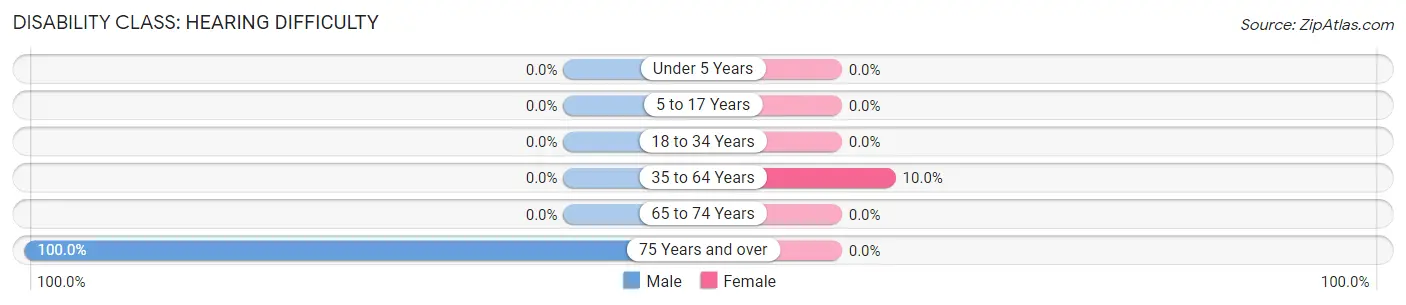
| Age Bracket | Male | Female |
| Under 5 Years | 0 (0.0%) | 0 (0.0%) |
| 5 to 17 Years | 0 (0.0%) | 0 (0.0%) |
| 18 to 34 Years | 0 (0.0%) | 0 (0.0%) |
| 35 to 64 Years | 0 (0.0%) | 3 (10.0%) |
| 65 to 74 Years | 0 (0.0%) | 0 (0.0%) |
| 75 Years and over | 4 (100.0%) | 0 (0.0%) |
Disability Class: Vision Difficulty
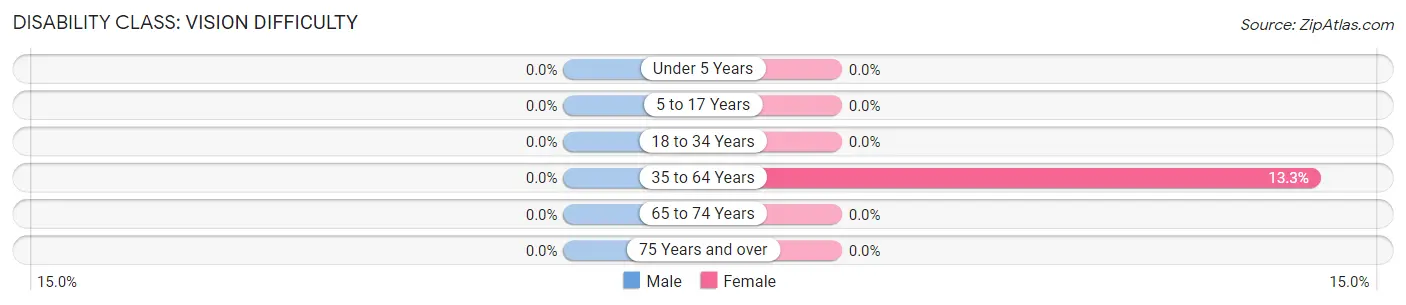
| Age Bracket | Male | Female |
| Under 5 Years | 0 (0.0%) | 0 (0.0%) |
| 5 to 17 Years | 0 (0.0%) | 0 (0.0%) |
| 18 to 34 Years | 0 (0.0%) | 0 (0.0%) |
| 35 to 64 Years | 0 (0.0%) | 4 (13.3%) |
| 65 to 74 Years | 0 (0.0%) | 0 (0.0%) |
| 75 Years and over | 0 (0.0%) | 0 (0.0%) |
Disability Class: Cognitive Difficulty
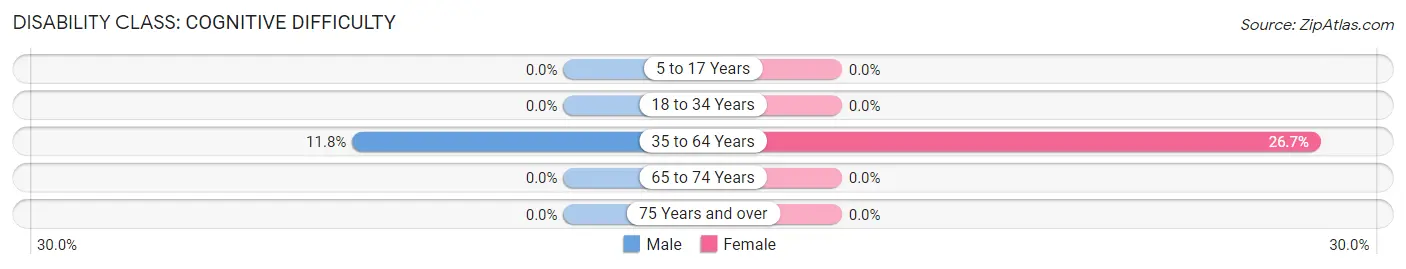
| Age Bracket | Male | Female |
| 5 to 17 Years | 0 (0.0%) | 0 (0.0%) |
| 18 to 34 Years | 0 (0.0%) | 0 (0.0%) |
| 35 to 64 Years | 6 (11.8%) | 8 (26.7%) |
| 65 to 74 Years | 0 (0.0%) | 0 (0.0%) |
| 75 Years and over | 0 (0.0%) | 0 (0.0%) |
Disability Class: Ambulatory Difficulty
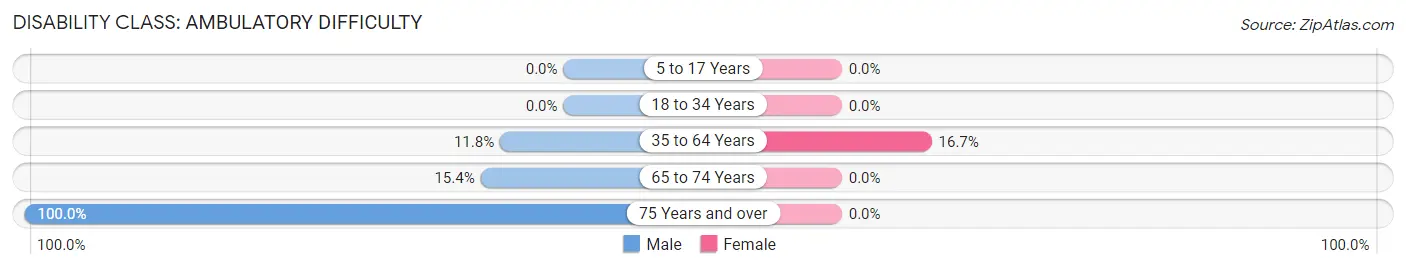
| Age Bracket | Male | Female |
| 5 to 17 Years | 0 (0.0%) | 0 (0.0%) |
| 18 to 34 Years | 0 (0.0%) | 0 (0.0%) |
| 35 to 64 Years | 6 (11.8%) | 5 (16.7%) |
| 65 to 74 Years | 2 (15.4%) | 0 (0.0%) |
| 75 Years and over | 4 (100.0%) | 0 (0.0%) |
Disability Class: Self-Care Difficulty
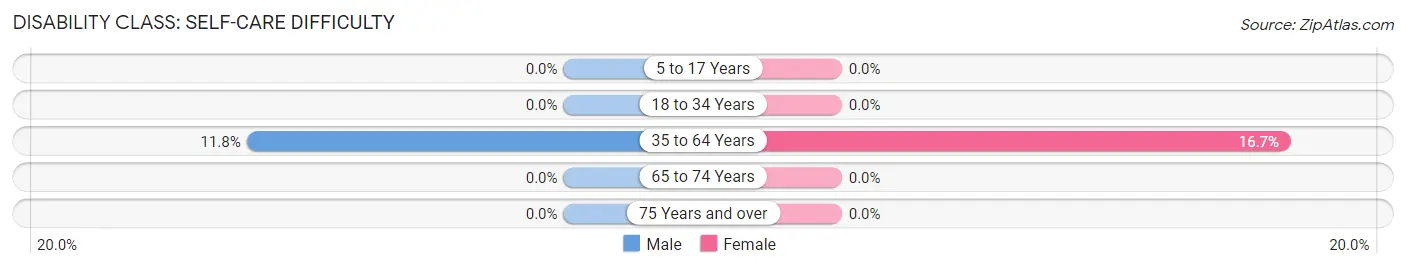
| Age Bracket | Male | Female |
| 5 to 17 Years | 0 (0.0%) | 0 (0.0%) |
| 18 to 34 Years | 0 (0.0%) | 0 (0.0%) |
| 35 to 64 Years | 6 (11.8%) | 5 (16.7%) |
| 65 to 74 Years | 0 (0.0%) | 0 (0.0%) |
| 75 Years and over | 0 (0.0%) | 0 (0.0%) |
Technology Access in Cusick
Computing Device Access in Cusick
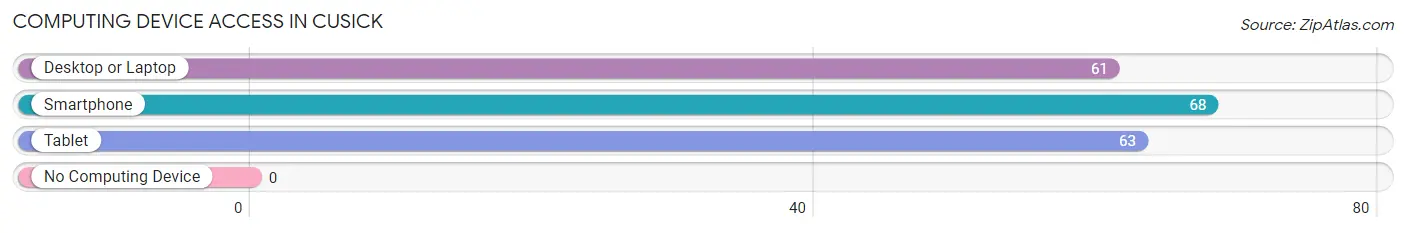
| Device Type | # Households | % Households |
| Desktop or Laptop | 61 | 87.1% |
| Smartphone | 68 | 97.1% |
| Tablet | 63 | 90.0% |
| No Computing Device | 0 | 0.0% |
| Total | 70 | 100.0% |
Internet Access in Cusick
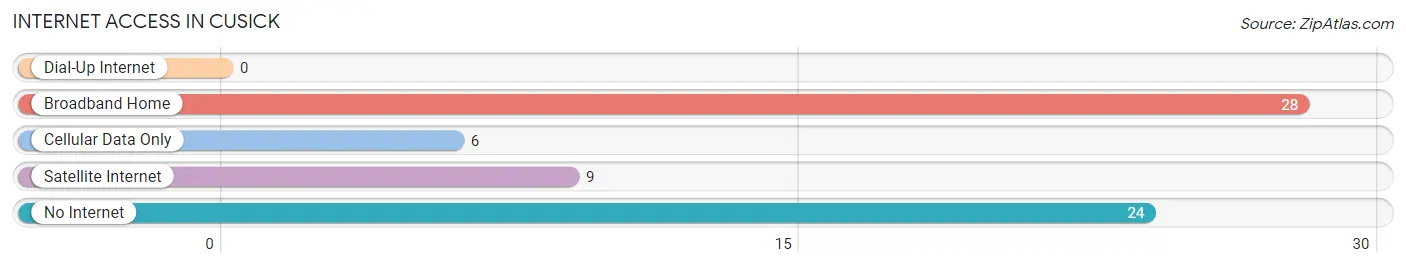
| Internet Type | # Households | % Households |
| Dial-Up Internet | 0 | 0.0% |
| Broadband Home | 28 | 40.0% |
| Cellular Data Only | 6 | 8.6% |
| Satellite Internet | 9 | 12.9% |
| No Internet | 24 | 34.3% |
| Total | 70 | 100.0% |
Cusick Summary
Cusick is a small town located in Pend Oreille County, Washington, United States. It is situated on the Pend Oreille River, near the Idaho border. The population was 545 at the 2010 census.
History
The area around Cusick was first inhabited by the Kalispel Tribe, who lived in the area for thousands of years before the arrival of European settlers. The first white settlers arrived in the area in the late 1800s, and the town was officially founded in 1891. The town was named after James Cusick, a local homesteader.
In the early 1900s, Cusick was a thriving logging and farming community. The town was home to several sawmills, a flour mill, and a creamery. The town also had a hotel, a general store, and a post office.
In the 1950s, the logging industry began to decline, and the town's population began to dwindle. In the 1970s, the town was revitalized by the construction of the Pend Oreille River Dam, which created a large lake and provided hydroelectric power to the area.
Geography
Cusick is located at 48°25'25" North, 117°17'45" West (48.423, -117.296). The town is situated on the Pend Oreille River, near the Idaho border. The town is surrounded by rolling hills and forests.
The nearest major cities are Spokane, Washington (90 miles to the south) and Coeur d'Alene, Idaho (50 miles to the east).
Economy
The economy of Cusick is largely based on tourism and recreation. The town is home to several campgrounds, RV parks, and resorts. The nearby Pend Oreille River is popular for fishing, boating, and other water activities.
The town is also home to several small businesses, including a grocery store, a hardware store, and a gas station.
Demographics
As of the 2010 census, there were 545 people, 230 households, and 145 families living in Cusick. The population density was 545 people per square mile (210/km2). The racial makeup of the town was 94.2% White, 0.2% African American, 0.7% Native American, 0.2% Asian, 0.2% Pacific Islander, 0.4% from other races, and 4.1% from two or more races. Hispanic or Latino of any race were 1.3% of the population.
The median age in Cusick was 44.3 years. 22.2% of residents were under the age of 18; 6.2% were between the ages of 18 and 24; 22.2% were from 25 to 44; 33.2% were from 45 to 64; and 16.2% were 65 years of age or older. The gender makeup of the town was 48.7% male and 51.3% female.
The median income for a household in Cusick was $31,250, and the median income for a family was $37,500. Males had a median income of $30,000 versus $20,000 for females. The per capita income for the town was $17,813. About 11.2% of families and 14.2% of the population were below the poverty line, including 18.2% of those under age 18 and 8.3% of those age 65 or over.
Common Questions
What is Per Capita Income in Cusick?
Per Capita income in Cusick is $19,794.
What is the Median Family Income in Cusick?
Median Family Income in Cusick is $59,107.
What is the Median Household income in Cusick?
Median Household Income in Cusick is $55,625.
What is Income or Wage Gap in Cusick?
Income or Wage Gap in Cusick is 58.3%.
Women in Cusick earn 41.7 cents for every dollar earned by a man.
What is Inequality or Gini Index in Cusick?
Inequality or Gini Index in Cusick is 0.34.
What is the Total Population of Cusick?
Total Population of Cusick is 185.
What is the Total Male Population of Cusick?
Total Male Population of Cusick is 91.
What is the Total Female Population of Cusick?
Total Female Population of Cusick is 94.
What is the Ratio of Males per 100 Females in Cusick?
There are 96.81 Males per 100 Females in Cusick.
What is the Ratio of Females per 100 Males in Cusick?
There are 103.30 Females per 100 Males in Cusick.
What is the Median Population Age in Cusick?
Median Population Age in Cusick is 49.8 Years.
What is the Average Family Size in Cusick
Average Family Size in Cusick is 3.2 People.
What is the Average Household Size in Cusick
Average Household Size in Cusick is 2.6 People.
How Large is the Labor Force in Cusick?
There are 61 People in the Labor Forcein in Cusick.
What is the Percentage of People in the Labor Force in Cusick?
50.0% of People are in the Labor Force in Cusick.
What is the Unemployment Rate in Cusick?
Unemployment Rate in Cusick is 9.8%.