La Center, WA Map & Demographics
La Center Map
La Center Overview
$42,319
PER CAPITA INCOME
$113,478
AVG FAMILY INCOME
$112,758
AVG HOUSEHOLD INCOME
59.9%
WAGE / INCOME GAP [ % ]
40.1¢/ $1
WAGE / INCOME GAP [ $ ]
0.39
INEQUALITY / GINI INDEX
3,685
TOTAL POPULATION
1,728
MALE POPULATION
1,957
FEMALE POPULATION
88.30
MALES / 100 FEMALES
113.25
FEMALES / 100 MALES
40.4
MEDIAN AGE
3.1
AVG FAMILY SIZE
3.0
AVG HOUSEHOLD SIZE
1,820
LABOR FORCE [ PEOPLE ]
60.2%
PERCENT IN LABOR FORCE
4.2%
UNEMPLOYMENT RATE
La Center Zip Codes
La Center Area Codes
Income in La Center
Income Overview in La Center
Per Capita Income in La Center is $42,319, while median incomes of families and households are $113,478 and $112,758 respectively.
| Characteristic | Number | Measure |
| Per Capita Income | 3,685 | $42,319 |
| Median Family Income | 1,122 | $113,478 |
| Mean Family Income | 1,122 | $128,977 |
| Median Household Income | 1,233 | $112,758 |
| Mean Household Income | 1,233 | $124,590 |
| Income Deficit | 1,122 | $0 |
| Wage / Income Gap (%) | 3,685 | 59.92% |
| Wage / Income Gap ($) | 3,685 | 40.08¢ per $1 |
| Gini / Inequality Index | 3,685 | 0.39 |
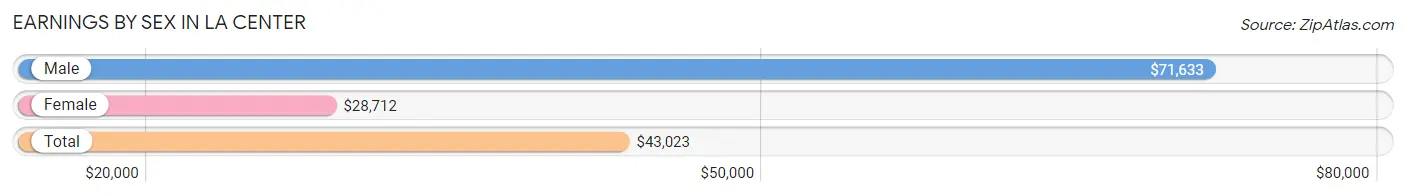
Earnings by Sex in La Center
Average Earnings in La Center are $43,023, $71,633 for men and $28,712 for women, a difference of 59.9%.
| Sex | Number | Average Earnings |
| Male | 909 (48.5%) | $71,633 |
| Female | 964 (51.5%) | $28,712 |
| Total | 1,873 (100.0%) | $43,023 |
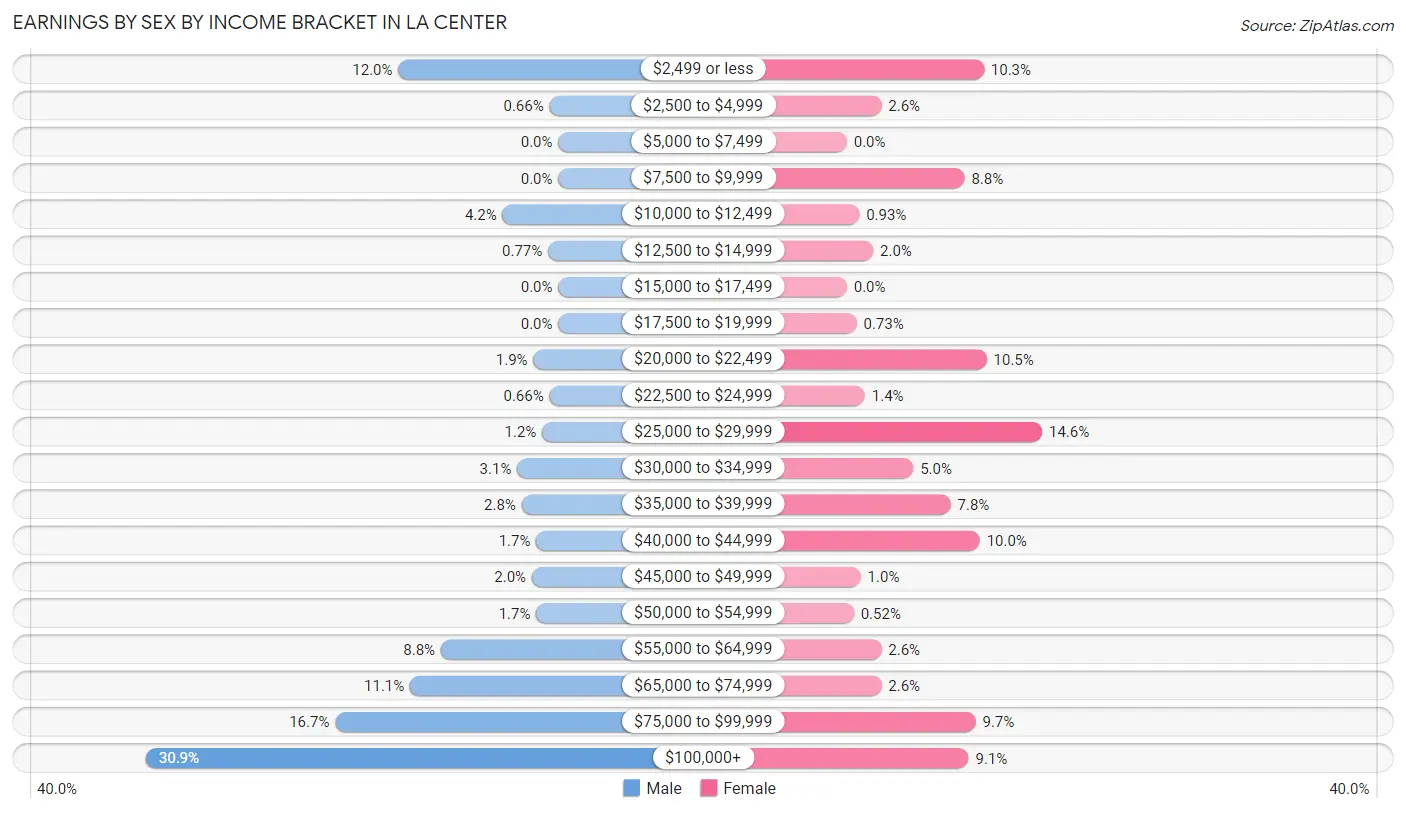
Earnings by Sex by Income Bracket in La Center
The most common earnings brackets in La Center are $100,000+ for men (281 | 30.9%) and $25,000 to $29,999 for women (141 | 14.6%).
| Income | Male | Female |
| $2,499 or less | 109 (12.0%) | 99 (10.3%) |
| $2,500 to $4,999 | 6 (0.7%) | 25 (2.6%) |
| $5,000 to $7,499 | 0 (0.0%) | 0 (0.0%) |
| $7,500 to $9,999 | 0 (0.0%) | 85 (8.8%) |
| $10,000 to $12,499 | 38 (4.2%) | 9 (0.9%) |
| $12,500 to $14,999 | 7 (0.8%) | 19 (2.0%) |
| $15,000 to $17,499 | 0 (0.0%) | 0 (0.0%) |
| $17,500 to $19,999 | 0 (0.0%) | 7 (0.7%) |
| $20,000 to $22,499 | 17 (1.9%) | 101 (10.5%) |
| $22,500 to $24,999 | 6 (0.7%) | 13 (1.3%) |
| $25,000 to $29,999 | 11 (1.2%) | 141 (14.6%) |
| $30,000 to $34,999 | 28 (3.1%) | 48 (5.0%) |
| $35,000 to $39,999 | 25 (2.8%) | 75 (7.8%) |
| $40,000 to $44,999 | 15 (1.7%) | 96 (10.0%) |
| $45,000 to $49,999 | 18 (2.0%) | 10 (1.0%) |
| $50,000 to $54,999 | 15 (1.7%) | 5 (0.5%) |
| $55,000 to $64,999 | 80 (8.8%) | 25 (2.6%) |
| $65,000 to $74,999 | 101 (11.1%) | 25 (2.6%) |
| $75,000 to $99,999 | 152 (16.7%) | 93 (9.7%) |
| $100,000+ | 281 (30.9%) | 88 (9.1%) |
| Total | 909 (100.0%) | 964 (100.0%) |
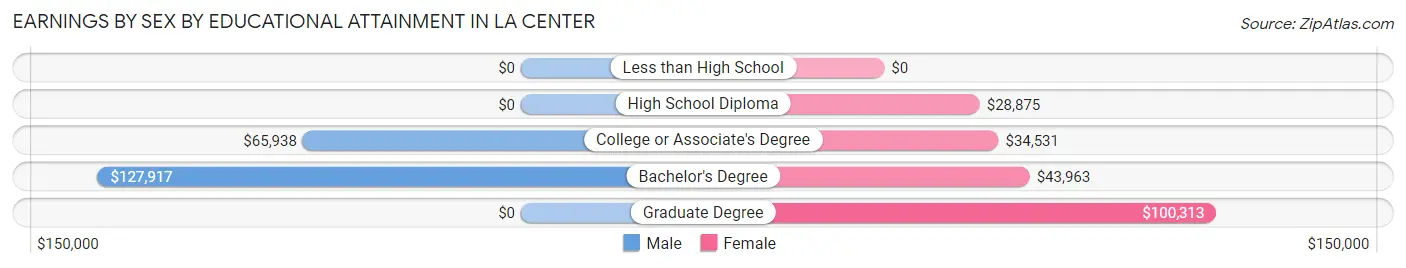
Earnings by Sex by Educational Attainment in La Center
Average earnings in La Center are $84,145 for men and $38,833 for women, a difference of 53.8%. Men with an educational attainment of bachelor's degree enjoy the highest average annual earnings of $127,917, while those with college or associate's degree education earn the least with $65,938. Women with an educational attainment of graduate degree earn the most with the average annual earnings of $100,313, while those with high school diploma education have the smallest earnings of $28,875.
| Educational Attainment | Male Income | Female Income |
| Less than High School | - | - |
| High School Diploma | - | - |
| College or Associate's Degree | $65,938 | $34,531 |
| Bachelor's Degree | $127,917 | $43,963 |
| Graduate Degree | - | - |
| Total | $84,145 | $38,833 |
Family Income in La Center
Family Income Brackets in La Center
According to the La Center family income data, there are 335 families falling into the $100,000 to $149,999 income range, which is the most common income bracket and makes up 29.9% of all families.
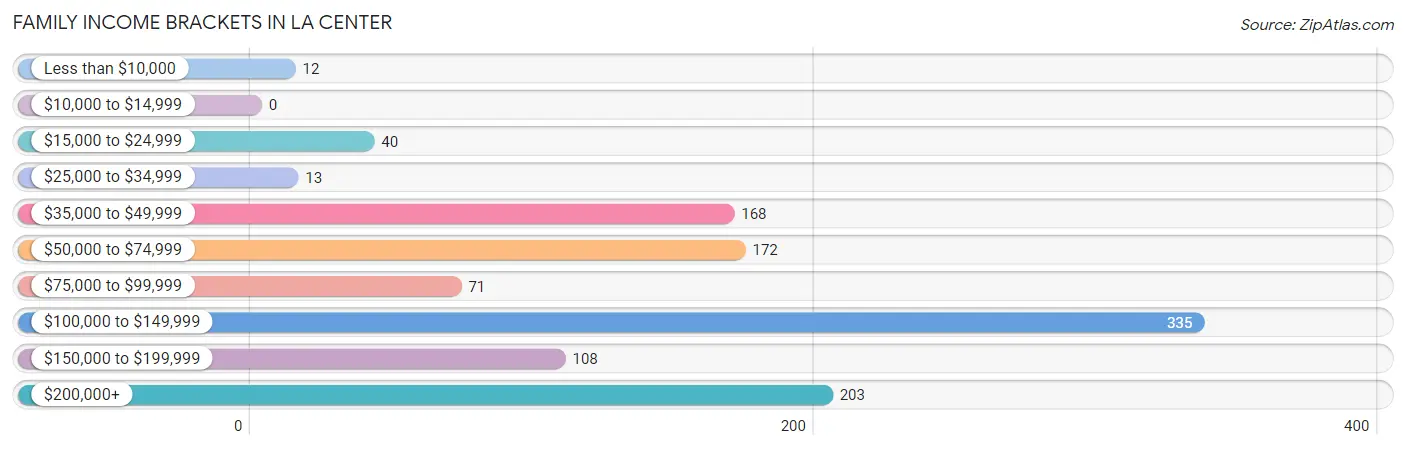
| Income Bracket | # Families | % Families |
| Less than $10,000 | 12 | 1.1% |
| $10,000 to $14,999 | 0 | 0.0% |
| $15,000 to $24,999 | 40 | 3.6% |
| $25,000 to $34,999 | 13 | 1.2% |
| $35,000 to $49,999 | 168 | 15.0% |
| $50,000 to $74,999 | 172 | 15.3% |
| $75,000 to $99,999 | 71 | 6.3% |
| $100,000 to $149,999 | 335 | 29.9% |
| $150,000 to $199,999 | 108 | 9.6% |
| $200,000+ | 203 | 18.1% |
Family Income by Famaliy Size in La Center
3-person families (312 | 27.8%) account for the highest median family income in La Center with $115,000 per family, while 2-person families (468 | 41.7%) have the highest median income of $57,322 per family member.
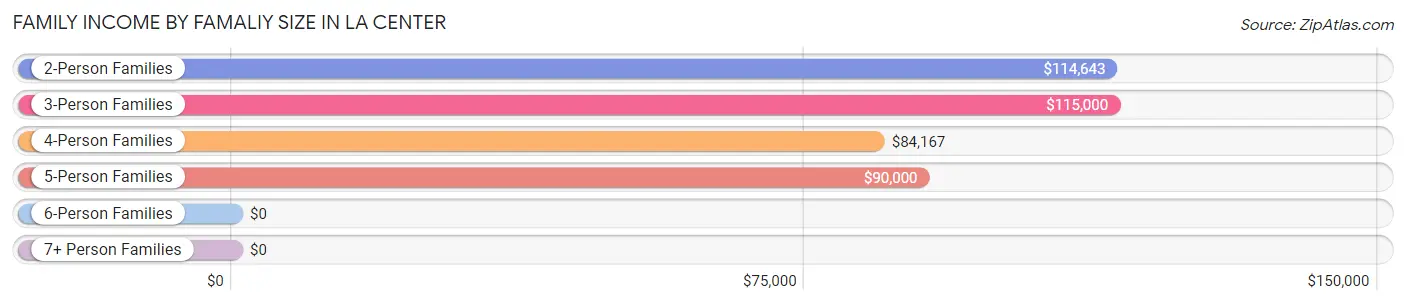
| Income Bracket | # Families | Median Income |
| 2-Person Families | 468 (41.7%) | $114,643 |
| 3-Person Families | 312 (27.8%) | $115,000 |
| 4-Person Families | 192 (17.1%) | $84,167 |
| 5-Person Families | 134 (11.9%) | $90,000 |
| 6-Person Families | 11 (1.0%) | $0 |
| 7+ Person Families | 5 (0.4%) | $0 |
| Total | 1,122 (100.0%) | $113,478 |
Family Income by Number of Earners in La Center
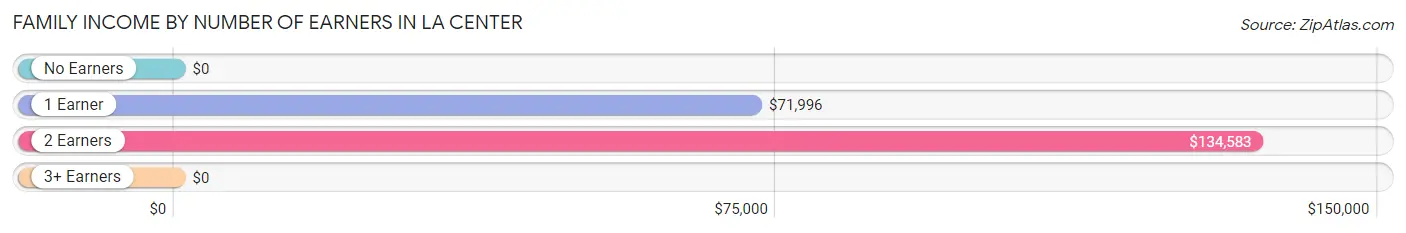
| Number of Earners | # Families | Median Income |
| No Earners | 200 (17.8%) | $0 |
| 1 Earner | 299 (26.7%) | $71,996 |
| 2 Earners | 496 (44.2%) | $134,583 |
| 3+ Earners | 127 (11.3%) | $0 |
| Total | 1,122 (100.0%) | $113,478 |
Household Income in La Center
Household Income Brackets in La Center
With 297 households falling in the category, the $100,000 to $149,999 income range is the most frequent in La Center, accounting for 24.1% of all households. In contrast, only 6 households (0.5%) fall into the less than $10,000 income bracket, making it the least populous group.
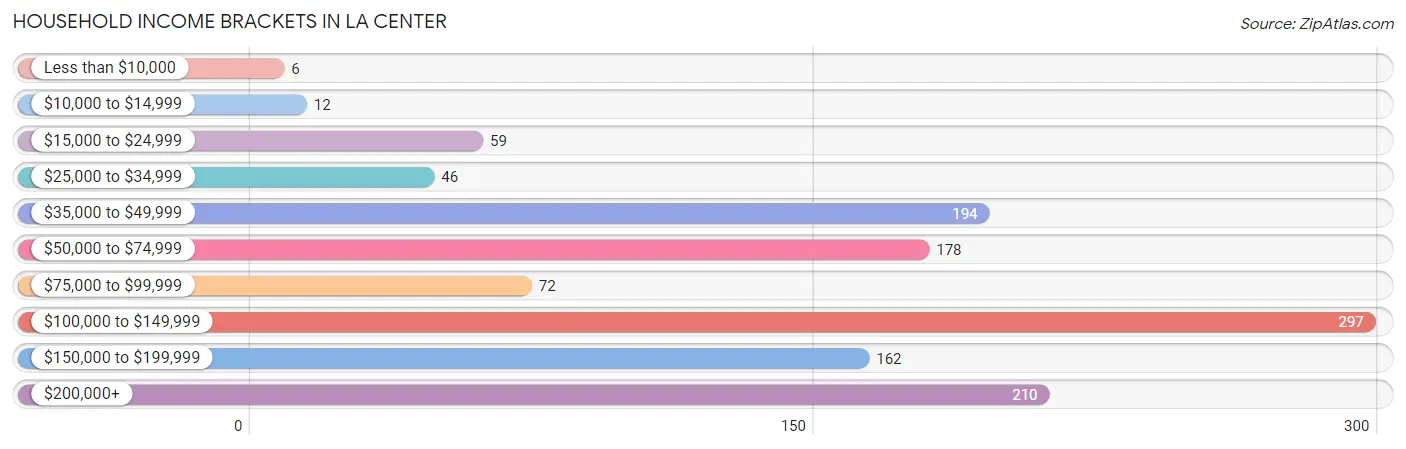
| Income Bracket | # Households | % Households |
| Less than $10,000 | 6 | 0.5% |
| $10,000 to $14,999 | 12 | 1.0% |
| $15,000 to $24,999 | 59 | 4.8% |
| $25,000 to $34,999 | 46 | 3.7% |
| $35,000 to $49,999 | 194 | 15.7% |
| $50,000 to $74,999 | 178 | 14.4% |
| $75,000 to $99,999 | 72 | 5.8% |
| $100,000 to $149,999 | 297 | 24.1% |
| $150,000 to $199,999 | 162 | 13.1% |
| $200,000+ | 210 | 17.0% |
Household Income by Householder Age in La Center
The median household income in La Center is $112,758, with the highest median household income of $139,444 found in the 45 to 64 years age bracket for the primary householder. A total of 556 households (45.1%) fall into this category. Meanwhile, the 15 to 24 years age bracket for the primary householder has the lowest median household income of $0, with 62 households (5.0%) in this group.
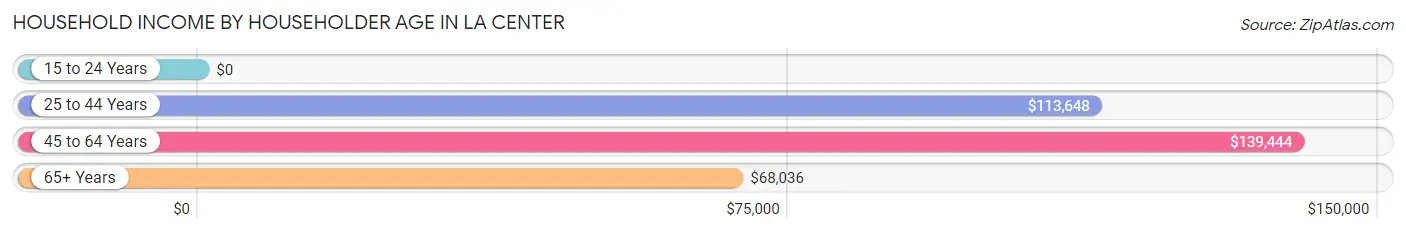
| Income Bracket | # Households | Median Income |
| 15 to 24 Years | 62 (5.0%) | $0 |
| 25 to 44 Years | 279 (22.6%) | $113,648 |
| 45 to 64 Years | 556 (45.1%) | $139,444 |
| 65+ Years | 336 (27.3%) | $68,036 |
| Total | 1,233 (100.0%) | $112,758 |
Poverty in La Center
Income Below Poverty by Sex and Age in La Center
With 1.6% poverty level for males and 4.9% for females among the residents of La Center, 5 year old males and 12 to 14 year old females are the most vulnerable to poverty, with 14 males (100.0%) and 18 females (60.0%) in their respective age groups living below the poverty level.
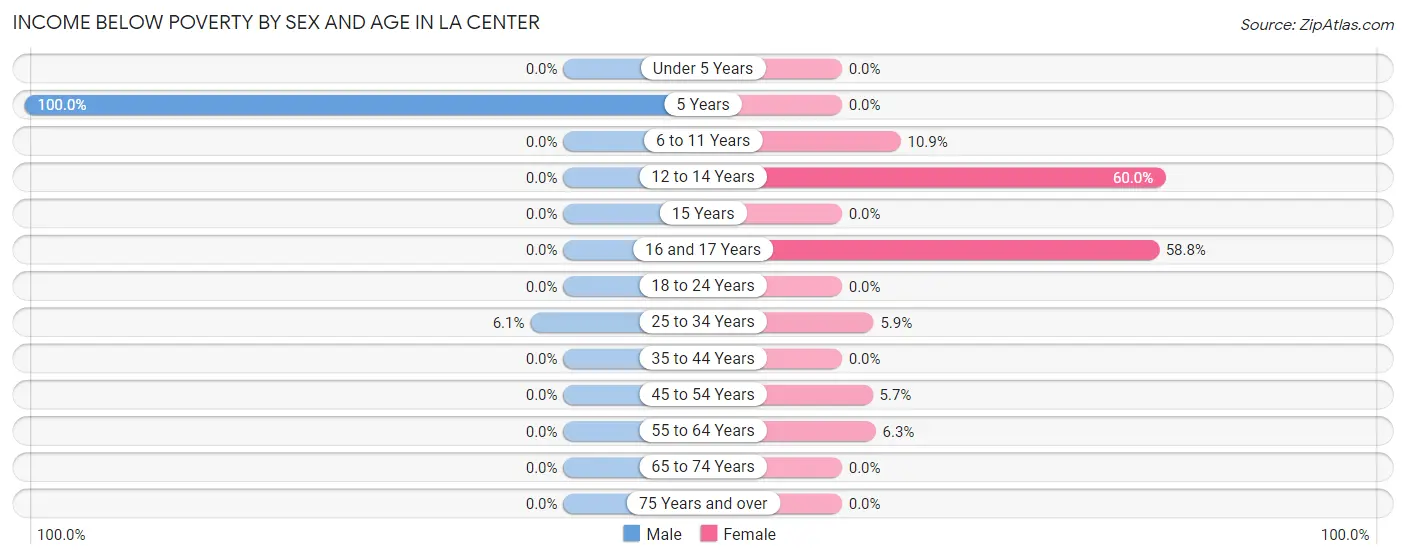
| Age Bracket | Male | Female |
| Under 5 Years | 0 (0.0%) | 0 (0.0%) |
| 5 Years | 14 (100.0%) | 0 (0.0%) |
| 6 to 11 Years | 0 (0.0%) | 12 (10.9%) |
| 12 to 14 Years | 0 (0.0%) | 18 (60.0%) |
| 15 Years | 0 (0.0%) | 0 (0.0%) |
| 16 and 17 Years | 0 (0.0%) | 20 (58.8%) |
| 18 to 24 Years | 0 (0.0%) | 0 (0.0%) |
| 25 to 34 Years | 13 (6.1%) | 12 (5.9%) |
| 35 to 44 Years | 0 (0.0%) | 0 (0.0%) |
| 45 to 54 Years | 0 (0.0%) | 20 (5.7%) |
| 55 to 64 Years | 0 (0.0%) | 13 (6.3%) |
| 65 to 74 Years | 0 (0.0%) | 0 (0.0%) |
| 75 Years and over | 0 (0.0%) | 0 (0.0%) |
| Total | 27 (1.6%) | 95 (4.9%) |
Income Above Poverty by Sex and Age in La Center
According to the poverty statistics in La Center, males aged under 5 years and females aged under 5 years are the age groups that are most secure financially, with 100.0% of males and 100.0% of females in these age groups living above the poverty line.
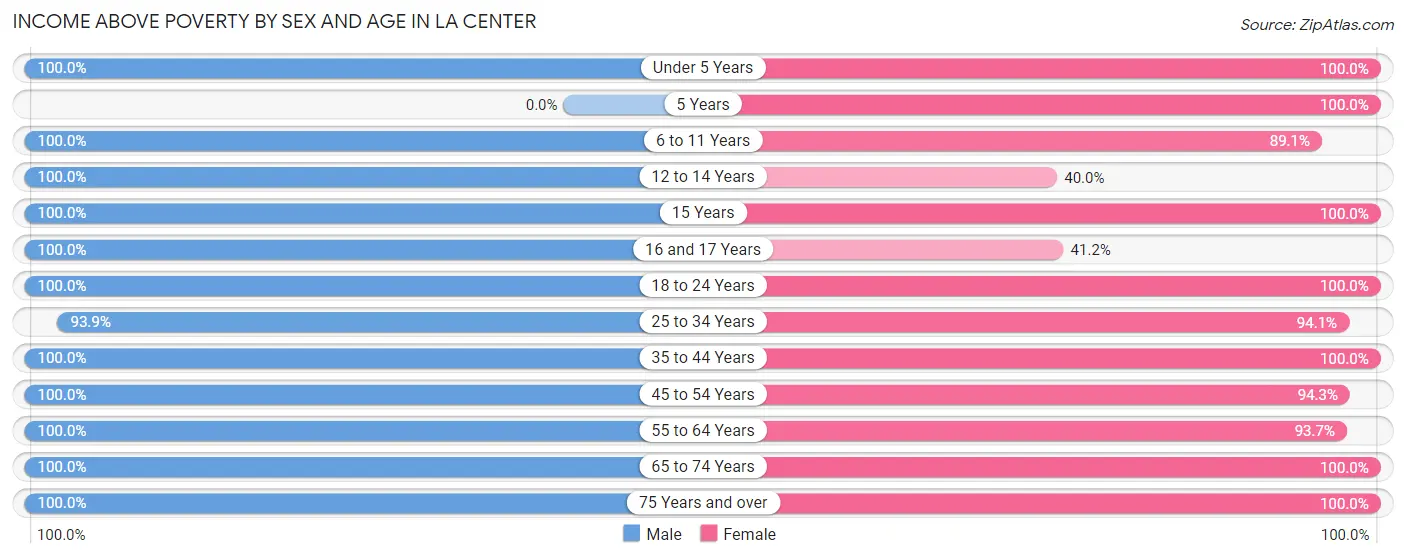
| Age Bracket | Male | Female |
| Under 5 Years | 89 (100.0%) | 102 (100.0%) |
| 5 Years | 0 (0.0%) | 4 (100.0%) |
| 6 to 11 Years | 98 (100.0%) | 98 (89.1%) |
| 12 to 14 Years | 69 (100.0%) | 12 (40.0%) |
| 15 Years | 58 (100.0%) | 88 (100.0%) |
| 16 and 17 Years | 91 (100.0%) | 14 (41.2%) |
| 18 to 24 Years | 133 (100.0%) | 336 (100.0%) |
| 25 to 34 Years | 199 (93.9%) | 192 (94.1%) |
| 35 to 44 Years | 163 (100.0%) | 164 (100.0%) |
| 45 to 54 Years | 217 (100.0%) | 330 (94.3%) |
| 55 to 64 Years | 247 (100.0%) | 194 (93.7%) |
| 65 to 74 Years | 268 (100.0%) | 192 (100.0%) |
| 75 Years and over | 69 (100.0%) | 136 (100.0%) |
| Total | 1,701 (98.4%) | 1,862 (95.2%) |
Income Below Poverty Among Married-Couple Families in La Center
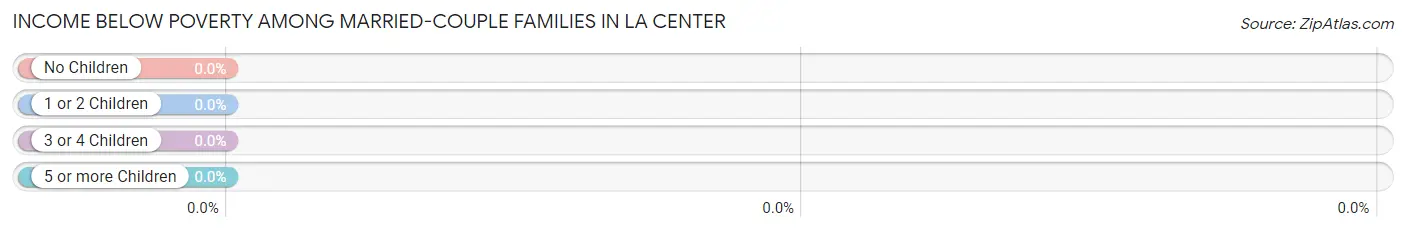
| Children | Above Poverty | Below Poverty |
| No Children | 644 (100.0%) | 0 (0.0%) |
| 1 or 2 Children | 227 (100.0%) | 0 (0.0%) |
| 3 or 4 Children | 52 (100.0%) | 0 (0.0%) |
| 5 or more Children | 0 (0.0%) | 0 (0.0%) |
| Total | 923 (100.0%) | 0 (0.0%) |
Income Below Poverty Among Single-Parent Households in La Center
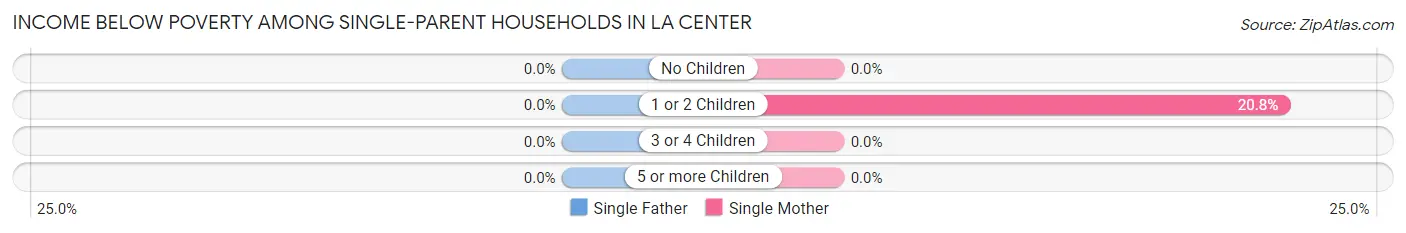
| Children | Single Father | Single Mother |
| No Children | 0 (0.0%) | 0 (0.0%) |
| 1 or 2 Children | 0 (0.0%) | 32 (20.8%) |
| 3 or 4 Children | 0 (0.0%) | 0 (0.0%) |
| 5 or more Children | 0 (0.0%) | 0 (0.0%) |
| Total | 0 (0.0%) | 32 (18.3%) |
Income Below Poverty Among Married-Couple vs Single-Parent Households in La Center
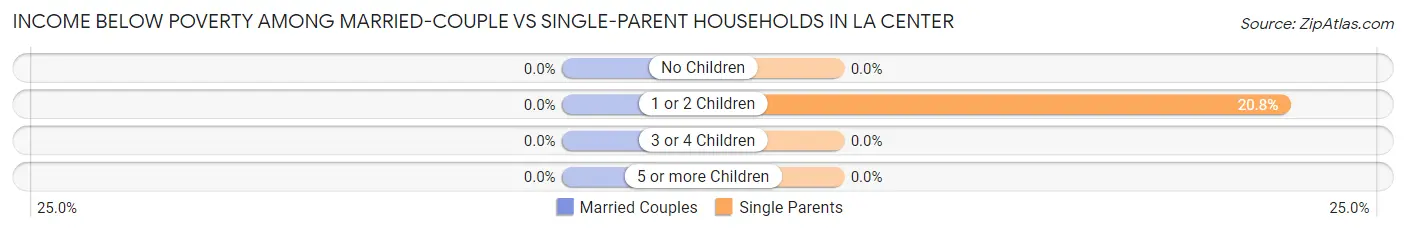
| Children | Married-Couple Families | Single-Parent Households |
| No Children | 0 (0.0%) | 0 (0.0%) |
| 1 or 2 Children | 0 (0.0%) | 32 (20.8%) |
| 3 or 4 Children | 0 (0.0%) | 0 (0.0%) |
| 5 or more Children | 0 (0.0%) | 0 (0.0%) |
| Total | 0 (0.0%) | 32 (16.1%) |
Race in La Center
The most populous races in La Center are White / Caucasian (3,052 | 82.8%), Asian (409 | 11.1%), and Hispanic or Latino (261 | 7.1%).
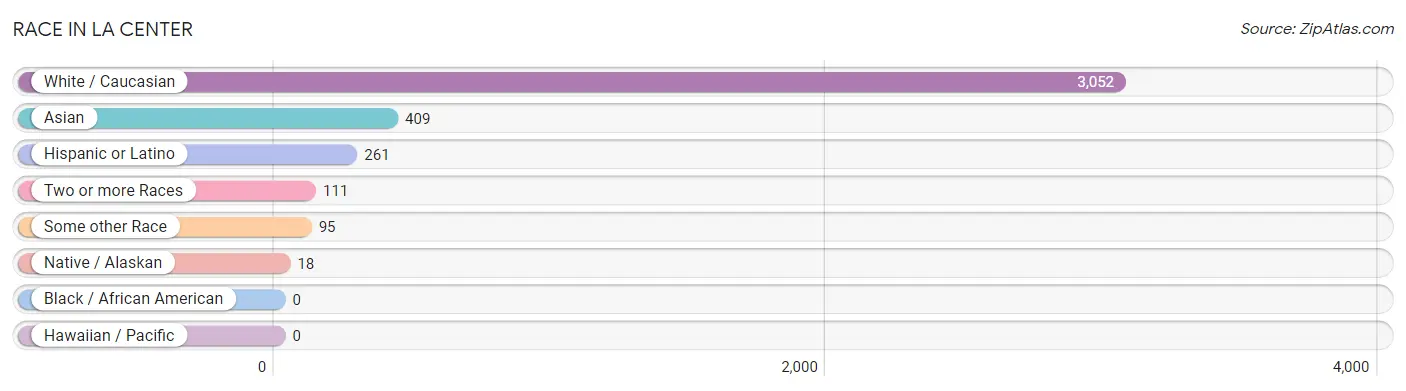
| Race | # Population | % Population |
| Asian | 409 | 11.1% |
| Black / African American | 0 | 0.0% |
| Hawaiian / Pacific | 0 | 0.0% |
| Hispanic or Latino | 261 | 7.1% |
| Native / Alaskan | 18 | 0.5% |
| White / Caucasian | 3,052 | 82.8% |
| Two or more Races | 111 | 3.0% |
| Some other Race | 95 | 2.6% |
| Total | 3,685 | 100.0% |
Ancestry in La Center
The most populous ancestries reported in La Center are German (791 | 21.5%), American (344 | 9.3%), English (292 | 7.9%), Irish (261 | 7.1%), and Bangladeshi (238 | 6.5%), together accounting for 52.3% of all La Center residents.
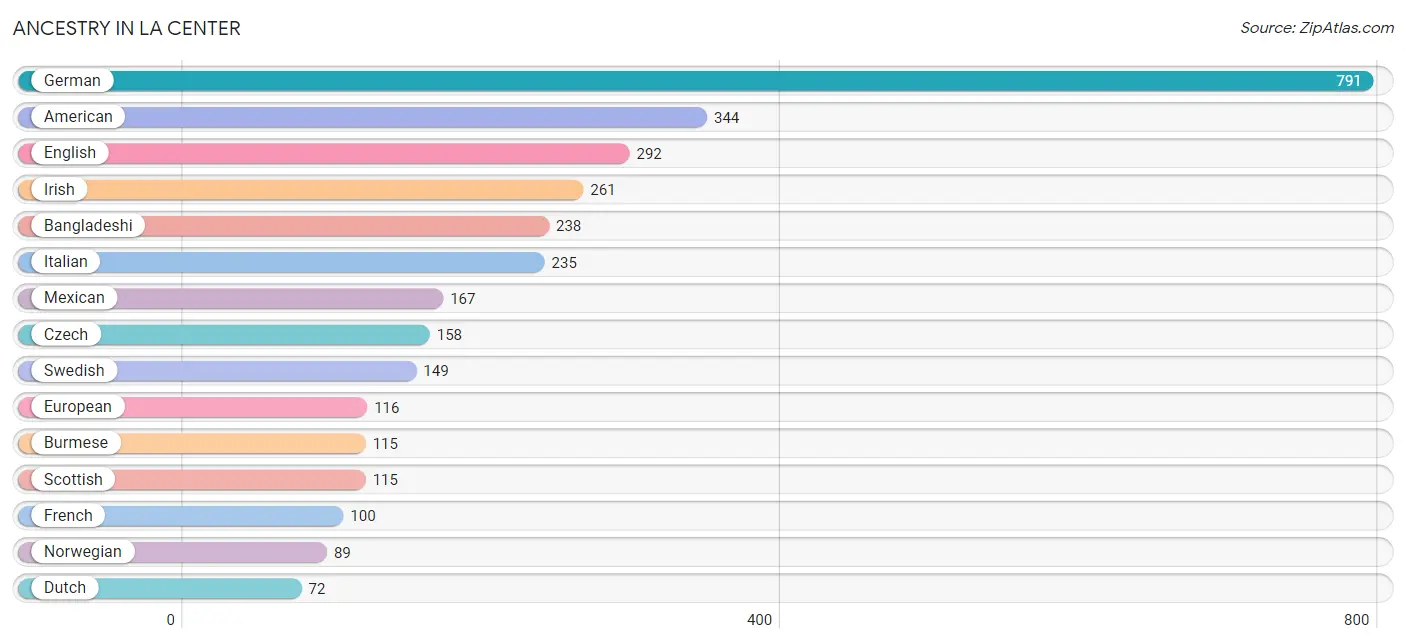
| Ancestry | # Population | % Population |
| American | 344 | 9.3% |
| Bangladeshi | 238 | 6.5% |
| Bhutanese | 68 | 1.8% |
| British | 48 | 1.3% |
| Burmese | 115 | 3.1% |
| Cheyenne | 13 | 0.4% |
| Chippewa | 5 | 0.1% |
| Choctaw | 6 | 0.2% |
| Czech | 158 | 4.3% |
| Danish | 31 | 0.8% |
| Dutch | 72 | 1.9% |
| English | 292 | 7.9% |
| European | 116 | 3.2% |
| Finnish | 23 | 0.6% |
| French | 100 | 2.7% |
| French Canadian | 23 | 0.6% |
| German | 791 | 21.5% |
| Irish | 261 | 7.1% |
| Italian | 235 | 6.4% |
| Korean | 14 | 0.4% |
| Lithuanian | 21 | 0.6% |
| Mexican | 167 | 4.5% |
| Norwegian | 89 | 2.4% |
| Pakistani | 16 | 0.4% |
| Polish | 23 | 0.6% |
| Puerto Rican | 59 | 1.6% |
| Russian | 11 | 0.3% |
| Scandinavian | 56 | 1.5% |
| Scotch-Irish | 19 | 0.5% |
| Scottish | 115 | 3.1% |
| Slavic | 4 | 0.1% |
| Swedish | 149 | 4.0% |
| Swiss | 62 | 1.7% |
| Welsh | 45 | 1.2% |
| Yugoslavian | 35 | 0.9% | View All 35 Rows |
Immigrants in La Center
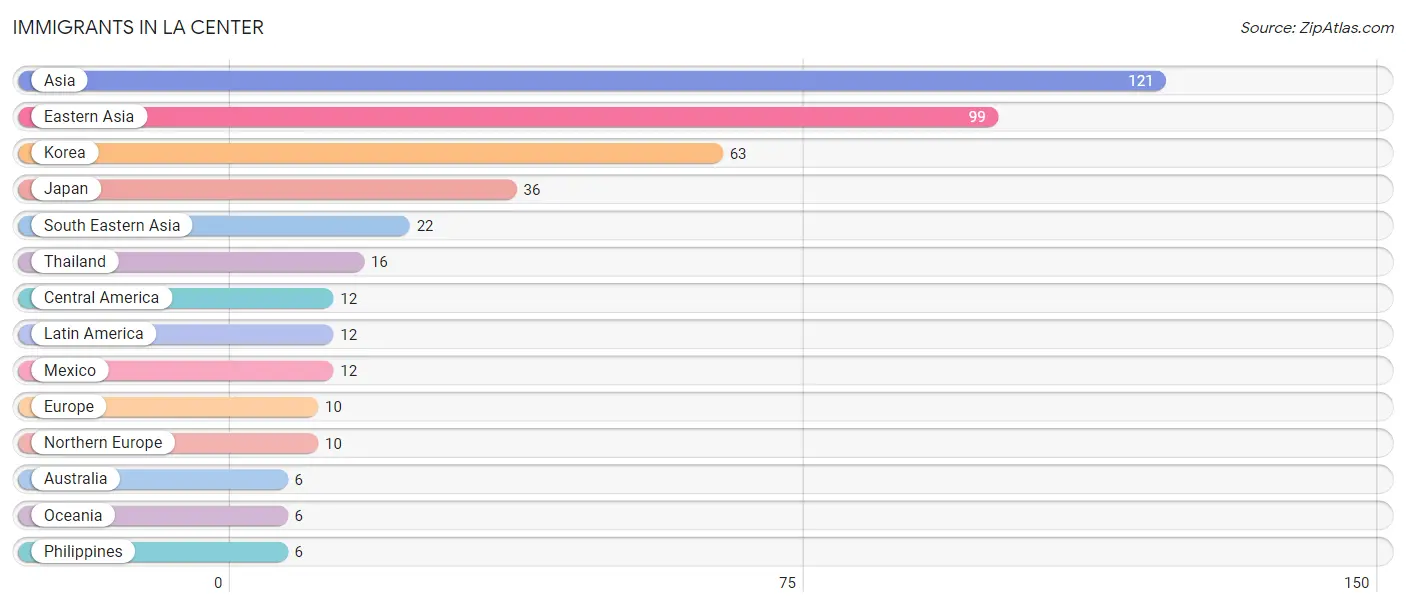
The most numerous immigrant groups reported in La Center came from Asia (121 | 3.3%), Eastern Asia (99 | 2.7%), Korea (63 | 1.7%), Japan (36 | 1.0%), and South Eastern Asia (22 | 0.6%), together accounting for 9.3% of all La Center residents.
| Immigration Origin | # Population | % Population |
| Asia | 121 | 3.3% |
| Australia | 6 | 0.2% |
| Central America | 12 | 0.3% |
| Eastern Asia | 99 | 2.7% |
| Europe | 10 | 0.3% |
| Japan | 36 | 1.0% |
| Korea | 63 | 1.7% |
| Latin America | 12 | 0.3% |
| Mexico | 12 | 0.3% |
| Northern Europe | 10 | 0.3% |
| Oceania | 6 | 0.2% |
| Philippines | 6 | 0.2% |
| South Eastern Asia | 22 | 0.6% |
| Thailand | 16 | 0.4% | View All 14 Rows |
Sex and Age in La Center
Sex and Age in La Center
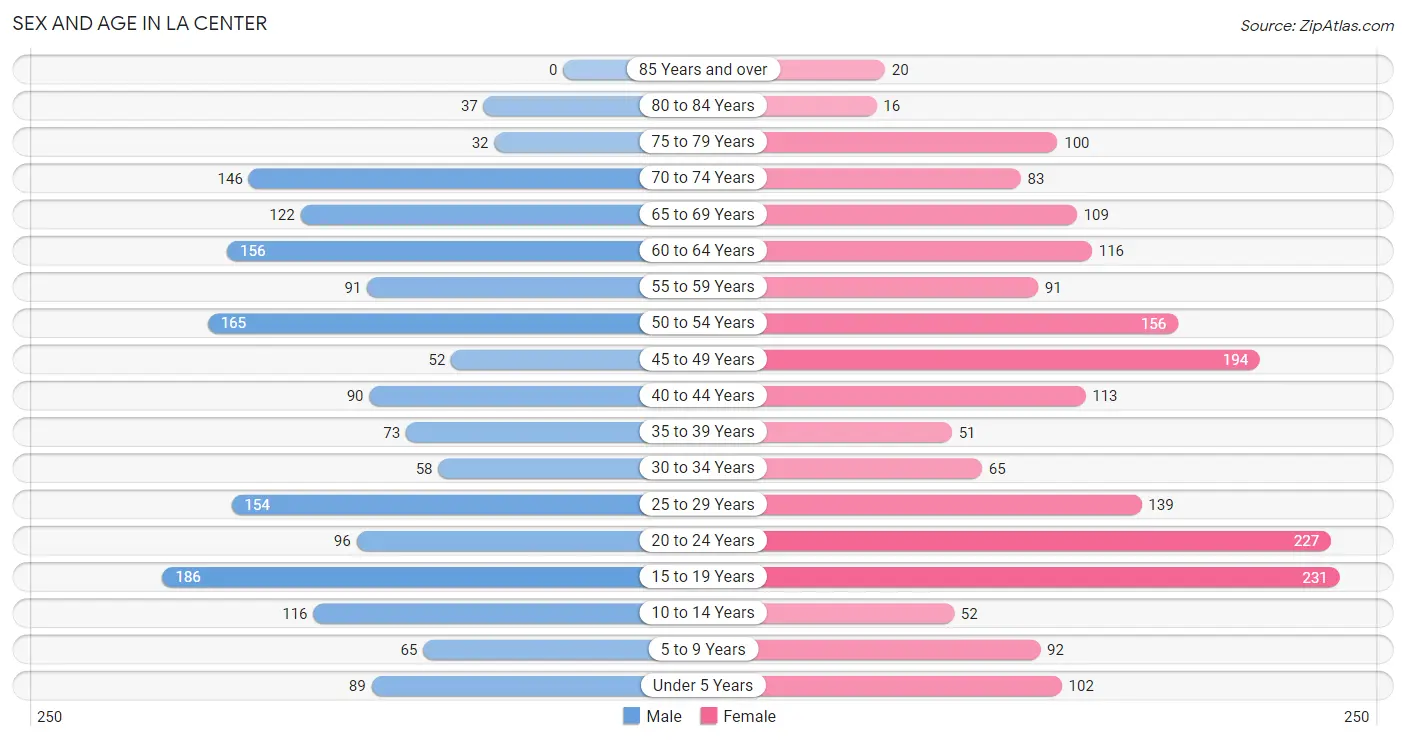
The most populous age groups in La Center are 15 to 19 Years (186 | 10.8%) for men and 15 to 19 Years (231 | 11.8%) for women.
| Age Bracket | Male | Female |
| Under 5 Years | 89 (5.1%) | 102 (5.2%) |
| 5 to 9 Years | 65 (3.8%) | 92 (4.7%) |
| 10 to 14 Years | 116 (6.7%) | 52 (2.7%) |
| 15 to 19 Years | 186 (10.8%) | 231 (11.8%) |
| 20 to 24 Years | 96 (5.6%) | 227 (11.6%) |
| 25 to 29 Years | 154 (8.9%) | 139 (7.1%) |
| 30 to 34 Years | 58 (3.4%) | 65 (3.3%) |
| 35 to 39 Years | 73 (4.2%) | 51 (2.6%) |
| 40 to 44 Years | 90 (5.2%) | 113 (5.8%) |
| 45 to 49 Years | 52 (3.0%) | 194 (9.9%) |
| 50 to 54 Years | 165 (9.6%) | 156 (8.0%) |
| 55 to 59 Years | 91 (5.3%) | 91 (4.6%) |
| 60 to 64 Years | 156 (9.0%) | 116 (5.9%) |
| 65 to 69 Years | 122 (7.1%) | 109 (5.6%) |
| 70 to 74 Years | 146 (8.5%) | 83 (4.2%) |
| 75 to 79 Years | 32 (1.8%) | 100 (5.1%) |
| 80 to 84 Years | 37 (2.1%) | 16 (0.8%) |
| 85 Years and over | 0 (0.0%) | 20 (1.0%) |
| Total | 1,728 (100.0%) | 1,957 (100.0%) |
Families and Households in La Center
Median Family Size in La Center
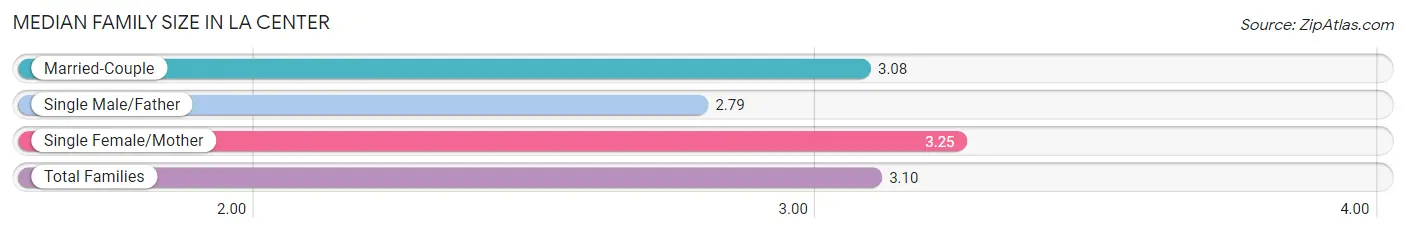
The median family size in La Center is 3.10 persons per family, with single female/mother families (175 | 15.6%) accounting for the largest median family size of 3.25 persons per family. On the other hand, single male/father families (24 | 2.1%) represent the smallest median family size with 2.79 persons per family.
| Family Type | # Families | Family Size |
| Married-Couple | 923 (82.3%) | 3.08 |
| Single Male/Father | 24 (2.1%) | 2.79 |
| Single Female/Mother | 175 (15.6%) | 3.25 |
| Total Families | 1,122 (100.0%) | 3.10 |
Median Household Size in La Center
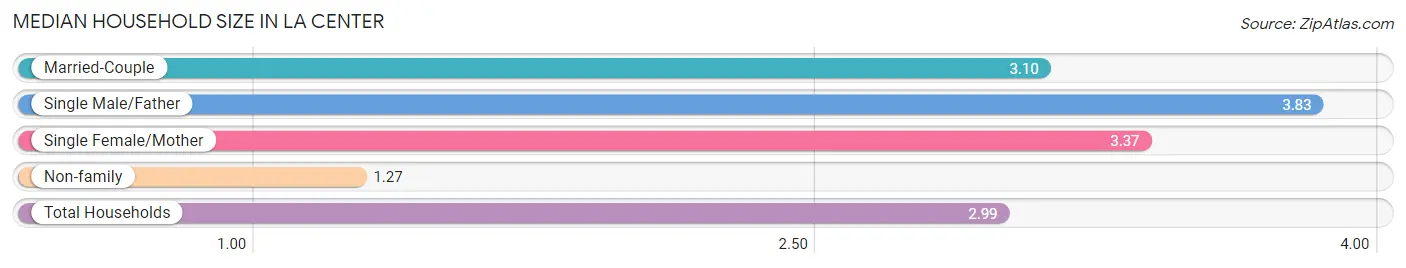
The median household size in La Center is 2.99 persons per household, with single male/father households (24 | 1.9%) accounting for the largest median household size of 3.83 persons per household. non-family households (111 | 9.0%) represent the smallest median household size with 1.27 persons per household.
| Household Type | # Households | Household Size |
| Married-Couple | 923 (74.9%) | 3.10 |
| Single Male/Father | 24 (1.9%) | 3.83 |
| Single Female/Mother | 175 (14.2%) | 3.37 |
| Non-family | 111 (9.0%) | 1.27 |
| Total Households | 1,233 (100.0%) | 2.99 |
Household Size by Marriage Status in La Center
Out of a total of 1,233 households in La Center, 1,122 (91.0%) are family households, while 111 (9.0%) are nonfamily households. The most numerous type of family households are 2-person households, comprising 430, and the most common type of nonfamily households are 1-person households, comprising 88.
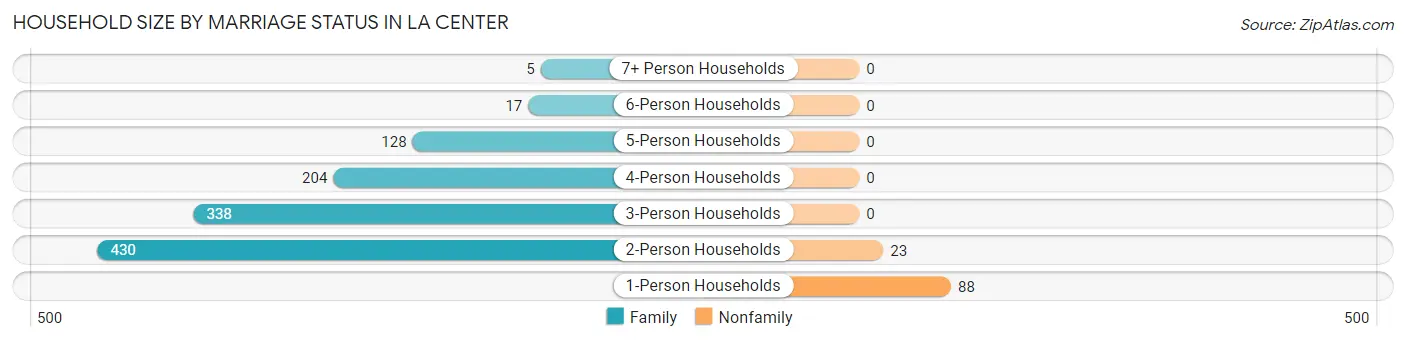
| Household Size | Family Households | Nonfamily Households |
| 1-Person Households | - | 88 (7.1%) |
| 2-Person Households | 430 (34.9%) | 23 (1.9%) |
| 3-Person Households | 338 (27.4%) | 0 (0.0%) |
| 4-Person Households | 204 (16.6%) | 0 (0.0%) |
| 5-Person Households | 128 (10.4%) | 0 (0.0%) |
| 6-Person Households | 17 (1.4%) | 0 (0.0%) |
| 7+ Person Households | 5 (0.4%) | 0 (0.0%) |
| Total | 1,122 (91.0%) | 111 (9.0%) |
Female Fertility in La Center
Fertility by Age in La Center
Average fertility rate in La Center is 82.0 births per 1,000 women. Women in the age bracket of 20 to 34 years have the highest fertility rate with 197.0 births per 1,000 women. Women in the age bracket of 20 to 34 years acount for 100.0% of all women with births.
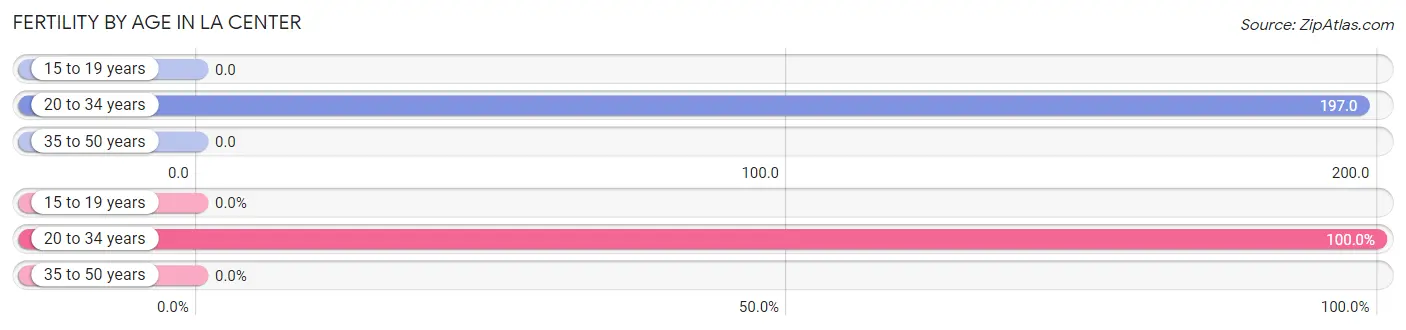
| Age Bracket | Women with Births | Births / 1,000 Women |
| 15 to 19 years | 0 (0.0%) | 0.0 |
| 20 to 34 years | 85 (100.0%) | 197.0 |
| 35 to 50 years | 0 (0.0%) | 0.0 |
| Total | 85 (100.0%) | 82.0 |
Fertility by Age by Marriage Status in La Center
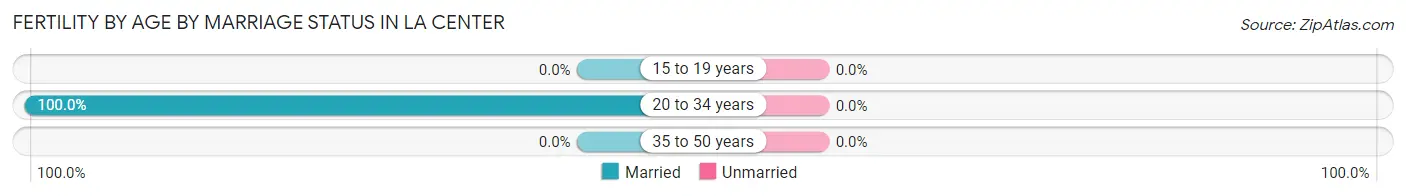
| Age Bracket | Married | Unmarried |
| 15 to 19 years | 0 (0.0%) | 0 (0.0%) |
| 20 to 34 years | 85 (100.0%) | 0 (0.0%) |
| 35 to 50 years | 0 (0.0%) | 0 (0.0%) |
| Total | 85 (100.0%) | 0 (0.0%) |
Fertility by Education in La Center
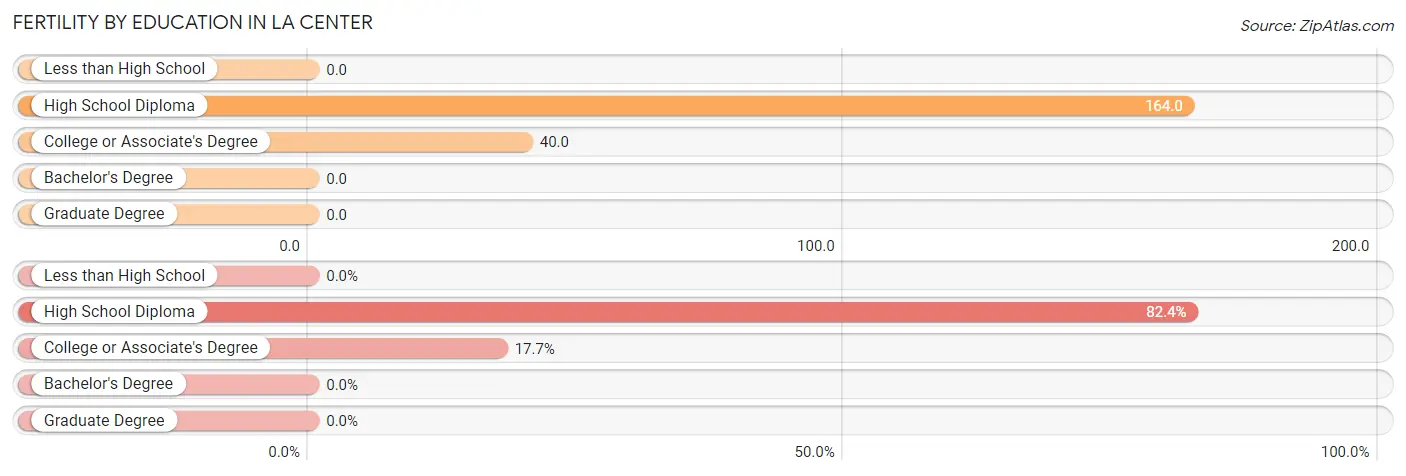
| Educational Attainment | Women with Births | Births / 1,000 Women |
| Less than High School | 0 (0.0%) | 0.0 |
| High School Diploma | 70 (82.4%) | 164.0 |
| College or Associate's Degree | 15 (17.6%) | 40.0 |
| Bachelor's Degree | 0 (0.0%) | 0.0 |
| Graduate Degree | 0 (0.0%) | 0.0 |
| Total | 85 (100.0%) | 82.0 |
Fertility by Education by Marriage Status in La Center
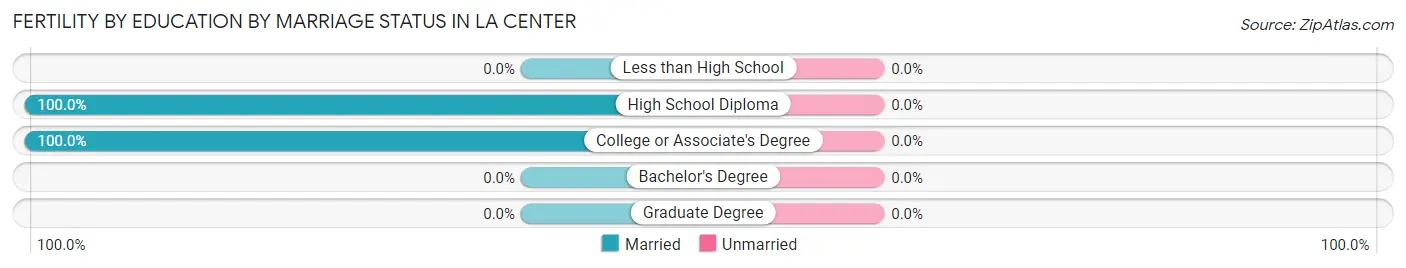
| Educational Attainment | Married | Unmarried |
| Less than High School | 0 (0.0%) | 0 (0.0%) |
| High School Diploma | 70 (100.0%) | 0 (0.0%) |
| College or Associate's Degree | 15 (100.0%) | 0 (0.0%) |
| Bachelor's Degree | 0 (0.0%) | 0 (0.0%) |
| Graduate Degree | 0 (0.0%) | 0 (0.0%) |
| Total | 85 (100.0%) | 0 (0.0%) |
Employment Characteristics in La Center
Employment by Class of Employer in La Center
Among the 1,705 employed individuals in La Center, private company employees (1,234 | 72.4%), local government employees (165 | 9.7%), and not-for-profit organizations (119 | 7.0%) make up the most common classes of employment.
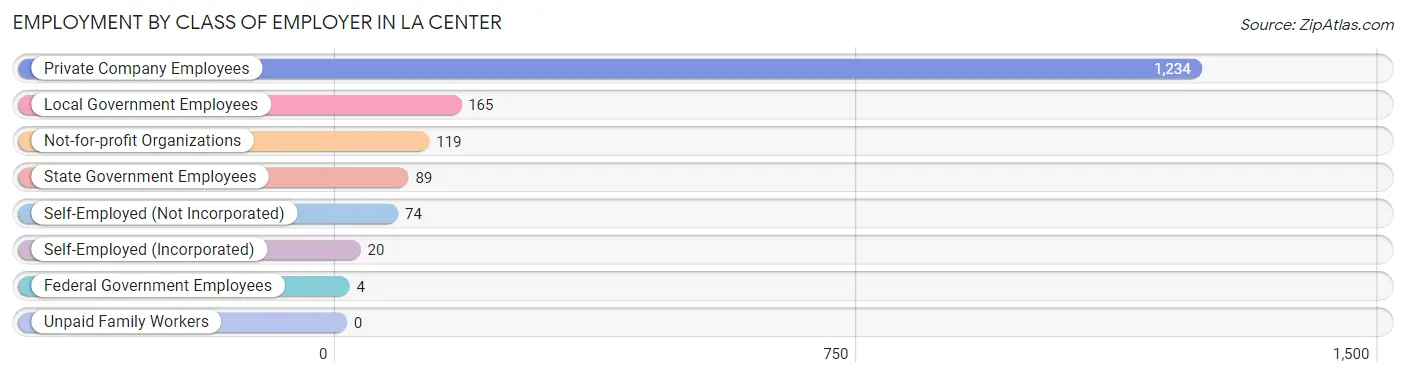
| Employer Class | # Employees | % Employees |
| Private Company Employees | 1,234 | 72.4% |
| Self-Employed (Incorporated) | 20 | 1.2% |
| Self-Employed (Not Incorporated) | 74 | 4.3% |
| Not-for-profit Organizations | 119 | 7.0% |
| Local Government Employees | 165 | 9.7% |
| State Government Employees | 89 | 5.2% |
| Federal Government Employees | 4 | 0.2% |
| Unpaid Family Workers | 0 | 0.0% |
| Total | 1,705 | 100.0% |
Employment Status by Age in La Center
According to the labor force statistics for La Center, out of the total population over 16 years of age (3,023), 60.2% or 1,820 individuals are in the labor force, with 4.2% or 76 of them unemployed. The age group with the highest labor force participation rate is 35 to 44 years, with 92.7% or 303 individuals in the labor force. Within the labor force, the 16 to 19 years age range has the highest percentage of unemployed individuals, with 15.8% or 15 of them being unemployed.
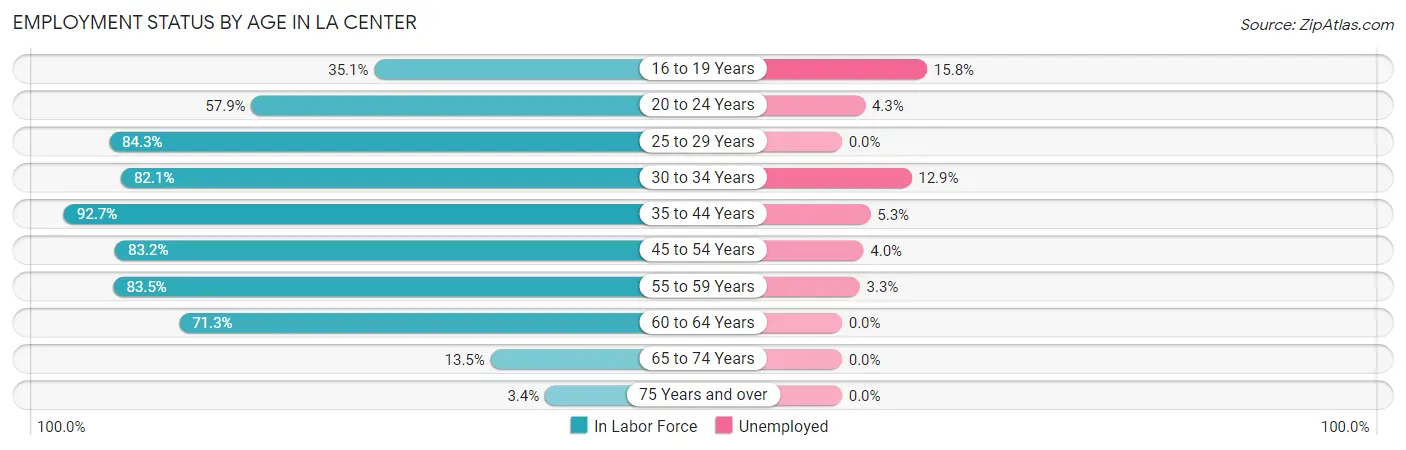
| Age Bracket | In Labor Force | Unemployed |
| 16 to 19 Years | 95 (35.1%) | 15 (15.8%) |
| 20 to 24 Years | 187 (57.9%) | 8 (4.3%) |
| 25 to 29 Years | 247 (84.3%) | 0 (0.0%) |
| 30 to 34 Years | 101 (82.1%) | 13 (12.9%) |
| 35 to 44 Years | 303 (92.7%) | 16 (5.3%) |
| 45 to 54 Years | 472 (83.2%) | 19 (4.0%) |
| 55 to 59 Years | 152 (83.5%) | 5 (3.3%) |
| 60 to 64 Years | 194 (71.3%) | 0 (0.0%) |
| 65 to 74 Years | 62 (13.5%) | 0 (0.0%) |
| 75 Years and over | 7 (3.4%) | 0 (0.0%) |
| Total | 1,820 (60.2%) | 76 (4.2%) |
Employment Status by Educational Attainment in La Center
According to labor force statistics for La Center, 83.3% of individuals (1,469) out of the total population between 25 and 64 years of age (1,764) are in the labor force, with 3.6% or 53 of them being unemployed. The group with the highest labor force participation rate are those with the educational attainment of bachelor's degree or higher, with 92.7% or 382 individuals in the labor force. Within the labor force, individuals with less than high school education have the highest percentage of unemployment, with 66.7% or 38 of them being unemployed.
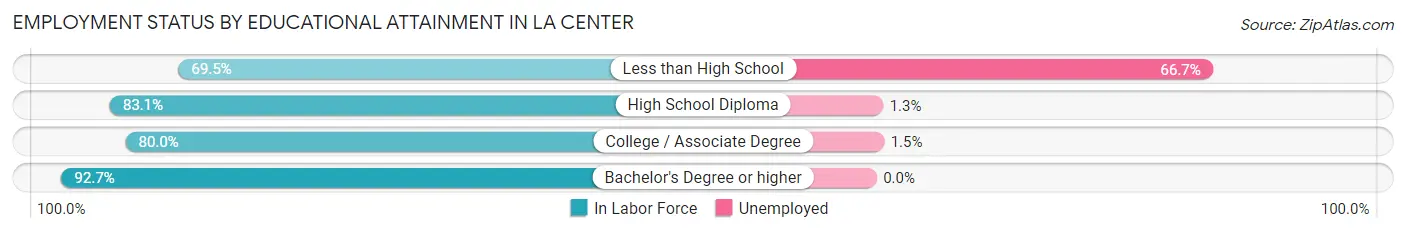
| Educational Attainment | In Labor Force | Unemployed |
| Less than High School | 57 (69.5%) | 55 (66.7%) |
| High School Diploma | 383 (83.1%) | 6 (1.3%) |
| College / Associate Degree | 647 (80.0%) | 12 (1.5%) |
| Bachelor's Degree or higher | 382 (92.7%) | 0 (0.0%) |
| Total | 1,469 (83.3%) | 64 (3.6%) |
Employment Occupations by Sex in La Center
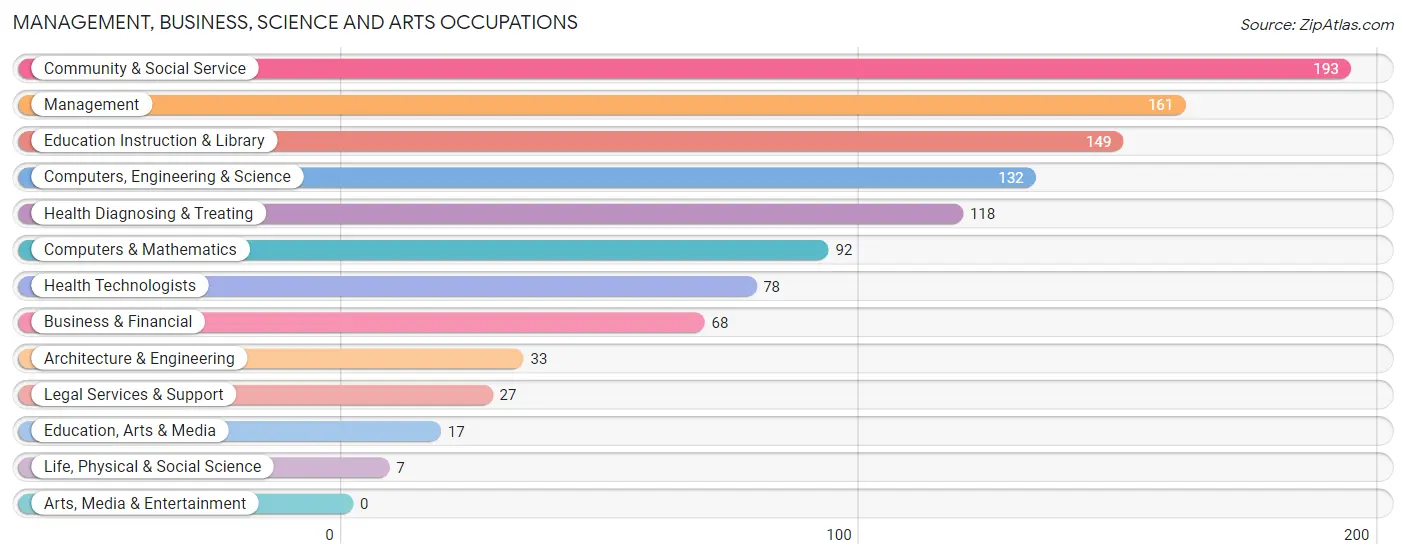
Management, Business, Science and Arts Occupations
The most common Management, Business, Science and Arts occupations in La Center are Community & Social Service (193 | 11.1%), Management (161 | 9.2%), Education Instruction & Library (149 | 8.5%), Computers, Engineering & Science (132 | 7.6%), and Health Diagnosing & Treating (118 | 6.8%).
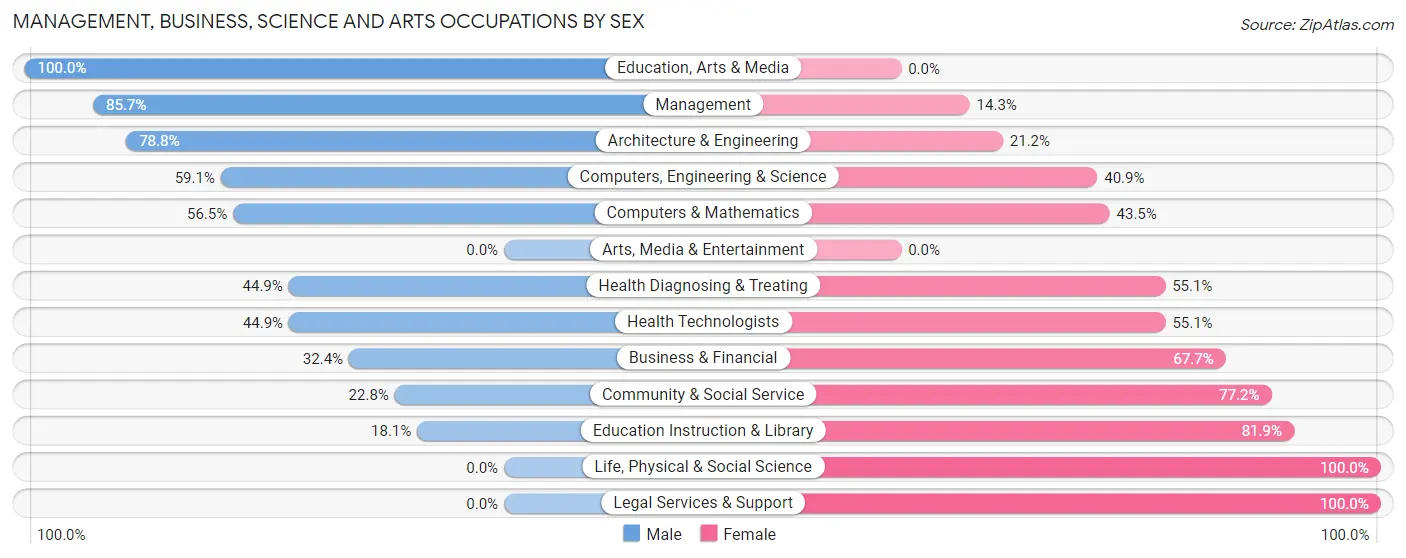
Management, Business, Science and Arts Occupations by Sex
Within the Management, Business, Science and Arts occupations in La Center, the most male-oriented occupations are Education, Arts & Media (100.0%), Management (85.7%), and Architecture & Engineering (78.8%), while the most female-oriented occupations are Life, Physical & Social Science (100.0%), Legal Services & Support (100.0%), and Education Instruction & Library (81.9%).
| Occupation | Male | Female |
| Management | 138 (85.7%) | 23 (14.3%) |
| Business & Financial | 22 (32.4%) | 46 (67.6%) |
| Computers, Engineering & Science | 78 (59.1%) | 54 (40.9%) |
| Computers & Mathematics | 52 (56.5%) | 40 (43.5%) |
| Architecture & Engineering | 26 (78.8%) | 7 (21.2%) |
| Life, Physical & Social Science | 0 (0.0%) | 7 (100.0%) |
| Community & Social Service | 44 (22.8%) | 149 (77.2%) |
| Education, Arts & Media | 17 (100.0%) | 0 (0.0%) |
| Legal Services & Support | 0 (0.0%) | 27 (100.0%) |
| Education Instruction & Library | 27 (18.1%) | 122 (81.9%) |
| Arts, Media & Entertainment | 0 (0.0%) | 0 (0.0%) |
| Health Diagnosing & Treating | 53 (44.9%) | 65 (55.1%) |
| Health Technologists | 35 (44.9%) | 43 (55.1%) |
| Total (Category) | 335 (49.8%) | 337 (50.1%) |
| Total (Overall) | 869 (49.8%) | 875 (50.2%) |
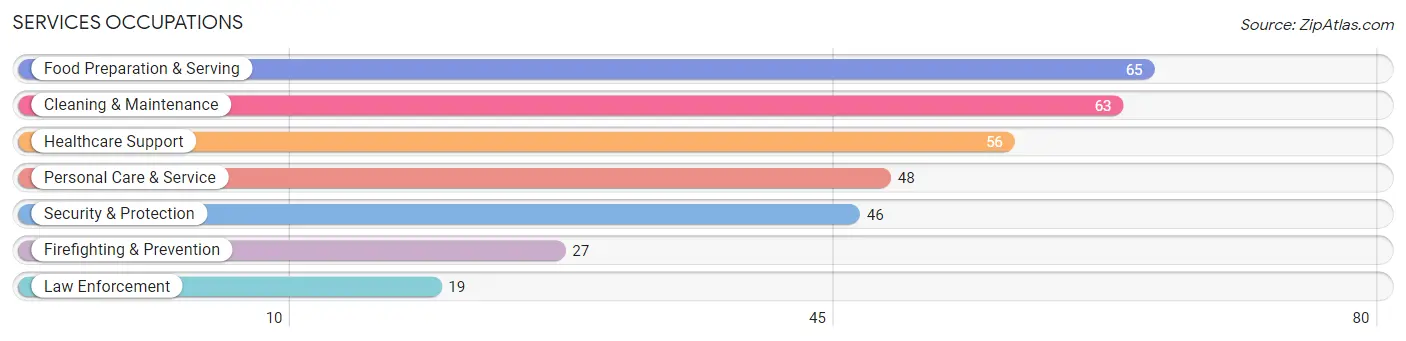
Services Occupations
The most common Services occupations in La Center are Food Preparation & Serving (65 | 3.7%), Cleaning & Maintenance (63 | 3.6%), Healthcare Support (56 | 3.2%), Personal Care & Service (48 | 2.8%), and Security & Protection (46 | 2.6%).
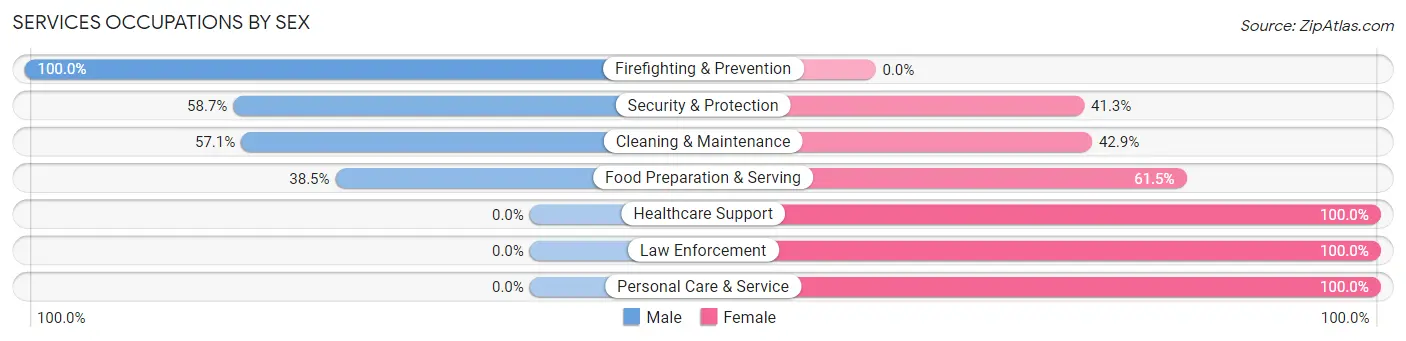
Services Occupations by Sex
Within the Services occupations in La Center, the most male-oriented occupations are Firefighting & Prevention (100.0%), Security & Protection (58.7%), and Cleaning & Maintenance (57.1%), while the most female-oriented occupations are Healthcare Support (100.0%), Law Enforcement (100.0%), and Personal Care & Service (100.0%).
| Occupation | Male | Female |
| Healthcare Support | 0 (0.0%) | 56 (100.0%) |
| Security & Protection | 27 (58.7%) | 19 (41.3%) |
| Firefighting & Prevention | 27 (100.0%) | 0 (0.0%) |
| Law Enforcement | 0 (0.0%) | 19 (100.0%) |
| Food Preparation & Serving | 25 (38.5%) | 40 (61.5%) |
| Cleaning & Maintenance | 36 (57.1%) | 27 (42.9%) |
| Personal Care & Service | 0 (0.0%) | 48 (100.0%) |
| Total (Category) | 88 (31.7%) | 190 (68.3%) |
| Total (Overall) | 869 (49.8%) | 875 (50.2%) |
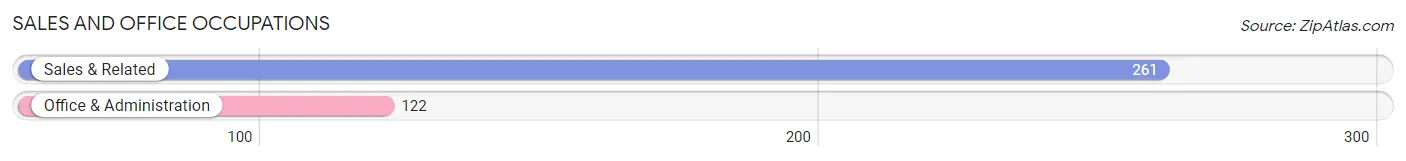
Sales and Office Occupations
The most common Sales and Office occupations in La Center are Sales & Related (261 | 15.0%), and Office & Administration (122 | 7.0%).
Sales and Office Occupations by Sex
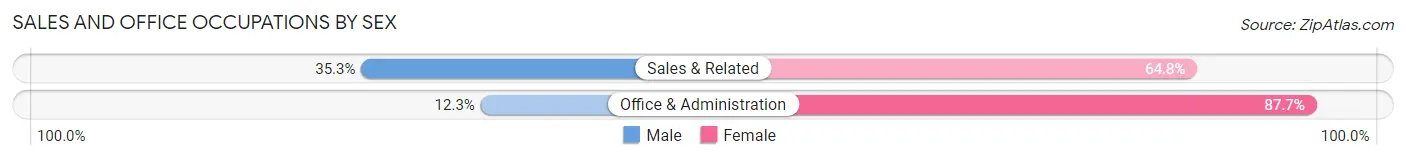
| Occupation | Male | Female |
| Sales & Related | 92 (35.2%) | 169 (64.7%) |
| Office & Administration | 15 (12.3%) | 107 (87.7%) |
| Total (Category) | 107 (27.9%) | 276 (72.1%) |
| Total (Overall) | 869 (49.8%) | 875 (50.2%) |
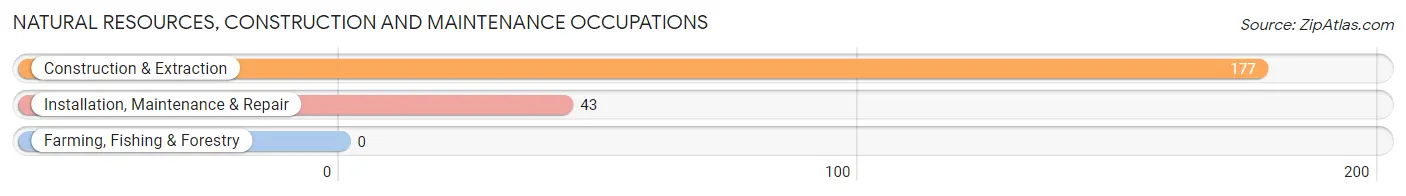
Natural Resources, Construction and Maintenance Occupations
The most common Natural Resources, Construction and Maintenance occupations in La Center are Construction & Extraction (177 | 10.2%), and Installation, Maintenance & Repair (43 | 2.5%).
Natural Resources, Construction and Maintenance Occupations by Sex
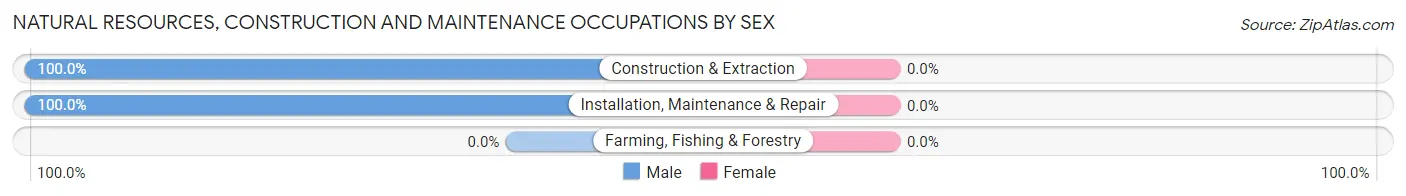
| Occupation | Male | Female |
| Farming, Fishing & Forestry | 0 (0.0%) | 0 (0.0%) |
| Construction & Extraction | 177 (100.0%) | 0 (0.0%) |
| Installation, Maintenance & Repair | 43 (100.0%) | 0 (0.0%) |
| Total (Category) | 220 (100.0%) | 0 (0.0%) |
| Total (Overall) | 869 (49.8%) | 875 (50.2%) |
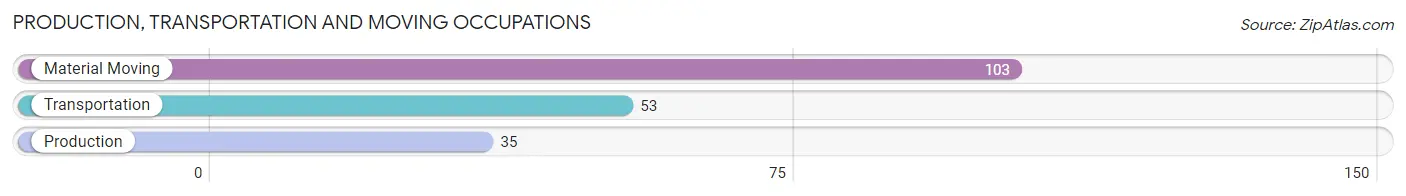
Production, Transportation and Moving Occupations
The most common Production, Transportation and Moving occupations in La Center are Material Moving (103 | 5.9%), Transportation (53 | 3.0%), and Production (35 | 2.0%).
Production, Transportation and Moving Occupations by Sex
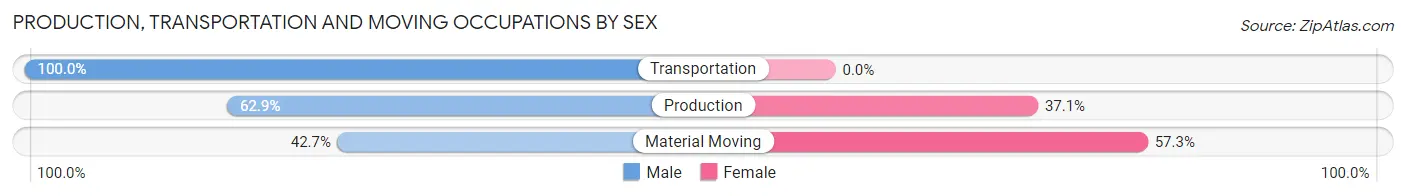
| Occupation | Male | Female |
| Production | 22 (62.9%) | 13 (37.1%) |
| Transportation | 53 (100.0%) | 0 (0.0%) |
| Material Moving | 44 (42.7%) | 59 (57.3%) |
| Total (Category) | 119 (62.3%) | 72 (37.7%) |
| Total (Overall) | 869 (49.8%) | 875 (50.2%) |
Employment Industries by Sex in La Center
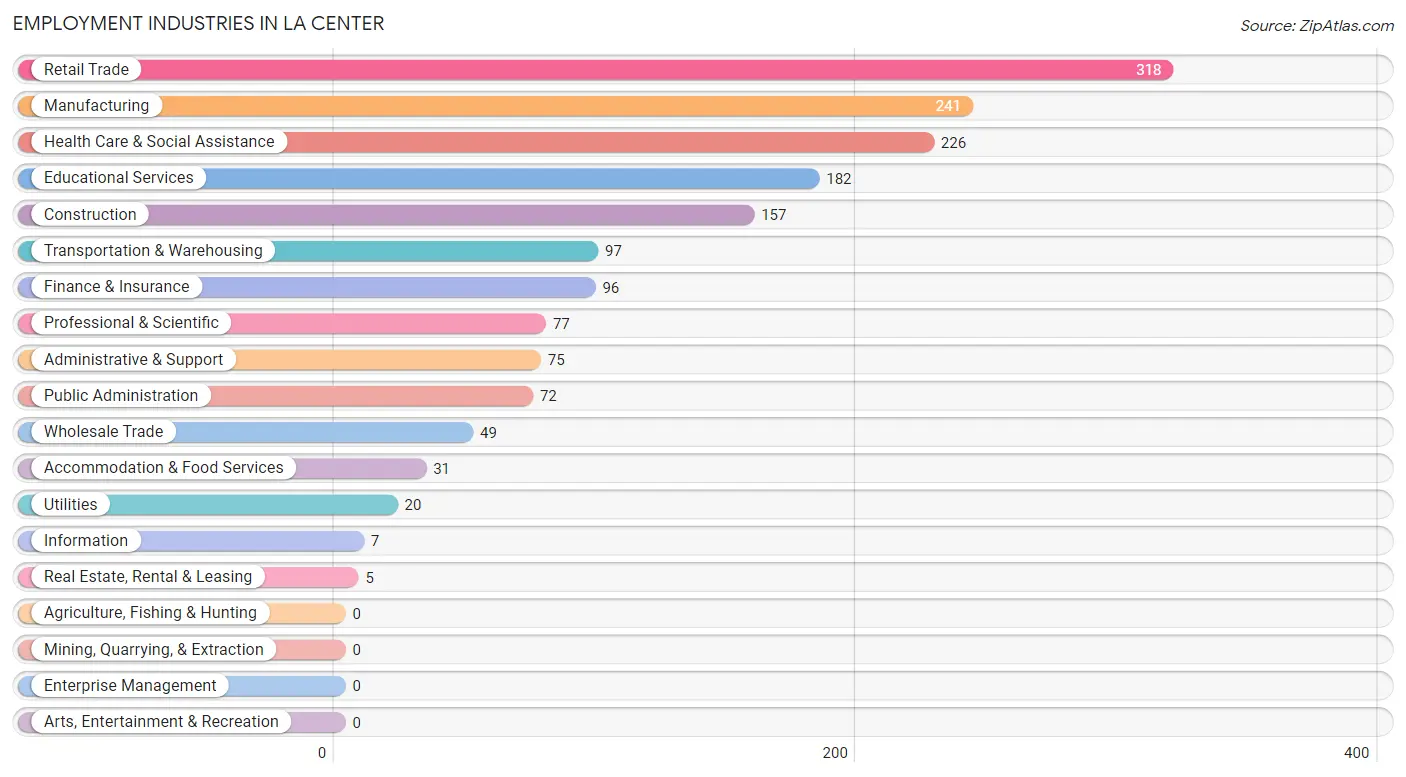
Employment Industries in La Center
The major employment industries in La Center include Retail Trade (318 | 18.2%), Manufacturing (241 | 13.8%), Health Care & Social Assistance (226 | 13.0%), Educational Services (182 | 10.4%), and Construction (157 | 9.0%).
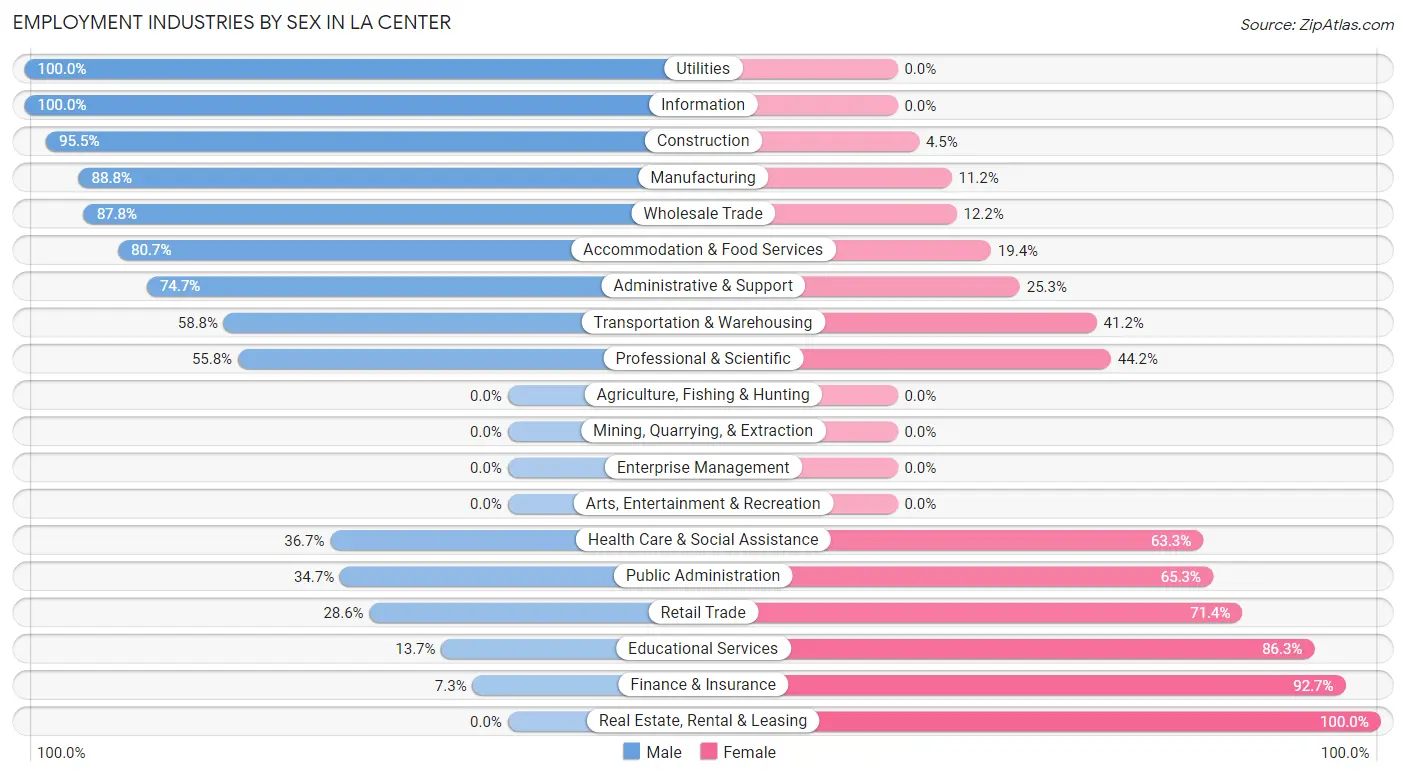
Employment Industries by Sex in La Center
The La Center industries that see more men than women are Utilities (100.0%), Information (100.0%), and Construction (95.5%), whereas the industries that tend to have a higher number of women are Real Estate, Rental & Leasing (100.0%), Finance & Insurance (92.7%), and Educational Services (86.3%).
| Industry | Male | Female |
| Agriculture, Fishing & Hunting | 0 (0.0%) | 0 (0.0%) |
| Mining, Quarrying, & Extraction | 0 (0.0%) | 0 (0.0%) |
| Construction | 150 (95.5%) | 7 (4.5%) |
| Manufacturing | 214 (88.8%) | 27 (11.2%) |
| Wholesale Trade | 43 (87.8%) | 6 (12.2%) |
| Retail Trade | 91 (28.6%) | 227 (71.4%) |
| Transportation & Warehousing | 57 (58.8%) | 40 (41.2%) |
| Utilities | 20 (100.0%) | 0 (0.0%) |
| Information | 7 (100.0%) | 0 (0.0%) |
| Finance & Insurance | 7 (7.3%) | 89 (92.7%) |
| Real Estate, Rental & Leasing | 0 (0.0%) | 5 (100.0%) |
| Professional & Scientific | 43 (55.8%) | 34 (44.2%) |
| Enterprise Management | 0 (0.0%) | 0 (0.0%) |
| Administrative & Support | 56 (74.7%) | 19 (25.3%) |
| Educational Services | 25 (13.7%) | 157 (86.3%) |
| Health Care & Social Assistance | 83 (36.7%) | 143 (63.3%) |
| Arts, Entertainment & Recreation | 0 (0.0%) | 0 (0.0%) |
| Accommodation & Food Services | 25 (80.6%) | 6 (19.4%) |
| Public Administration | 25 (34.7%) | 47 (65.3%) |
| Total | 869 (49.8%) | 875 (50.2%) |
Education in La Center
School Enrollment in La Center
The most common levels of schooling among the 826 students in La Center are college / undergraduate (260 | 31.5%), high school (250 | 30.3%), and elementary school (134 | 16.2%).
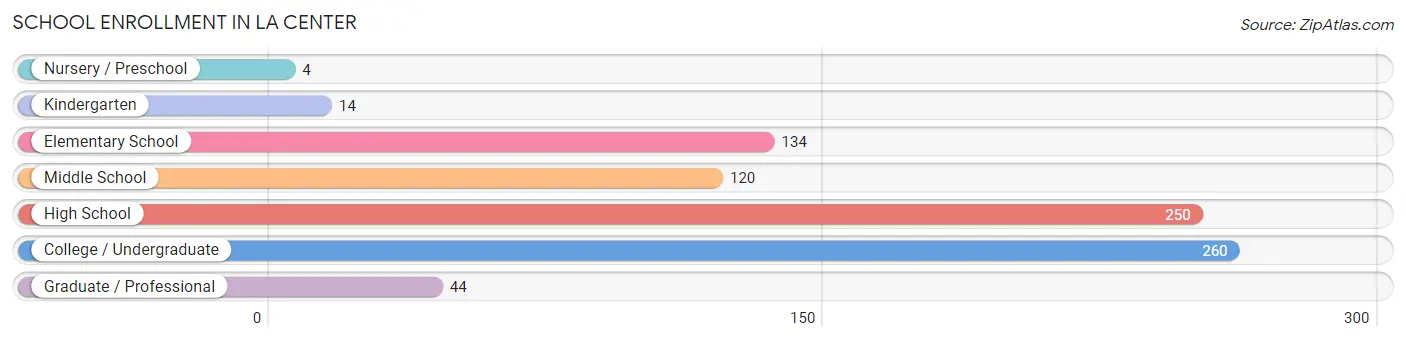
| School Level | # Students | % Students |
| Nursery / Preschool | 4 | 0.5% |
| Kindergarten | 14 | 1.7% |
| Elementary School | 134 | 16.2% |
| Middle School | 120 | 14.5% |
| High School | 250 | 30.3% |
| College / Undergraduate | 260 | 31.5% |
| Graduate / Professional | 44 | 5.3% |
| Total | 826 | 100.0% |
School Enrollment by Age by Funding Source in La Center
Out of a total of 826 students who are enrolled in schools in La Center, 92 (11.1%) attend a private institution, while the remaining 734 (88.9%) are enrolled in public schools. The age group of 18 to 19 year olds has the highest likelihood of being enrolled in private schools, with 58 (43.9% in the age bracket) enrolled. Conversely, the age group of 15 to 17 year olds has the lowest likelihood of being enrolled in a private school, with 188 (100.0% in the age bracket) attending a public institution.
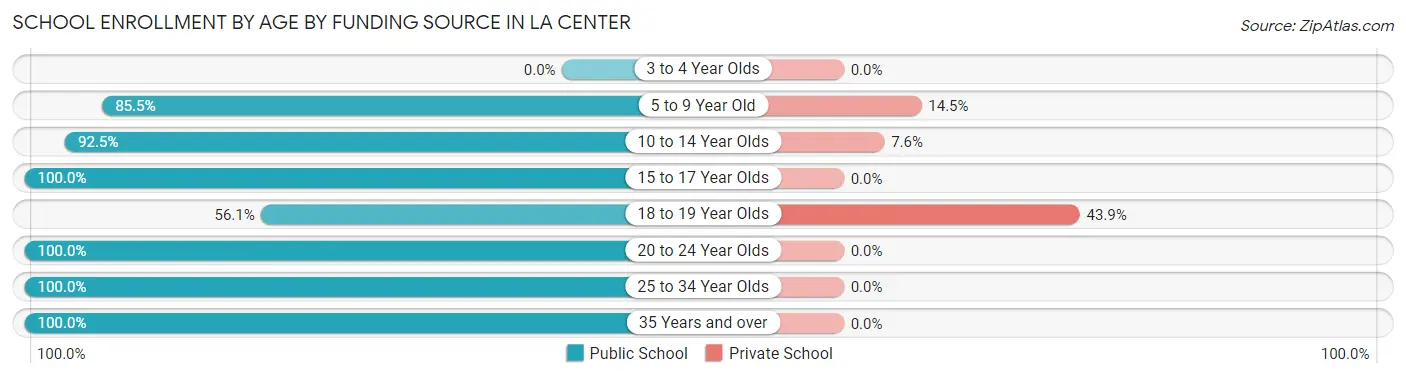
| Age Bracket | Public School | Private School |
| 3 to 4 Year Olds | 0 (0.0%) | 0 (0.0%) |
| 5 to 9 Year Old | 130 (85.5%) | 22 (14.5%) |
| 10 to 14 Year Olds | 147 (92.4%) | 12 (7.5%) |
| 15 to 17 Year Olds | 188 (100.0%) | 0 (0.0%) |
| 18 to 19 Year Olds | 74 (56.1%) | 58 (43.9%) |
| 20 to 24 Year Olds | 123 (100.0%) | 0 (0.0%) |
| 25 to 34 Year Olds | 25 (100.0%) | 0 (0.0%) |
| 35 Years and over | 47 (100.0%) | 0 (0.0%) |
| Total | 734 (88.9%) | 92 (11.1%) |
Educational Attainment by Field of Study in La Center
Education (115 | 18.6%), bio, nature & agricultural (75 | 12.2%), engineering (69 | 11.2%), science & technology (55 | 8.9%), and business (55 | 8.9%) are the most common fields of study among 617 individuals in La Center who have obtained a bachelor's degree or higher.
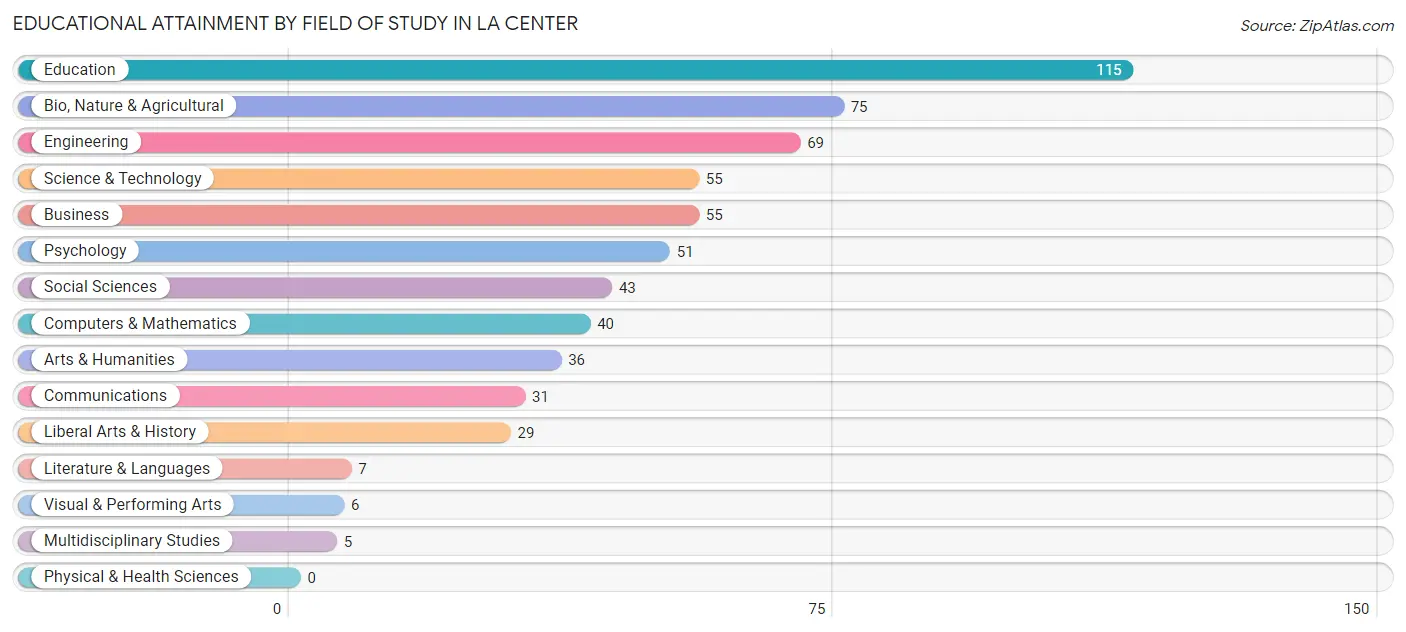
| Field of Study | # Graduates | % Graduates |
| Computers & Mathematics | 40 | 6.5% |
| Bio, Nature & Agricultural | 75 | 12.2% |
| Physical & Health Sciences | 0 | 0.0% |
| Psychology | 51 | 8.3% |
| Social Sciences | 43 | 7.0% |
| Engineering | 69 | 11.2% |
| Multidisciplinary Studies | 5 | 0.8% |
| Science & Technology | 55 | 8.9% |
| Business | 55 | 8.9% |
| Education | 115 | 18.6% |
| Literature & Languages | 7 | 1.1% |
| Liberal Arts & History | 29 | 4.7% |
| Visual & Performing Arts | 6 | 1.0% |
| Communications | 31 | 5.0% |
| Arts & Humanities | 36 | 5.8% |
| Total | 617 | 100.0% |
Transportation & Commute in La Center
Vehicle Availability by Sex in La Center
The most prevalent vehicle ownership categories in La Center are males with 2 vehicles (343, accounting for 39.8%) and females with 2 vehicles (297, making up 40.7%).
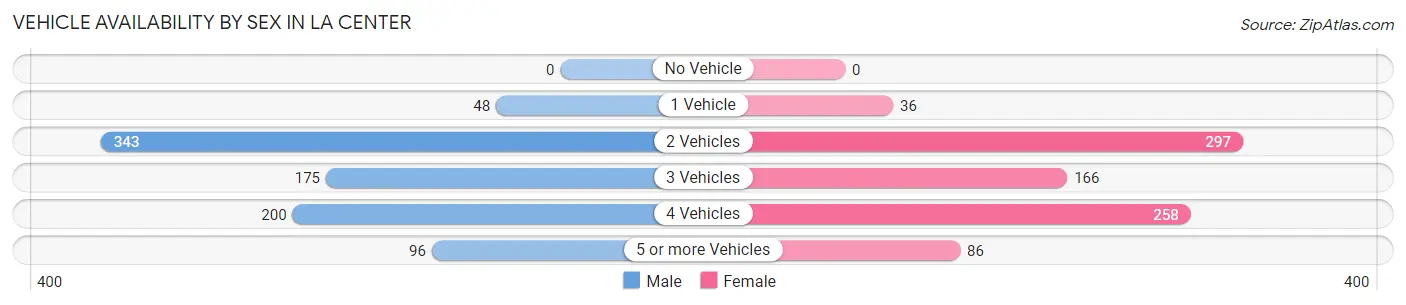
| Vehicles Available | Male | Female |
| No Vehicle | 0 (0.0%) | 0 (0.0%) |
| 1 Vehicle | 48 (5.6%) | 36 (4.3%) |
| 2 Vehicles | 343 (39.8%) | 297 (35.2%) |
| 3 Vehicles | 175 (20.3%) | 166 (19.7%) |
| 4 Vehicles | 200 (23.2%) | 258 (30.6%) |
| 5 or more Vehicles | 96 (11.1%) | 86 (10.2%) |
| Total | 862 (100.0%) | 843 (100.0%) |
Commute Time in La Center
The most frequently occuring commute durations in La Center are 15 to 19 minutes (244 commuters, 16.9%), 45 to 59 minutes (221 commuters, 15.3%), and 10 to 14 minutes (166 commuters, 11.5%).
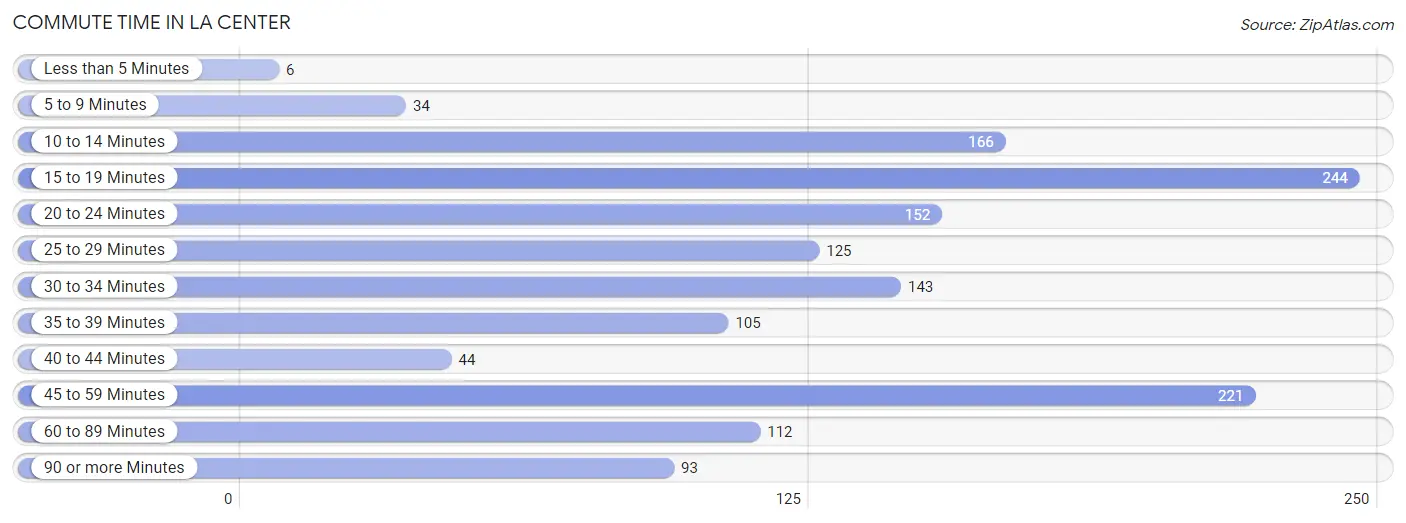
| Commute Time | # Commuters | % Commuters |
| Less than 5 Minutes | 6 | 0.4% |
| 5 to 9 Minutes | 34 | 2.4% |
| 10 to 14 Minutes | 166 | 11.5% |
| 15 to 19 Minutes | 244 | 16.9% |
| 20 to 24 Minutes | 152 | 10.5% |
| 25 to 29 Minutes | 125 | 8.6% |
| 30 to 34 Minutes | 143 | 9.9% |
| 35 to 39 Minutes | 105 | 7.3% |
| 40 to 44 Minutes | 44 | 3.0% |
| 45 to 59 Minutes | 221 | 15.3% |
| 60 to 89 Minutes | 112 | 7.7% |
| 90 or more Minutes | 93 | 6.4% |
Commute Time by Sex in La Center
The most common commute times in La Center are 45 to 59 minutes (180 commuters, 25.9%) for males and 15 to 19 minutes (162 commuters, 21.6%) for females.
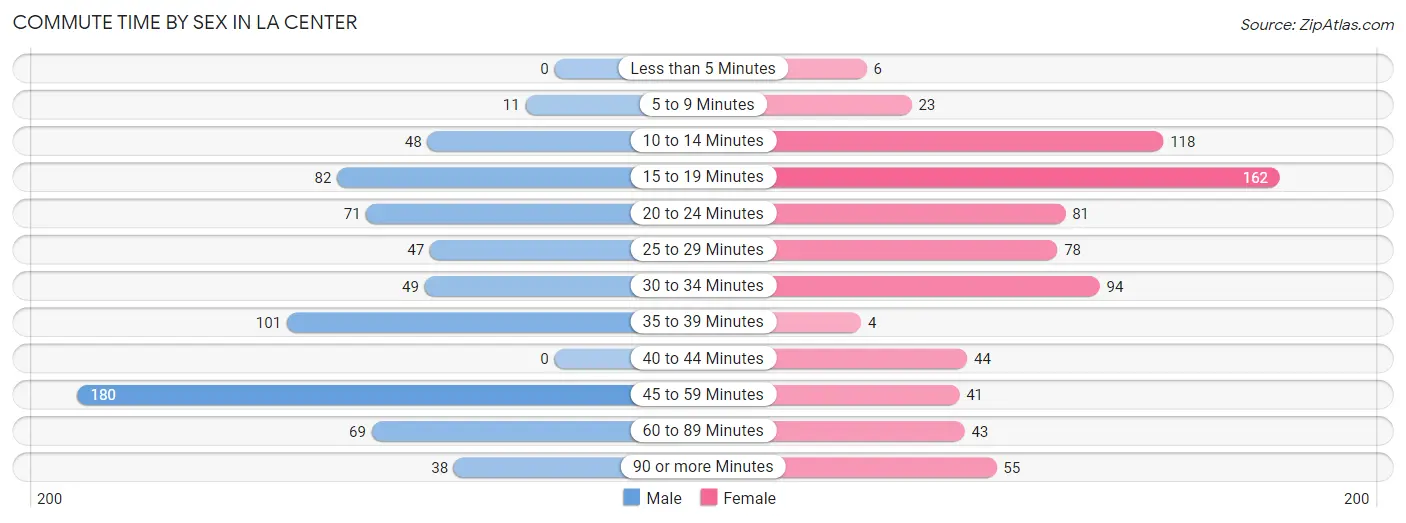
| Commute Time | Male | Female |
| Less than 5 Minutes | 0 (0.0%) | 6 (0.8%) |
| 5 to 9 Minutes | 11 (1.6%) | 23 (3.1%) |
| 10 to 14 Minutes | 48 (6.9%) | 118 (15.8%) |
| 15 to 19 Minutes | 82 (11.8%) | 162 (21.6%) |
| 20 to 24 Minutes | 71 (10.2%) | 81 (10.8%) |
| 25 to 29 Minutes | 47 (6.8%) | 78 (10.4%) |
| 30 to 34 Minutes | 49 (7.0%) | 94 (12.6%) |
| 35 to 39 Minutes | 101 (14.5%) | 4 (0.5%) |
| 40 to 44 Minutes | 0 (0.0%) | 44 (5.9%) |
| 45 to 59 Minutes | 180 (25.9%) | 41 (5.5%) |
| 60 to 89 Minutes | 69 (9.9%) | 43 (5.7%) |
| 90 or more Minutes | 38 (5.5%) | 55 (7.3%) |
Time of Departure to Work by Sex in La Center
The most frequent times of departure to work in La Center are 6:00 AM to 6:29 AM (247, 35.5%) for males and 8:30 AM to 8:59 AM (219, 29.2%) for females.
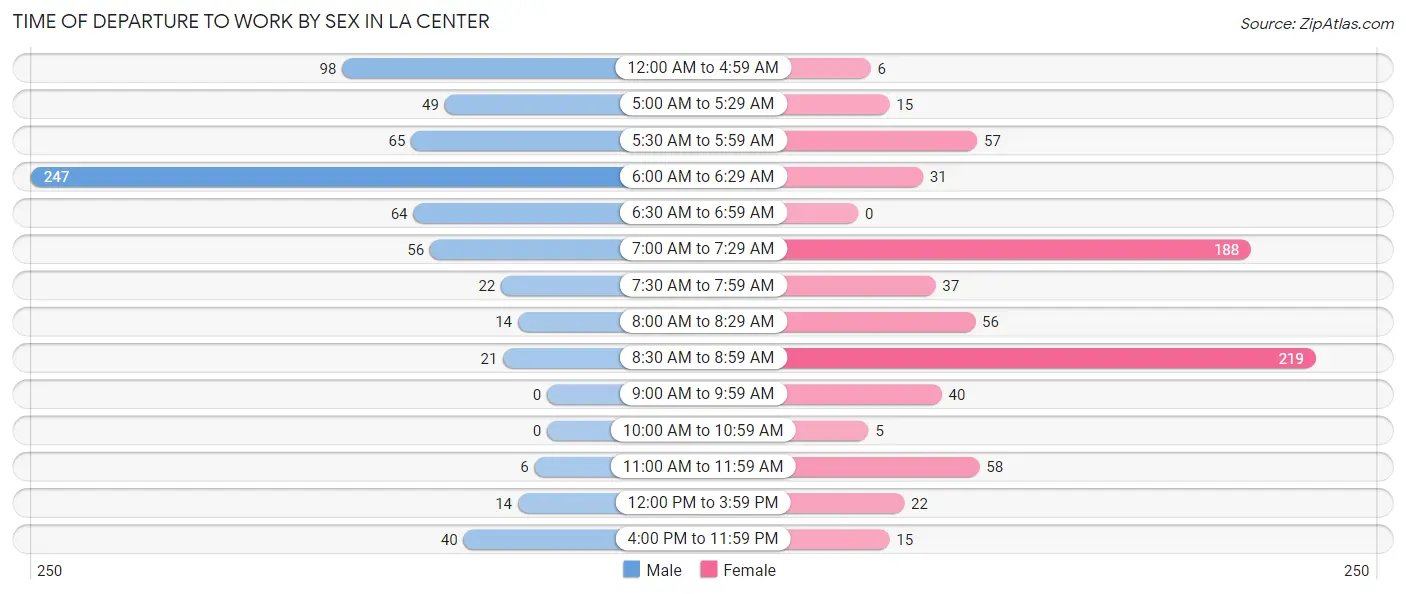
| Time of Departure | Male | Female |
| 12:00 AM to 4:59 AM | 98 (14.1%) | 6 (0.8%) |
| 5:00 AM to 5:29 AM | 49 (7.0%) | 15 (2.0%) |
| 5:30 AM to 5:59 AM | 65 (9.3%) | 57 (7.6%) |
| 6:00 AM to 6:29 AM | 247 (35.5%) | 31 (4.1%) |
| 6:30 AM to 6:59 AM | 64 (9.2%) | 0 (0.0%) |
| 7:00 AM to 7:29 AM | 56 (8.1%) | 188 (25.1%) |
| 7:30 AM to 7:59 AM | 22 (3.2%) | 37 (4.9%) |
| 8:00 AM to 8:29 AM | 14 (2.0%) | 56 (7.5%) |
| 8:30 AM to 8:59 AM | 21 (3.0%) | 219 (29.2%) |
| 9:00 AM to 9:59 AM | 0 (0.0%) | 40 (5.3%) |
| 10:00 AM to 10:59 AM | 0 (0.0%) | 5 (0.7%) |
| 11:00 AM to 11:59 AM | 6 (0.9%) | 58 (7.7%) |
| 12:00 PM to 3:59 PM | 14 (2.0%) | 22 (2.9%) |
| 4:00 PM to 11:59 PM | 40 (5.8%) | 15 (2.0%) |
| Total | 696 (100.0%) | 749 (100.0%) |
Housing Occupancy in La Center
Occupancy by Ownership in La Center
Of the total 1,233 dwellings in La Center, owner-occupied units account for 1,028 (83.4%), while renter-occupied units make up 205 (16.6%).
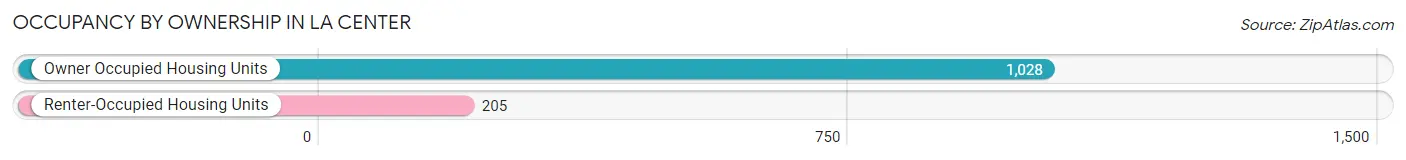
| Occupancy | # Housing Units | % Housing Units |
| Owner Occupied Housing Units | 1,028 | 83.4% |
| Renter-Occupied Housing Units | 205 | 16.6% |
| Total Occupied Housing Units | 1,233 | 100.0% |
Occupancy by Household Size in La Center
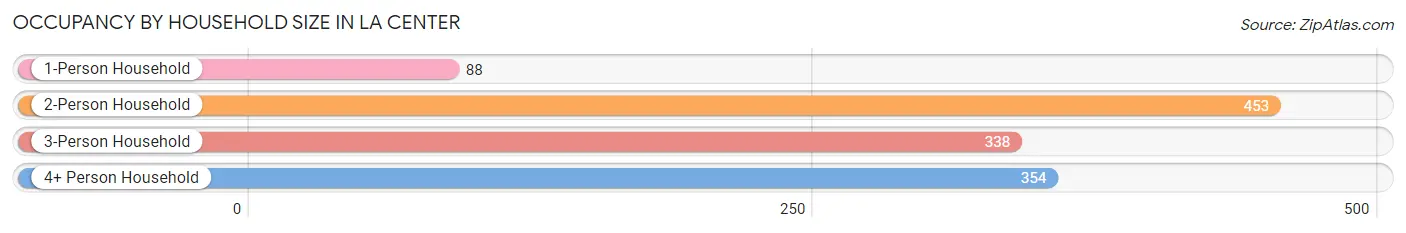
| Household Size | # Housing Units | % Housing Units |
| 1-Person Household | 88 | 7.1% |
| 2-Person Household | 453 | 36.7% |
| 3-Person Household | 338 | 27.4% |
| 4+ Person Household | 354 | 28.7% |
| Total Housing Units | 1,233 | 100.0% |
Occupancy by Ownership by Household Size in La Center
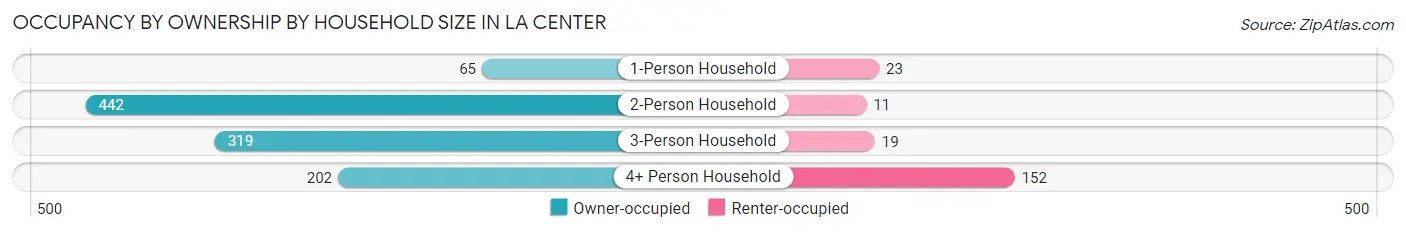
| Household Size | Owner-occupied | Renter-occupied |
| 1-Person Household | 65 (73.9%) | 23 (26.1%) |
| 2-Person Household | 442 (97.6%) | 11 (2.4%) |
| 3-Person Household | 319 (94.4%) | 19 (5.6%) |
| 4+ Person Household | 202 (57.1%) | 152 (42.9%) |
| Total Housing Units | 1,028 (83.4%) | 205 (16.6%) |
Occupancy by Educational Attainment in La Center
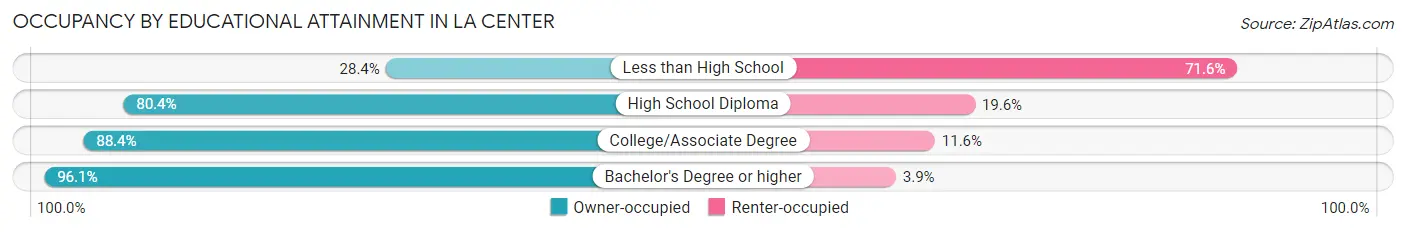
| Household Size | Owner-occupied | Renter-occupied |
| Less than High School | 27 (28.4%) | 68 (71.6%) |
| High School Diploma | 267 (80.4%) | 65 (19.6%) |
| College/Associate Degree | 463 (88.4%) | 61 (11.6%) |
| Bachelor's Degree or higher | 271 (96.1%) | 11 (3.9%) |
Occupancy by Age of Householder in La Center
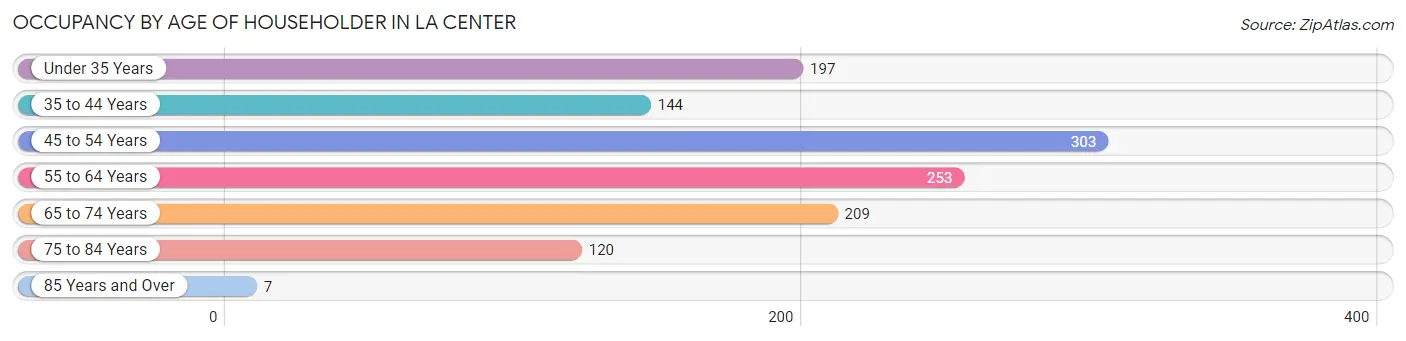
| Age Bracket | # Households | % Households |
| Under 35 Years | 197 | 16.0% |
| 35 to 44 Years | 144 | 11.7% |
| 45 to 54 Years | 303 | 24.6% |
| 55 to 64 Years | 253 | 20.5% |
| 65 to 74 Years | 209 | 17.0% |
| 75 to 84 Years | 120 | 9.7% |
| 85 Years and Over | 7 | 0.6% |
| Total | 1,233 | 100.0% |
Housing Finances in La Center
Median Income by Occupancy in La Center
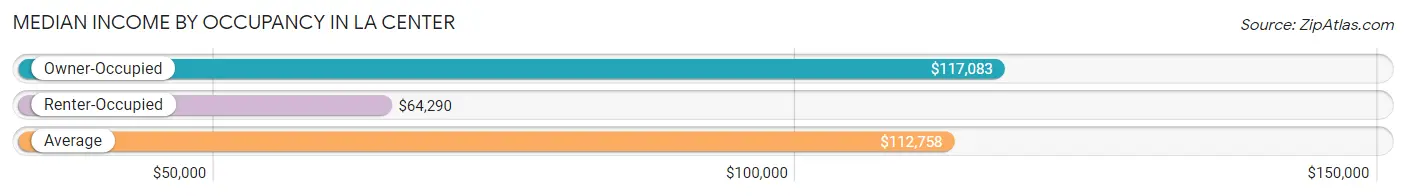
| Occupancy Type | # Households | Median Income |
| Owner-Occupied | 1,028 (83.4%) | $117,083 |
| Renter-Occupied | 205 (16.6%) | $64,290 |
| Average | 1,233 (100.0%) | $112,758 |
Occupancy by Householder Income Bracket in La Center
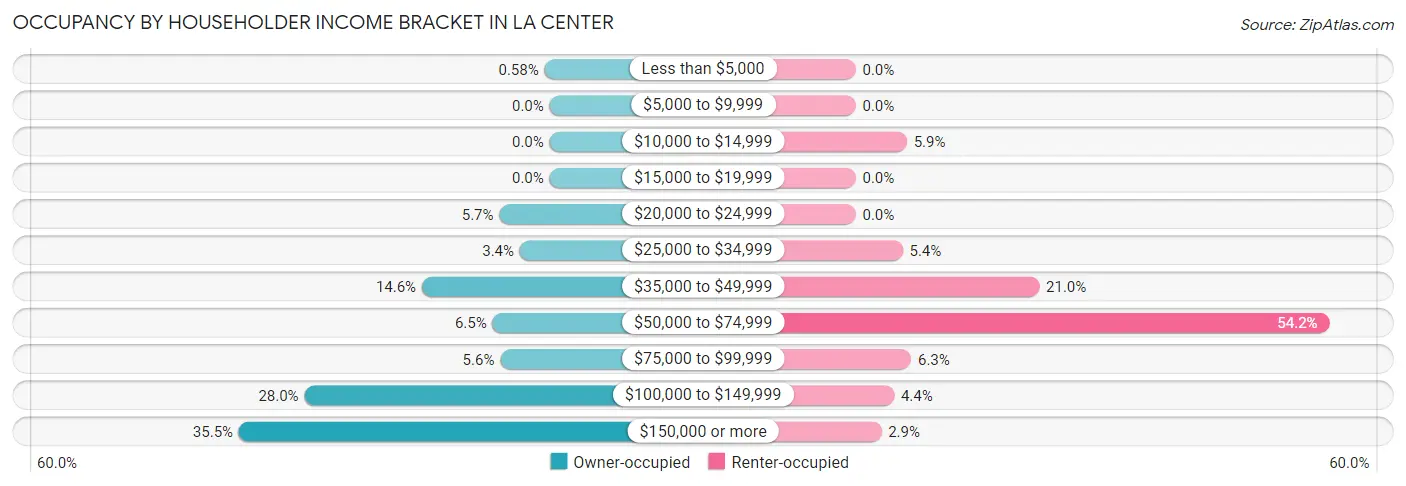
| Income Bracket | Owner-occupied | Renter-occupied |
| Less than $5,000 | 6 (0.6%) | 0 (0.0%) |
| $5,000 to $9,999 | 0 (0.0%) | 0 (0.0%) |
| $10,000 to $14,999 | 0 (0.0%) | 12 (5.9%) |
| $15,000 to $19,999 | 0 (0.0%) | 0 (0.0%) |
| $20,000 to $24,999 | 59 (5.7%) | 0 (0.0%) |
| $25,000 to $34,999 | 35 (3.4%) | 11 (5.4%) |
| $35,000 to $49,999 | 150 (14.6%) | 43 (21.0%) |
| $50,000 to $74,999 | 67 (6.5%) | 111 (54.1%) |
| $75,000 to $99,999 | 58 (5.6%) | 13 (6.3%) |
| $100,000 to $149,999 | 288 (28.0%) | 9 (4.4%) |
| $150,000 or more | 365 (35.5%) | 6 (2.9%) |
| Total | 1,028 (100.0%) | 205 (100.0%) |
Monthly Housing Cost Tiers in La Center
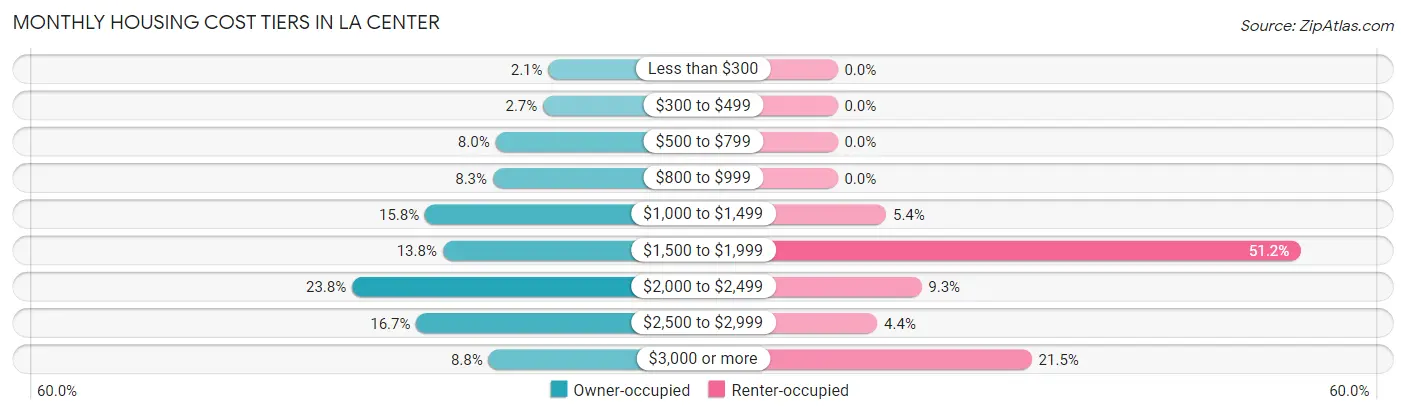
| Monthly Cost | Owner-occupied | Renter-occupied |
| Less than $300 | 22 (2.1%) | 0 (0.0%) |
| $300 to $499 | 28 (2.7%) | 0 (0.0%) |
| $500 to $799 | 82 (8.0%) | 0 (0.0%) |
| $800 to $999 | 85 (8.3%) | 0 (0.0%) |
| $1,000 to $1,499 | 162 (15.8%) | 11 (5.4%) |
| $1,500 to $1,999 | 142 (13.8%) | 105 (51.2%) |
| $2,000 to $2,499 | 245 (23.8%) | 19 (9.3%) |
| $2,500 to $2,999 | 172 (16.7%) | 9 (4.4%) |
| $3,000 or more | 90 (8.7%) | 44 (21.5%) |
| Total | 1,028 (100.0%) | 205 (100.0%) |
Physical Housing Characteristics in La Center
Housing Structures in La Center
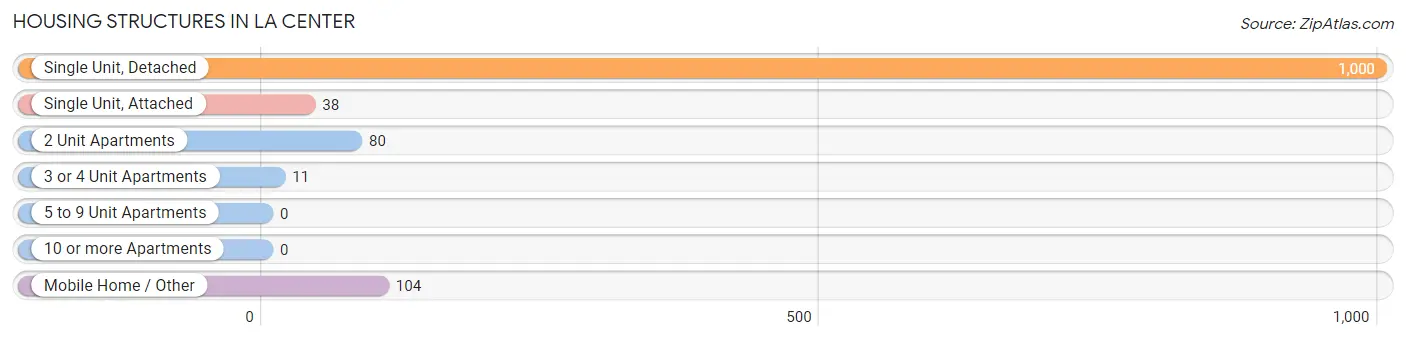
| Structure Type | # Housing Units | % Housing Units |
| Single Unit, Detached | 1,000 | 81.1% |
| Single Unit, Attached | 38 | 3.1% |
| 2 Unit Apartments | 80 | 6.5% |
| 3 or 4 Unit Apartments | 11 | 0.9% |
| 5 to 9 Unit Apartments | 0 | 0.0% |
| 10 or more Apartments | 0 | 0.0% |
| Mobile Home / Other | 104 | 8.4% |
| Total | 1,233 | 100.0% |
Housing Structures by Occupancy in La Center
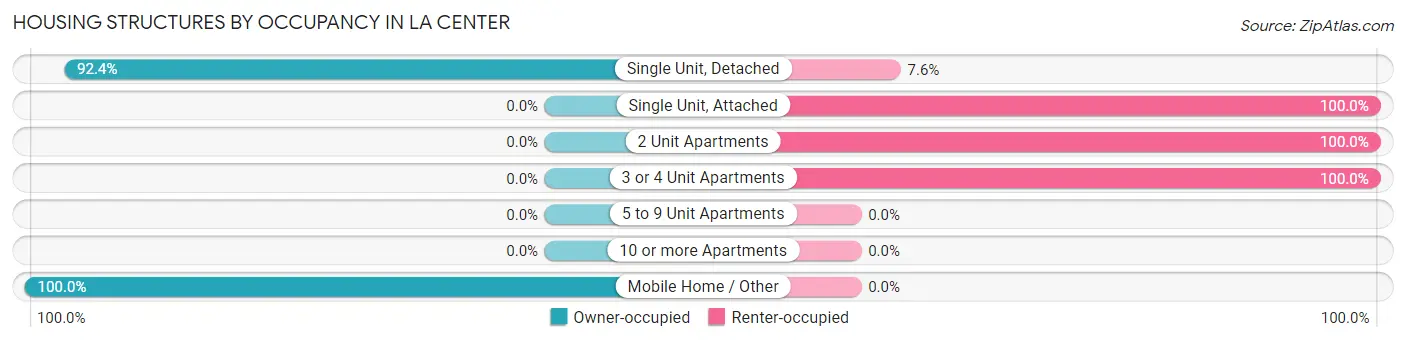
| Structure Type | Owner-occupied | Renter-occupied |
| Single Unit, Detached | 924 (92.4%) | 76 (7.6%) |
| Single Unit, Attached | 0 (0.0%) | 38 (100.0%) |
| 2 Unit Apartments | 0 (0.0%) | 80 (100.0%) |
| 3 or 4 Unit Apartments | 0 (0.0%) | 11 (100.0%) |
| 5 to 9 Unit Apartments | 0 (0.0%) | 0 (0.0%) |
| 10 or more Apartments | 0 (0.0%) | 0 (0.0%) |
| Mobile Home / Other | 104 (100.0%) | 0 (0.0%) |
| Total | 1,028 (83.4%) | 205 (16.6%) |
Housing Structures by Number of Rooms in La Center
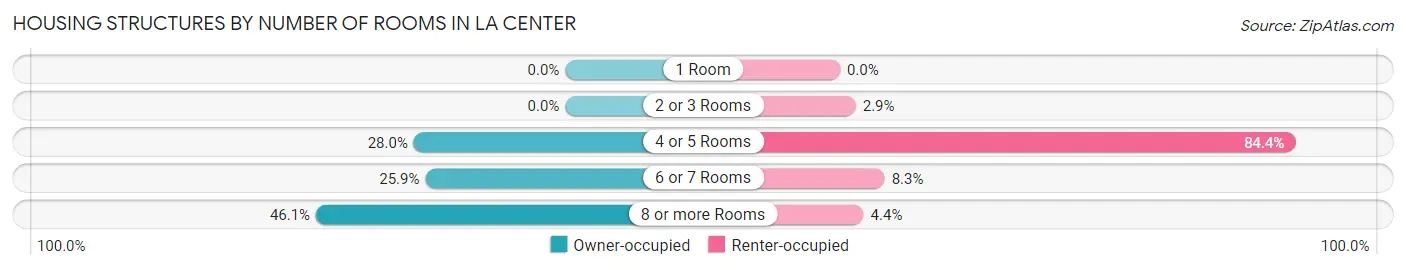
| Number of Rooms | Owner-occupied | Renter-occupied |
| 1 Room | 0 (0.0%) | 0 (0.0%) |
| 2 or 3 Rooms | 0 (0.0%) | 6 (2.9%) |
| 4 or 5 Rooms | 288 (28.0%) | 173 (84.4%) |
| 6 or 7 Rooms | 266 (25.9%) | 17 (8.3%) |
| 8 or more Rooms | 474 (46.1%) | 9 (4.4%) |
| Total | 1,028 (100.0%) | 205 (100.0%) |
Housing Structure by Heating Type in La Center
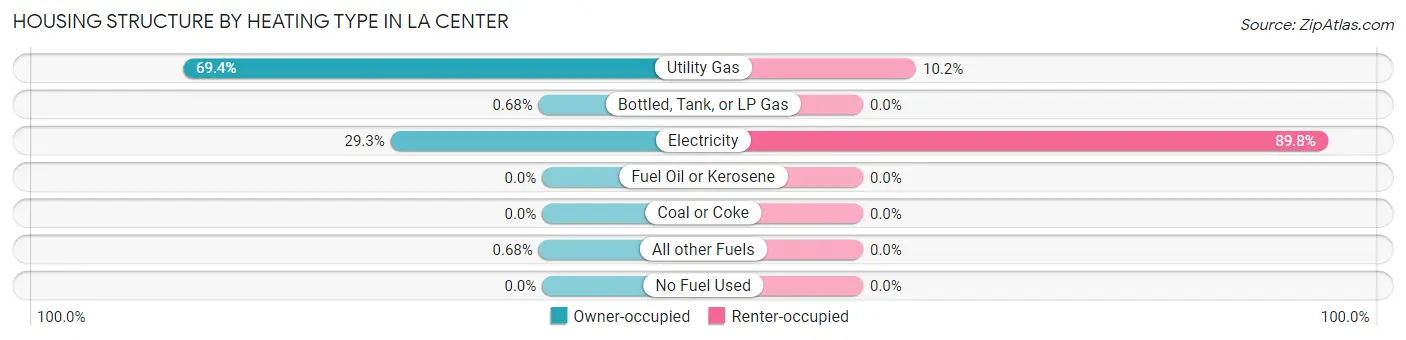
| Heating Type | Owner-occupied | Renter-occupied |
| Utility Gas | 713 (69.4%) | 21 (10.2%) |
| Bottled, Tank, or LP Gas | 7 (0.7%) | 0 (0.0%) |
| Electricity | 301 (29.3%) | 184 (89.8%) |
| Fuel Oil or Kerosene | 0 (0.0%) | 0 (0.0%) |
| Coal or Coke | 0 (0.0%) | 0 (0.0%) |
| All other Fuels | 7 (0.7%) | 0 (0.0%) |
| No Fuel Used | 0 (0.0%) | 0 (0.0%) |
| Total | 1,028 (100.0%) | 205 (100.0%) |
Household Vehicle Usage in La Center
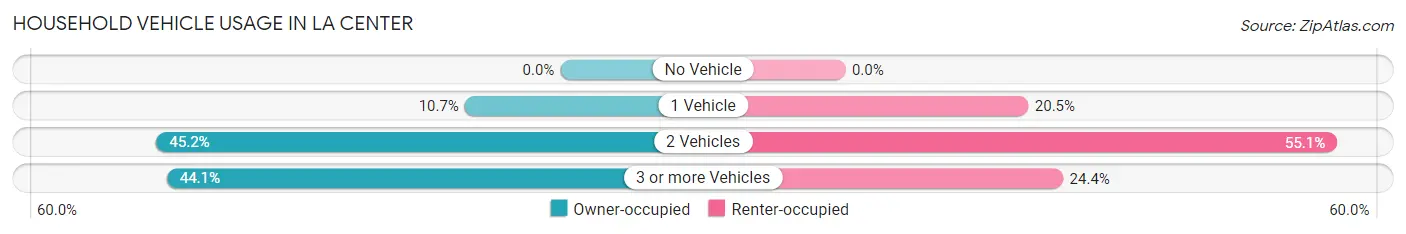
| Vehicles per Household | Owner-occupied | Renter-occupied |
| No Vehicle | 0 (0.0%) | 0 (0.0%) |
| 1 Vehicle | 110 (10.7%) | 42 (20.5%) |
| 2 Vehicles | 465 (45.2%) | 113 (55.1%) |
| 3 or more Vehicles | 453 (44.1%) | 50 (24.4%) |
| Total | 1,028 (100.0%) | 205 (100.0%) |
Real Estate & Mortgages in La Center
Real Estate and Mortgage Overview in La Center
| Characteristic | Without Mortgage | With Mortgage |
| Housing Units | 265 | 763 |
| Median Property Value | $456,700 | $490,800 |
| Median Household Income | - | - |
| Monthly Housing Costs | $846 | $90 |
| Real Estate Taxes | $4,063 | $0 |
Property Value by Mortgage Status in La Center
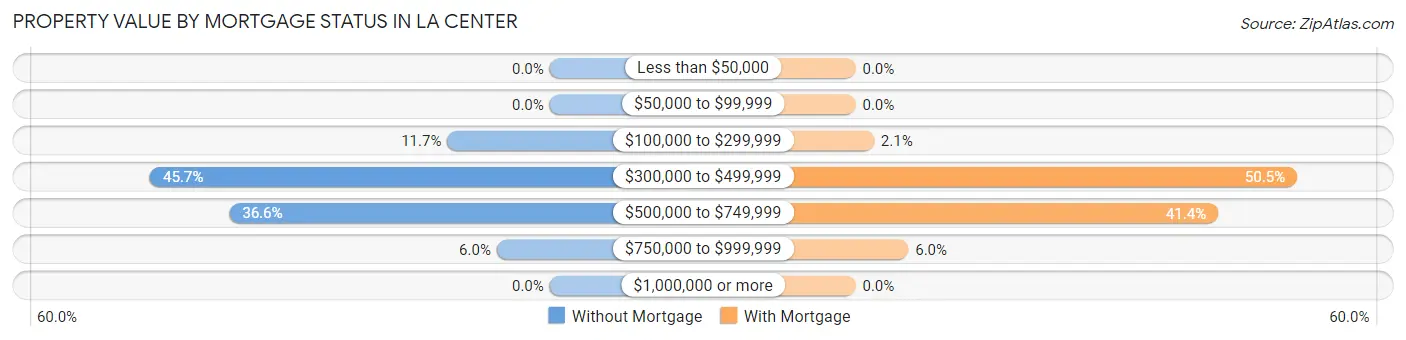
| Property Value | Without Mortgage | With Mortgage |
| Less than $50,000 | 0 (0.0%) | 0 (0.0%) |
| $50,000 to $99,999 | 0 (0.0%) | 0 (0.0%) |
| $100,000 to $299,999 | 31 (11.7%) | 16 (2.1%) |
| $300,000 to $499,999 | 121 (45.7%) | 385 (50.5%) |
| $500,000 to $749,999 | 97 (36.6%) | 316 (41.4%) |
| $750,000 to $999,999 | 16 (6.0%) | 46 (6.0%) |
| $1,000,000 or more | 0 (0.0%) | 0 (0.0%) |
| Total | 265 (100.0%) | 763 (100.0%) |
Household Income by Mortgage Status in La Center
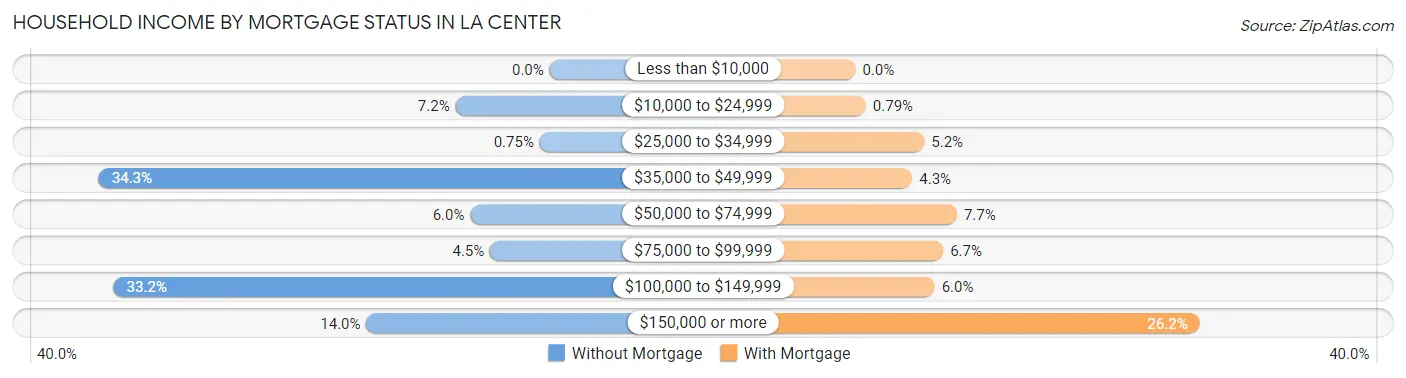
| Household Income | Without Mortgage | With Mortgage |
| Less than $10,000 | 0 (0.0%) | 0 (0.0%) |
| $10,000 to $24,999 | 19 (7.2%) | 6 (0.8%) |
| $25,000 to $34,999 | 2 (0.7%) | 40 (5.2%) |
| $35,000 to $49,999 | 91 (34.3%) | 33 (4.3%) |
| $50,000 to $74,999 | 16 (6.0%) | 59 (7.7%) |
| $75,000 to $99,999 | 12 (4.5%) | 51 (6.7%) |
| $100,000 to $149,999 | 88 (33.2%) | 46 (6.0%) |
| $150,000 or more | 37 (14.0%) | 200 (26.2%) |
| Total | 265 (100.0%) | 763 (100.0%) |
Property Value to Household Income Ratio in La Center
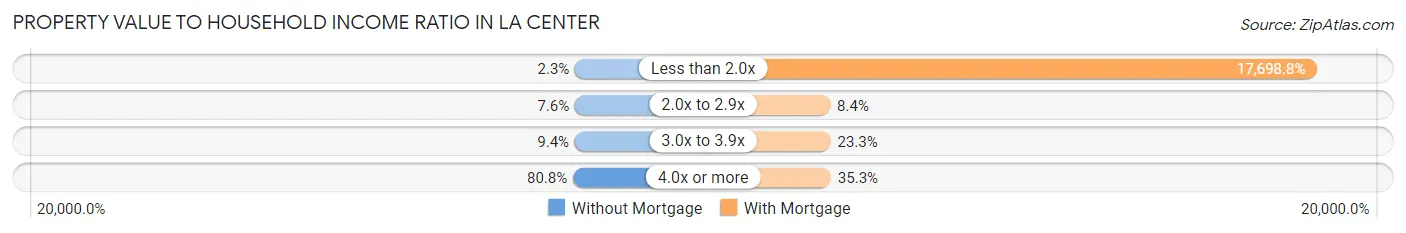
| Value-to-Income Ratio | Without Mortgage | With Mortgage |
| Less than 2.0x | 6 (2.3%) | 135,042 (17,698.8%) |
| 2.0x to 2.9x | 20 (7.5%) | 64 (8.4%) |
| 3.0x to 3.9x | 25 (9.4%) | 178 (23.3%) |
| 4.0x or more | 214 (80.7%) | 269 (35.3%) |
| Total | 265 (100.0%) | 763 (100.0%) |
Real Estate Taxes by Mortgage Status in La Center
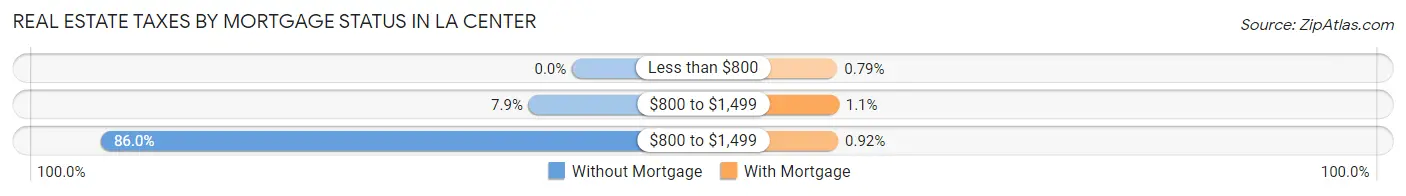
| Property Taxes | Without Mortgage | With Mortgage |
| Less than $800 | 0 (0.0%) | 6 (0.8%) |
| $800 to $1,499 | 21 (7.9%) | 8 (1.1%) |
| $800 to $1,499 | 228 (86.0%) | 7 (0.9%) |
| Total | 265 (100.0%) | 763 (100.0%) |
Health & Disability in La Center
Health Insurance Coverage by Age in La Center
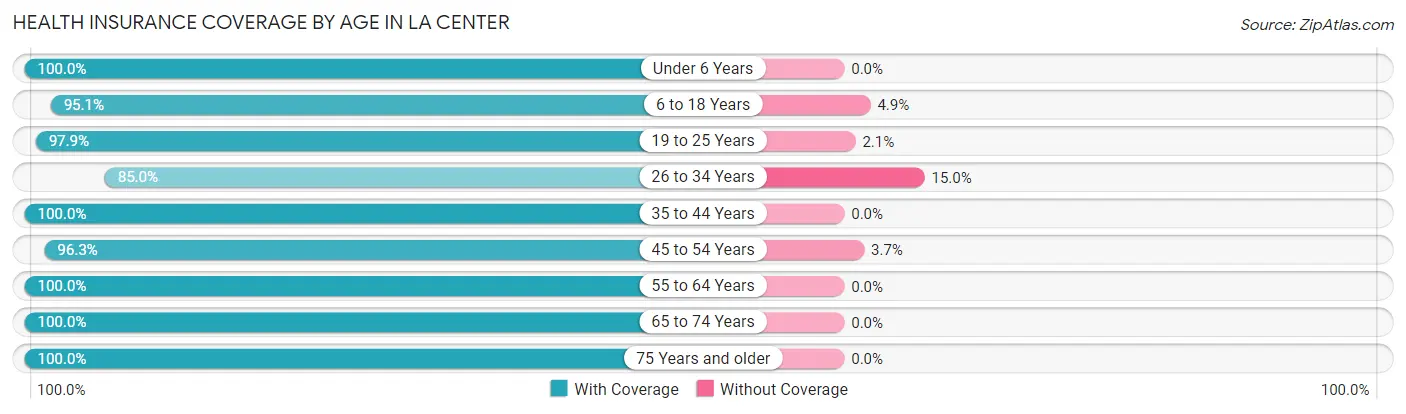
| Age Bracket | With Coverage | Without Coverage |
| Under 6 Years | 209 (100.0%) | 0 (0.0%) |
| 6 to 18 Years | 565 (95.1%) | 29 (4.9%) |
| 19 to 25 Years | 517 (97.9%) | 11 (2.1%) |
| 26 to 34 Years | 290 (85.0%) | 51 (15.0%) |
| 35 to 44 Years | 327 (100.0%) | 0 (0.0%) |
| 45 to 54 Years | 546 (96.3%) | 21 (3.7%) |
| 55 to 64 Years | 454 (100.0%) | 0 (0.0%) |
| 65 to 74 Years | 460 (100.0%) | 0 (0.0%) |
| 75 Years and older | 205 (100.0%) | 0 (0.0%) |
| Total | 3,573 (97.0%) | 112 (3.0%) |
Health Insurance Coverage by Citizenship Status in La Center
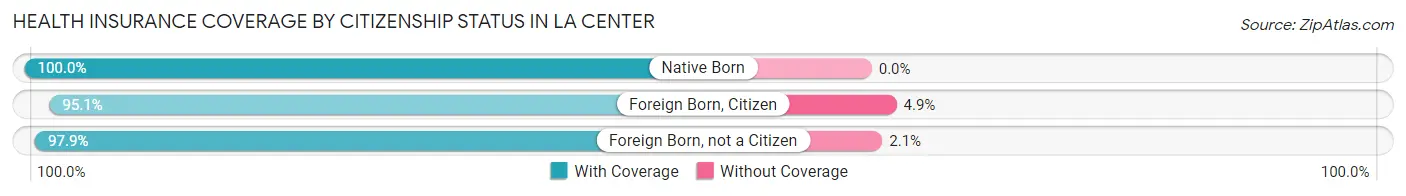
| Citizenship Status | With Coverage | Without Coverage |
| Native Born | 209 (100.0%) | 0 (0.0%) |
| Foreign Born, Citizen | 565 (95.1%) | 29 (4.9%) |
| Foreign Born, not a Citizen | 517 (97.9%) | 11 (2.1%) |
Health Insurance Coverage by Household Income in La Center
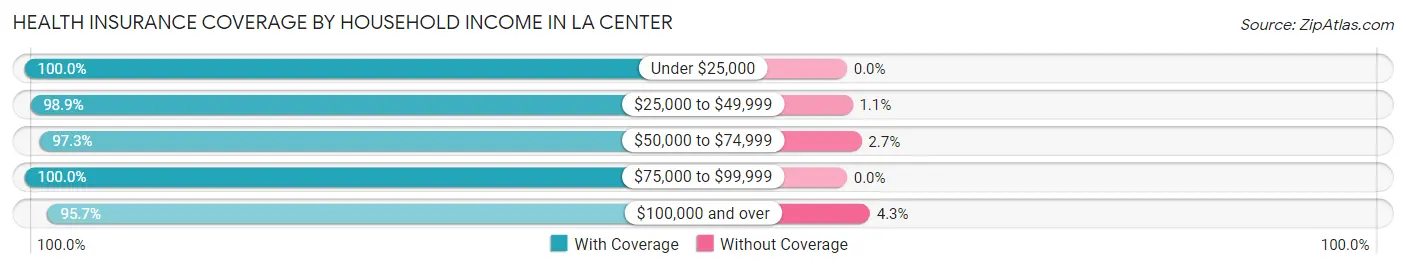
| Household Income | With Coverage | Without Coverage |
| Under $25,000 | 173 (100.0%) | 0 (0.0%) |
| $25,000 to $49,999 | 560 (98.9%) | 6 (1.1%) |
| $50,000 to $74,999 | 640 (97.3%) | 18 (2.7%) |
| $75,000 to $99,999 | 246 (100.0%) | 0 (0.0%) |
| $100,000 and over | 1,954 (95.7%) | 88 (4.3%) |
Public vs Private Health Insurance Coverage by Age in La Center
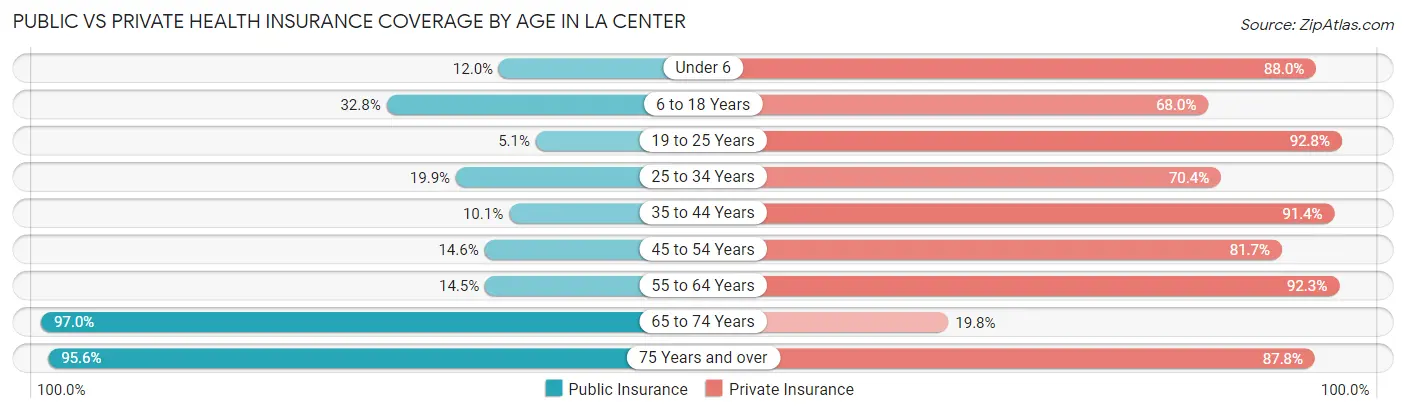
| Age Bracket | Public Insurance | Private Insurance |
| Under 6 | 25 (12.0%) | 184 (88.0%) |
| 6 to 18 Years | 195 (32.8%) | 404 (68.0%) |
| 19 to 25 Years | 27 (5.1%) | 490 (92.8%) |
| 25 to 34 Years | 68 (19.9%) | 240 (70.4%) |
| 35 to 44 Years | 33 (10.1%) | 299 (91.4%) |
| 45 to 54 Years | 83 (14.6%) | 463 (81.7%) |
| 55 to 64 Years | 66 (14.5%) | 419 (92.3%) |
| 65 to 74 Years | 446 (97.0%) | 91 (19.8%) |
| 75 Years and over | 196 (95.6%) | 180 (87.8%) |
| Total | 1,139 (30.9%) | 2,770 (75.2%) |
Disability Status by Sex by Age in La Center
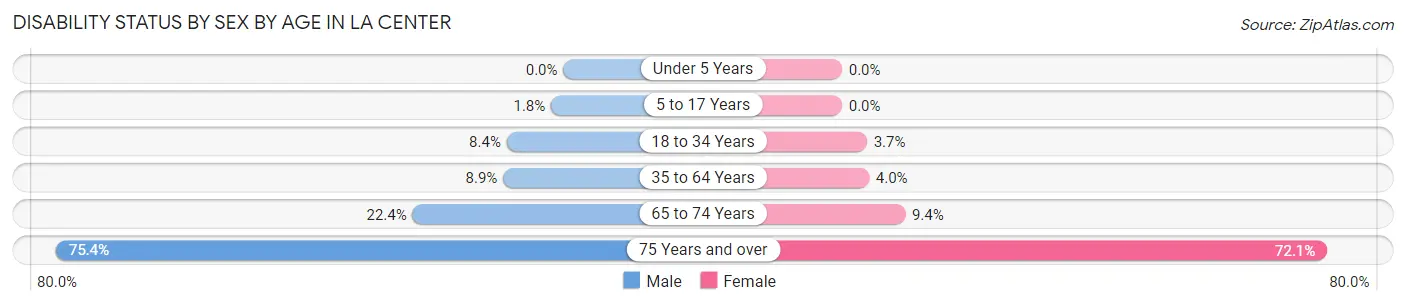
| Age Bracket | Male | Female |
| Under 5 Years | 0 (0.0%) | 0 (0.0%) |
| 5 to 17 Years | 6 (1.8%) | 0 (0.0%) |
| 18 to 34 Years | 29 (8.4%) | 20 (3.7%) |
| 35 to 64 Years | 56 (8.9%) | 29 (4.0%) |
| 65 to 74 Years | 60 (22.4%) | 18 (9.4%) |
| 75 Years and over | 52 (75.4%) | 98 (72.1%) |
Disability Class by Sex by Age in La Center
Disability Class: Hearing Difficulty
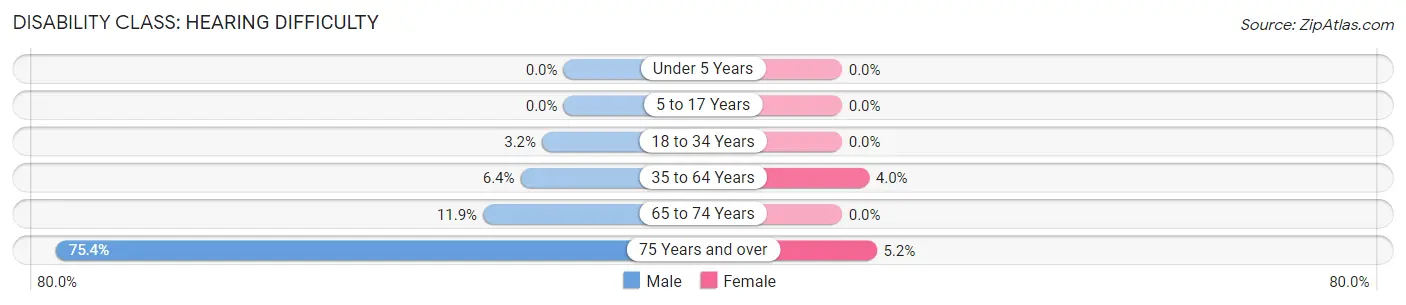
| Age Bracket | Male | Female |
| Under 5 Years | 0 (0.0%) | 0 (0.0%) |
| 5 to 17 Years | 0 (0.0%) | 0 (0.0%) |
| 18 to 34 Years | 11 (3.2%) | 0 (0.0%) |
| 35 to 64 Years | 40 (6.4%) | 29 (4.0%) |
| 65 to 74 Years | 32 (11.9%) | 0 (0.0%) |
| 75 Years and over | 52 (75.4%) | 7 (5.1%) |
Disability Class: Vision Difficulty
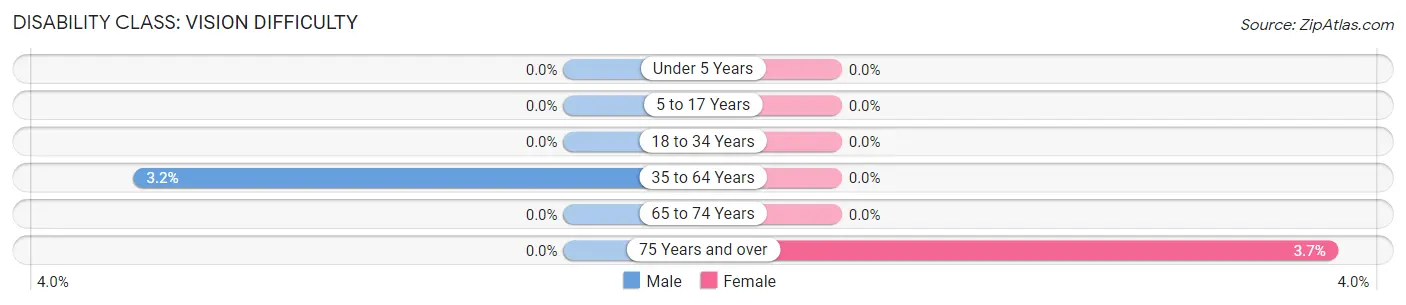
| Age Bracket | Male | Female |
| Under 5 Years | 0 (0.0%) | 0 (0.0%) |
| 5 to 17 Years | 0 (0.0%) | 0 (0.0%) |
| 18 to 34 Years | 0 (0.0%) | 0 (0.0%) |
| 35 to 64 Years | 20 (3.2%) | 0 (0.0%) |
| 65 to 74 Years | 0 (0.0%) | 0 (0.0%) |
| 75 Years and over | 0 (0.0%) | 5 (3.7%) |
Disability Class: Cognitive Difficulty
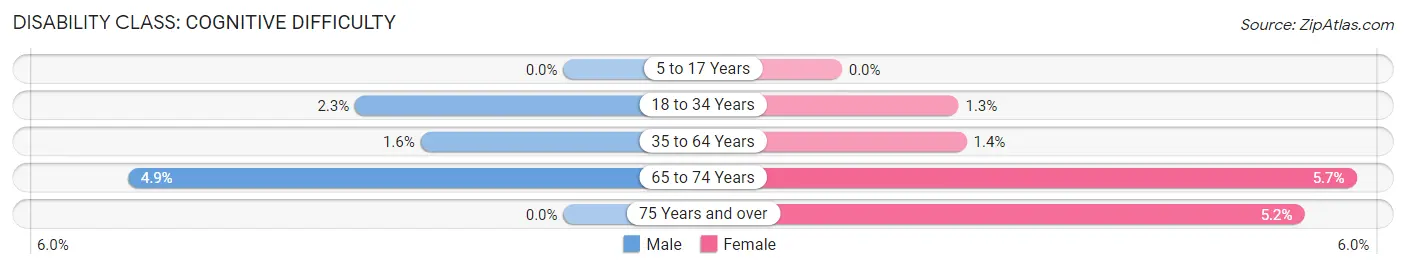
| Age Bracket | Male | Female |
| 5 to 17 Years | 0 (0.0%) | 0 (0.0%) |
| 18 to 34 Years | 8 (2.3%) | 7 (1.3%) |
| 35 to 64 Years | 10 (1.6%) | 10 (1.4%) |
| 65 to 74 Years | 13 (4.9%) | 11 (5.7%) |
| 75 Years and over | 0 (0.0%) | 7 (5.1%) |
Disability Class: Ambulatory Difficulty
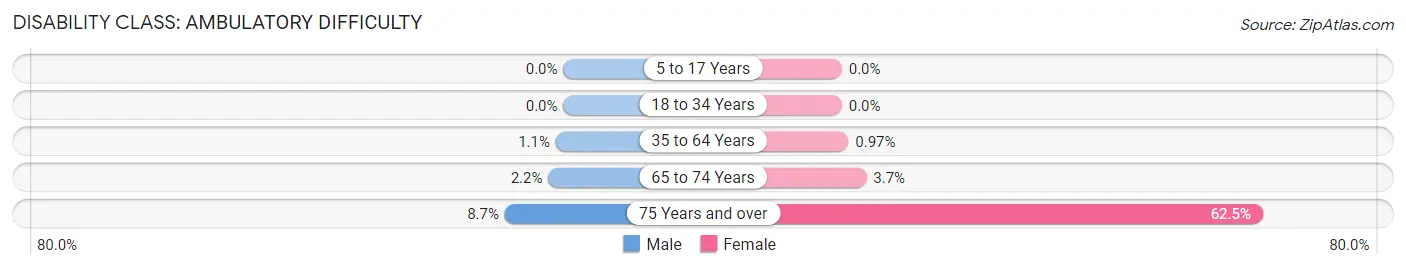
| Age Bracket | Male | Female |
| 5 to 17 Years | 0 (0.0%) | 0 (0.0%) |
| 18 to 34 Years | 0 (0.0%) | 0 (0.0%) |
| 35 to 64 Years | 7 (1.1%) | 7 (1.0%) |
| 65 to 74 Years | 6 (2.2%) | 7 (3.6%) |
| 75 Years and over | 6 (8.7%) | 85 (62.5%) |
Disability Class: Self-Care Difficulty
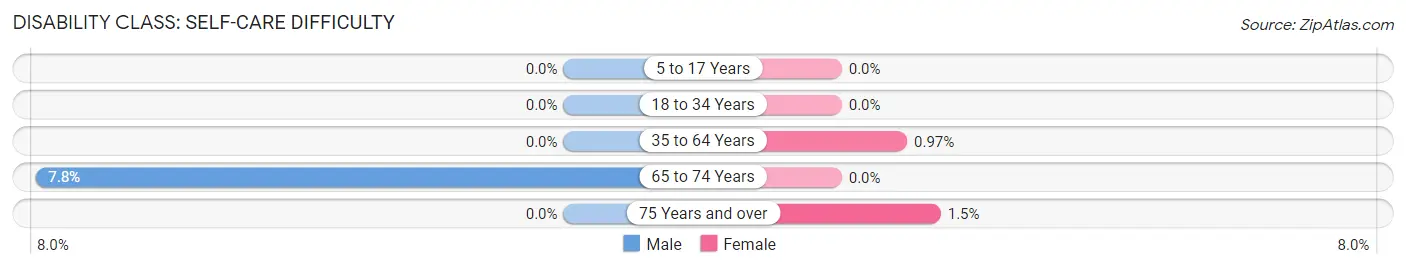
| Age Bracket | Male | Female |
| 5 to 17 Years | 0 (0.0%) | 0 (0.0%) |
| 18 to 34 Years | 0 (0.0%) | 0 (0.0%) |
| 35 to 64 Years | 0 (0.0%) | 7 (1.0%) |
| 65 to 74 Years | 21 (7.8%) | 0 (0.0%) |
| 75 Years and over | 0 (0.0%) | 2 (1.5%) |
Technology Access in La Center
Computing Device Access in La Center
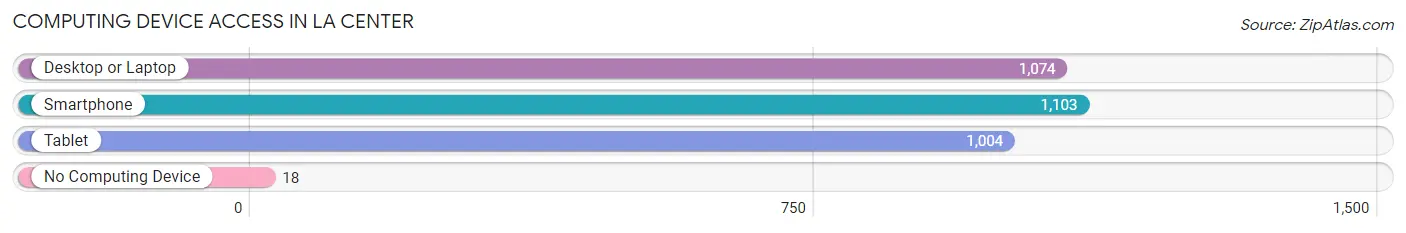
| Device Type | # Households | % Households |
| Desktop or Laptop | 1,074 | 87.1% |
| Smartphone | 1,103 | 89.5% |
| Tablet | 1,004 | 81.4% |
| No Computing Device | 18 | 1.5% |
| Total | 1,233 | 100.0% |
Internet Access in La Center
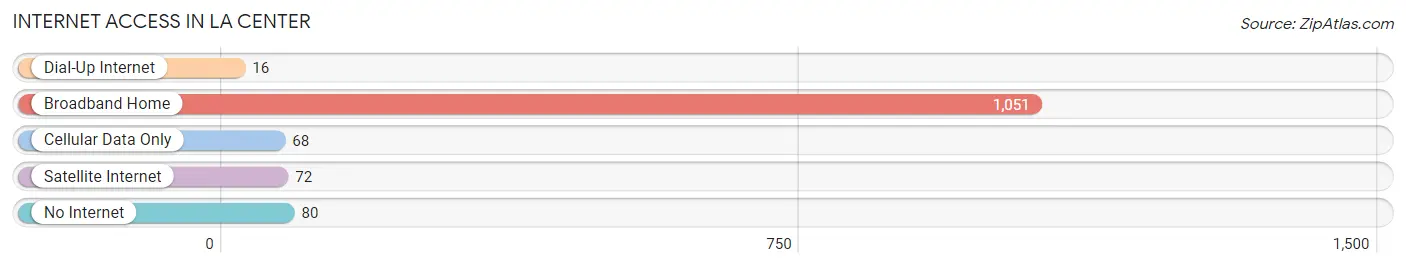
| Internet Type | # Households | % Households |
| Dial-Up Internet | 16 | 1.3% |
| Broadband Home | 1,051 | 85.2% |
| Cellular Data Only | 68 | 5.5% |
| Satellite Internet | 72 | 5.8% |
| No Internet | 80 | 6.5% |
| Total | 1,233 | 100.0% |
La Center Summary
La Center is a small city located in Clark County, Washington, United States. It is situated along the Lewis River, approximately 20 miles north of Vancouver and 10 miles east of the Columbia River. The city is part of the Portland-Vancouver metropolitan area and has a population of approximately 4,000 people.
History
The area that is now La Center was first inhabited by the Chinook and Klickitat tribes. The first white settlers arrived in the area in the late 1850s, and the town was officially incorporated in 1891. The town was named after the nearby La Center Prairie, which was named by early settlers for its location at the center of the prairie.
In the early 1900s, the town was a major logging center, with several sawmills located in the area. The town also had a thriving agricultural industry, with dairy farms, orchards, and berry farms.
In the 1950s, the town began to experience a decline in its economy as the logging industry declined and the agricultural industry shifted to larger farms. In the late 1970s, the town began to experience a resurgence as the nearby cities of Vancouver and Portland began to experience rapid growth.
Geography
La Center is located in Clark County, Washington, approximately 20 miles north of Vancouver and 10 miles east of the Columbia River. The city is situated along the Lewis River, which flows through the city and is a popular spot for fishing and boating. The city is surrounded by rolling hills and forests, and is located in the foothills of the Cascade Mountains.
The city has a total area of 2.2 square miles, all of which is land. The city has a humid continental climate, with warm summers and cold winters.
Economy
The economy of La Center is largely based on the service industry, with many businesses providing services to the nearby cities of Vancouver and Portland. The city is also home to several manufacturing companies, including a paper mill and a wood products plant.
The city is also home to several casinos, which are a major source of revenue for the city. The casinos are located on the city's reservation land, and are owned and operated by the Cowlitz Indian Tribe.
Demographics
As of the 2010 census, La Center had a population of 4,134 people. The racial makeup of the city was 87.3% White, 0.7% African American, 1.2% Native American, 0.7% Asian, 0.1% Pacific Islander, 6.2% from other races, and 3.9% from two or more races. Hispanic or Latino of any race were 11.3% of the population.
The median household income in La Center was $50,945, and the median family income was $58,906. The per capita income for the city was $22,845. About 11.3% of families and 14.2% of the population were below the poverty line, including 19.2% of those under age 18 and 8.2% of those age 65 or over.
Common Questions
What is Per Capita Income in La Center?
Per Capita income in La Center is $42,319.
What is the Median Family Income in La Center?
Median Family Income in La Center is $113,478.
What is the Median Household income in La Center?
Median Household Income in La Center is $112,758.
What is Income or Wage Gap in La Center?
Income or Wage Gap in La Center is 59.9%.
Women in La Center earn 40.1 cents for every dollar earned by a man.
What is Inequality or Gini Index in La Center?
Inequality or Gini Index in La Center is 0.39.
What is the Total Population of La Center?
Total Population of La Center is 3,685.
What is the Total Male Population of La Center?
Total Male Population of La Center is 1,728.
What is the Total Female Population of La Center?
Total Female Population of La Center is 1,957.
What is the Ratio of Males per 100 Females in La Center?
There are 88.30 Males per 100 Females in La Center.
What is the Ratio of Females per 100 Males in La Center?
There are 113.25 Females per 100 Males in La Center.
What is the Median Population Age in La Center?
Median Population Age in La Center is 40.4 Years.
What is the Average Family Size in La Center
Average Family Size in La Center is 3.1 People.
What is the Average Household Size in La Center
Average Household Size in La Center is 3.0 People.
How Large is the Labor Force in La Center?
There are 1,820 People in the Labor Forcein in La Center.
What is the Percentage of People in the Labor Force in La Center?
60.2% of People are in the Labor Force in La Center.
What is the Unemployment Rate in La Center?
Unemployment Rate in La Center is 4.2%.