Bryant, WA Map & Demographics
Bryant Map
Bryant Overview
$45,543
PER CAPITA INCOME
$114,762
AVG FAMILY INCOME
$114,694
AVG HOUSEHOLD INCOME
59.9%
WAGE / INCOME GAP [ % ]
40.1¢/ $1
WAGE / INCOME GAP [ $ ]
0.30
INEQUALITY / GINI INDEX
2,486
TOTAL POPULATION
1,215
MALE POPULATION
1,271
FEMALE POPULATION
95.59
MALES / 100 FEMALES
104.61
FEMALES / 100 MALES
45.9
MEDIAN AGE
3.0
AVG FAMILY SIZE
3.0
AVG HOUSEHOLD SIZE
1,465
LABOR FORCE [ PEOPLE ]
73.2%
PERCENT IN LABOR FORCE
Income in Bryant
Income Overview in Bryant
Per Capita Income in Bryant is $45,543, while median incomes of families and households are $114,762 and $114,694 respectively.
| Characteristic | Number | Measure |
| Per Capita Income | 2,486 | $45,543 |
| Median Family Income | 750 | $114,762 |
| Mean Family Income | 750 | $133,363 |
| Median Household Income | 844 | $114,694 |
| Mean Household Income | 844 | $133,128 |
| Income Deficit | 750 | $0 |
| Wage / Income Gap (%) | 2,486 | 59.86% |
| Wage / Income Gap ($) | 2,486 | 40.14¢ per $1 |
| Gini / Inequality Index | 2,486 | 0.30 |
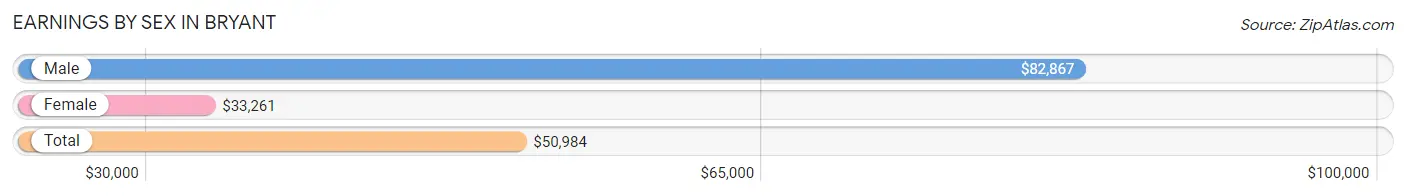
Earnings by Sex in Bryant
Average Earnings in Bryant are $50,984, $82,867 for men and $33,261 for women, a difference of 59.9%.
| Sex | Number | Average Earnings |
| Male | 743 (50.2%) | $82,867 |
| Female | 738 (49.8%) | $33,261 |
| Total | 1,481 (100.0%) | $50,984 |
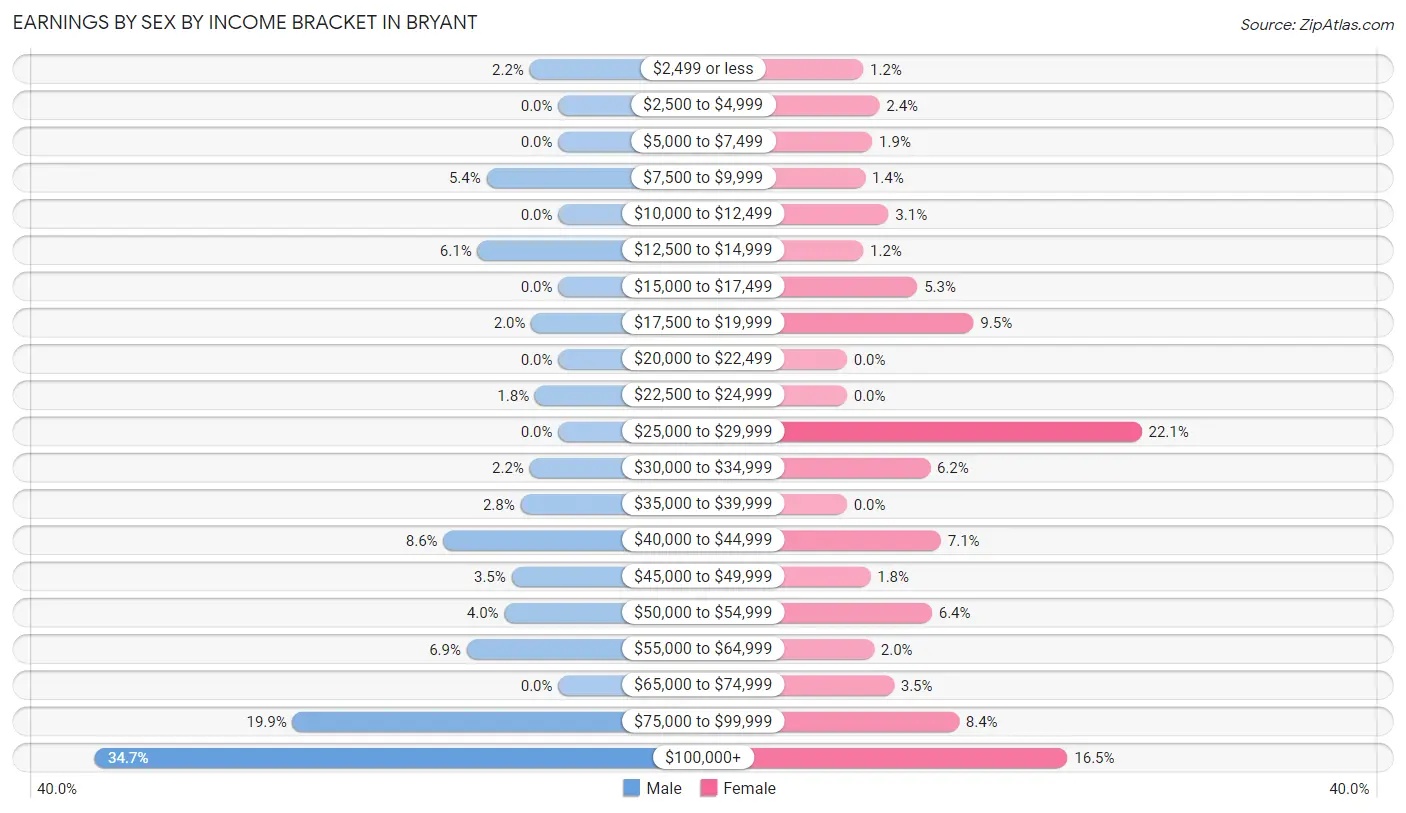
Earnings by Sex by Income Bracket in Bryant
The most common earnings brackets in Bryant are $100,000+ for men (258 | 34.7%) and $25,000 to $29,999 for women (163 | 22.1%).
| Income | Male | Female |
| $2,499 or less | 16 (2.1%) | 9 (1.2%) |
| $2,500 to $4,999 | 0 (0.0%) | 18 (2.4%) |
| $5,000 to $7,499 | 0 (0.0%) | 14 (1.9%) |
| $7,500 to $9,999 | 40 (5.4%) | 10 (1.4%) |
| $10,000 to $12,499 | 0 (0.0%) | 23 (3.1%) |
| $12,500 to $14,999 | 45 (6.1%) | 9 (1.2%) |
| $15,000 to $17,499 | 0 (0.0%) | 39 (5.3%) |
| $17,500 to $19,999 | 15 (2.0%) | 70 (9.5%) |
| $20,000 to $22,499 | 0 (0.0%) | 0 (0.0%) |
| $22,500 to $24,999 | 13 (1.8%) | 0 (0.0%) |
| $25,000 to $29,999 | 0 (0.0%) | 163 (22.1%) |
| $30,000 to $34,999 | 16 (2.1%) | 46 (6.2%) |
| $35,000 to $39,999 | 21 (2.8%) | 0 (0.0%) |
| $40,000 to $44,999 | 64 (8.6%) | 52 (7.0%) |
| $45,000 to $49,999 | 26 (3.5%) | 13 (1.8%) |
| $50,000 to $54,999 | 30 (4.0%) | 47 (6.4%) |
| $55,000 to $64,999 | 51 (6.9%) | 15 (2.0%) |
| $65,000 to $74,999 | 0 (0.0%) | 26 (3.5%) |
| $75,000 to $99,999 | 148 (19.9%) | 62 (8.4%) |
| $100,000+ | 258 (34.7%) | 122 (16.5%) |
| Total | 743 (100.0%) | 738 (100.0%) |
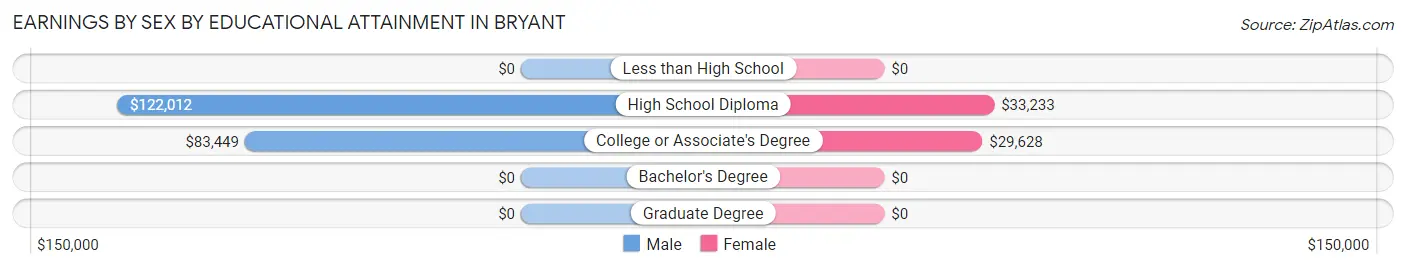
Earnings by Sex by Educational Attainment in Bryant
Average earnings in Bryant are $83,966 for men and $42,620 for women, a difference of 49.2%. Men with an educational attainment of high school diploma enjoy the highest average annual earnings of $122,012, while those with college or associate's degree education earn the least with $83,449. Women with an educational attainment of high school diploma earn the most with the average annual earnings of $33,233, while those with college or associate's degree education have the smallest earnings of $29,628.
| Educational Attainment | Male Income | Female Income |
| Less than High School | - | - |
| High School Diploma | $122,012 | $33,233 |
| College or Associate's Degree | $83,449 | $29,628 |
| Bachelor's Degree | - | - |
| Graduate Degree | - | - |
| Total | $83,966 | $42,620 |
Family Income in Bryant
Family Income Brackets in Bryant
According to the Bryant family income data, there are 355 families falling into the $100,000 to $149,999 income range, which is the most common income bracket and makes up 47.3% of all families.
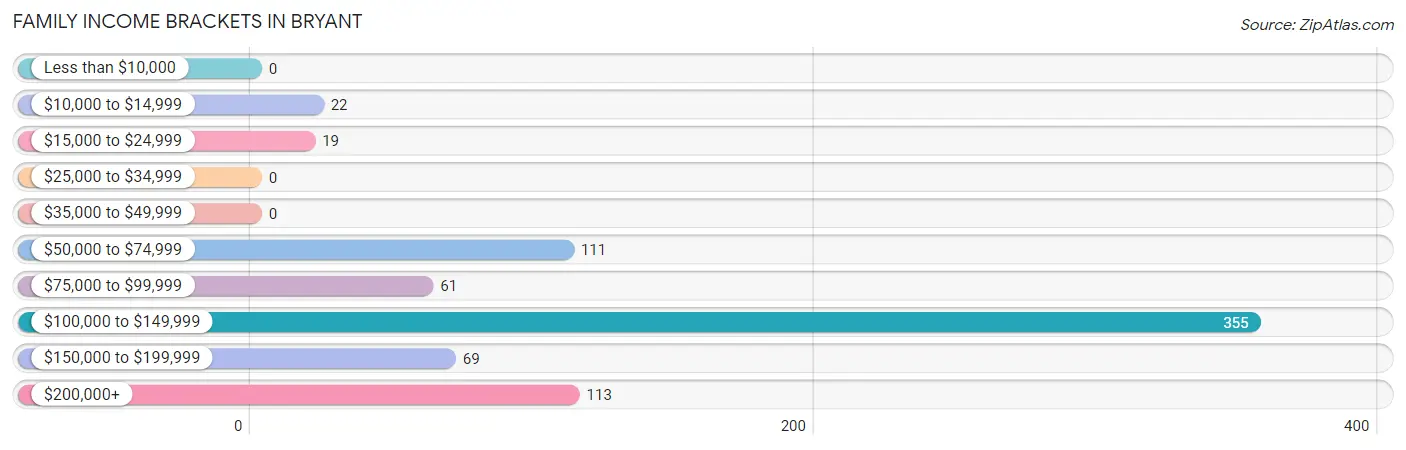
| Income Bracket | # Families | % Families |
| Less than $10,000 | 0 | 0.0% |
| $10,000 to $14,999 | 22 | 2.9% |
| $15,000 to $24,999 | 19 | 2.5% |
| $25,000 to $34,999 | 0 | 0.0% |
| $35,000 to $49,999 | 0 | 0.0% |
| $50,000 to $74,999 | 111 | 14.8% |
| $75,000 to $99,999 | 61 | 8.1% |
| $100,000 to $149,999 | 355 | 47.3% |
| $150,000 to $199,999 | 69 | 9.2% |
| $200,000+ | 113 | 15.1% |
Family Income by Famaliy Size in Bryant
2-person families (344 | 45.9%) account for the highest median family income in Bryant with $131,875 per family, while 2-person families (344 | 45.9%) have the highest median income of $65,938 per family member.
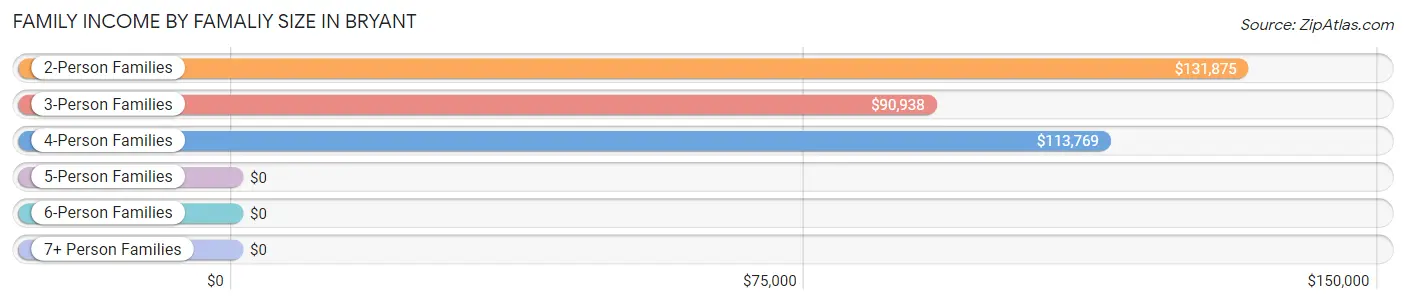
| Income Bracket | # Families | Median Income |
| 2-Person Families | 344 (45.9%) | $131,875 |
| 3-Person Families | 116 (15.5%) | $90,938 |
| 4-Person Families | 185 (24.7%) | $113,769 |
| 5-Person Families | 84 (11.2%) | $0 |
| 6-Person Families | 0 (0.0%) | $0 |
| 7+ Person Families | 21 (2.8%) | $0 |
| Total | 750 (100.0%) | $114,762 |
Family Income by Number of Earners in Bryant
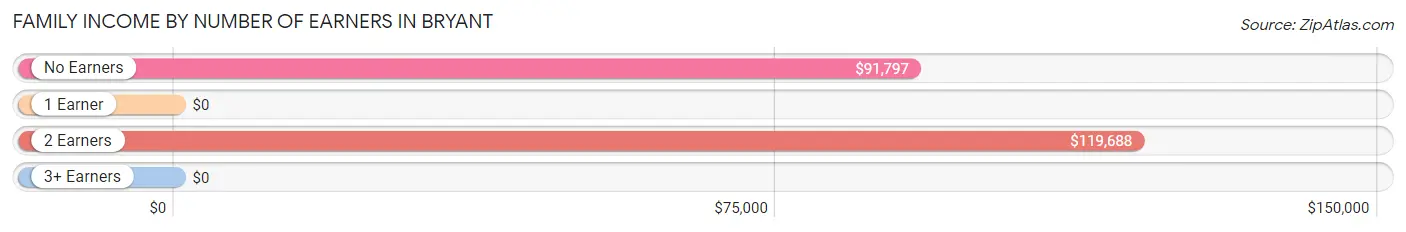
| Number of Earners | # Families | Median Income |
| No Earners | 97 (12.9%) | $91,797 |
| 1 Earner | 125 (16.7%) | $0 |
| 2 Earners | 405 (54.0%) | $119,688 |
| 3+ Earners | 123 (16.4%) | $0 |
| Total | 750 (100.0%) | $114,762 |
Household Income in Bryant
Household Income Brackets in Bryant
With 314 households falling in the category, the $100,000 to $149,999 income range is the most frequent in Bryant, accounting for 37.2% of all households.
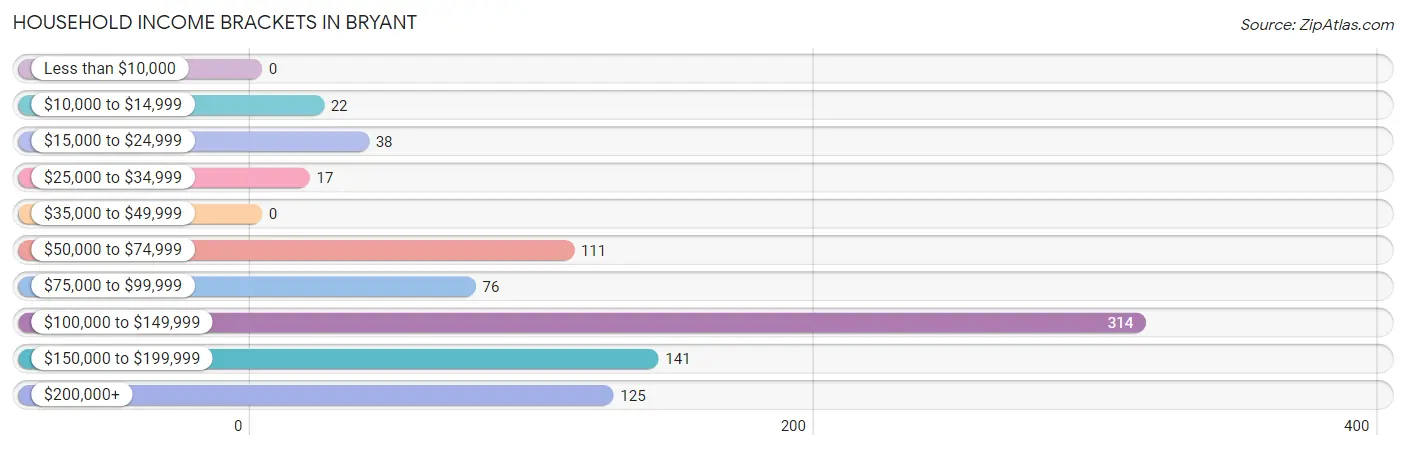
| Income Bracket | # Households | % Households |
| Less than $10,000 | 0 | 0.0% |
| $10,000 to $14,999 | 22 | 2.6% |
| $15,000 to $24,999 | 38 | 4.5% |
| $25,000 to $34,999 | 17 | 2.0% |
| $35,000 to $49,999 | 0 | 0.0% |
| $50,000 to $74,999 | 111 | 13.2% |
| $75,000 to $99,999 | 76 | 9.0% |
| $100,000 to $149,999 | 314 | 37.2% |
| $150,000 to $199,999 | 141 | 16.7% |
| $200,000+ | 125 | 14.8% |
Household Income by Householder Age in Bryant
The median household income in Bryant is $114,694, with the highest median household income of $135,227 found in the 45 to 64 years age bracket for the primary householder. A total of 478 households (56.6%) fall into this category.
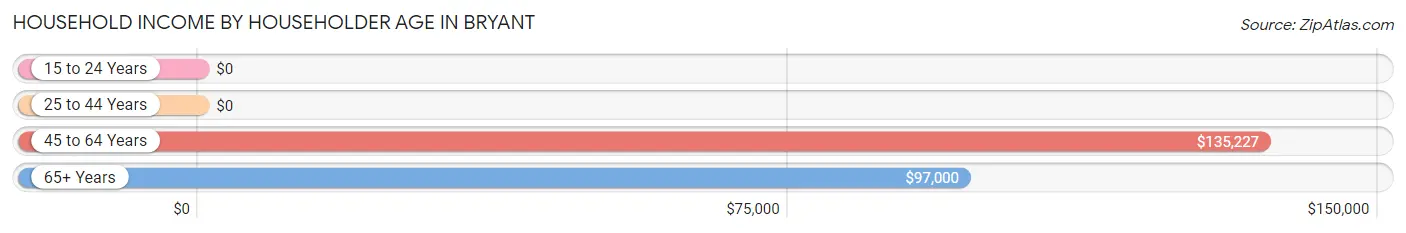
| Income Bracket | # Households | Median Income |
| 15 to 24 Years | 0 (0.0%) | $0 |
| 25 to 44 Years | 122 (14.4%) | $0 |
| 45 to 64 Years | 478 (56.6%) | $135,227 |
| 65+ Years | 244 (28.9%) | $97,000 |
| Total | 844 (100.0%) | $114,694 |
Poverty in Bryant
Income Below Poverty by Sex and Age in Bryant
With 1.7% poverty level for males and 5.7% for females among the residents of Bryant, under 5 year old males and under 5 year old females are the most vulnerable to poverty, with 20 males (100.0%) and 11 females (100.0%) in their respective age groups living below the poverty level.
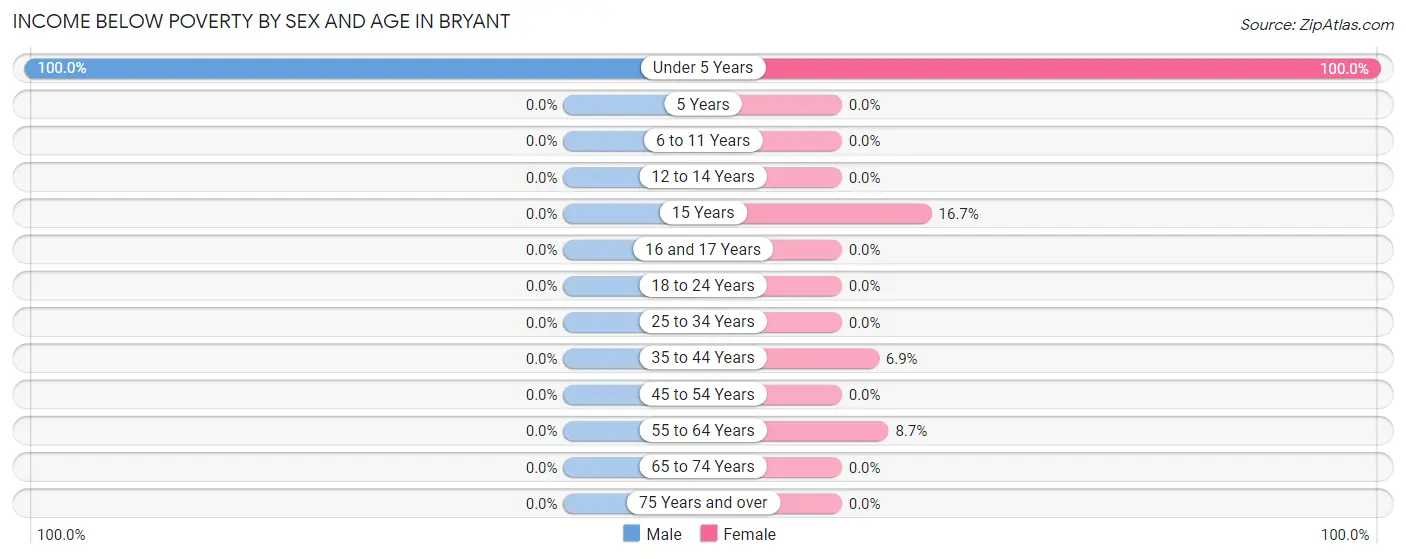
| Age Bracket | Male | Female |
| Under 5 Years | 20 (100.0%) | 11 (100.0%) |
| 5 Years | 0 (0.0%) | 0 (0.0%) |
| 6 to 11 Years | 0 (0.0%) | 0 (0.0%) |
| 12 to 14 Years | 0 (0.0%) | 0 (0.0%) |
| 15 Years | 0 (0.0%) | 20 (16.7%) |
| 16 and 17 Years | 0 (0.0%) | 0 (0.0%) |
| 18 to 24 Years | 0 (0.0%) | 0 (0.0%) |
| 25 to 34 Years | 0 (0.0%) | 0 (0.0%) |
| 35 to 44 Years | 0 (0.0%) | 19 (6.9%) |
| 45 to 54 Years | 0 (0.0%) | 0 (0.0%) |
| 55 to 64 Years | 0 (0.0%) | 22 (8.7%) |
| 65 to 74 Years | 0 (0.0%) | 0 (0.0%) |
| 75 Years and over | 0 (0.0%) | 0 (0.0%) |
| Total | 20 (1.7%) | 72 (5.7%) |
Income Above Poverty by Sex and Age in Bryant
According to the poverty statistics in Bryant, males aged 6 to 11 years and females aged 6 to 11 years are the age groups that are most secure financially, with 100.0% of males and 100.0% of females in these age groups living above the poverty line.
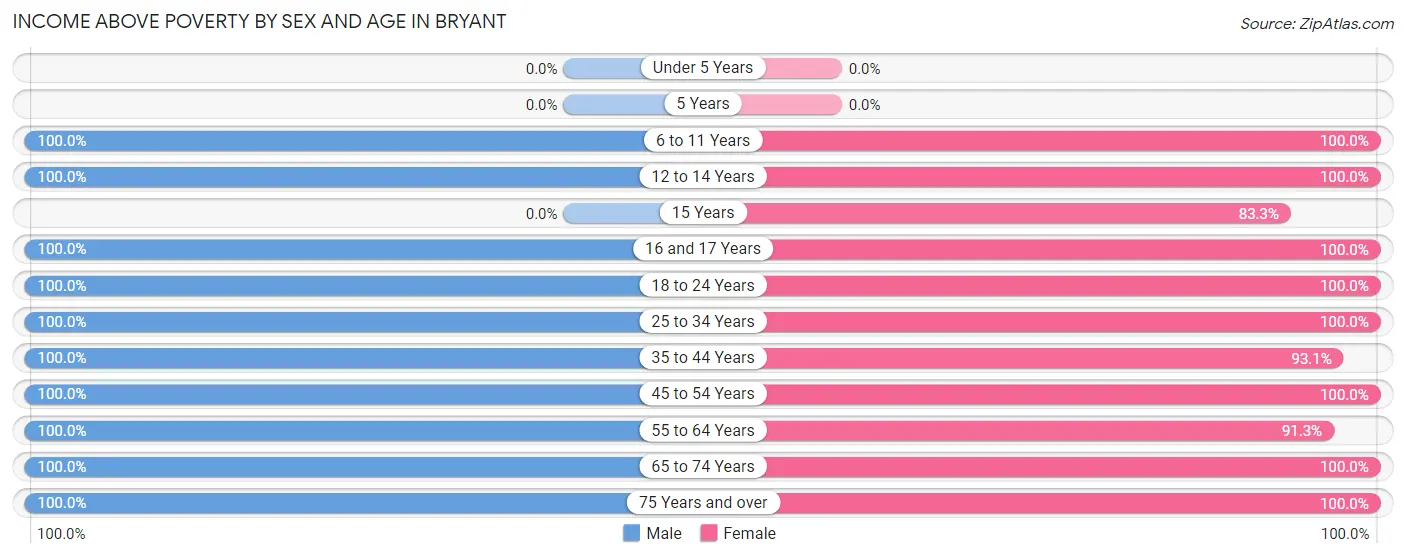
| Age Bracket | Male | Female |
| Under 5 Years | 0 (0.0%) | 0 (0.0%) |
| 5 Years | 0 (0.0%) | 0 (0.0%) |
| 6 to 11 Years | 200 (100.0%) | 74 (100.0%) |
| 12 to 14 Years | 29 (100.0%) | 21 (100.0%) |
| 15 Years | 0 (0.0%) | 100 (83.3%) |
| 16 and 17 Years | 78 (100.0%) | 69 (100.0%) |
| 18 to 24 Years | 56 (100.0%) | 27 (100.0%) |
| 25 to 34 Years | 77 (100.0%) | 85 (100.0%) |
| 35 to 44 Years | 21 (100.0%) | 257 (93.1%) |
| 45 to 54 Years | 364 (100.0%) | 119 (100.0%) |
| 55 to 64 Years | 130 (100.0%) | 232 (91.3%) |
| 65 to 74 Years | 136 (100.0%) | 143 (100.0%) |
| 75 Years and over | 94 (100.0%) | 72 (100.0%) |
| Total | 1,185 (98.3%) | 1,199 (94.3%) |
Income Below Poverty Among Married-Couple Families in Bryant
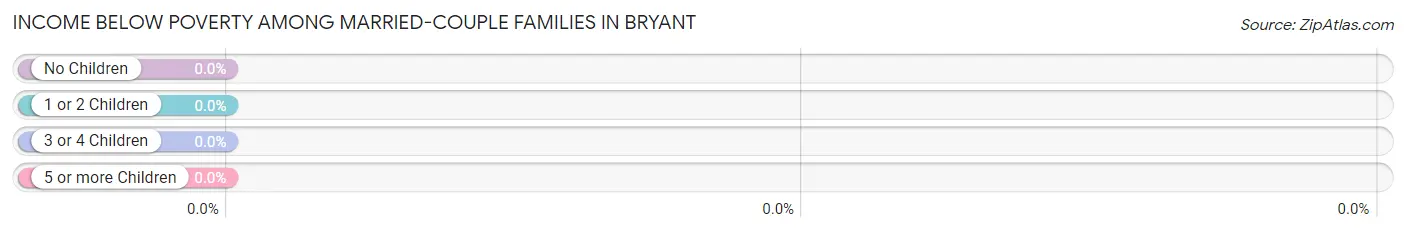
| Children | Above Poverty | Below Poverty |
| No Children | 371 (100.0%) | 0 (0.0%) |
| 1 or 2 Children | 176 (100.0%) | 0 (0.0%) |
| 3 or 4 Children | 77 (100.0%) | 0 (0.0%) |
| 5 or more Children | 0 (0.0%) | 0 (0.0%) |
| Total | 624 (100.0%) | 0 (0.0%) |
Income Below Poverty Among Single-Parent Households in Bryant
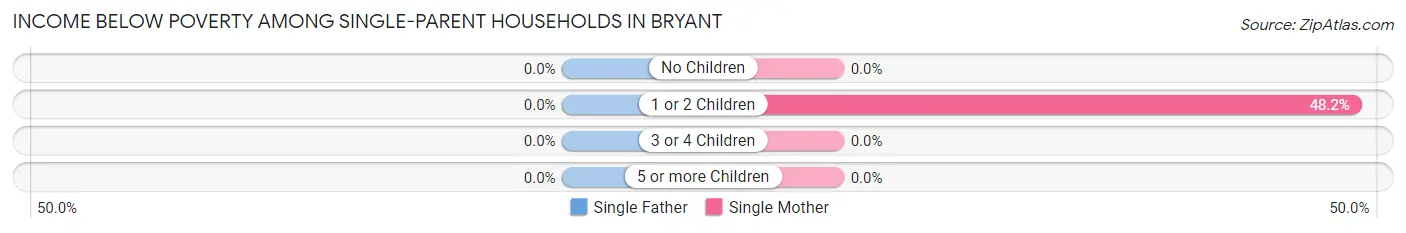
| Children | Single Father | Single Mother |
| No Children | 0 (0.0%) | 0 (0.0%) |
| 1 or 2 Children | 0 (0.0%) | 41 (48.2%) |
| 3 or 4 Children | 0 (0.0%) | 0 (0.0%) |
| 5 or more Children | 0 (0.0%) | 0 (0.0%) |
| Total | 0 (0.0%) | 41 (48.2%) |
Income Below Poverty Among Married-Couple vs Single-Parent Households in Bryant
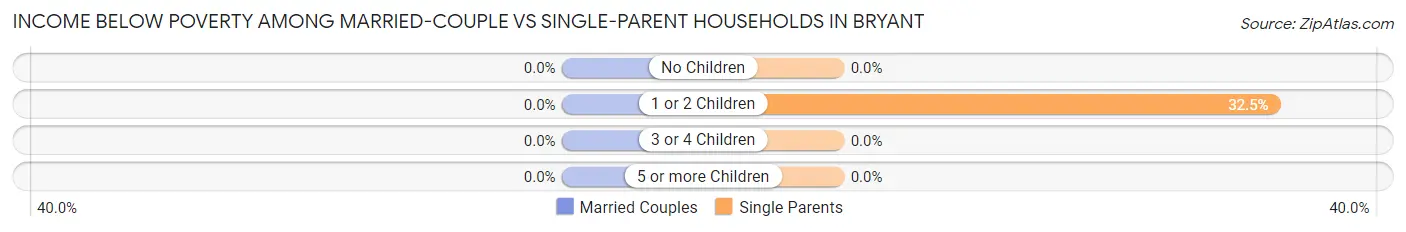
| Children | Married-Couple Families | Single-Parent Households |
| No Children | 0 (0.0%) | 0 (0.0%) |
| 1 or 2 Children | 0 (0.0%) | 41 (32.5%) |
| 3 or 4 Children | 0 (0.0%) | 0 (0.0%) |
| 5 or more Children | 0 (0.0%) | 0 (0.0%) |
| Total | 0 (0.0%) | 41 (32.5%) |
Race in Bryant
The most populous races in Bryant are White / Caucasian (1,753 | 70.5%), Two or more Races (701 | 28.2%), and Hispanic or Latino (61 | 2.5%).
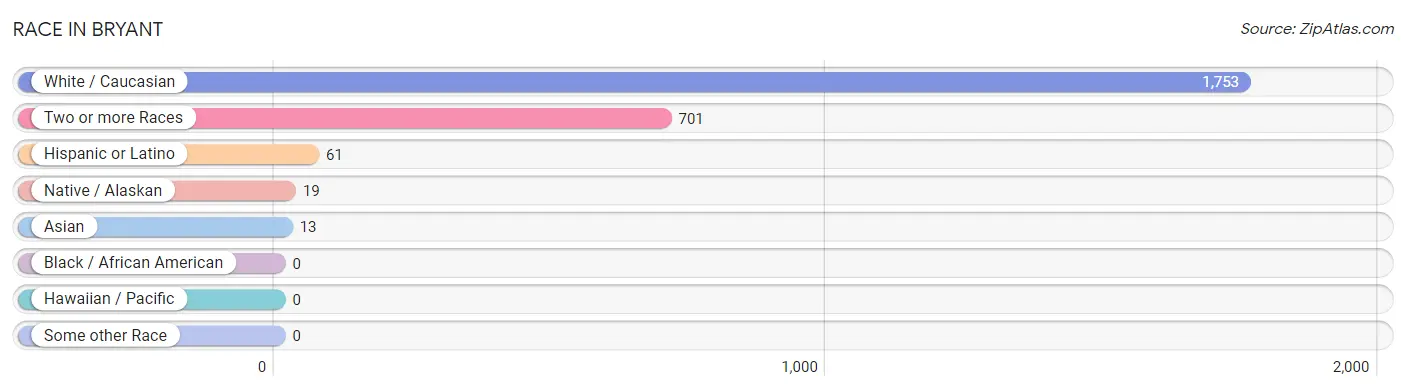
| Race | # Population | % Population |
| Asian | 13 | 0.5% |
| Black / African American | 0 | 0.0% |
| Hawaiian / Pacific | 0 | 0.0% |
| Hispanic or Latino | 61 | 2.5% |
| Native / Alaskan | 19 | 0.8% |
| White / Caucasian | 1,753 | 70.5% |
| Two or more Races | 701 | 28.2% |
| Some other Race | 0 | 0.0% |
| Total | 2,486 | 100.0% |
Ancestry in Bryant
The most populous ancestries reported in Bryant are German (317 | 12.8%), English (236 | 9.5%), Norwegian (198 | 8.0%), Irish (130 | 5.2%), and French (102 | 4.1%), together accounting for 39.5% of all Bryant residents.
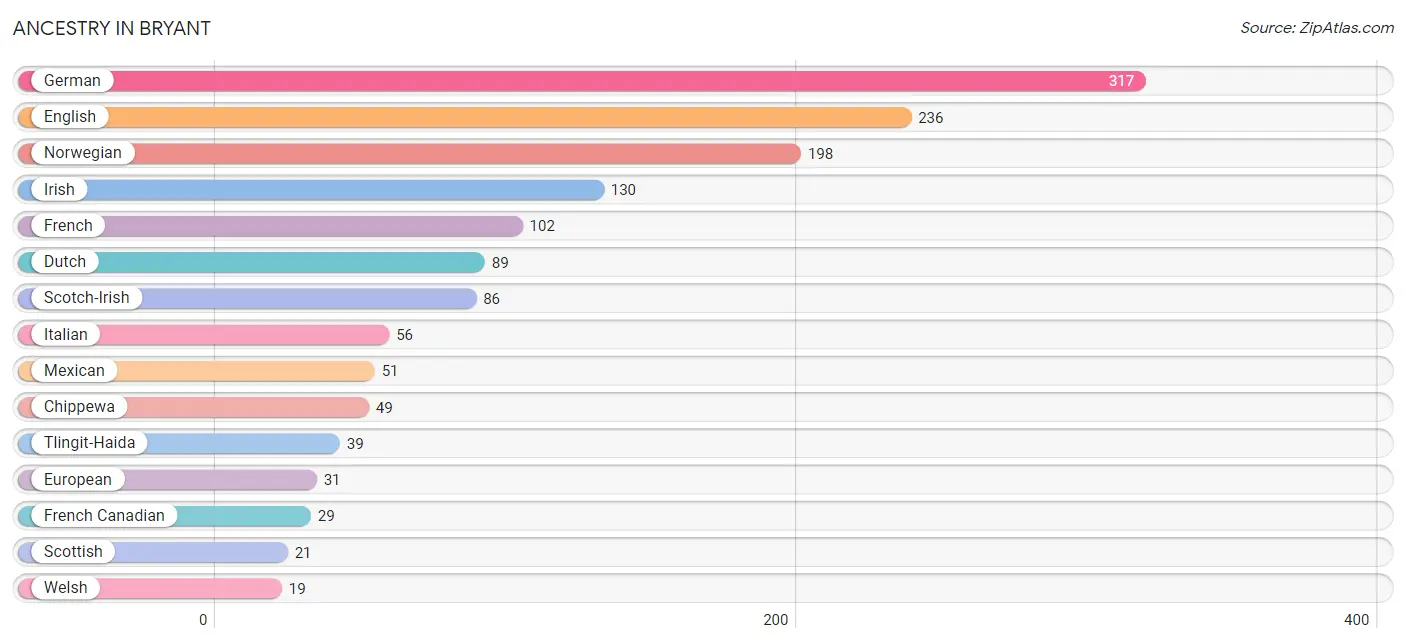
| Ancestry | # Population | % Population |
| African | 10 | 0.4% |
| Bhutanese | 13 | 0.5% |
| Chippewa | 49 | 2.0% |
| Czech | 10 | 0.4% |
| Dutch | 89 | 3.6% |
| English | 236 | 9.5% |
| European | 31 | 1.3% |
| French | 102 | 4.1% |
| French Canadian | 29 | 1.2% |
| German | 317 | 12.8% |
| Irish | 130 | 5.2% |
| Italian | 56 | 2.2% |
| Korean | 17 | 0.7% |
| Mexican | 51 | 2.1% |
| Norwegian | 198 | 8.0% |
| Polish | 10 | 0.4% |
| Russian | 12 | 0.5% |
| Scotch-Irish | 86 | 3.5% |
| Scottish | 21 | 0.8% |
| Spaniard | 10 | 0.4% |
| Subsaharan African | 10 | 0.4% |
| Swiss | 14 | 0.6% |
| Tlingit-Haida | 39 | 1.6% |
| Welsh | 19 | 0.8% | View All 24 Rows |
Immigrants in Bryant

| Immigration Origin | # Population | % Population | View All 0 Rows |
Sex and Age in Bryant
Sex and Age in Bryant
The most populous age groups in Bryant are 50 to 54 Years (214 | 17.6%) for men and 15 to 19 Years (189 | 14.9%) for women.
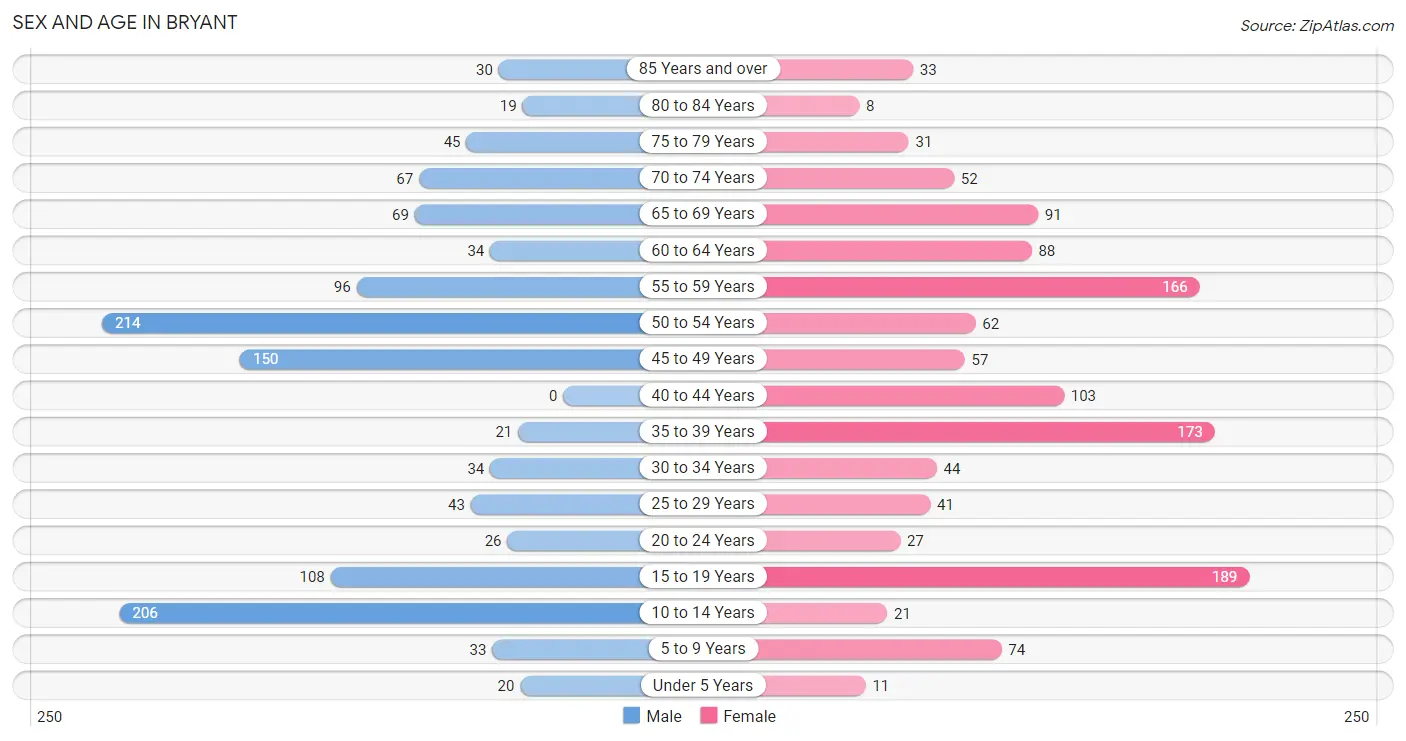
| Age Bracket | Male | Female |
| Under 5 Years | 20 (1.7%) | 11 (0.9%) |
| 5 to 9 Years | 33 (2.7%) | 74 (5.8%) |
| 10 to 14 Years | 206 (17.0%) | 21 (1.7%) |
| 15 to 19 Years | 108 (8.9%) | 189 (14.9%) |
| 20 to 24 Years | 26 (2.1%) | 27 (2.1%) |
| 25 to 29 Years | 43 (3.5%) | 41 (3.2%) |
| 30 to 34 Years | 34 (2.8%) | 44 (3.5%) |
| 35 to 39 Years | 21 (1.7%) | 173 (13.6%) |
| 40 to 44 Years | 0 (0.0%) | 103 (8.1%) |
| 45 to 49 Years | 150 (12.3%) | 57 (4.5%) |
| 50 to 54 Years | 214 (17.6%) | 62 (4.9%) |
| 55 to 59 Years | 96 (7.9%) | 166 (13.1%) |
| 60 to 64 Years | 34 (2.8%) | 88 (6.9%) |
| 65 to 69 Years | 69 (5.7%) | 91 (7.2%) |
| 70 to 74 Years | 67 (5.5%) | 52 (4.1%) |
| 75 to 79 Years | 45 (3.7%) | 31 (2.4%) |
| 80 to 84 Years | 19 (1.6%) | 8 (0.6%) |
| 85 Years and over | 30 (2.5%) | 33 (2.6%) |
| Total | 1,215 (100.0%) | 1,271 (100.0%) |
Families and Households in Bryant
Median Family Size in Bryant
The median family size in Bryant is 3.04 persons per family, with married-couple families (624 | 83.2%) accounting for the largest median family size of 3.25 persons per family. On the other hand, single male/father families (41 | 5.5%) represent the smallest median family size with 1.78 persons per family.
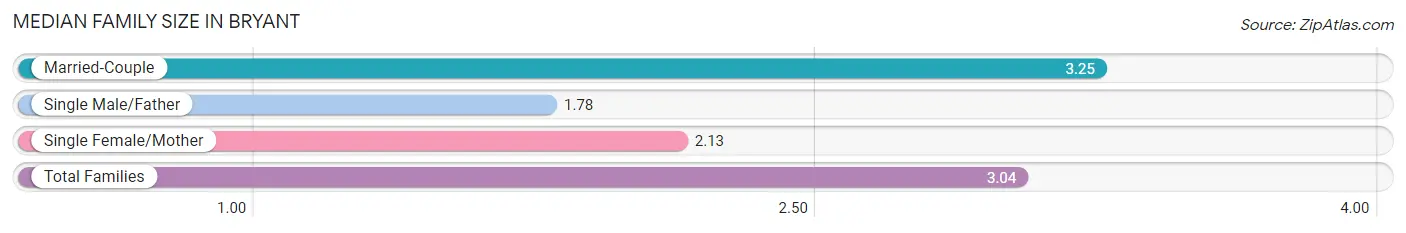
| Family Type | # Families | Family Size |
| Married-Couple | 624 (83.2%) | 3.25 |
| Single Male/Father | 41 (5.5%) | 1.78 |
| Single Female/Mother | 85 (11.3%) | 2.13 |
| Total Families | 750 (100.0%) | 3.04 |
Median Household Size in Bryant
The median household size in Bryant is 2.95 persons per household, with married-couple households (624 | 73.9%) accounting for the largest median household size of 3.27 persons per household. non-family households (94 | 11.1%) represent the smallest median household size with 1.55 persons per household.
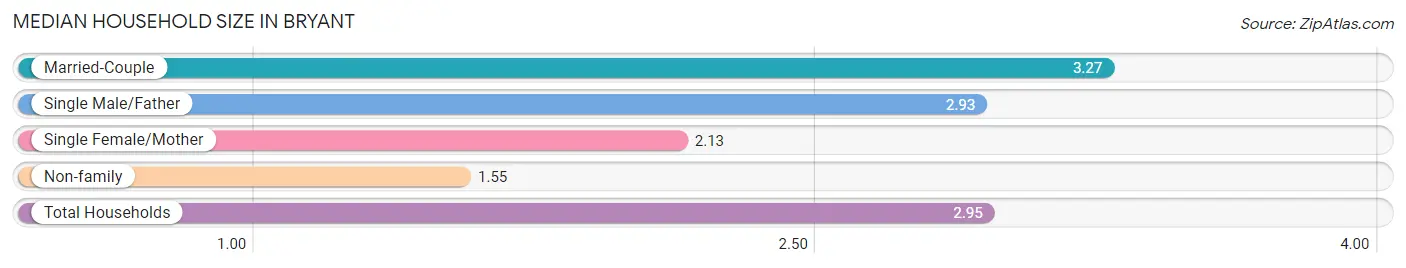
| Household Type | # Households | Household Size |
| Married-Couple | 624 (73.9%) | 3.27 |
| Single Male/Father | 41 (4.9%) | 2.93 |
| Single Female/Mother | 85 (10.1%) | 2.13 |
| Non-family | 94 (11.1%) | 1.55 |
| Total Households | 844 (100.0%) | 2.95 |
Household Size by Marriage Status in Bryant
Out of a total of 844 households in Bryant, 750 (88.9%) are family households, while 94 (11.1%) are nonfamily households. The most numerous type of family households are 2-person households, comprising 303, and the most common type of nonfamily households are 2-person households, comprising 58.
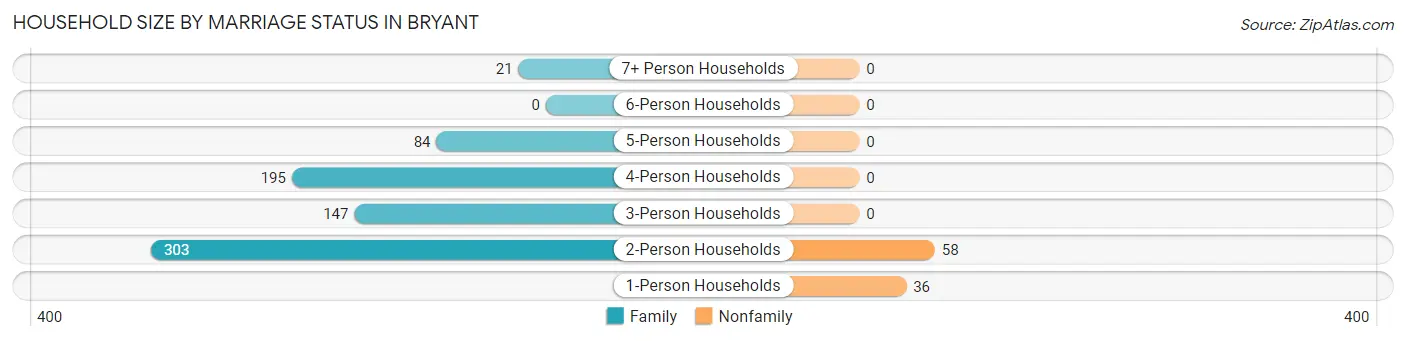
| Household Size | Family Households | Nonfamily Households |
| 1-Person Households | - | 36 (4.3%) |
| 2-Person Households | 303 (35.9%) | 58 (6.9%) |
| 3-Person Households | 147 (17.4%) | 0 (0.0%) |
| 4-Person Households | 195 (23.1%) | 0 (0.0%) |
| 5-Person Households | 84 (10.0%) | 0 (0.0%) |
| 6-Person Households | 0 (0.0%) | 0 (0.0%) |
| 7+ Person Households | 21 (2.5%) | 0 (0.0%) |
| Total | 750 (88.9%) | 94 (11.1%) |
Female Fertility in Bryant
Fertility by Age in Bryant
| Age Bracket | Women with Births | Births / 1,000 Women |
| 15 to 19 years | 0 (0.0%) | 0.0 |
| 20 to 34 years | 0 (0.0%) | 0.0 |
| 35 to 50 years | 0 (0.0%) | 0.0 |
| Total | 0 (0.0%) | 0.0 |
Fertility by Age by Marriage Status in Bryant
| Age Bracket | Married | Unmarried |
| 15 to 19 years | 0 (0.0%) | 0 (0.0%) |
| 20 to 34 years | 0 (0.0%) | 0 (0.0%) |
| 35 to 50 years | 0 (0.0%) | 0 (0.0%) |
| Total | 0 (0.0%) | 0 (0.0%) |
Fertility by Education in Bryant
| Educational Attainment | Women with Births | Births / 1,000 Women |
| Less than High School | 0 (0.0%) | 0.0 |
| High School Diploma | 0 (0.0%) | 0.0 |
| College or Associate's Degree | 0 (0.0%) | 0.0 |
| Bachelor's Degree | 0 (0.0%) | 0.0 |
| Graduate Degree | 0 (0.0%) | 0.0 |
| Total | 0 (0.0%) | 0.0 |
Fertility by Education by Marriage Status in Bryant
| Educational Attainment | Married | Unmarried |
| Less than High School | 0 (0.0%) | 0 (0.0%) |
| High School Diploma | 0 (0.0%) | 0 (0.0%) |
| College or Associate's Degree | 0 (0.0%) | 0 (0.0%) |
| Bachelor's Degree | 0 (0.0%) | 0 (0.0%) |
| Graduate Degree | 0 (0.0%) | 0 (0.0%) |
| Total | 0 (0.0%) | 0 (0.0%) |
Employment Characteristics in Bryant
Employment by Class of Employer in Bryant
Among the 1,412 employed individuals in Bryant, private company employees (956 | 67.7%), local government employees (223 | 15.8%), and self-employed (not incorporated) (155 | 11.0%) make up the most common classes of employment.
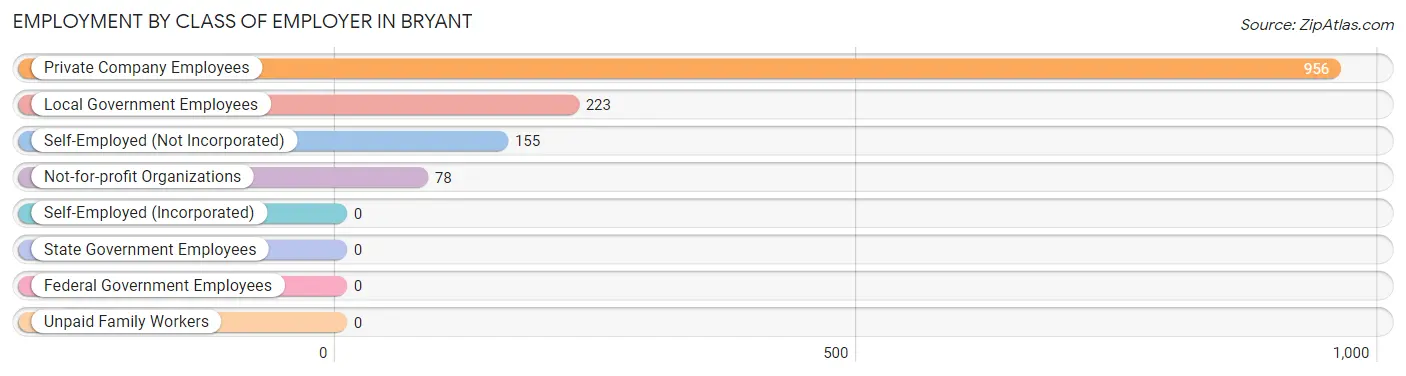
| Employer Class | # Employees | % Employees |
| Private Company Employees | 956 | 67.7% |
| Self-Employed (Incorporated) | 0 | 0.0% |
| Self-Employed (Not Incorporated) | 155 | 11.0% |
| Not-for-profit Organizations | 78 | 5.5% |
| Local Government Employees | 223 | 15.8% |
| State Government Employees | 0 | 0.0% |
| Federal Government Employees | 0 | 0.0% |
| Unpaid Family Workers | 0 | 0.0% |
| Total | 1,412 | 100.0% |
Employment Status by Age in Bryant
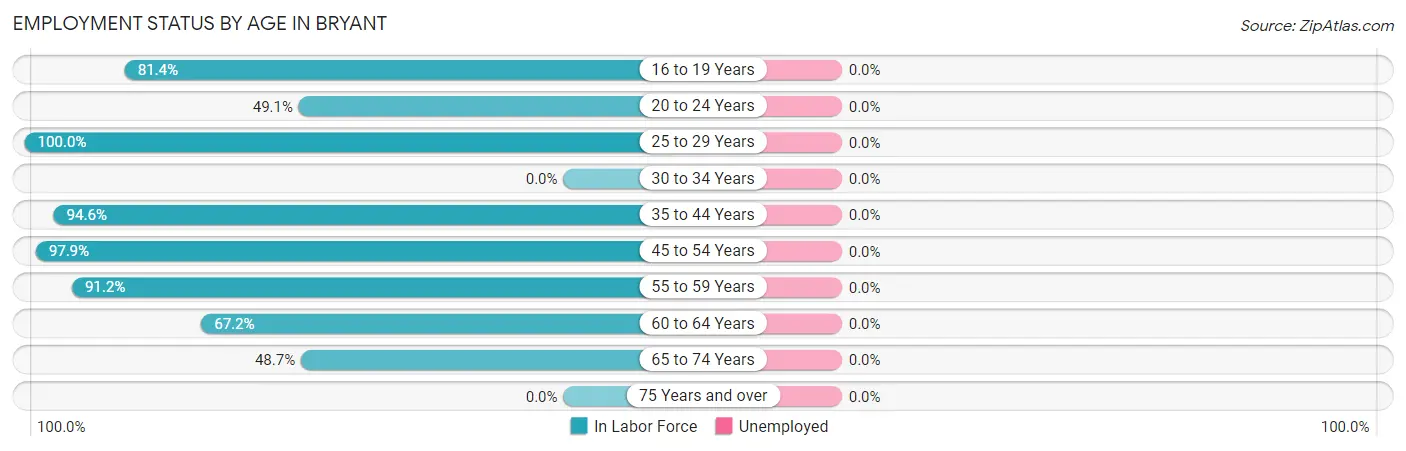
| Age Bracket | In Labor Force | Unemployed |
| 16 to 19 Years | 144 (81.4%) | 0 (0.0%) |
| 20 to 24 Years | 26 (49.1%) | 0 (0.0%) |
| 25 to 29 Years | 84 (100.0%) | 0 (0.0%) |
| 30 to 34 Years | 0 (0.0%) | 0 (0.0%) |
| 35 to 44 Years | 281 (94.6%) | 0 (0.0%) |
| 45 to 54 Years | 473 (97.9%) | 0 (0.0%) |
| 55 to 59 Years | 239 (91.2%) | 0 (0.0%) |
| 60 to 64 Years | 82 (67.2%) | 0 (0.0%) |
| 65 to 74 Years | 136 (48.7%) | 0 (0.0%) |
| 75 Years and over | 0 (0.0%) | 0 (0.0%) |
| Total | 1,465 (73.2%) | 0 (0.0%) |
Employment Status by Educational Attainment in Bryant
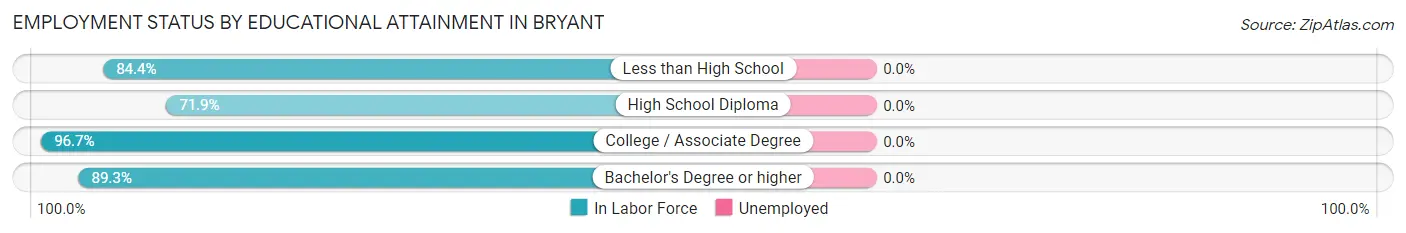
| Educational Attainment | In Labor Force | Unemployed |
| Less than High School | 119 (84.4%) | 0 (0.0%) |
| High School Diploma | 241 (71.9%) | 0 (0.0%) |
| College / Associate Degree | 524 (96.7%) | 0 (0.0%) |
| Bachelor's Degree or higher | 275 (89.3%) | 0 (0.0%) |
| Total | 1,159 (87.4%) | 0 (0.0%) |
Employment Occupations by Sex in Bryant
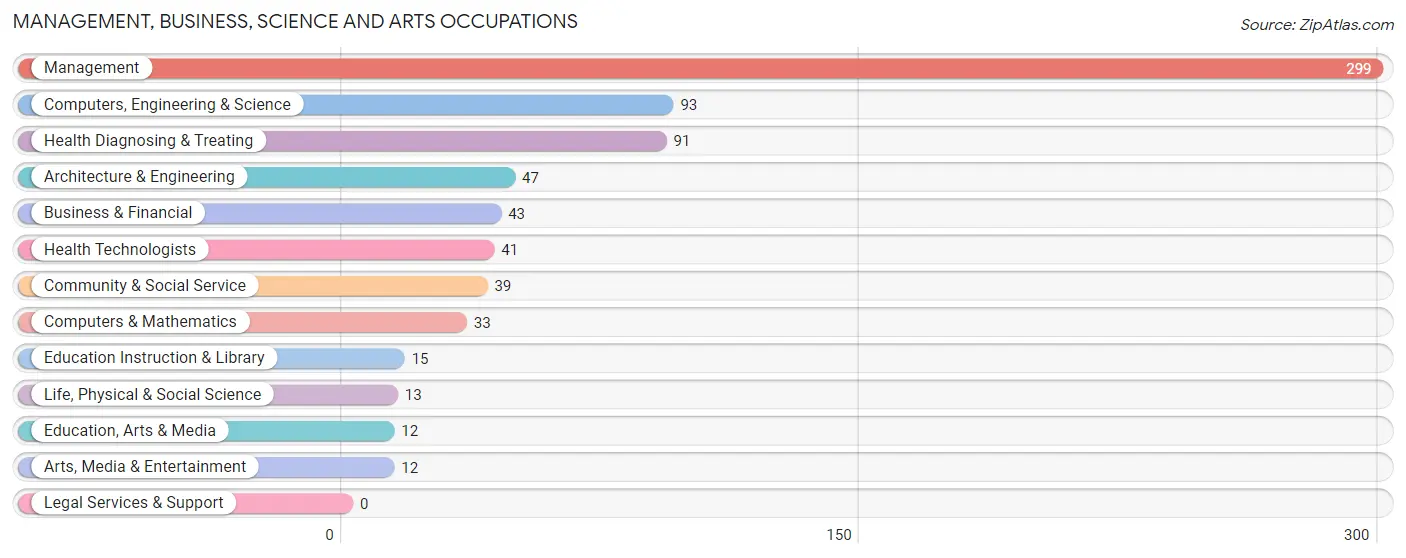
Management, Business, Science and Arts Occupations
The most common Management, Business, Science and Arts occupations in Bryant are Management (299 | 20.4%), Computers, Engineering & Science (93 | 6.4%), Health Diagnosing & Treating (91 | 6.2%), Architecture & Engineering (47 | 3.2%), and Business & Financial (43 | 2.9%).
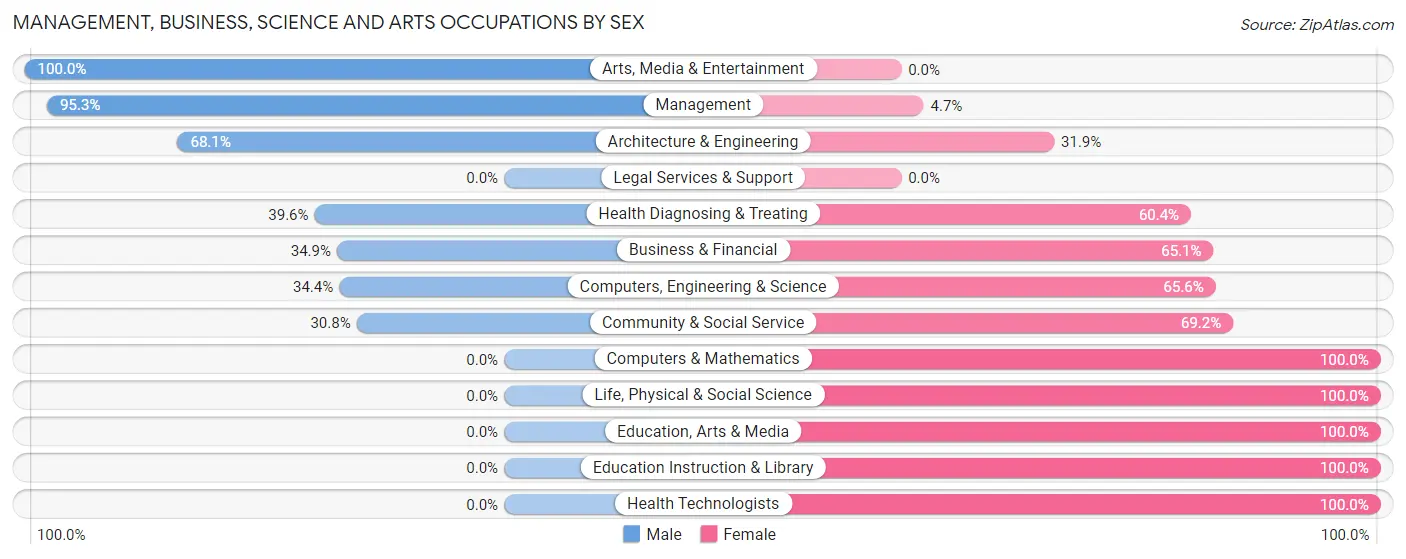
Management, Business, Science and Arts Occupations by Sex
Within the Management, Business, Science and Arts occupations in Bryant, the most male-oriented occupations are Arts, Media & Entertainment (100.0%), Management (95.3%), and Architecture & Engineering (68.1%), while the most female-oriented occupations are Computers & Mathematics (100.0%), Life, Physical & Social Science (100.0%), and Education, Arts & Media (100.0%).
| Occupation | Male | Female |
| Management | 285 (95.3%) | 14 (4.7%) |
| Business & Financial | 15 (34.9%) | 28 (65.1%) |
| Computers, Engineering & Science | 32 (34.4%) | 61 (65.6%) |
| Computers & Mathematics | 0 (0.0%) | 33 (100.0%) |
| Architecture & Engineering | 32 (68.1%) | 15 (31.9%) |
| Life, Physical & Social Science | 0 (0.0%) | 13 (100.0%) |
| Community & Social Service | 12 (30.8%) | 27 (69.2%) |
| Education, Arts & Media | 0 (0.0%) | 12 (100.0%) |
| Legal Services & Support | 0 (0.0%) | 0 (0.0%) |
| Education Instruction & Library | 0 (0.0%) | 15 (100.0%) |
| Arts, Media & Entertainment | 12 (100.0%) | 0 (0.0%) |
| Health Diagnosing & Treating | 36 (39.6%) | 55 (60.4%) |
| Health Technologists | 0 (0.0%) | 41 (100.0%) |
| Total (Category) | 380 (67.3%) | 185 (32.7%) |
| Total (Overall) | 727 (49.6%) | 738 (50.4%) |
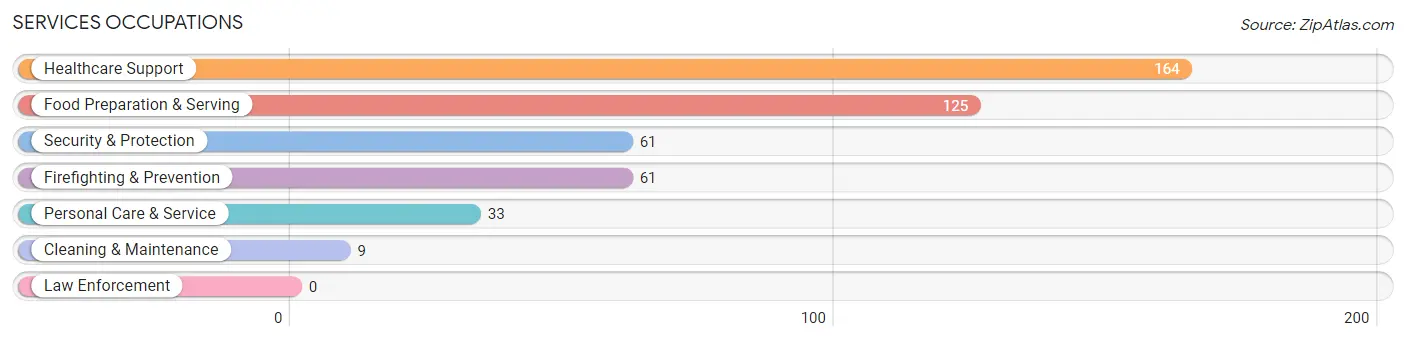
Services Occupations
The most common Services occupations in Bryant are Healthcare Support (164 | 11.2%), Food Preparation & Serving (125 | 8.5%), Security & Protection (61 | 4.2%), Firefighting & Prevention (61 | 4.2%), and Personal Care & Service (33 | 2.2%).
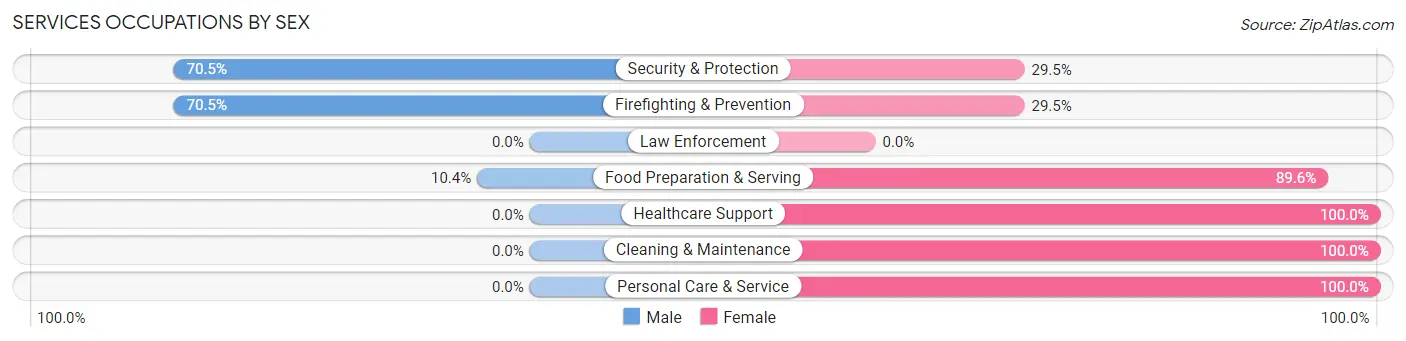
Services Occupations by Sex
Within the Services occupations in Bryant, the most male-oriented occupations are Security & Protection (70.5%), Firefighting & Prevention (70.5%), and Food Preparation & Serving (10.4%), while the most female-oriented occupations are Healthcare Support (100.0%), Cleaning & Maintenance (100.0%), and Personal Care & Service (100.0%).
| Occupation | Male | Female |
| Healthcare Support | 0 (0.0%) | 164 (100.0%) |
| Security & Protection | 43 (70.5%) | 18 (29.5%) |
| Firefighting & Prevention | 43 (70.5%) | 18 (29.5%) |
| Law Enforcement | 0 (0.0%) | 0 (0.0%) |
| Food Preparation & Serving | 13 (10.4%) | 112 (89.6%) |
| Cleaning & Maintenance | 0 (0.0%) | 9 (100.0%) |
| Personal Care & Service | 0 (0.0%) | 33 (100.0%) |
| Total (Category) | 56 (14.3%) | 336 (85.7%) |
| Total (Overall) | 727 (49.6%) | 738 (50.4%) |
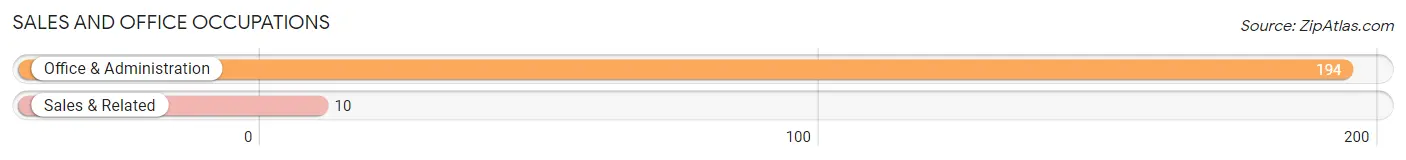
Sales and Office Occupations
The most common Sales and Office occupations in Bryant are Office & Administration (194 | 13.2%), and Sales & Related (10 | 0.7%).
Sales and Office Occupations by Sex
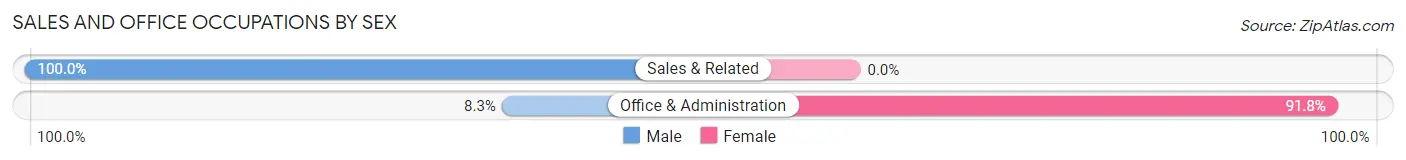
| Occupation | Male | Female |
| Sales & Related | 10 (100.0%) | 0 (0.0%) |
| Office & Administration | 16 (8.3%) | 178 (91.7%) |
| Total (Category) | 26 (12.8%) | 178 (87.3%) |
| Total (Overall) | 727 (49.6%) | 738 (50.4%) |
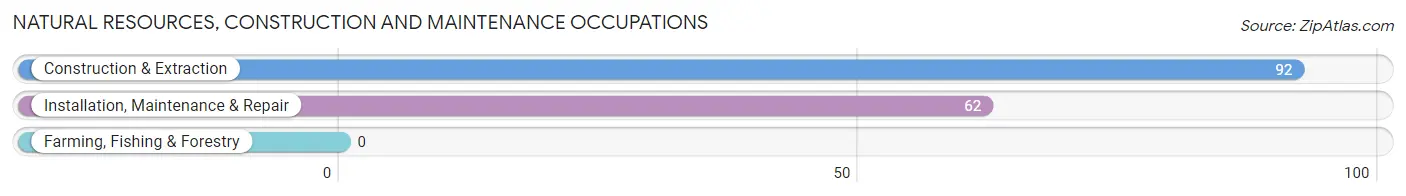
Natural Resources, Construction and Maintenance Occupations
The most common Natural Resources, Construction and Maintenance occupations in Bryant are Construction & Extraction (92 | 6.3%), and Installation, Maintenance & Repair (62 | 4.2%).
Natural Resources, Construction and Maintenance Occupations by Sex
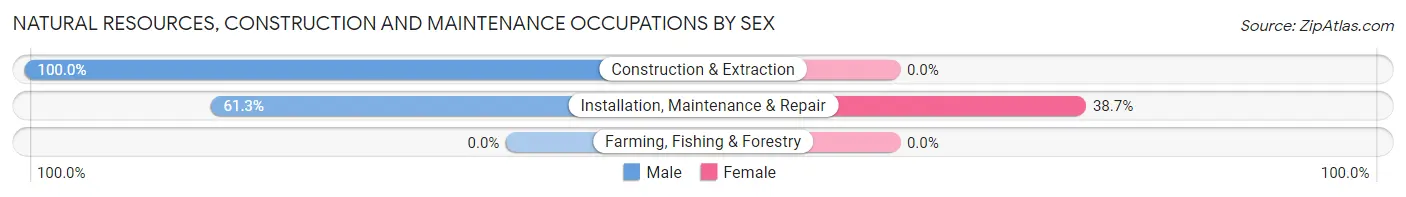
| Occupation | Male | Female |
| Farming, Fishing & Forestry | 0 (0.0%) | 0 (0.0%) |
| Construction & Extraction | 92 (100.0%) | 0 (0.0%) |
| Installation, Maintenance & Repair | 38 (61.3%) | 24 (38.7%) |
| Total (Category) | 130 (84.4%) | 24 (15.6%) |
| Total (Overall) | 727 (49.6%) | 738 (50.4%) |
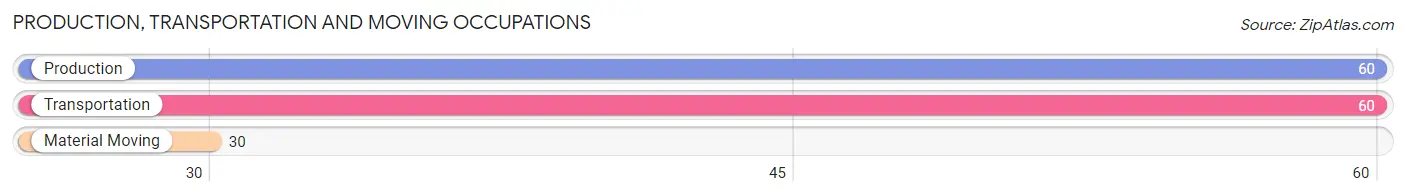
Production, Transportation and Moving Occupations
The most common Production, Transportation and Moving occupations in Bryant are Production (60 | 4.1%), Transportation (60 | 4.1%), and Material Moving (30 | 2.1%).
Production, Transportation and Moving Occupations by Sex
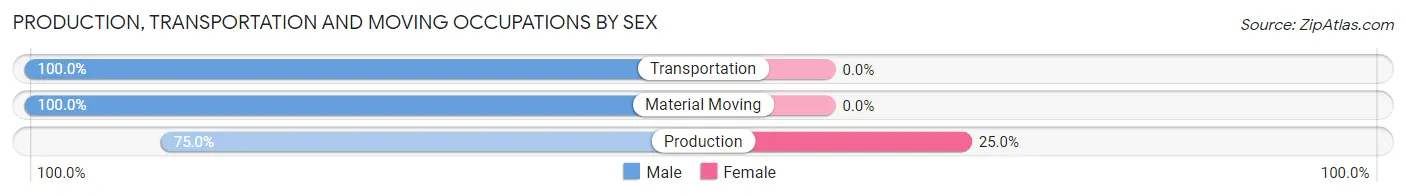
| Occupation | Male | Female |
| Production | 45 (75.0%) | 15 (25.0%) |
| Transportation | 60 (100.0%) | 0 (0.0%) |
| Material Moving | 30 (100.0%) | 0 (0.0%) |
| Total (Category) | 135 (90.0%) | 15 (10.0%) |
| Total (Overall) | 727 (49.6%) | 738 (50.4%) |
Employment Industries by Sex in Bryant
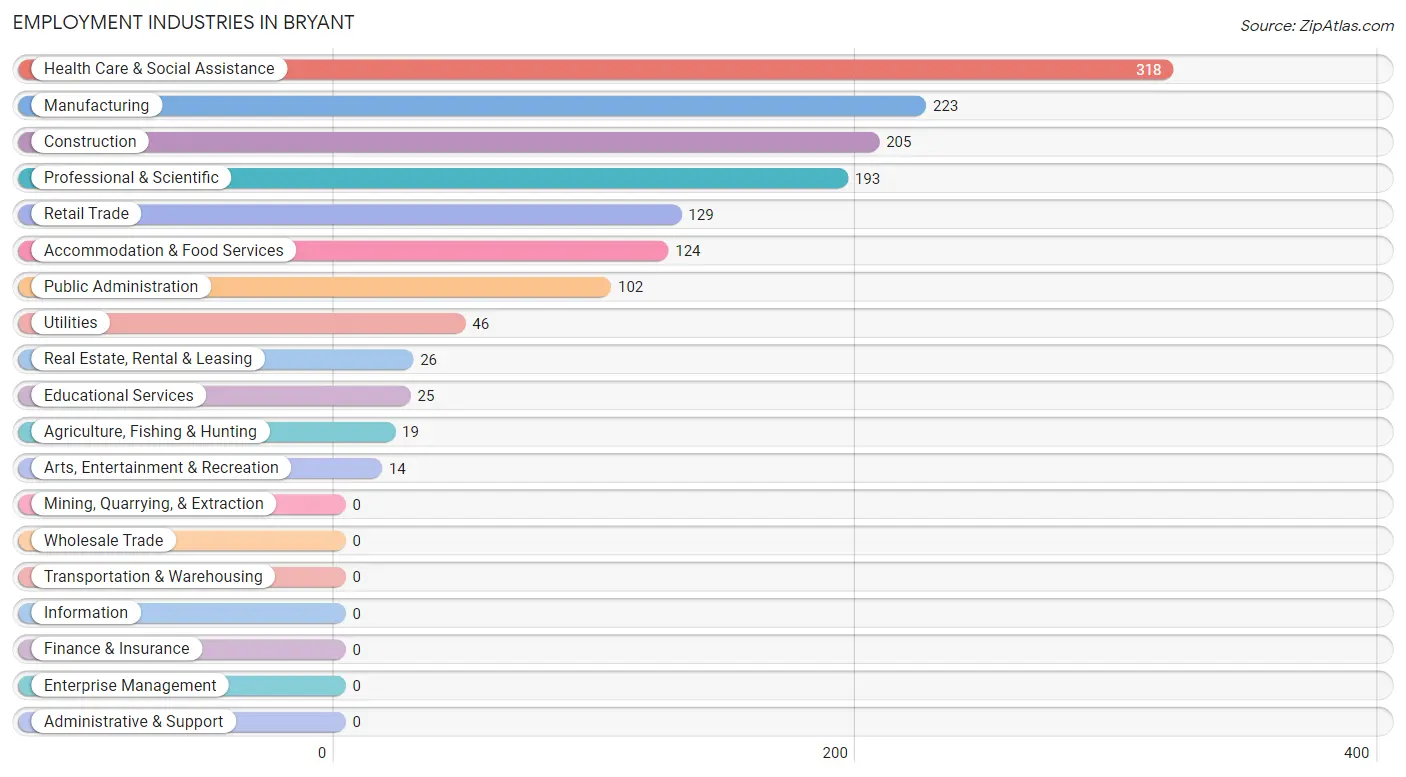
Employment Industries in Bryant
The major employment industries in Bryant include Health Care & Social Assistance (318 | 21.7%), Manufacturing (223 | 15.2%), Construction (205 | 14.0%), Professional & Scientific (193 | 13.2%), and Retail Trade (129 | 8.8%).
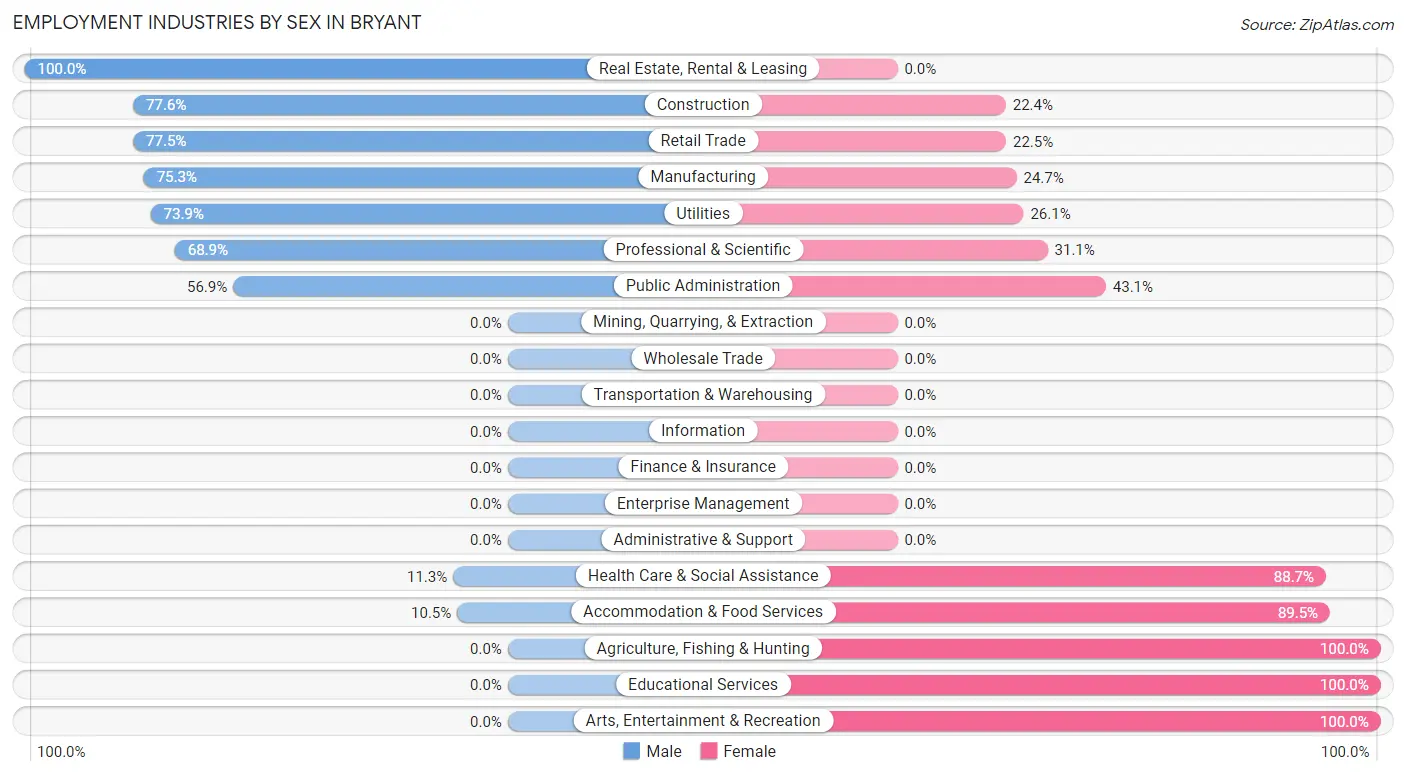
Employment Industries by Sex in Bryant
The Bryant industries that see more men than women are Real Estate, Rental & Leasing (100.0%), Construction (77.6%), and Retail Trade (77.5%), whereas the industries that tend to have a higher number of women are Agriculture, Fishing & Hunting (100.0%), Educational Services (100.0%), and Arts, Entertainment & Recreation (100.0%).
| Industry | Male | Female |
| Agriculture, Fishing & Hunting | 0 (0.0%) | 19 (100.0%) |
| Mining, Quarrying, & Extraction | 0 (0.0%) | 0 (0.0%) |
| Construction | 159 (77.6%) | 46 (22.4%) |
| Manufacturing | 168 (75.3%) | 55 (24.7%) |
| Wholesale Trade | 0 (0.0%) | 0 (0.0%) |
| Retail Trade | 100 (77.5%) | 29 (22.5%) |
| Transportation & Warehousing | 0 (0.0%) | 0 (0.0%) |
| Utilities | 34 (73.9%) | 12 (26.1%) |
| Information | 0 (0.0%) | 0 (0.0%) |
| Finance & Insurance | 0 (0.0%) | 0 (0.0%) |
| Real Estate, Rental & Leasing | 26 (100.0%) | 0 (0.0%) |
| Professional & Scientific | 133 (68.9%) | 60 (31.1%) |
| Enterprise Management | 0 (0.0%) | 0 (0.0%) |
| Administrative & Support | 0 (0.0%) | 0 (0.0%) |
| Educational Services | 0 (0.0%) | 25 (100.0%) |
| Health Care & Social Assistance | 36 (11.3%) | 282 (88.7%) |
| Arts, Entertainment & Recreation | 0 (0.0%) | 14 (100.0%) |
| Accommodation & Food Services | 13 (10.5%) | 111 (89.5%) |
| Public Administration | 58 (56.9%) | 44 (43.1%) |
| Total | 727 (49.6%) | 738 (50.4%) |
Education in Bryant
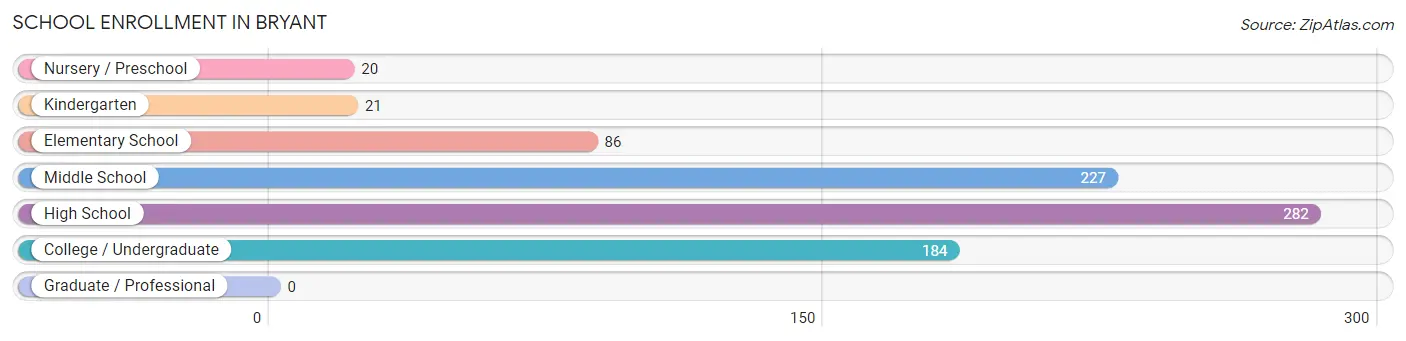
School Enrollment in Bryant
The most common levels of schooling among the 820 students in Bryant are high school (282 | 34.4%), middle school (227 | 27.7%), and college / undergraduate (184 | 22.4%).
| School Level | # Students | % Students |
| Nursery / Preschool | 20 | 2.4% |
| Kindergarten | 21 | 2.6% |
| Elementary School | 86 | 10.5% |
| Middle School | 227 | 27.7% |
| High School | 282 | 34.4% |
| College / Undergraduate | 184 | 22.4% |
| Graduate / Professional | 0 | 0.0% |
| Total | 820 | 100.0% |
School Enrollment by Age by Funding Source in Bryant
Out of a total of 820 students who are enrolled in schools in Bryant, 136 (16.6%) attend a private institution, while the remaining 684 (83.4%) are enrolled in public schools. The age group of 3 to 4 year olds has the highest likelihood of being enrolled in private schools, with 20 (100.0% in the age bracket) enrolled. Conversely, the age group of 5 to 9 year old has the lowest likelihood of being enrolled in a private school, with 107 (100.0% in the age bracket) attending a public institution.
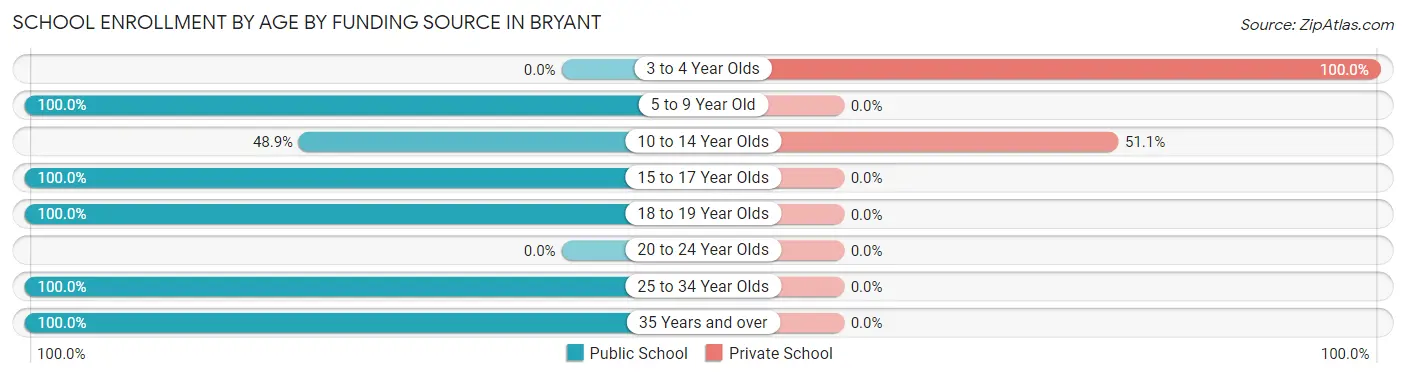
| Age Bracket | Public School | Private School |
| 3 to 4 Year Olds | 0 (0.0%) | 20 (100.0%) |
| 5 to 9 Year Old | 107 (100.0%) | 0 (0.0%) |
| 10 to 14 Year Olds | 111 (48.9%) | 116 (51.1%) |
| 15 to 17 Year Olds | 267 (100.0%) | 0 (0.0%) |
| 18 to 19 Year Olds | 30 (100.0%) | 0 (0.0%) |
| 20 to 24 Year Olds | 0 (0.0%) | 0 (0.0%) |
| 25 to 34 Year Olds | 43 (100.0%) | 0 (0.0%) |
| 35 Years and over | 126 (100.0%) | 0 (0.0%) |
| Total | 684 (83.4%) | 136 (16.6%) |
Educational Attainment by Field of Study in Bryant
Business (107 | 23.2%), arts & humanities (94 | 20.4%), social sciences (91 | 19.7%), bio, nature & agricultural (44 | 9.5%), and science & technology (41 | 8.9%) are the most common fields of study among 461 individuals in Bryant who have obtained a bachelor's degree or higher.
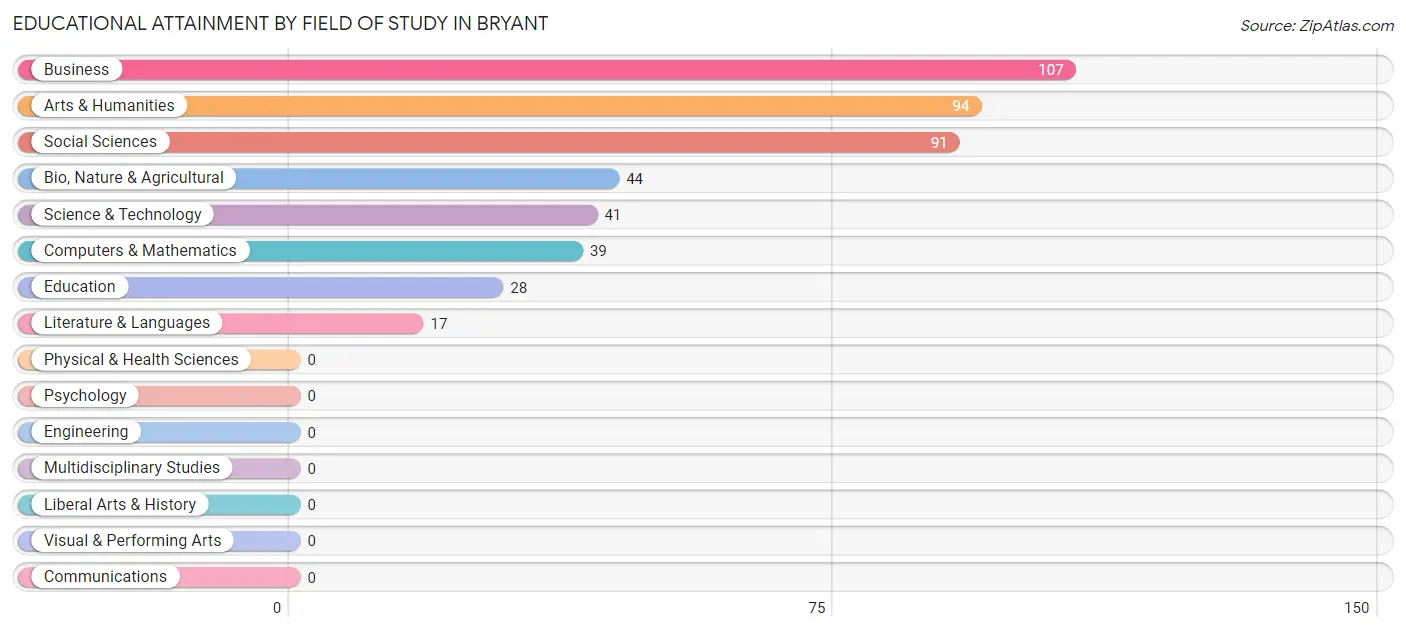
| Field of Study | # Graduates | % Graduates |
| Computers & Mathematics | 39 | 8.5% |
| Bio, Nature & Agricultural | 44 | 9.5% |
| Physical & Health Sciences | 0 | 0.0% |
| Psychology | 0 | 0.0% |
| Social Sciences | 91 | 19.7% |
| Engineering | 0 | 0.0% |
| Multidisciplinary Studies | 0 | 0.0% |
| Science & Technology | 41 | 8.9% |
| Business | 107 | 23.2% |
| Education | 28 | 6.1% |
| Literature & Languages | 17 | 3.7% |
| Liberal Arts & History | 0 | 0.0% |
| Visual & Performing Arts | 0 | 0.0% |
| Communications | 0 | 0.0% |
| Arts & Humanities | 94 | 20.4% |
| Total | 461 | 100.0% |
Transportation & Commute in Bryant
Vehicle Availability by Sex in Bryant
The most prevalent vehicle ownership categories in Bryant are males with 3 vehicles (243, accounting for 34.9%) and females with 3 vehicles (265, making up 34.0%).
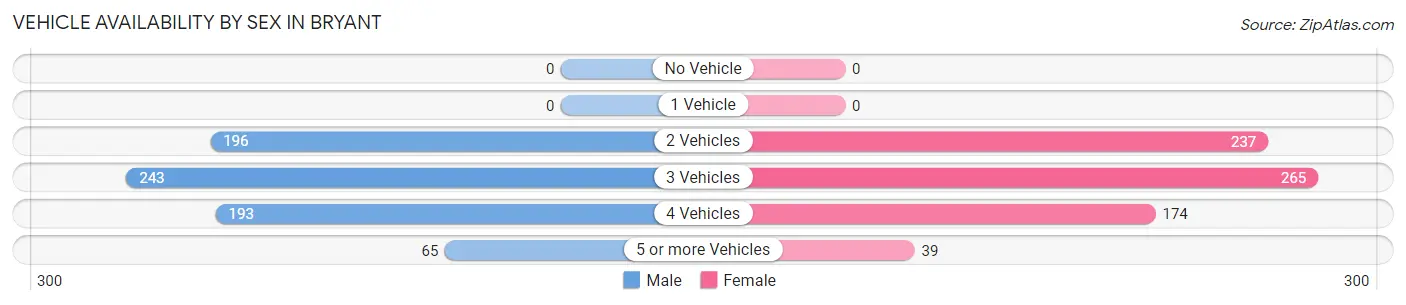
| Vehicles Available | Male | Female |
| No Vehicle | 0 (0.0%) | 0 (0.0%) |
| 1 Vehicle | 0 (0.0%) | 0 (0.0%) |
| 2 Vehicles | 196 (28.1%) | 237 (33.2%) |
| 3 Vehicles | 243 (34.9%) | 265 (37.1%) |
| 4 Vehicles | 193 (27.7%) | 174 (24.3%) |
| 5 or more Vehicles | 65 (9.3%) | 39 (5.4%) |
| Total | 697 (100.0%) | 715 (100.0%) |
Commute Time in Bryant
The most frequently occuring commute durations in Bryant are 15 to 19 minutes (244 commuters, 20.2%), 30 to 34 minutes (242 commuters, 20.0%), and 45 to 59 minutes (130 commuters, 10.7%).
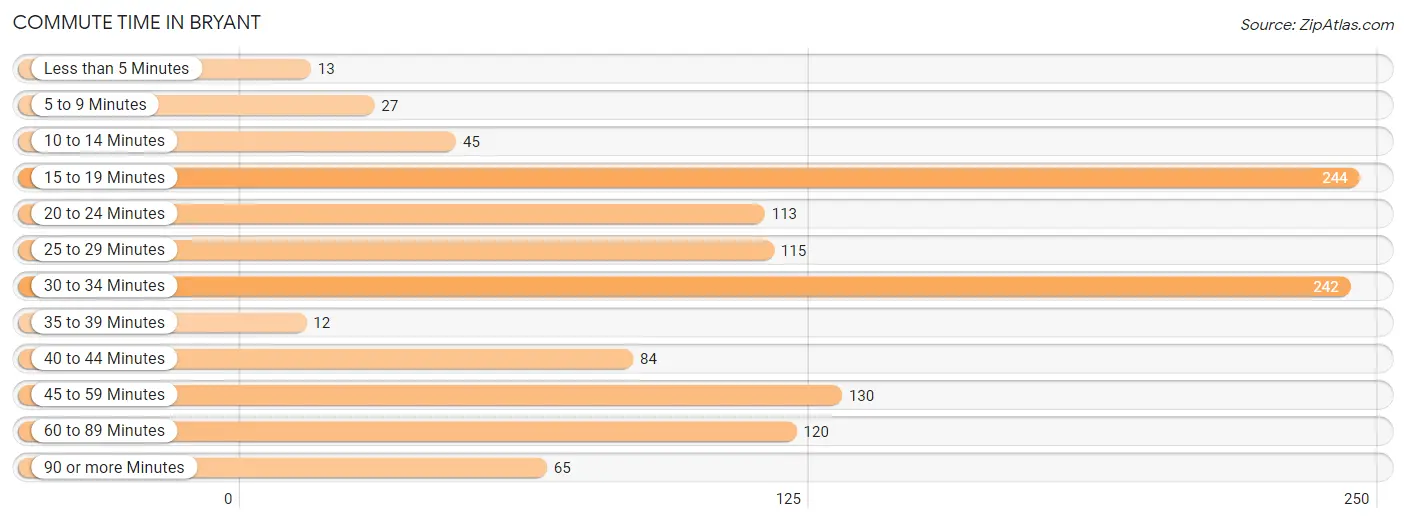
| Commute Time | # Commuters | % Commuters |
| Less than 5 Minutes | 13 | 1.1% |
| 5 to 9 Minutes | 27 | 2.2% |
| 10 to 14 Minutes | 45 | 3.7% |
| 15 to 19 Minutes | 244 | 20.2% |
| 20 to 24 Minutes | 113 | 9.3% |
| 25 to 29 Minutes | 115 | 9.5% |
| 30 to 34 Minutes | 242 | 20.0% |
| 35 to 39 Minutes | 12 | 1.0% |
| 40 to 44 Minutes | 84 | 6.9% |
| 45 to 59 Minutes | 130 | 10.7% |
| 60 to 89 Minutes | 120 | 9.9% |
| 90 or more Minutes | 65 | 5.4% |
Commute Time by Sex in Bryant
The most common commute times in Bryant are 15 to 19 minutes (83 commuters, 14.7%) for males and 30 to 34 minutes (179 commuters, 27.7%) for females.
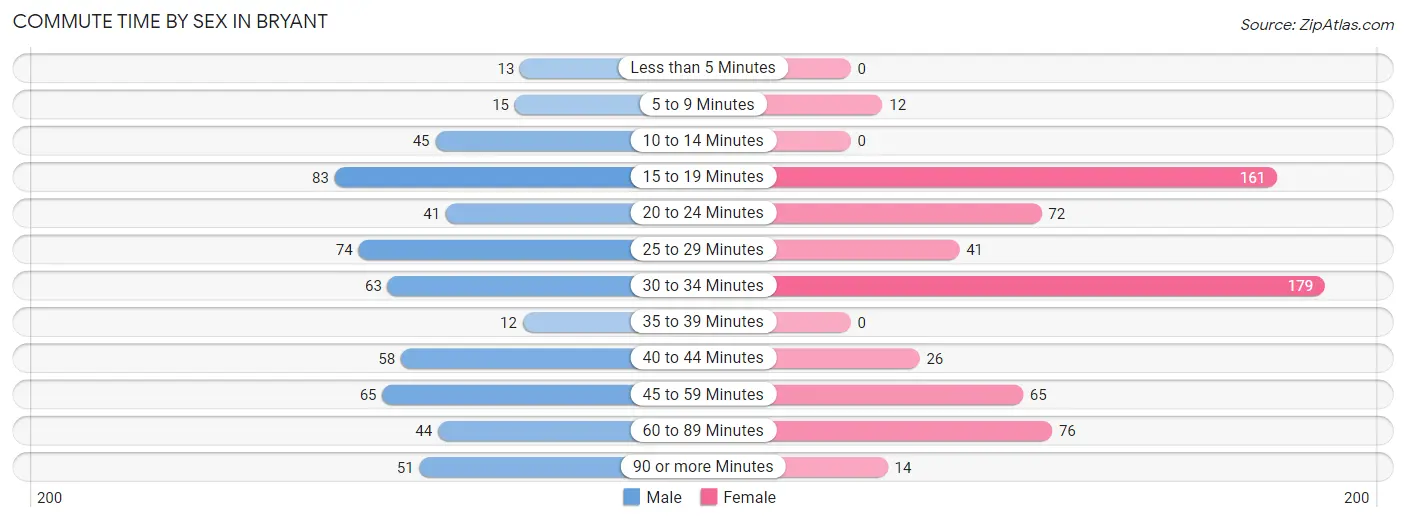
| Commute Time | Male | Female |
| Less than 5 Minutes | 13 (2.3%) | 0 (0.0%) |
| 5 to 9 Minutes | 15 (2.7%) | 12 (1.9%) |
| 10 to 14 Minutes | 45 (8.0%) | 0 (0.0%) |
| 15 to 19 Minutes | 83 (14.7%) | 161 (24.9%) |
| 20 to 24 Minutes | 41 (7.3%) | 72 (11.2%) |
| 25 to 29 Minutes | 74 (13.1%) | 41 (6.4%) |
| 30 to 34 Minutes | 63 (11.2%) | 179 (27.7%) |
| 35 to 39 Minutes | 12 (2.1%) | 0 (0.0%) |
| 40 to 44 Minutes | 58 (10.3%) | 26 (4.0%) |
| 45 to 59 Minutes | 65 (11.5%) | 65 (10.1%) |
| 60 to 89 Minutes | 44 (7.8%) | 76 (11.8%) |
| 90 or more Minutes | 51 (9.0%) | 14 (2.2%) |
Time of Departure to Work by Sex in Bryant
The most frequent times of departure to work in Bryant are 6:00 AM to 6:29 AM (118, 20.9%) for males and 10:00 AM to 10:59 AM (121, 18.7%) for females.
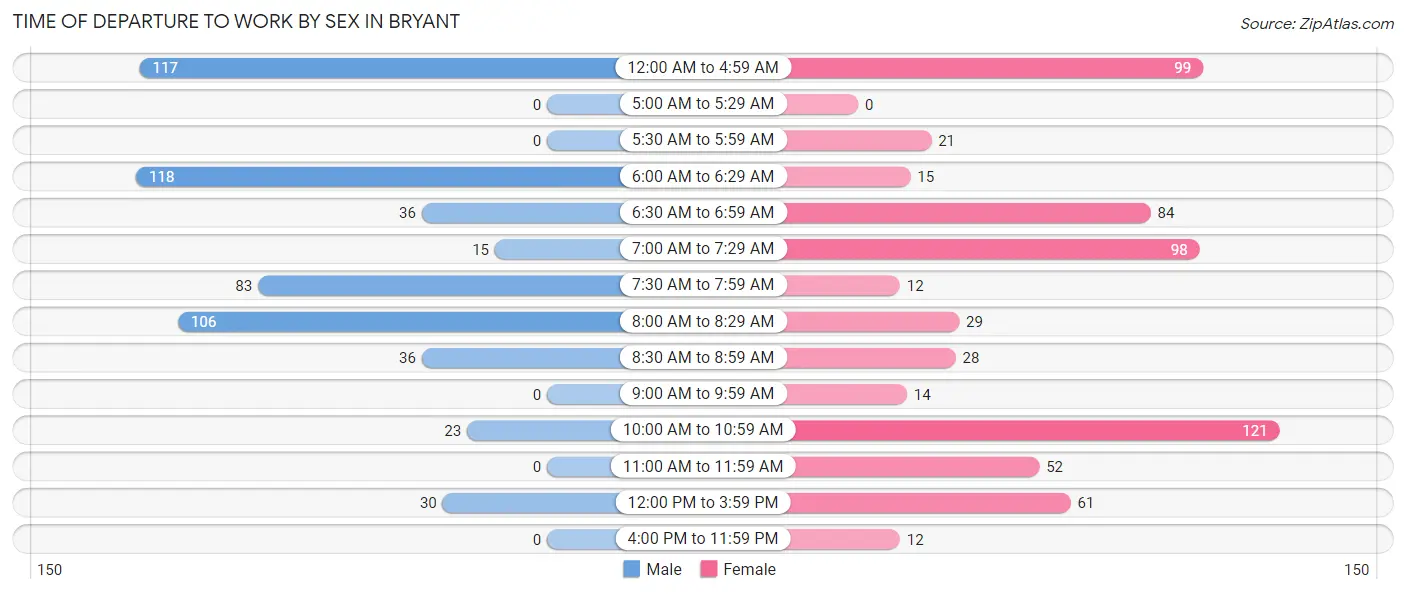
| Time of Departure | Male | Female |
| 12:00 AM to 4:59 AM | 117 (20.7%) | 99 (15.3%) |
| 5:00 AM to 5:29 AM | 0 (0.0%) | 0 (0.0%) |
| 5:30 AM to 5:59 AM | 0 (0.0%) | 21 (3.3%) |
| 6:00 AM to 6:29 AM | 118 (20.9%) | 15 (2.3%) |
| 6:30 AM to 6:59 AM | 36 (6.4%) | 84 (13.0%) |
| 7:00 AM to 7:29 AM | 15 (2.7%) | 98 (15.2%) |
| 7:30 AM to 7:59 AM | 83 (14.7%) | 12 (1.9%) |
| 8:00 AM to 8:29 AM | 106 (18.8%) | 29 (4.5%) |
| 8:30 AM to 8:59 AM | 36 (6.4%) | 28 (4.3%) |
| 9:00 AM to 9:59 AM | 0 (0.0%) | 14 (2.2%) |
| 10:00 AM to 10:59 AM | 23 (4.1%) | 121 (18.7%) |
| 11:00 AM to 11:59 AM | 0 (0.0%) | 52 (8.1%) |
| 12:00 PM to 3:59 PM | 30 (5.3%) | 61 (9.4%) |
| 4:00 PM to 11:59 PM | 0 (0.0%) | 12 (1.9%) |
| Total | 564 (100.0%) | 646 (100.0%) |
Housing Occupancy in Bryant
Occupancy by Ownership in Bryant
Of the total 844 dwellings in Bryant, owner-occupied units account for 822 (97.4%), while renter-occupied units make up 22 (2.6%).
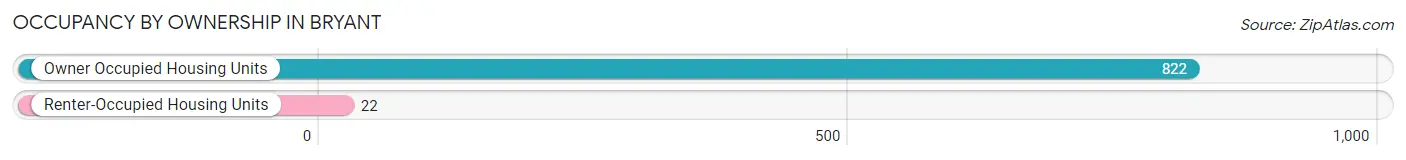
| Occupancy | # Housing Units | % Housing Units |
| Owner Occupied Housing Units | 822 | 97.4% |
| Renter-Occupied Housing Units | 22 | 2.6% |
| Total Occupied Housing Units | 844 | 100.0% |
Occupancy by Household Size in Bryant
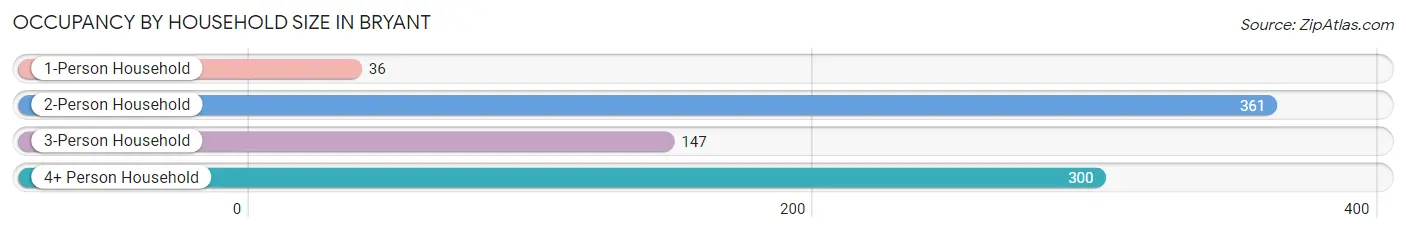
| Household Size | # Housing Units | % Housing Units |
| 1-Person Household | 36 | 4.3% |
| 2-Person Household | 361 | 42.8% |
| 3-Person Household | 147 | 17.4% |
| 4+ Person Household | 300 | 35.5% |
| Total Housing Units | 844 | 100.0% |
Occupancy by Ownership by Household Size in Bryant
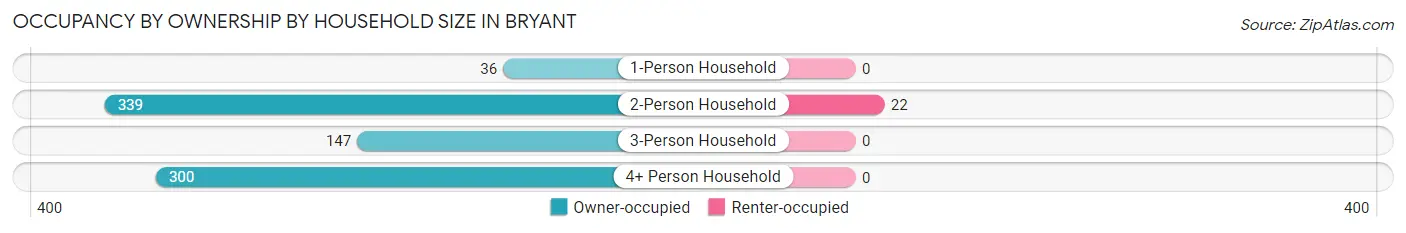
| Household Size | Owner-occupied | Renter-occupied |
| 1-Person Household | 36 (100.0%) | 0 (0.0%) |
| 2-Person Household | 339 (93.9%) | 22 (6.1%) |
| 3-Person Household | 147 (100.0%) | 0 (0.0%) |
| 4+ Person Household | 300 (100.0%) | 0 (0.0%) |
| Total Housing Units | 822 (97.4%) | 22 (2.6%) |
Occupancy by Educational Attainment in Bryant
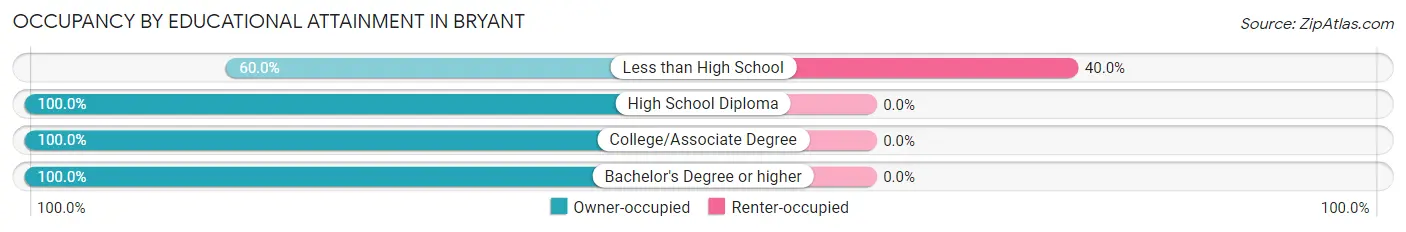
| Household Size | Owner-occupied | Renter-occupied |
| Less than High School | 33 (60.0%) | 22 (40.0%) |
| High School Diploma | 259 (100.0%) | 0 (0.0%) |
| College/Associate Degree | 311 (100.0%) | 0 (0.0%) |
| Bachelor's Degree or higher | 219 (100.0%) | 0 (0.0%) |
Occupancy by Age of Householder in Bryant
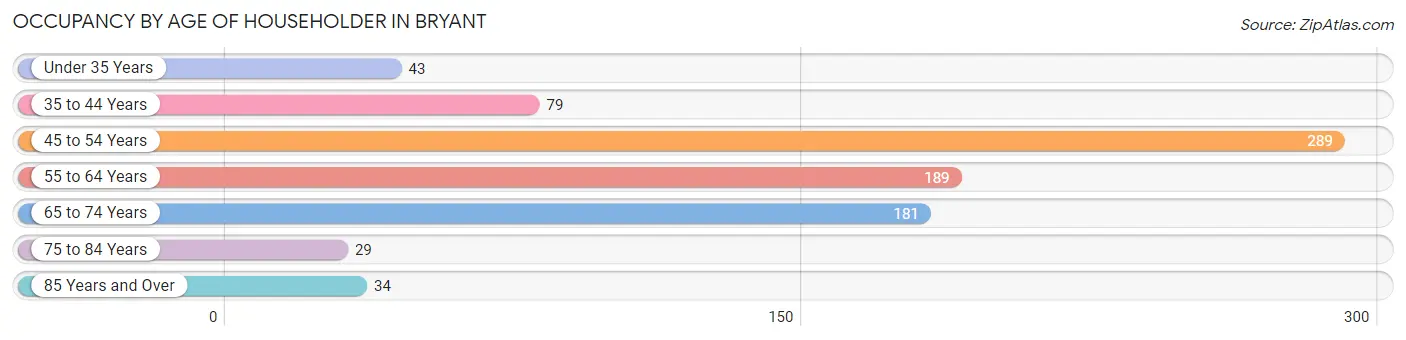
| Age Bracket | # Households | % Households |
| Under 35 Years | 43 | 5.1% |
| 35 to 44 Years | 79 | 9.4% |
| 45 to 54 Years | 289 | 34.2% |
| 55 to 64 Years | 189 | 22.4% |
| 65 to 74 Years | 181 | 21.4% |
| 75 to 84 Years | 29 | 3.4% |
| 85 Years and Over | 34 | 4.0% |
| Total | 844 | 100.0% |
Housing Finances in Bryant
Median Income by Occupancy in Bryant
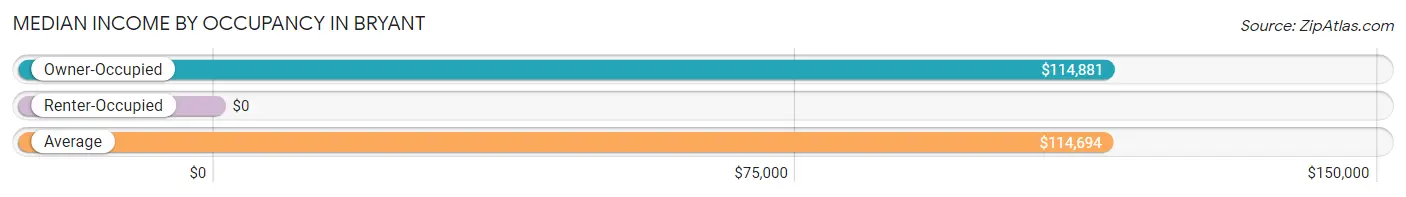
| Occupancy Type | # Households | Median Income |
| Owner-Occupied | 822 (97.4%) | $114,881 |
| Renter-Occupied | 22 (2.6%) | $0 |
| Average | 844 (100.0%) | $114,694 |
Occupancy by Householder Income Bracket in Bryant
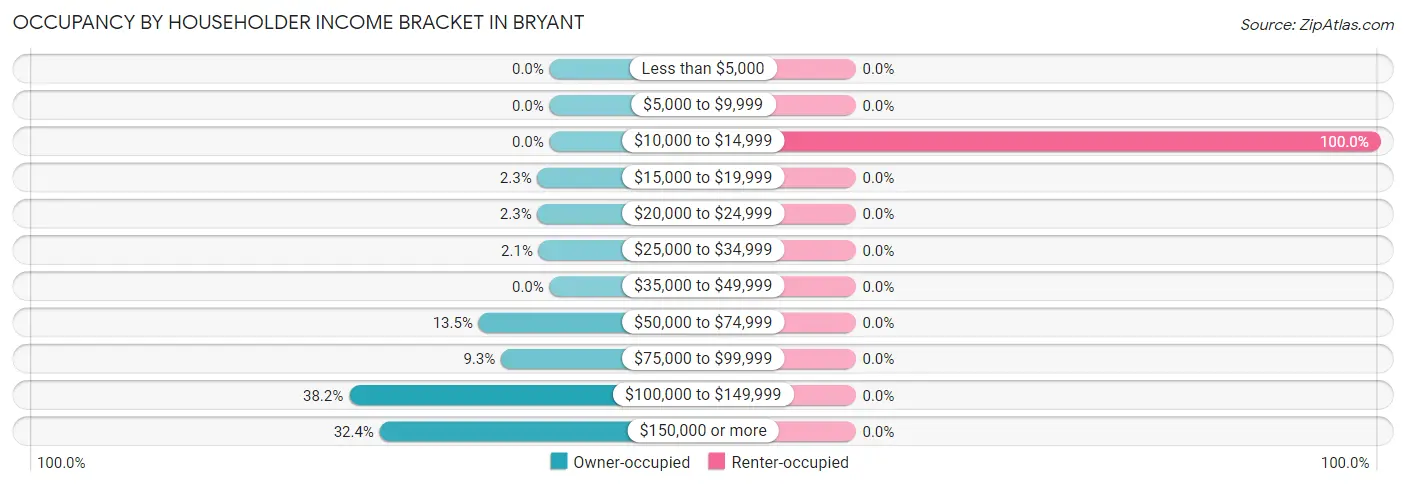
| Income Bracket | Owner-occupied | Renter-occupied |
| Less than $5,000 | 0 (0.0%) | 0 (0.0%) |
| $5,000 to $9,999 | 0 (0.0%) | 0 (0.0%) |
| $10,000 to $14,999 | 0 (0.0%) | 22 (100.0%) |
| $15,000 to $19,999 | 19 (2.3%) | 0 (0.0%) |
| $20,000 to $24,999 | 19 (2.3%) | 0 (0.0%) |
| $25,000 to $34,999 | 17 (2.1%) | 0 (0.0%) |
| $35,000 to $49,999 | 0 (0.0%) | 0 (0.0%) |
| $50,000 to $74,999 | 111 (13.5%) | 0 (0.0%) |
| $75,000 to $99,999 | 76 (9.2%) | 0 (0.0%) |
| $100,000 to $149,999 | 314 (38.2%) | 0 (0.0%) |
| $150,000 or more | 266 (32.4%) | 0 (0.0%) |
| Total | 822 (100.0%) | 22 (100.0%) |
Monthly Housing Cost Tiers in Bryant
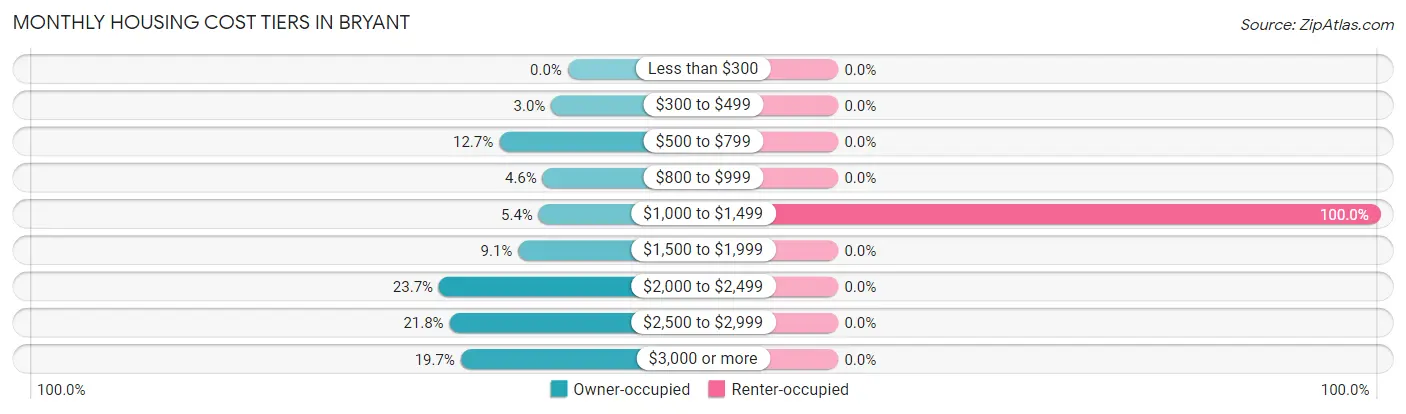
| Monthly Cost | Owner-occupied | Renter-occupied |
| Less than $300 | 0 (0.0%) | 0 (0.0%) |
| $300 to $499 | 25 (3.0%) | 0 (0.0%) |
| $500 to $799 | 104 (12.7%) | 0 (0.0%) |
| $800 to $999 | 38 (4.6%) | 0 (0.0%) |
| $1,000 to $1,499 | 44 (5.3%) | 22 (100.0%) |
| $1,500 to $1,999 | 75 (9.1%) | 0 (0.0%) |
| $2,000 to $2,499 | 195 (23.7%) | 0 (0.0%) |
| $2,500 to $2,999 | 179 (21.8%) | 0 (0.0%) |
| $3,000 or more | 162 (19.7%) | 0 (0.0%) |
| Total | 822 (100.0%) | 22 (100.0%) |
Physical Housing Characteristics in Bryant
Housing Structures in Bryant
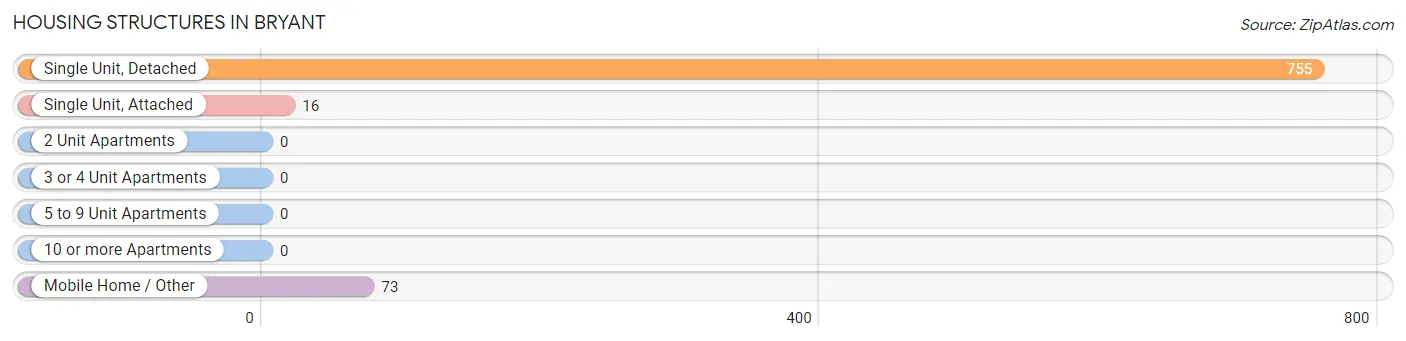
| Structure Type | # Housing Units | % Housing Units |
| Single Unit, Detached | 755 | 89.4% |
| Single Unit, Attached | 16 | 1.9% |
| 2 Unit Apartments | 0 | 0.0% |
| 3 or 4 Unit Apartments | 0 | 0.0% |
| 5 to 9 Unit Apartments | 0 | 0.0% |
| 10 or more Apartments | 0 | 0.0% |
| Mobile Home / Other | 73 | 8.6% |
| Total | 844 | 100.0% |
Housing Structures by Occupancy in Bryant
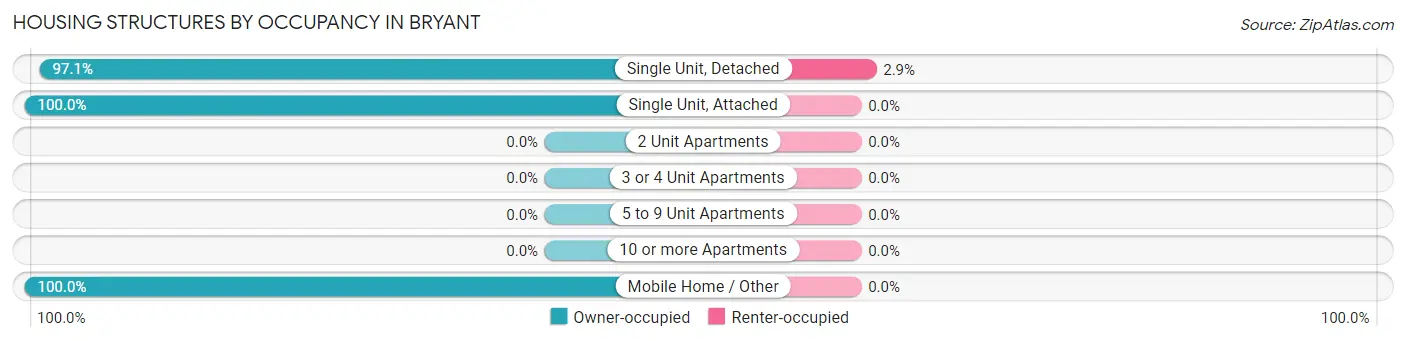
| Structure Type | Owner-occupied | Renter-occupied |
| Single Unit, Detached | 733 (97.1%) | 22 (2.9%) |
| Single Unit, Attached | 16 (100.0%) | 0 (0.0%) |
| 2 Unit Apartments | 0 (0.0%) | 0 (0.0%) |
| 3 or 4 Unit Apartments | 0 (0.0%) | 0 (0.0%) |
| 5 to 9 Unit Apartments | 0 (0.0%) | 0 (0.0%) |
| 10 or more Apartments | 0 (0.0%) | 0 (0.0%) |
| Mobile Home / Other | 73 (100.0%) | 0 (0.0%) |
| Total | 822 (97.4%) | 22 (2.6%) |
Housing Structures by Number of Rooms in Bryant
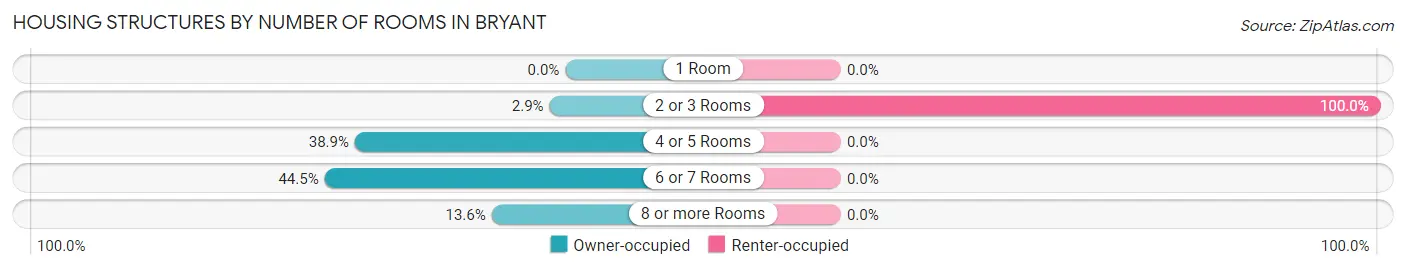
| Number of Rooms | Owner-occupied | Renter-occupied |
| 1 Room | 0 (0.0%) | 0 (0.0%) |
| 2 or 3 Rooms | 24 (2.9%) | 22 (100.0%) |
| 4 or 5 Rooms | 320 (38.9%) | 0 (0.0%) |
| 6 or 7 Rooms | 366 (44.5%) | 0 (0.0%) |
| 8 or more Rooms | 112 (13.6%) | 0 (0.0%) |
| Total | 822 (100.0%) | 22 (100.0%) |
Housing Structure by Heating Type in Bryant
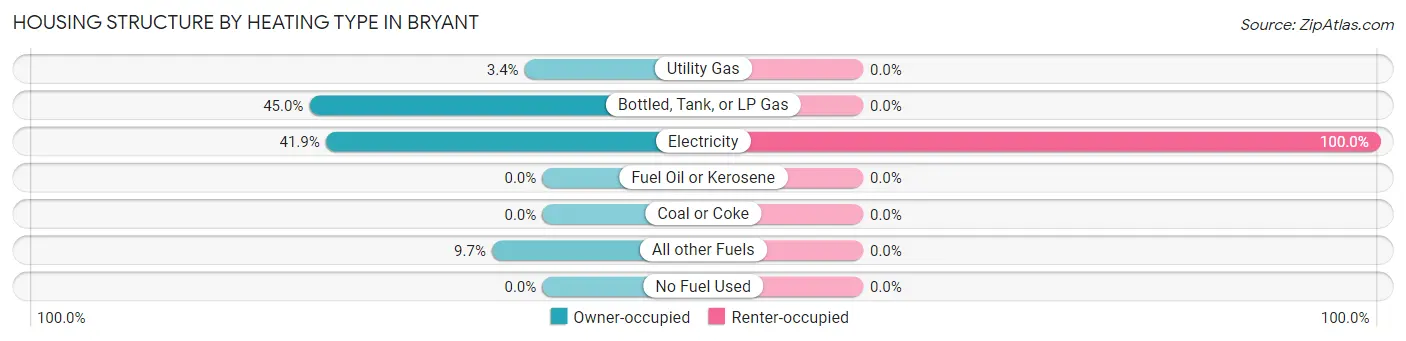
| Heating Type | Owner-occupied | Renter-occupied |
| Utility Gas | 28 (3.4%) | 0 (0.0%) |
| Bottled, Tank, or LP Gas | 370 (45.0%) | 0 (0.0%) |
| Electricity | 344 (41.8%) | 22 (100.0%) |
| Fuel Oil or Kerosene | 0 (0.0%) | 0 (0.0%) |
| Coal or Coke | 0 (0.0%) | 0 (0.0%) |
| All other Fuels | 80 (9.7%) | 0 (0.0%) |
| No Fuel Used | 0 (0.0%) | 0 (0.0%) |
| Total | 822 (100.0%) | 22 (100.0%) |
Household Vehicle Usage in Bryant
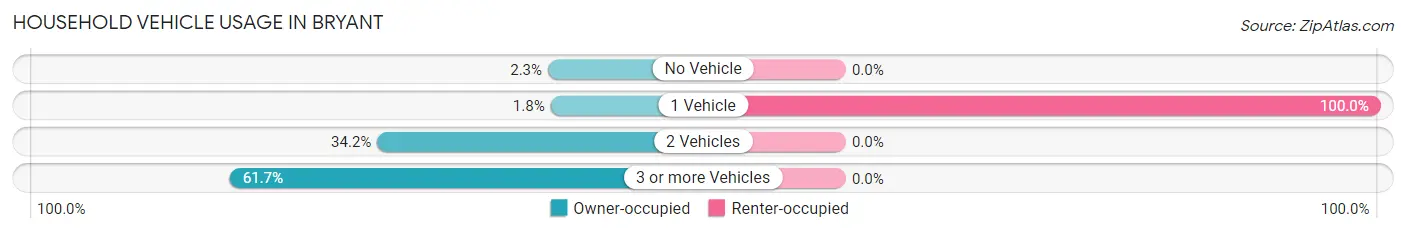
| Vehicles per Household | Owner-occupied | Renter-occupied |
| No Vehicle | 19 (2.3%) | 0 (0.0%) |
| 1 Vehicle | 15 (1.8%) | 22 (100.0%) |
| 2 Vehicles | 281 (34.2%) | 0 (0.0%) |
| 3 or more Vehicles | 507 (61.7%) | 0 (0.0%) |
| Total | 822 (100.0%) | 22 (100.0%) |
Real Estate & Mortgages in Bryant
Real Estate and Mortgage Overview in Bryant
| Characteristic | Without Mortgage | With Mortgage |
| Housing Units | 158 | 664 |
| Median Property Value | $351,400 | $622,900 |
| Median Household Income | $95,167 | $251 |
| Monthly Housing Costs | $752 | $162 |
| Real Estate Taxes | $3,790 | $0 |
Property Value by Mortgage Status in Bryant
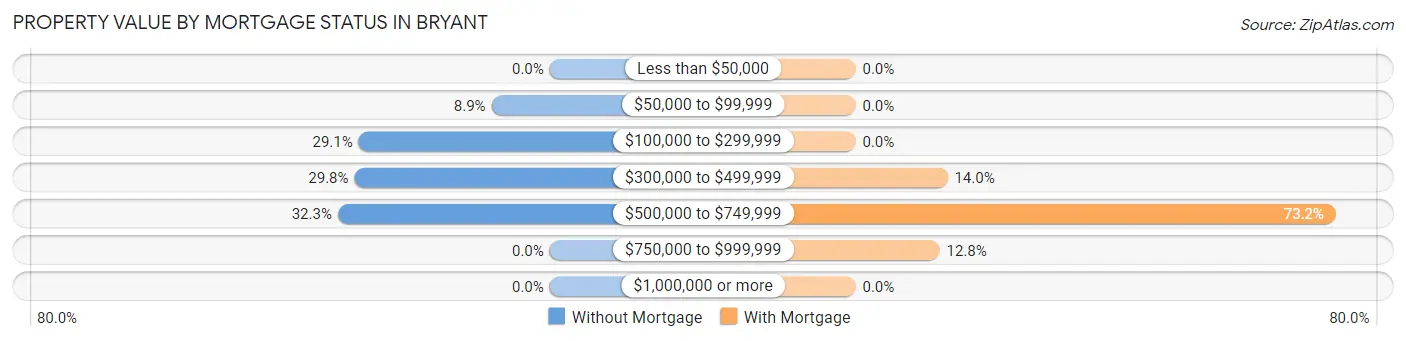
| Property Value | Without Mortgage | With Mortgage |
| Less than $50,000 | 0 (0.0%) | 0 (0.0%) |
| $50,000 to $99,999 | 14 (8.9%) | 0 (0.0%) |
| $100,000 to $299,999 | 46 (29.1%) | 0 (0.0%) |
| $300,000 to $499,999 | 47 (29.7%) | 93 (14.0%) |
| $500,000 to $749,999 | 51 (32.3%) | 486 (73.2%) |
| $750,000 to $999,999 | 0 (0.0%) | 85 (12.8%) |
| $1,000,000 or more | 0 (0.0%) | 0 (0.0%) |
| Total | 158 (100.0%) | 664 (100.0%) |
Household Income by Mortgage Status in Bryant
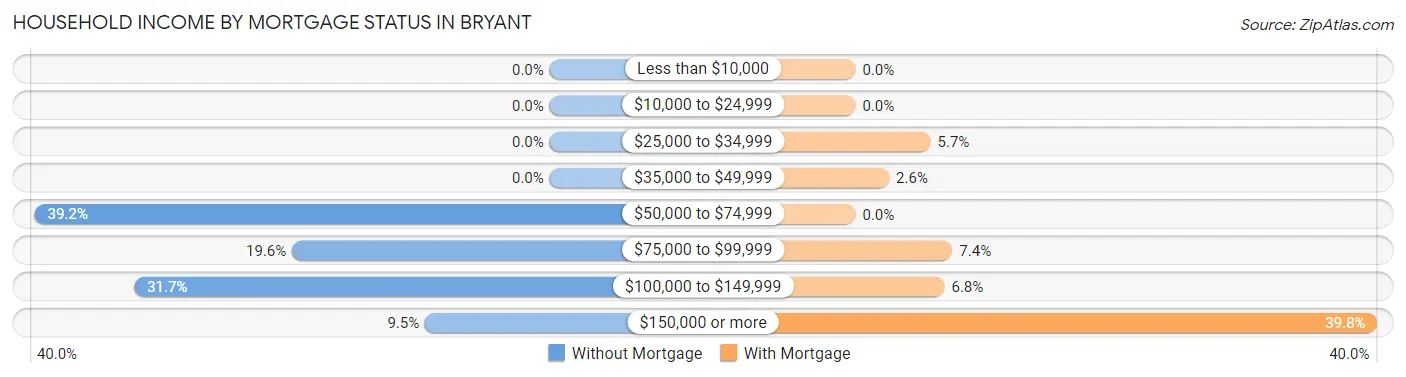
| Household Income | Without Mortgage | With Mortgage |
| Less than $10,000 | 0 (0.0%) | 0 (0.0%) |
| $10,000 to $24,999 | 0 (0.0%) | 0 (0.0%) |
| $25,000 to $34,999 | 0 (0.0%) | 38 (5.7%) |
| $35,000 to $49,999 | 0 (0.0%) | 17 (2.6%) |
| $50,000 to $74,999 | 62 (39.2%) | 0 (0.0%) |
| $75,000 to $99,999 | 31 (19.6%) | 49 (7.4%) |
| $100,000 to $149,999 | 50 (31.7%) | 45 (6.8%) |
| $150,000 or more | 15 (9.5%) | 264 (39.8%) |
| Total | 158 (100.0%) | 664 (100.0%) |
Property Value to Household Income Ratio in Bryant
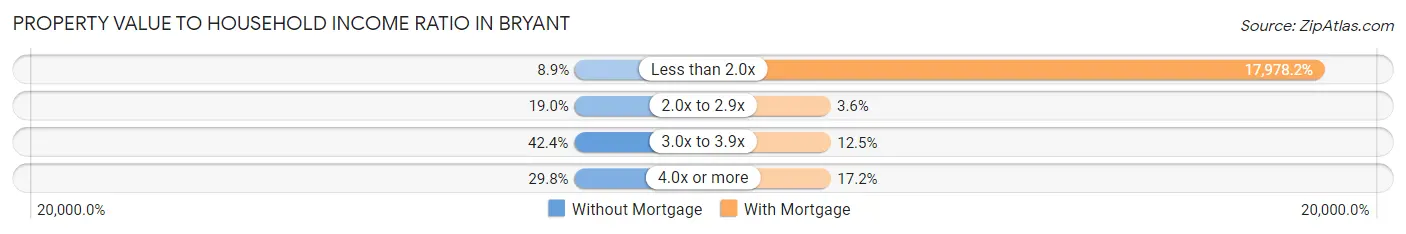
| Value-to-Income Ratio | Without Mortgage | With Mortgage |
| Less than 2.0x | 14 (8.9%) | 119,375 (17,978.2%) |
| 2.0x to 2.9x | 30 (19.0%) | 24 (3.6%) |
| 3.0x to 3.9x | 67 (42.4%) | 83 (12.5%) |
| 4.0x or more | 47 (29.7%) | 114 (17.2%) |
| Total | 158 (100.0%) | 664 (100.0%) |
Real Estate Taxes by Mortgage Status in Bryant
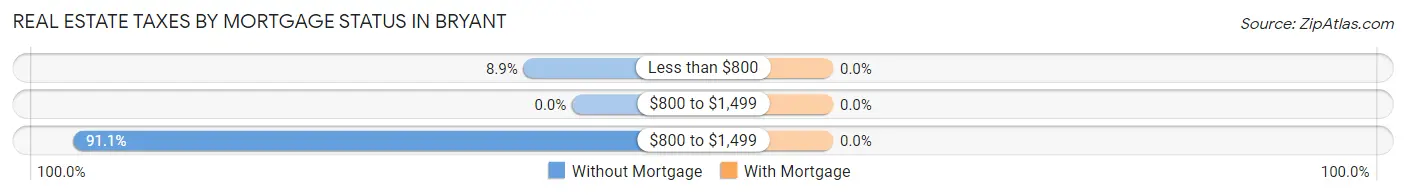
| Property Taxes | Without Mortgage | With Mortgage |
| Less than $800 | 14 (8.9%) | 0 (0.0%) |
| $800 to $1,499 | 0 (0.0%) | 0 (0.0%) |
| $800 to $1,499 | 144 (91.1%) | 0 (0.0%) |
| Total | 158 (100.0%) | 664 (100.0%) |
Health & Disability in Bryant
Health Insurance Coverage by Age in Bryant
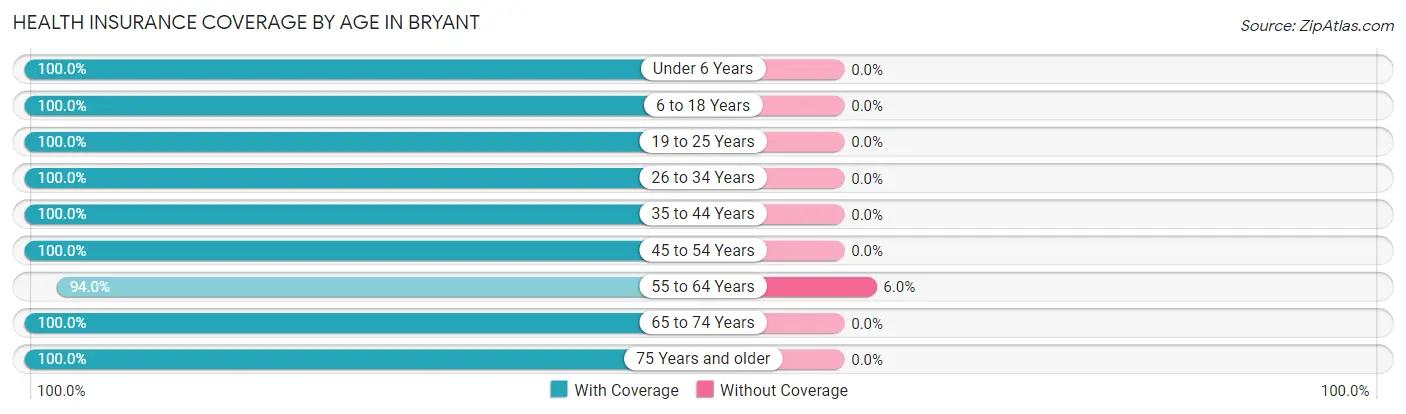
| Age Bracket | With Coverage | Without Coverage |
| Under 6 Years | 31 (100.0%) | 0 (0.0%) |
| 6 to 18 Years | 631 (100.0%) | 0 (0.0%) |
| 19 to 25 Years | 53 (100.0%) | 0 (0.0%) |
| 26 to 34 Years | 162 (100.0%) | 0 (0.0%) |
| 35 to 44 Years | 297 (100.0%) | 0 (0.0%) |
| 45 to 54 Years | 483 (100.0%) | 0 (0.0%) |
| 55 to 64 Years | 361 (94.0%) | 23 (6.0%) |
| 65 to 74 Years | 279 (100.0%) | 0 (0.0%) |
| 75 Years and older | 166 (100.0%) | 0 (0.0%) |
| Total | 2,463 (99.1%) | 23 (0.9%) |
Health Insurance Coverage by Citizenship Status in Bryant
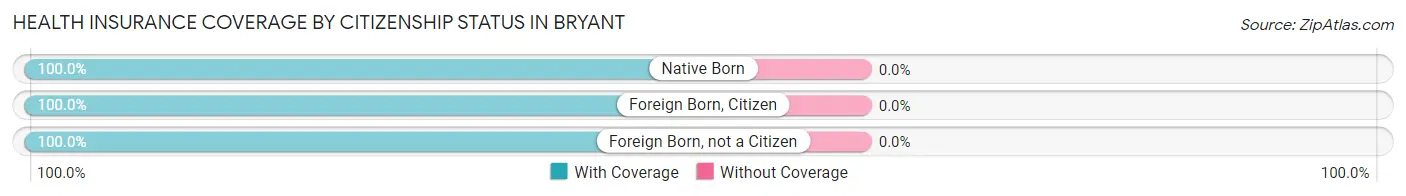
| Citizenship Status | With Coverage | Without Coverage |
| Native Born | 31 (100.0%) | 0 (0.0%) |
| Foreign Born, Citizen | 631 (100.0%) | 0 (0.0%) |
| Foreign Born, not a Citizen | 53 (100.0%) | 0 (0.0%) |
Health Insurance Coverage by Household Income in Bryant
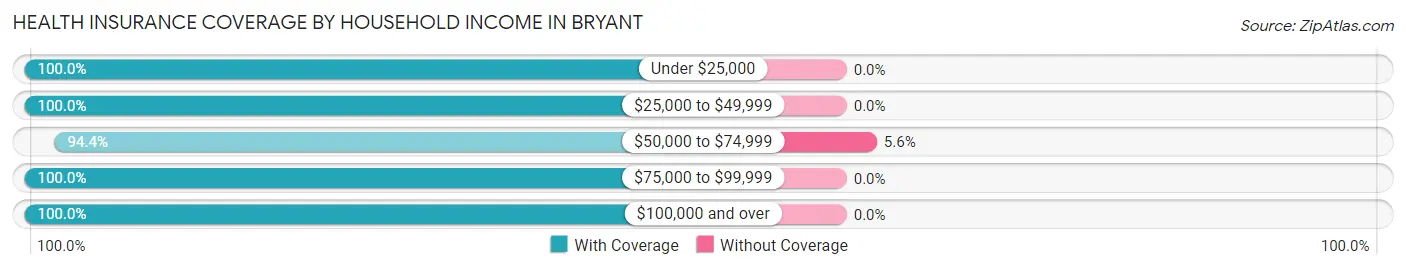
| Household Income | With Coverage | Without Coverage |
| Under $25,000 | 111 (100.0%) | 0 (0.0%) |
| $25,000 to $49,999 | 17 (100.0%) | 0 (0.0%) |
| $50,000 to $74,999 | 385 (94.4%) | 23 (5.6%) |
| $75,000 to $99,999 | 270 (100.0%) | 0 (0.0%) |
| $100,000 and over | 1,680 (100.0%) | 0 (0.0%) |
Public vs Private Health Insurance Coverage by Age in Bryant
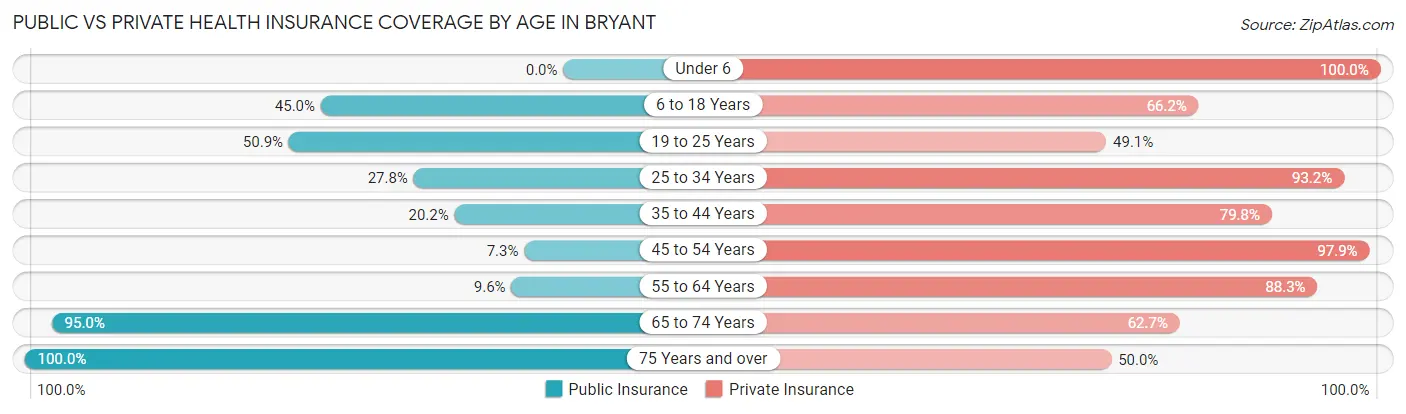
| Age Bracket | Public Insurance | Private Insurance |
| Under 6 | 0 (0.0%) | 31 (100.0%) |
| 6 to 18 Years | 284 (45.0%) | 418 (66.2%) |
| 19 to 25 Years | 27 (50.9%) | 26 (49.1%) |
| 25 to 34 Years | 45 (27.8%) | 151 (93.2%) |
| 35 to 44 Years | 60 (20.2%) | 237 (79.8%) |
| 45 to 54 Years | 35 (7.2%) | 473 (97.9%) |
| 55 to 64 Years | 37 (9.6%) | 339 (88.3%) |
| 65 to 74 Years | 265 (95.0%) | 175 (62.7%) |
| 75 Years and over | 166 (100.0%) | 83 (50.0%) |
| Total | 919 (37.0%) | 1,933 (77.8%) |
Disability Status by Sex by Age in Bryant
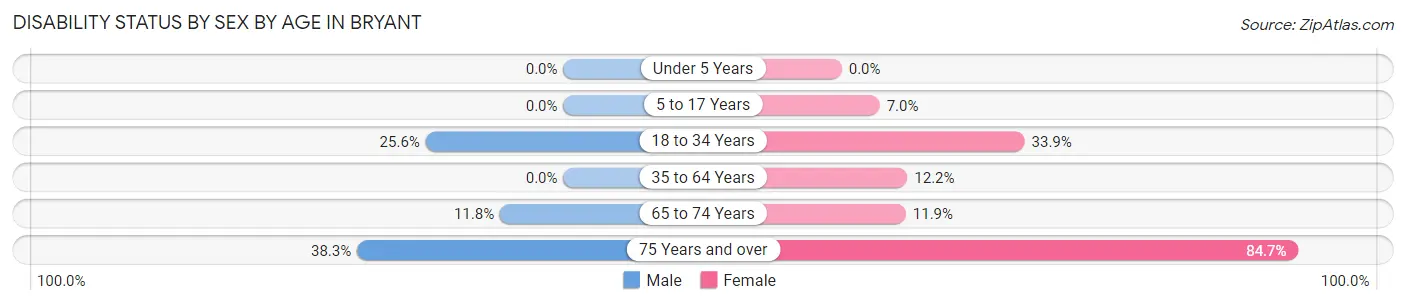
| Age Bracket | Male | Female |
| Under 5 Years | 0 (0.0%) | 0 (0.0%) |
| 5 to 17 Years | 0 (0.0%) | 20 (7.0%) |
| 18 to 34 Years | 34 (25.6%) | 38 (33.9%) |
| 35 to 64 Years | 0 (0.0%) | 79 (12.2%) |
| 65 to 74 Years | 16 (11.8%) | 17 (11.9%) |
| 75 Years and over | 36 (38.3%) | 61 (84.7%) |
Disability Class by Sex by Age in Bryant
Disability Class: Hearing Difficulty
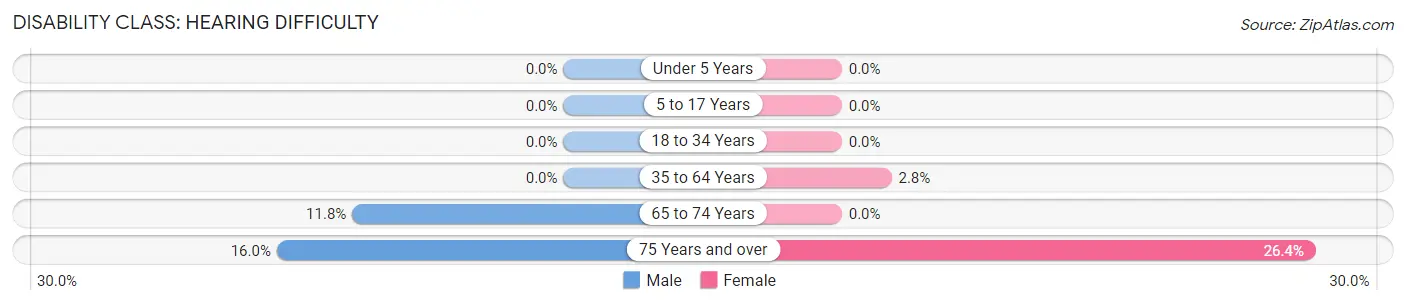
| Age Bracket | Male | Female |
| Under 5 Years | 0 (0.0%) | 0 (0.0%) |
| 5 to 17 Years | 0 (0.0%) | 0 (0.0%) |
| 18 to 34 Years | 0 (0.0%) | 0 (0.0%) |
| 35 to 64 Years | 0 (0.0%) | 18 (2.8%) |
| 65 to 74 Years | 16 (11.8%) | 0 (0.0%) |
| 75 Years and over | 15 (16.0%) | 19 (26.4%) |
Disability Class: Vision Difficulty
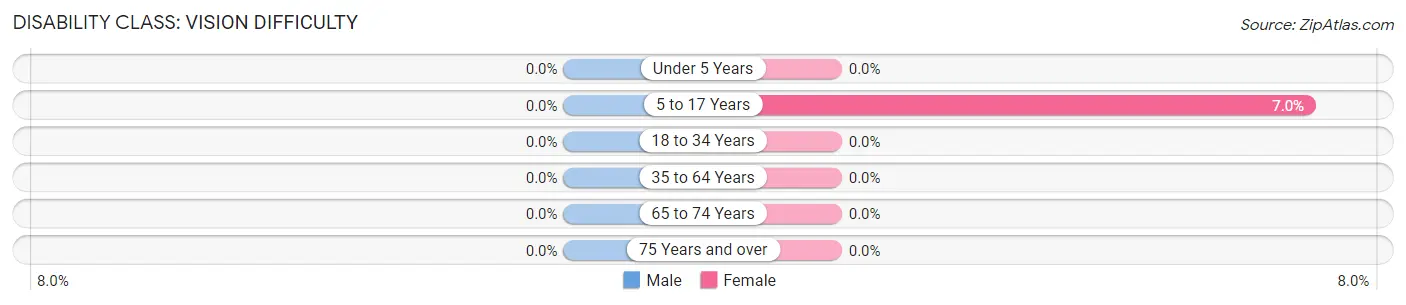
| Age Bracket | Male | Female |
| Under 5 Years | 0 (0.0%) | 0 (0.0%) |
| 5 to 17 Years | 0 (0.0%) | 20 (7.0%) |
| 18 to 34 Years | 0 (0.0%) | 0 (0.0%) |
| 35 to 64 Years | 0 (0.0%) | 0 (0.0%) |
| 65 to 74 Years | 0 (0.0%) | 0 (0.0%) |
| 75 Years and over | 0 (0.0%) | 0 (0.0%) |
Disability Class: Cognitive Difficulty
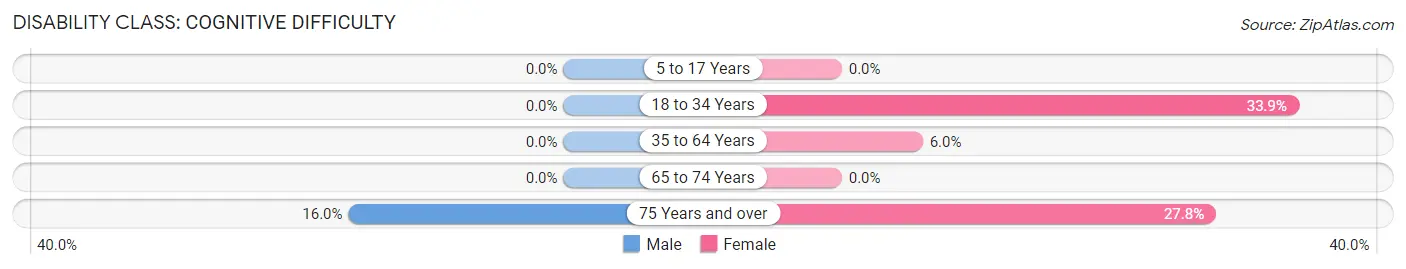
| Age Bracket | Male | Female |
| 5 to 17 Years | 0 (0.0%) | 0 (0.0%) |
| 18 to 34 Years | 0 (0.0%) | 38 (33.9%) |
| 35 to 64 Years | 0 (0.0%) | 39 (6.0%) |
| 65 to 74 Years | 0 (0.0%) | 0 (0.0%) |
| 75 Years and over | 15 (16.0%) | 20 (27.8%) |
Disability Class: Ambulatory Difficulty
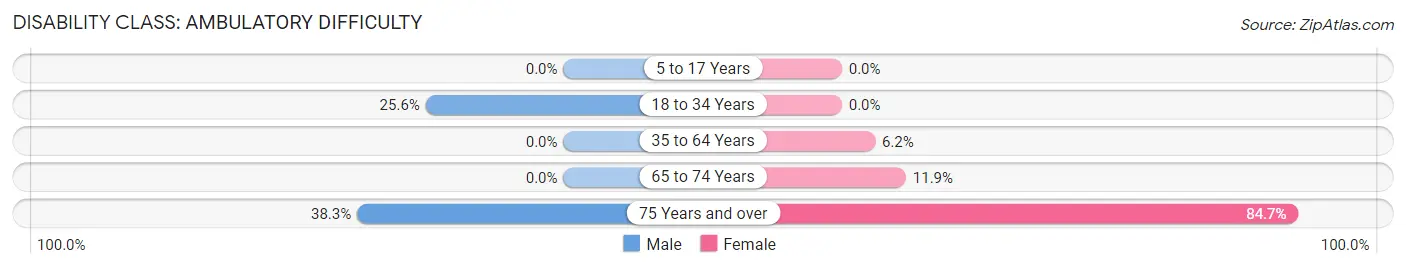
| Age Bracket | Male | Female |
| 5 to 17 Years | 0 (0.0%) | 0 (0.0%) |
| 18 to 34 Years | 34 (25.6%) | 0 (0.0%) |
| 35 to 64 Years | 0 (0.0%) | 40 (6.2%) |
| 65 to 74 Years | 0 (0.0%) | 17 (11.9%) |
| 75 Years and over | 36 (38.3%) | 61 (84.7%) |
Disability Class: Self-Care Difficulty
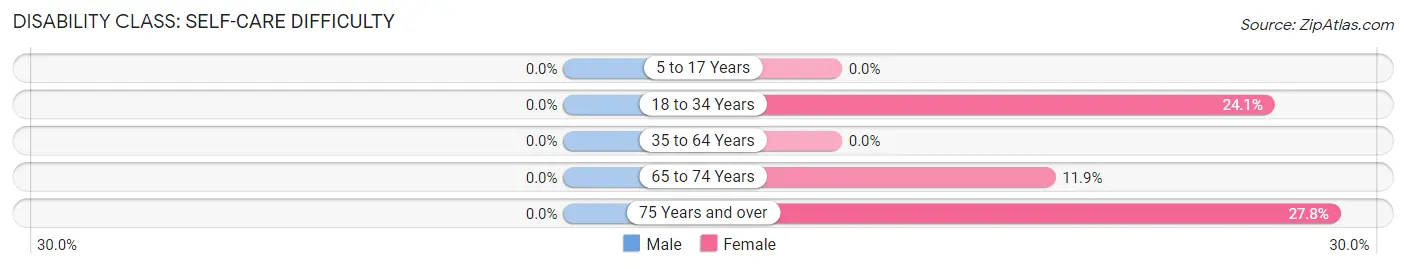
| Age Bracket | Male | Female |
| 5 to 17 Years | 0 (0.0%) | 0 (0.0%) |
| 18 to 34 Years | 0 (0.0%) | 27 (24.1%) |
| 35 to 64 Years | 0 (0.0%) | 0 (0.0%) |
| 65 to 74 Years | 0 (0.0%) | 17 (11.9%) |
| 75 Years and over | 0 (0.0%) | 20 (27.8%) |
Technology Access in Bryant
Computing Device Access in Bryant
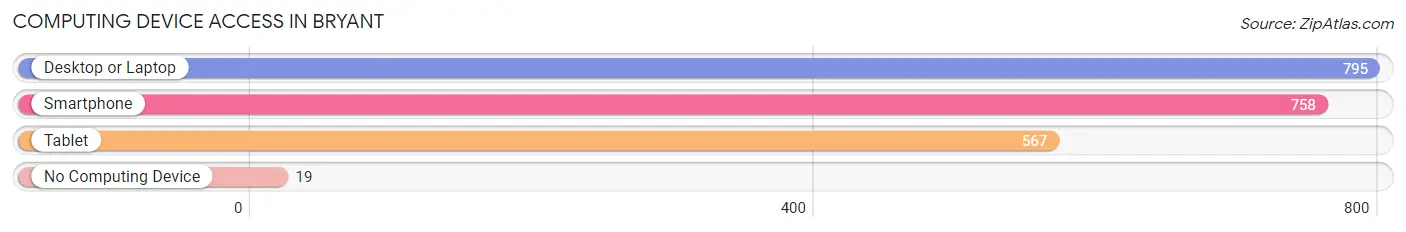
| Device Type | # Households | % Households |
| Desktop or Laptop | 795 | 94.2% |
| Smartphone | 758 | 89.8% |
| Tablet | 567 | 67.2% |
| No Computing Device | 19 | 2.2% |
| Total | 844 | 100.0% |
Internet Access in Bryant
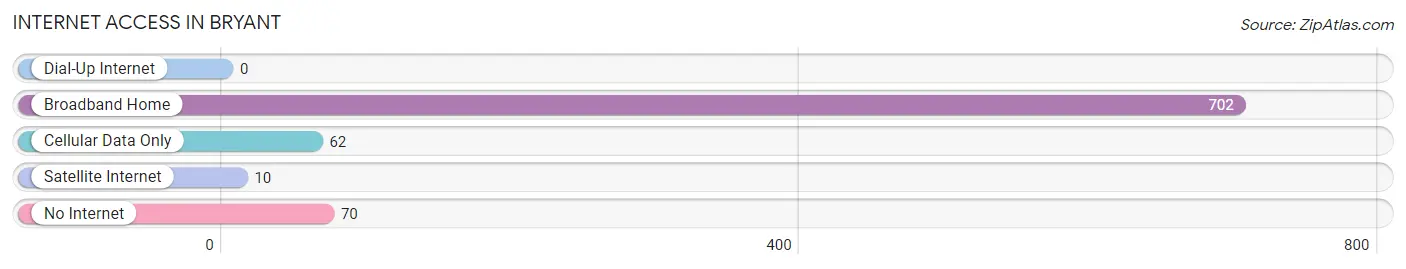
| Internet Type | # Households | % Households |
| Dial-Up Internet | 0 | 0.0% |
| Broadband Home | 702 | 83.2% |
| Cellular Data Only | 62 | 7.3% |
| Satellite Internet | 10 | 1.2% |
| No Internet | 70 | 8.3% |
| Total | 844 | 100.0% |
Bryant Summary
Bryant is a small unincorporated community located in the state of Washington, United States. It is situated in the northern part of the state, in the county of Spokane. The population of Bryant was estimated to be around 1,000 people in 2020.
History
Bryant was first settled in the late 1800s by a group of settlers from the Midwest. The settlers were attracted to the area due to its fertile soil and abundant natural resources. The first post office in Bryant was established in 1891. The town was named after the first postmaster, William Bryant.
The town grew slowly over the years, but it was not until the early 1900s that it began to experience significant growth. This was due to the construction of the Spokane, Portland and Seattle Railway, which connected the town to the larger cities of Spokane and Seattle. The railway allowed for the transportation of goods and people, which helped to spur economic growth in the area.
Geography
Bryant is located in the northern part of Washington State, in the county of Spokane. It is situated in the foothills of the Cascade Mountains, and is surrounded by rolling hills and forests. The town is located at an elevation of 1,890 feet above sea level.
The climate in Bryant is generally mild, with warm summers and cold winters. The average annual temperature is around 50 degrees Fahrenheit. The average annual precipitation is around 20 inches.
Economy
The economy of Bryant is largely based on agriculture and forestry. The town is home to several farms, which produce a variety of crops, including wheat, barley, oats, and hay. The forests in the area provide timber for the lumber industry.
In addition to agriculture and forestry, Bryant is also home to several small businesses, including restaurants, retail stores, and service providers. The town is also home to a small airport, which provides air transportation services to the surrounding area.
Demographics
As of 2020, the population of Bryant was estimated to be around 1,000 people. The racial makeup of the town is predominantly white, with a small percentage of African Americans, Native Americans, and Asians. The median household income in Bryant is around $50,000, and the median home value is around $200,000.
Conclusion
Bryant is a small unincorporated community located in the northern part of Washington State. It is situated in the foothills of the Cascade Mountains, and is surrounded by rolling hills and forests. The town is home to several farms, which produce a variety of crops, and is also home to several small businesses. The population of Bryant was estimated to be around 1,000 people in 2020.
Common Questions
What is Per Capita Income in Bryant?
Per Capita income in Bryant is $45,543.
What is the Median Family Income in Bryant?
Median Family Income in Bryant is $114,762.
What is the Median Household income in Bryant?
Median Household Income in Bryant is $114,694.
What is Income or Wage Gap in Bryant?
Income or Wage Gap in Bryant is 59.9%.
Women in Bryant earn 40.1 cents for every dollar earned by a man.
What is Inequality or Gini Index in Bryant?
Inequality or Gini Index in Bryant is 0.30.
What is the Total Population of Bryant?
Total Population of Bryant is 2,486.
What is the Total Male Population of Bryant?
Total Male Population of Bryant is 1,215.
What is the Total Female Population of Bryant?
Total Female Population of Bryant is 1,271.
What is the Ratio of Males per 100 Females in Bryant?
There are 95.59 Males per 100 Females in Bryant.
What is the Ratio of Females per 100 Males in Bryant?
There are 104.61 Females per 100 Males in Bryant.
What is the Median Population Age in Bryant?
Median Population Age in Bryant is 45.9 Years.
What is the Average Family Size in Bryant
Average Family Size in Bryant is 3.0 People.
What is the Average Household Size in Bryant
Average Household Size in Bryant is 3.0 People.
How Large is the Labor Force in Bryant?
There are 1,465 People in the Labor Forcein in Bryant.
What is the Percentage of People in the Labor Force in Bryant?
73.2% of People are in the Labor Force in Bryant.