Fall City, WA Map & Demographics
Fall City Map
Fall City Overview
$55,317
PER CAPITA INCOME
$136,528
AVG FAMILY INCOME
$122,716
AVG HOUSEHOLD INCOME
45.3%
WAGE / INCOME GAP [ % ]
54.7¢/ $1
WAGE / INCOME GAP [ $ ]
0.43
INEQUALITY / GINI INDEX
2,018
TOTAL POPULATION
1,064
MALE POPULATION
954
FEMALE POPULATION
111.53
MALES / 100 FEMALES
89.66
FEMALES / 100 MALES
38.8
MEDIAN AGE
3.2
AVG FAMILY SIZE
2.9
AVG HOUSEHOLD SIZE
1,015
LABOR FORCE [ PEOPLE ]
63.7%
PERCENT IN LABOR FORCE
3.2%
UNEMPLOYMENT RATE
Fall City Zip Codes
Fall City Area Codes
Income in Fall City
Income Overview in Fall City
Per Capita Income in Fall City is $55,317, while median incomes of families and households are $136,528 and $122,716 respectively.
| Characteristic | Number | Measure |
| Per Capita Income | 2,018 | $55,317 |
| Median Family Income | 559 | $136,528 |
| Mean Family Income | 559 | $180,448 |
| Median Household Income | 687 | $122,716 |
| Mean Household Income | 687 | $160,509 |
| Income Deficit | 559 | $0 |
| Wage / Income Gap (%) | 2,018 | 45.28% |
| Wage / Income Gap ($) | 2,018 | 54.72¢ per $1 |
| Gini / Inequality Index | 2,018 | 0.43 |
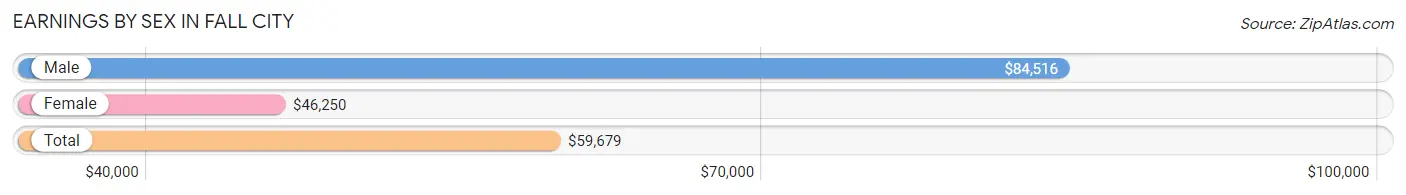
Earnings by Sex in Fall City
Average Earnings in Fall City are $59,679, $84,516 for men and $46,250 for women, a difference of 45.3%.
| Sex | Number | Average Earnings |
| Male | 503 (47.7%) | $84,516 |
| Female | 551 (52.3%) | $46,250 |
| Total | 1,054 (100.0%) | $59,679 |
Earnings by Sex by Income Bracket in Fall City
The most common earnings brackets in Fall City are $100,000+ for men (226 | 44.9%) and $100,000+ for women (154 | 28.0%).
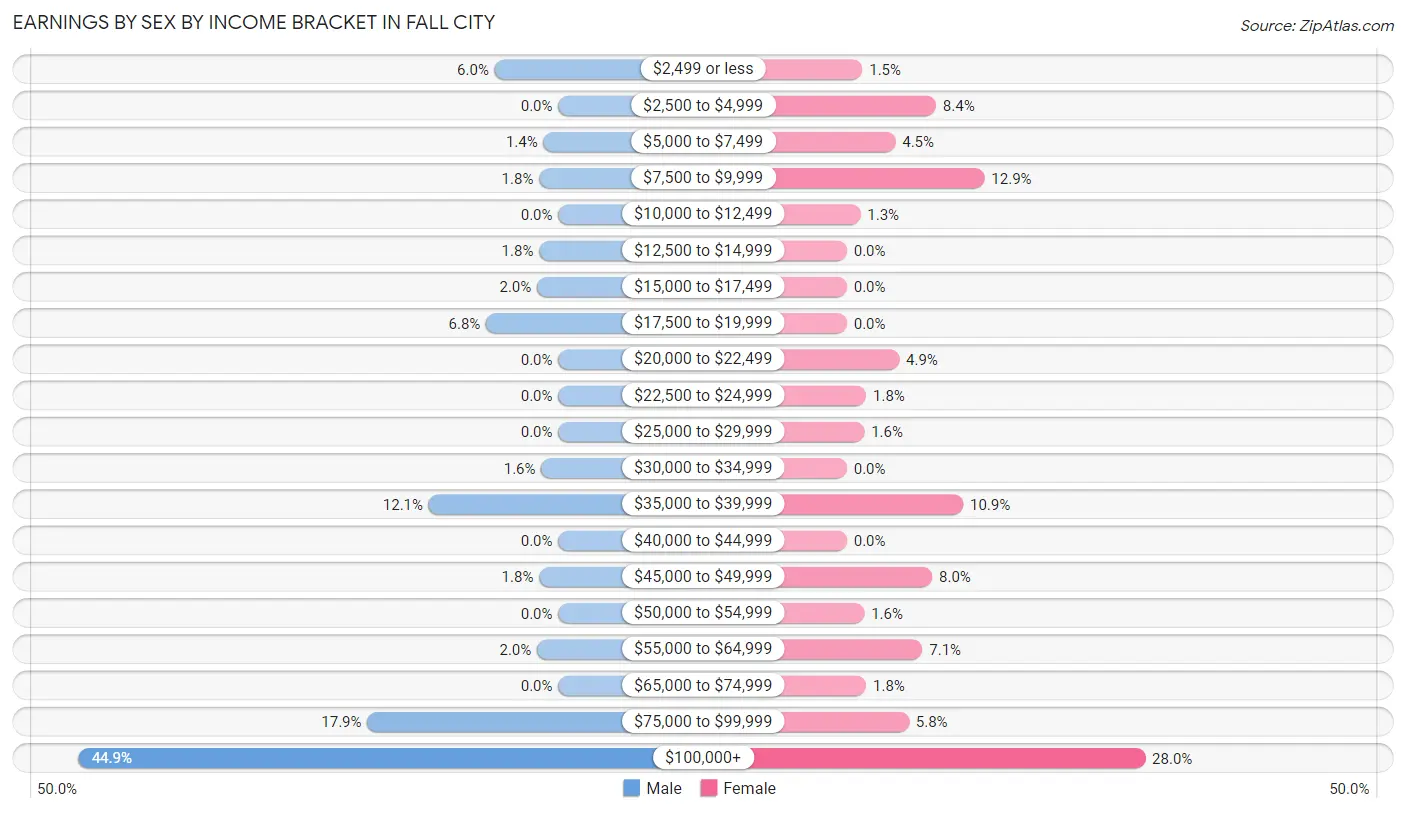
| Income | Male | Female |
| $2,499 or less | 30 (6.0%) | 8 (1.5%) |
| $2,500 to $4,999 | 0 (0.0%) | 46 (8.4%) |
| $5,000 to $7,499 | 7 (1.4%) | 25 (4.5%) |
| $7,500 to $9,999 | 9 (1.8%) | 71 (12.9%) |
| $10,000 to $12,499 | 0 (0.0%) | 7 (1.3%) |
| $12,500 to $14,999 | 9 (1.8%) | 0 (0.0%) |
| $15,000 to $17,499 | 10 (2.0%) | 0 (0.0%) |
| $17,500 to $19,999 | 34 (6.8%) | 0 (0.0%) |
| $20,000 to $22,499 | 0 (0.0%) | 27 (4.9%) |
| $22,500 to $24,999 | 0 (0.0%) | 10 (1.8%) |
| $25,000 to $29,999 | 0 (0.0%) | 9 (1.6%) |
| $30,000 to $34,999 | 8 (1.6%) | 0 (0.0%) |
| $35,000 to $39,999 | 61 (12.1%) | 60 (10.9%) |
| $40,000 to $44,999 | 0 (0.0%) | 0 (0.0%) |
| $45,000 to $49,999 | 9 (1.8%) | 44 (8.0%) |
| $50,000 to $54,999 | 0 (0.0%) | 9 (1.6%) |
| $55,000 to $64,999 | 10 (2.0%) | 39 (7.1%) |
| $65,000 to $74,999 | 0 (0.0%) | 10 (1.8%) |
| $75,000 to $99,999 | 90 (17.9%) | 32 (5.8%) |
| $100,000+ | 226 (44.9%) | 154 (28.0%) |
| Total | 503 (100.0%) | 551 (100.0%) |
Earnings by Sex by Educational Attainment in Fall City
Average earnings in Fall City are $84,656 for men and $59,655 for women, a difference of 29.5%. Men with an educational attainment of college or associate's degree enjoy the highest average annual earnings of $83,697, while those with college or associate's degree education earn the least with $83,697. Women with an educational attainment of graduate degree earn the most with the average annual earnings of $86,000, while those with college or associate's degree education have the smallest earnings of $46,350.
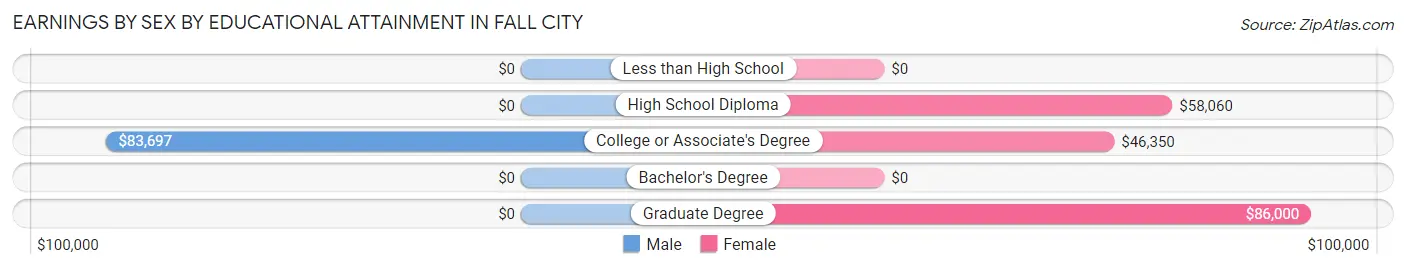
| Educational Attainment | Male Income | Female Income |
| Less than High School | - | - |
| High School Diploma | - | - |
| College or Associate's Degree | $83,697 | $46,350 |
| Bachelor's Degree | - | - |
| Graduate Degree | - | - |
| Total | $84,656 | $59,655 |
Family Income in Fall City
Family Income Brackets in Fall City
According to the Fall City family income data, there are 179 families falling into the $200,000+ income range, which is the most common income bracket and makes up 32.0% of all families.
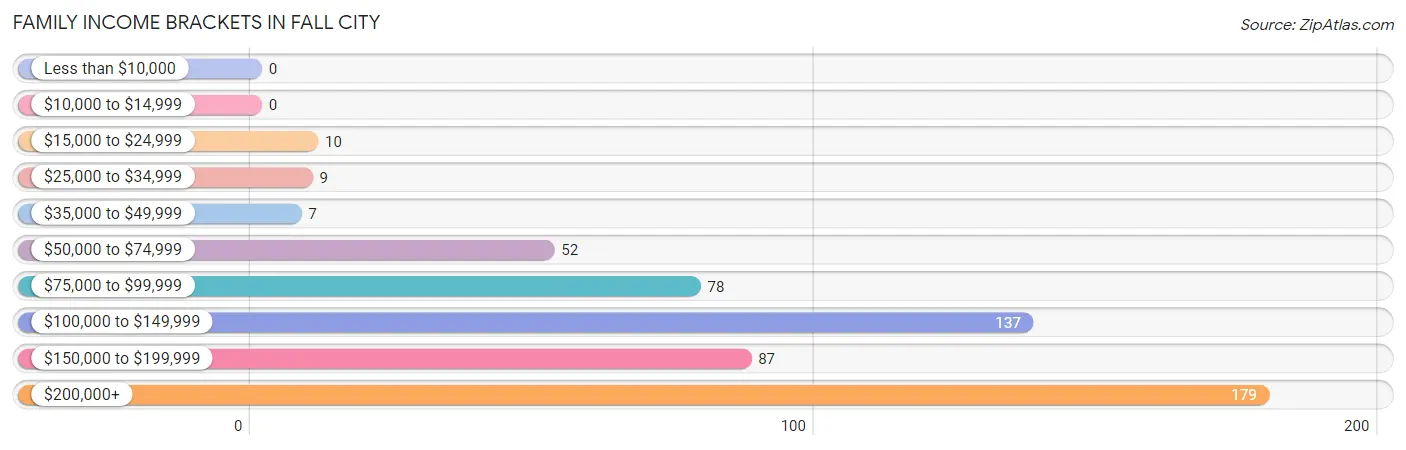
| Income Bracket | # Families | % Families |
| Less than $10,000 | 0 | 0.0% |
| $10,000 to $14,999 | 0 | 0.0% |
| $15,000 to $24,999 | 10 | 1.8% |
| $25,000 to $34,999 | 9 | 1.6% |
| $35,000 to $49,999 | 7 | 1.3% |
| $50,000 to $74,999 | 52 | 9.3% |
| $75,000 to $99,999 | 78 | 14.0% |
| $100,000 to $149,999 | 137 | 24.5% |
| $150,000 to $199,999 | 87 | 15.6% |
| $200,000+ | 179 | 32.0% |
Family Income by Famaliy Size in Fall City
4-person families (156 | 27.9%) account for the highest median family income in Fall City with $192,813 per family, while 2-person families (219 | 39.2%) have the highest median income of $80,938 per family member.
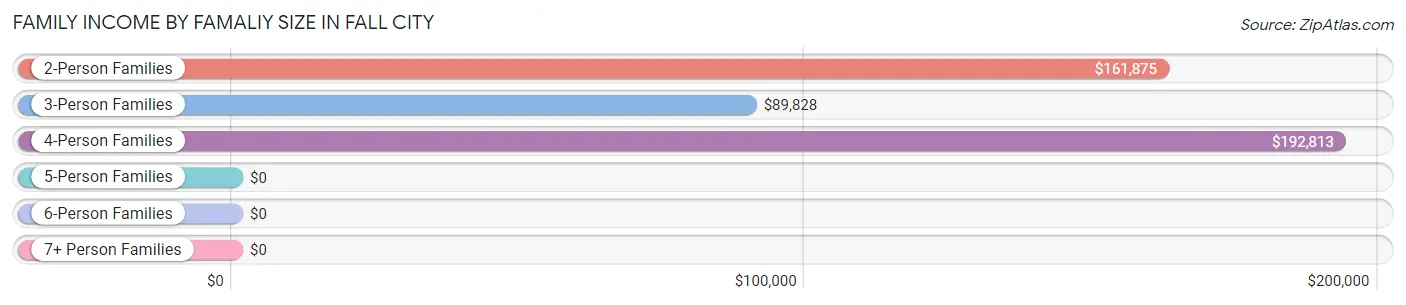
| Income Bracket | # Families | Median Income |
| 2-Person Families | 219 (39.2%) | $161,875 |
| 3-Person Families | 118 (21.1%) | $89,828 |
| 4-Person Families | 156 (27.9%) | $192,813 |
| 5-Person Families | 11 (2.0%) | $0 |
| 6-Person Families | 47 (8.4%) | $0 |
| 7+ Person Families | 8 (1.4%) | $0 |
| Total | 559 (100.0%) | $136,528 |
Family Income by Number of Earners in Fall City
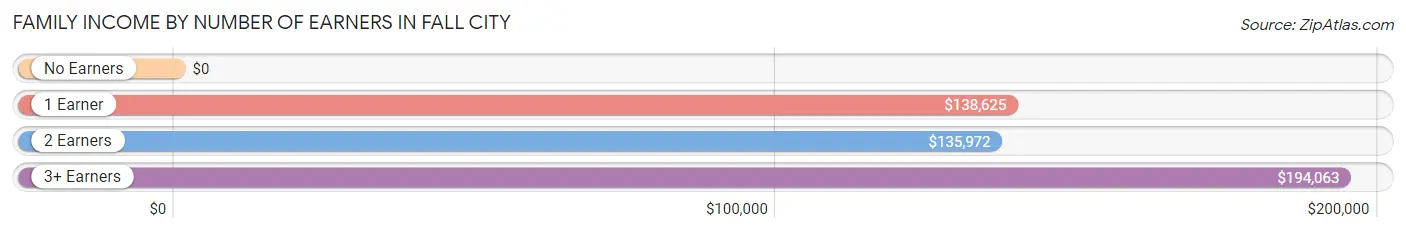
| Number of Earners | # Families | Median Income |
| No Earners | 73 (13.1%) | $0 |
| 1 Earner | 83 (14.8%) | $138,625 |
| 2 Earners | 375 (67.1%) | $135,972 |
| 3+ Earners | 28 (5.0%) | $194,063 |
| Total | 559 (100.0%) | $136,528 |
Household Income in Fall City
Household Income Brackets in Fall City
With 197 households falling in the category, the $200,000+ income range is the most frequent in Fall City, accounting for 28.7% of all households. In contrast, only 9 households (1.3%) fall into the $25,000 to $34,999 income bracket, making it the least populous group.
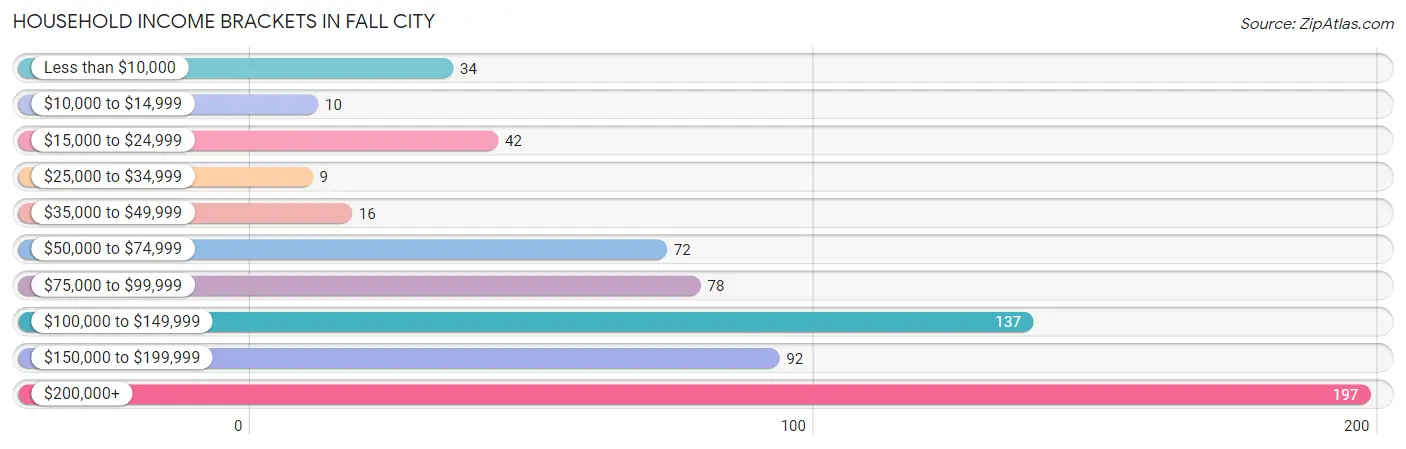
| Income Bracket | # Households | % Households |
| Less than $10,000 | 34 | 4.9% |
| $10,000 to $14,999 | 10 | 1.5% |
| $15,000 to $24,999 | 42 | 6.1% |
| $25,000 to $34,999 | 9 | 1.3% |
| $35,000 to $49,999 | 16 | 2.3% |
| $50,000 to $74,999 | 72 | 10.5% |
| $75,000 to $99,999 | 78 | 11.4% |
| $100,000 to $149,999 | 137 | 19.9% |
| $150,000 to $199,999 | 92 | 13.4% |
| $200,000+ | 197 | 28.7% |
Household Income by Householder Age in Fall City
The median household income in Fall City is $122,716, with the highest median household income of $246,765 found in the 25 to 44 years age bracket for the primary householder. A total of 168 households (24.4%) fall into this category.
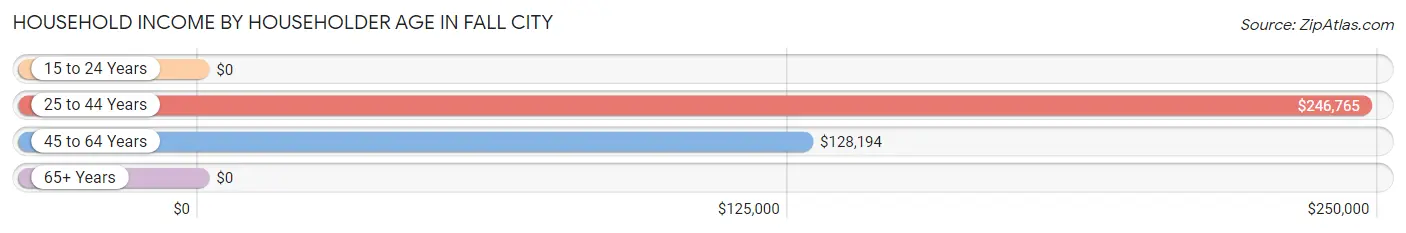
| Income Bracket | # Households | Median Income |
| 15 to 24 Years | 0 (0.0%) | $0 |
| 25 to 44 Years | 168 (24.4%) | $246,765 |
| 45 to 64 Years | 305 (44.4%) | $128,194 |
| 65+ Years | 214 (31.1%) | $0 |
| Total | 687 (100.0%) | $122,716 |
Poverty in Fall City
Income Below Poverty by Sex and Age in Fall City
With 0.7% poverty level for males and 12.0% for females among the residents of Fall City, 65 to 74 year old males and 75 year old and over females are the most vulnerable to poverty, with 8 males (5.5%) and 44 females (57.1%) in their respective age groups living below the poverty level.
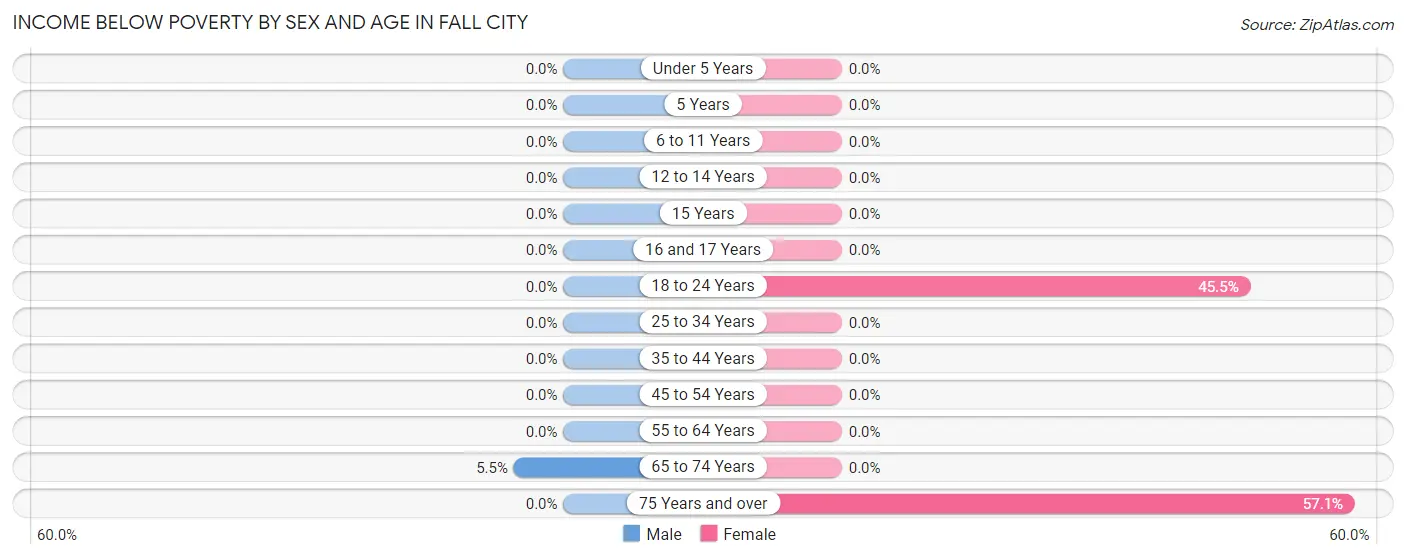
| Age Bracket | Male | Female |
| Under 5 Years | 0 (0.0%) | 0 (0.0%) |
| 5 Years | 0 (0.0%) | 0 (0.0%) |
| 6 to 11 Years | 0 (0.0%) | 0 (0.0%) |
| 12 to 14 Years | 0 (0.0%) | 0 (0.0%) |
| 15 Years | 0 (0.0%) | 0 (0.0%) |
| 16 and 17 Years | 0 (0.0%) | 0 (0.0%) |
| 18 to 24 Years | 0 (0.0%) | 71 (45.5%) |
| 25 to 34 Years | 0 (0.0%) | 0 (0.0%) |
| 35 to 44 Years | 0 (0.0%) | 0 (0.0%) |
| 45 to 54 Years | 0 (0.0%) | 0 (0.0%) |
| 55 to 64 Years | 0 (0.0%) | 0 (0.0%) |
| 65 to 74 Years | 8 (5.5%) | 0 (0.0%) |
| 75 Years and over | 0 (0.0%) | 44 (57.1%) |
| Total | 8 (0.7%) | 115 (12.0%) |
Income Above Poverty by Sex and Age in Fall City
According to the poverty statistics in Fall City, males aged under 5 years and females aged under 5 years are the age groups that are most secure financially, with 100.0% of males and 100.0% of females in these age groups living above the poverty line.
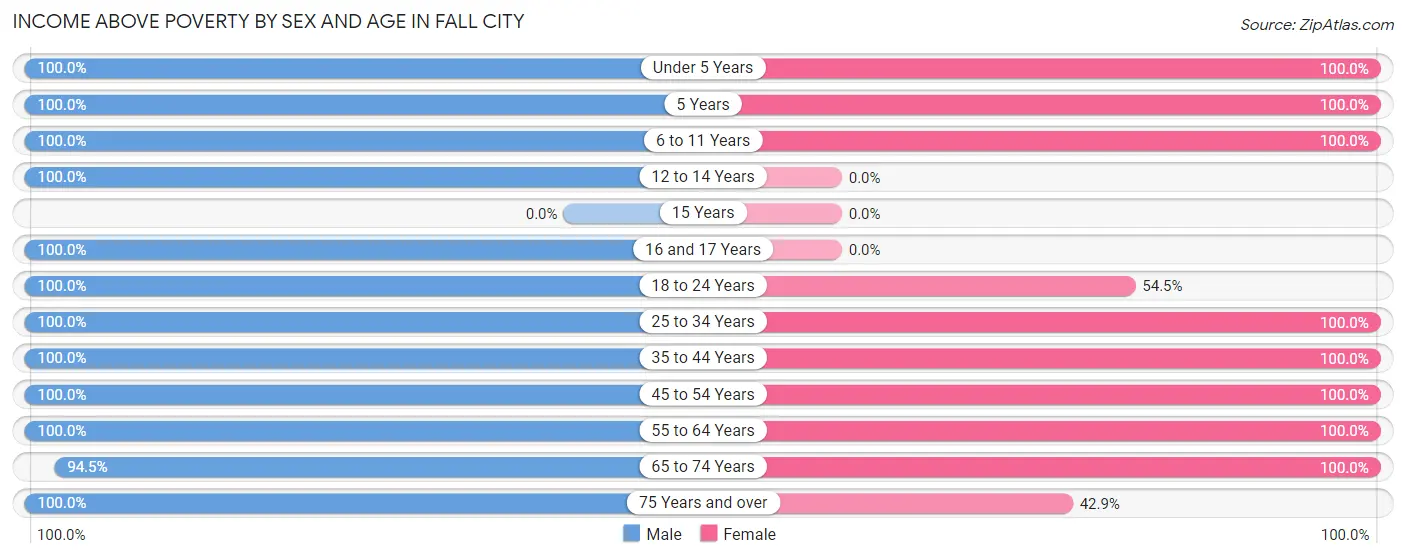
| Age Bracket | Male | Female |
| Under 5 Years | 204 (100.0%) | 48 (100.0%) |
| 5 Years | 6 (100.0%) | 10 (100.0%) |
| 6 to 11 Years | 63 (100.0%) | 34 (100.0%) |
| 12 to 14 Years | 59 (100.0%) | 0 (0.0%) |
| 15 Years | 0 (0.0%) | 0 (0.0%) |
| 16 and 17 Years | 20 (100.0%) | 0 (0.0%) |
| 18 to 24 Years | 18 (100.0%) | 85 (54.5%) |
| 25 to 34 Years | 16 (100.0%) | 152 (100.0%) |
| 35 to 44 Years | 214 (100.0%) | 105 (100.0%) |
| 45 to 54 Years | 162 (100.0%) | 84 (100.0%) |
| 55 to 64 Years | 102 (100.0%) | 172 (100.0%) |
| 65 to 74 Years | 137 (94.5%) | 116 (100.0%) |
| 75 Years and over | 55 (100.0%) | 33 (42.9%) |
| Total | 1,056 (99.3%) | 839 (87.9%) |
Income Below Poverty Among Married-Couple Families in Fall City
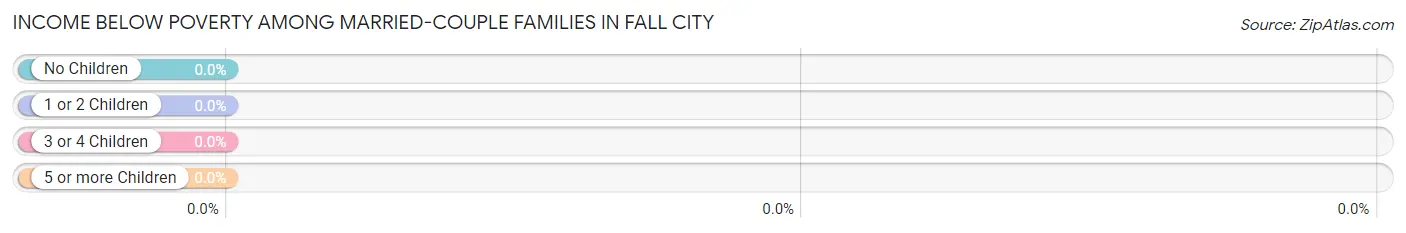
| Children | Above Poverty | Below Poverty |
| No Children | 293 (100.0%) | 0 (0.0%) |
| 1 or 2 Children | 146 (100.0%) | 0 (0.0%) |
| 3 or 4 Children | 30 (100.0%) | 0 (0.0%) |
| 5 or more Children | 0 (0.0%) | 0 (0.0%) |
| Total | 469 (100.0%) | 0 (0.0%) |
Income Below Poverty Among Single-Parent Households in Fall City
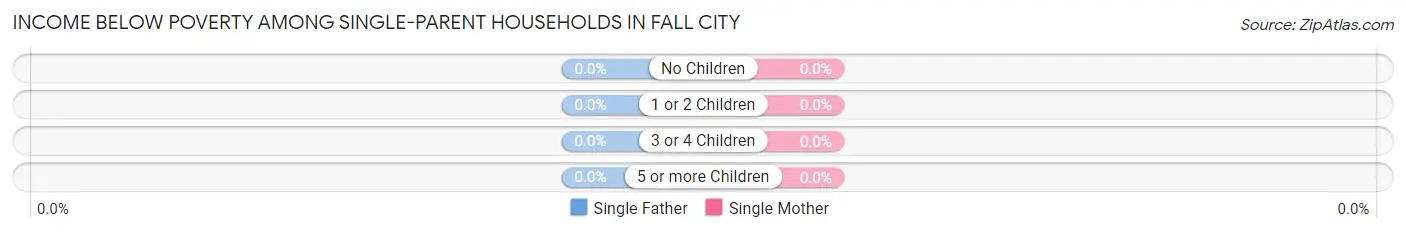
| Children | Single Father | Single Mother |
| No Children | 0 (0.0%) | 0 (0.0%) |
| 1 or 2 Children | 0 (0.0%) | 0 (0.0%) |
| 3 or 4 Children | 0 (0.0%) | 0 (0.0%) |
| 5 or more Children | 0 (0.0%) | 0 (0.0%) |
| Total | 0 (0.0%) | 0 (0.0%) |
Income Below Poverty Among Married-Couple vs Single-Parent Households in Fall City
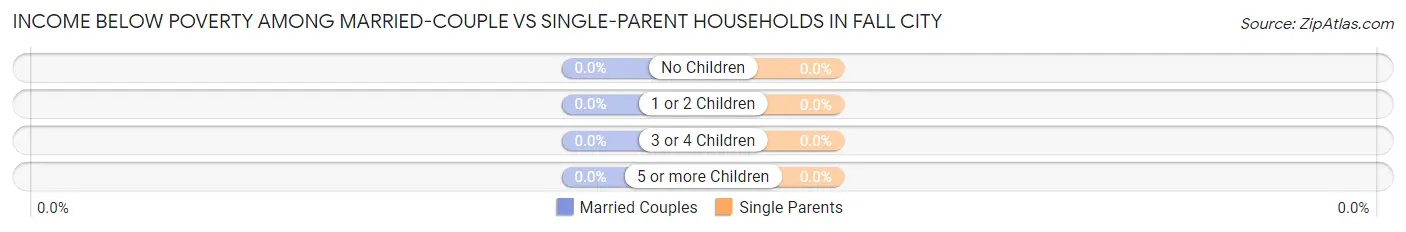
| Children | Married-Couple Families | Single-Parent Households |
| No Children | 0 (0.0%) | 0 (0.0%) |
| 1 or 2 Children | 0 (0.0%) | 0 (0.0%) |
| 3 or 4 Children | 0 (0.0%) | 0 (0.0%) |
| 5 or more Children | 0 (0.0%) | 0 (0.0%) |
| Total | 0 (0.0%) | 0 (0.0%) |
Race in Fall City
The most populous races in Fall City are White / Caucasian (1,612 | 79.9%), Two or more Races (242 | 12.0%), and Hispanic or Latino (81 | 4.0%).
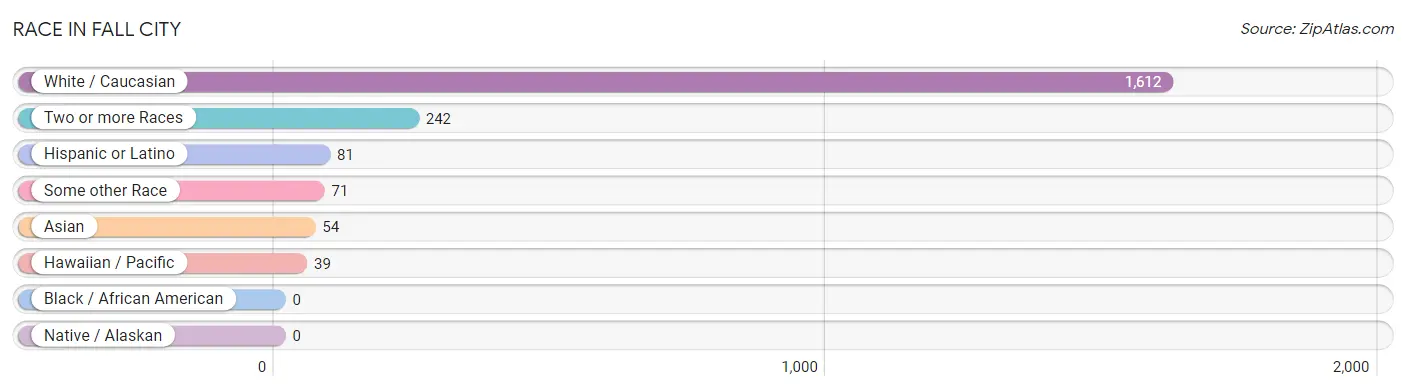
| Race | # Population | % Population |
| Asian | 54 | 2.7% |
| Black / African American | 0 | 0.0% |
| Hawaiian / Pacific | 39 | 1.9% |
| Hispanic or Latino | 81 | 4.0% |
| Native / Alaskan | 0 | 0.0% |
| White / Caucasian | 1,612 | 79.9% |
| Two or more Races | 242 | 12.0% |
| Some other Race | 71 | 3.5% |
| Total | 2,018 | 100.0% |
Ancestry in Fall City
The most populous ancestries reported in Fall City are Irish (420 | 20.8%), German (323 | 16.0%), Swedish (280 | 13.9%), English (246 | 12.2%), and Korean (134 | 6.6%), together accounting for 69.5% of all Fall City residents.
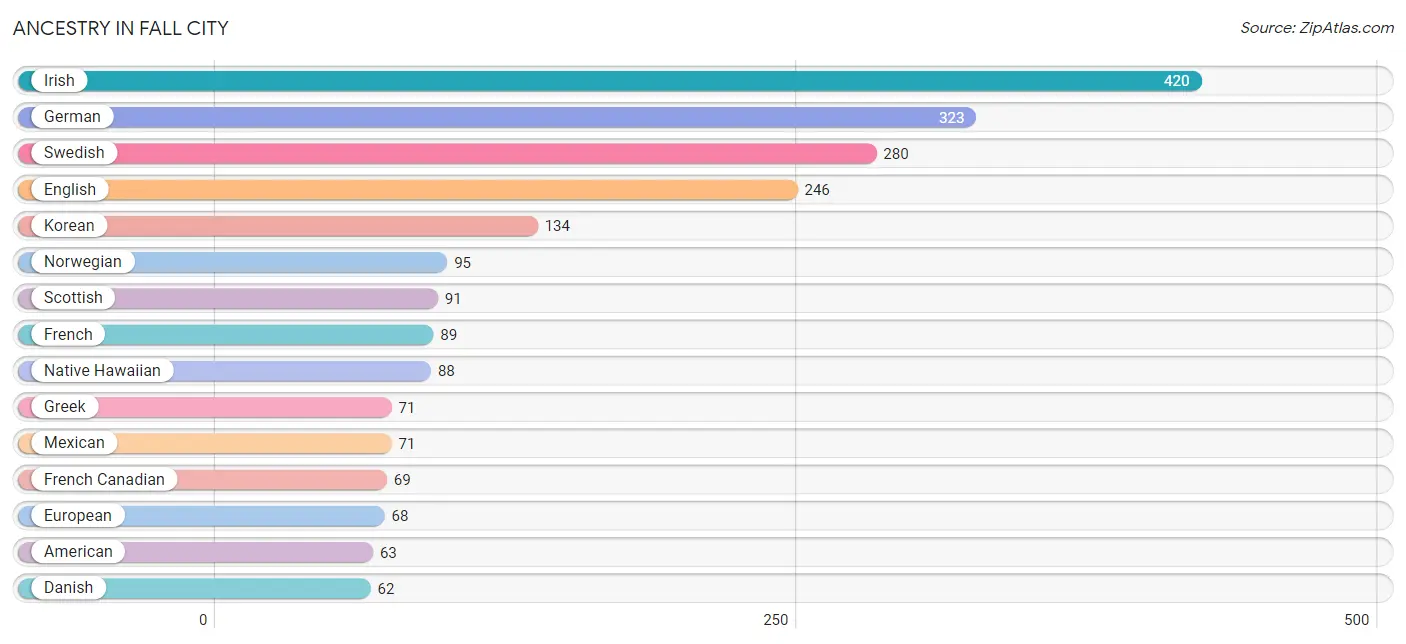
| Ancestry | # Population | % Population |
| American | 63 | 3.1% |
| Australian | 28 | 1.4% |
| Austrian | 9 | 0.4% |
| Bhutanese | 20 | 1.0% |
| Canadian | 22 | 1.1% |
| Central American | 10 | 0.5% |
| Danish | 62 | 3.1% |
| Dutch | 9 | 0.4% |
| English | 246 | 12.2% |
| European | 68 | 3.4% |
| French | 89 | 4.4% |
| French Canadian | 69 | 3.4% |
| German | 323 | 16.0% |
| Greek | 71 | 3.5% |
| Guamanian / Chamorro | 24 | 1.2% |
| Guatemalan | 10 | 0.5% |
| Irish | 420 | 20.8% |
| Italian | 56 | 2.8% |
| Korean | 134 | 6.6% |
| Mexican | 71 | 3.5% |
| Native Hawaiian | 88 | 4.4% |
| Northern European | 43 | 2.1% |
| Norwegian | 95 | 4.7% |
| Polish | 9 | 0.4% |
| Scandinavian | 10 | 0.5% |
| Scotch-Irish | 29 | 1.4% |
| Scottish | 91 | 4.5% |
| Slovak | 17 | 0.8% |
| Swedish | 280 | 13.9% |
| Thai | 21 | 1.0% |
| Trinidadian and Tobagonian | 21 | 1.0% |
| Ukrainian | 27 | 1.3% |
| Welsh | 8 | 0.4% | View All 33 Rows |
Immigrants in Fall City
The most numerous immigrant groups reported in Fall City came from Latin America (88 | 4.4%), Central America (81 | 4.0%), Mexico (71 | 3.5%), Canada (38 | 1.9%), and Guatemala (10 | 0.5%), together accounting for 14.3% of all Fall City residents.
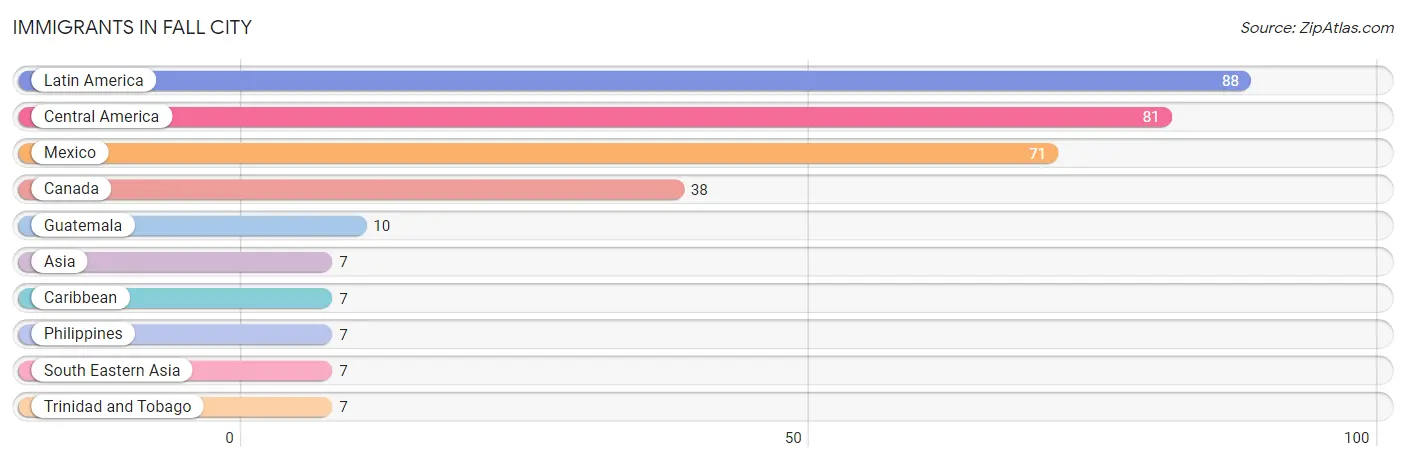
| Immigration Origin | # Population | % Population |
| Asia | 7 | 0.4% |
| Canada | 38 | 1.9% |
| Caribbean | 7 | 0.4% |
| Central America | 81 | 4.0% |
| Guatemala | 10 | 0.5% |
| Latin America | 88 | 4.4% |
| Mexico | 71 | 3.5% |
| Philippines | 7 | 0.4% |
| South Eastern Asia | 7 | 0.4% |
| Trinidad and Tobago | 7 | 0.4% | View All 10 Rows |
Sex and Age in Fall City
Sex and Age in Fall City
The most populous age groups in Fall City are Under 5 Years (204 | 19.2%) for men and 55 to 59 Years (113 | 11.8%) for women.
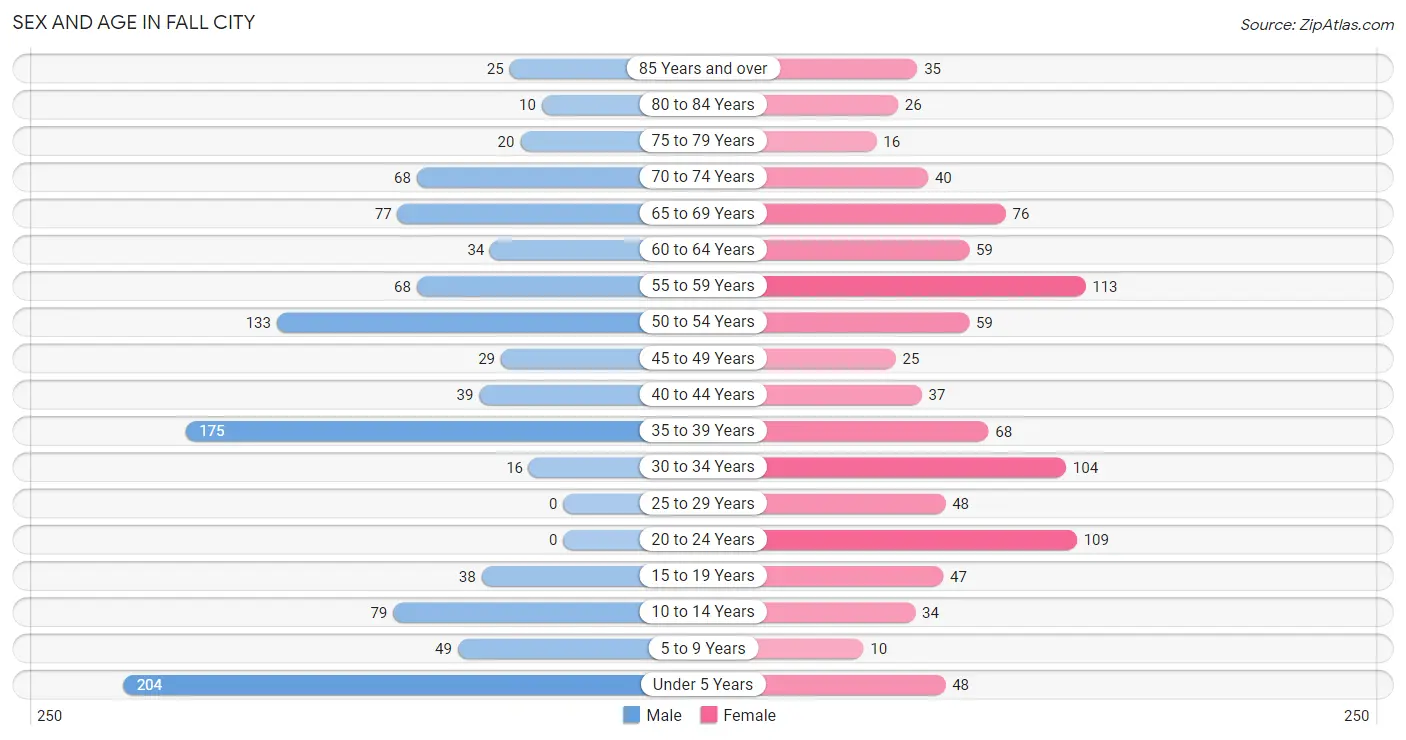
| Age Bracket | Male | Female |
| Under 5 Years | 204 (19.2%) | 48 (5.0%) |
| 5 to 9 Years | 49 (4.6%) | 10 (1.1%) |
| 10 to 14 Years | 79 (7.4%) | 34 (3.6%) |
| 15 to 19 Years | 38 (3.6%) | 47 (4.9%) |
| 20 to 24 Years | 0 (0.0%) | 109 (11.4%) |
| 25 to 29 Years | 0 (0.0%) | 48 (5.0%) |
| 30 to 34 Years | 16 (1.5%) | 104 (10.9%) |
| 35 to 39 Years | 175 (16.5%) | 68 (7.1%) |
| 40 to 44 Years | 39 (3.7%) | 37 (3.9%) |
| 45 to 49 Years | 29 (2.7%) | 25 (2.6%) |
| 50 to 54 Years | 133 (12.5%) | 59 (6.2%) |
| 55 to 59 Years | 68 (6.4%) | 113 (11.8%) |
| 60 to 64 Years | 34 (3.2%) | 59 (6.2%) |
| 65 to 69 Years | 77 (7.2%) | 76 (8.0%) |
| 70 to 74 Years | 68 (6.4%) | 40 (4.2%) |
| 75 to 79 Years | 20 (1.9%) | 16 (1.7%) |
| 80 to 84 Years | 10 (0.9%) | 26 (2.7%) |
| 85 Years and over | 25 (2.4%) | 35 (3.7%) |
| Total | 1,064 (100.0%) | 954 (100.0%) |
Families and Households in Fall City
Median Family Size in Fall City
The median family size in Fall City is 3.22 persons per family, with single female/mother families (53 | 9.5%) accounting for the largest median family size of 4.23 persons per family. On the other hand, married-couple families (469 | 83.9%) represent the smallest median family size with 3.10 persons per family.
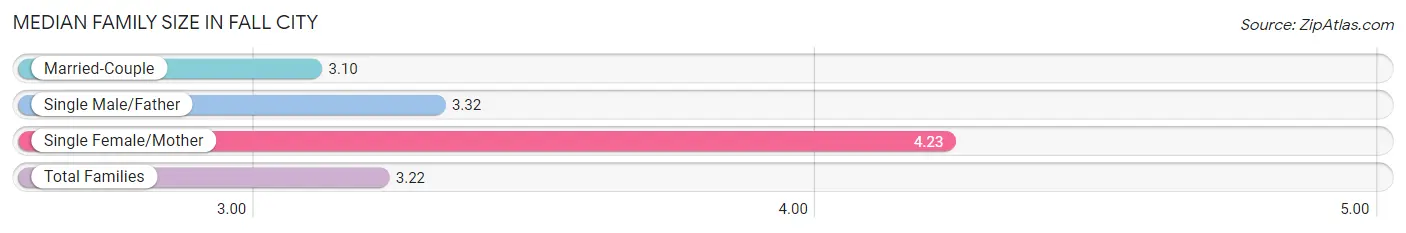
| Family Type | # Families | Family Size |
| Married-Couple | 469 (83.9%) | 3.10 |
| Single Male/Father | 37 (6.6%) | 3.32 |
| Single Female/Mother | 53 (9.5%) | 4.23 |
| Total Families | 559 (100.0%) | 3.22 |
Median Household Size in Fall City
The median household size in Fall City is 2.94 persons per household, with single female/mother households (53 | 7.7%) accounting for the largest median household size of 4.23 persons per household. non-family households (128 | 18.6%) represent the smallest median household size with 1.15 persons per household.
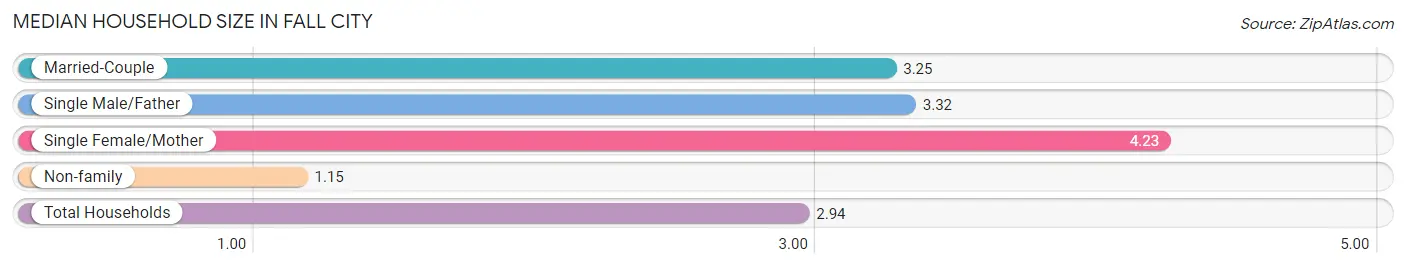
| Household Type | # Households | Household Size |
| Married-Couple | 469 (68.3%) | 3.25 |
| Single Male/Father | 37 (5.4%) | 3.32 |
| Single Female/Mother | 53 (7.7%) | 4.23 |
| Non-family | 128 (18.6%) | 1.15 |
| Total Households | 687 (100.0%) | 2.94 |
Household Size by Marriage Status in Fall City
Out of a total of 687 households in Fall City, 559 (81.4%) are family households, while 128 (18.6%) are nonfamily households. The most numerous type of family households are 2-person households, comprising 219, and the most common type of nonfamily households are 1-person households, comprising 110.
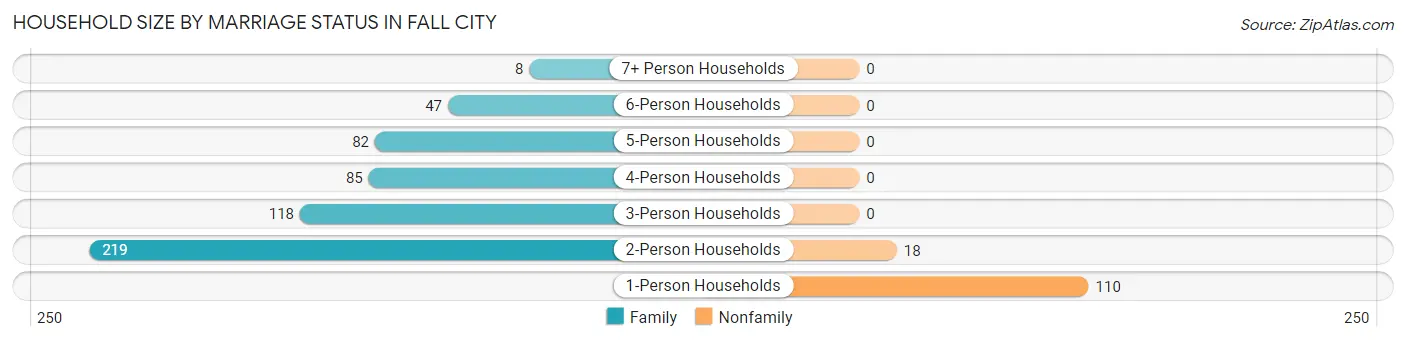
| Household Size | Family Households | Nonfamily Households |
| 1-Person Households | - | 110 (16.0%) |
| 2-Person Households | 219 (31.9%) | 18 (2.6%) |
| 3-Person Households | 118 (17.2%) | 0 (0.0%) |
| 4-Person Households | 85 (12.4%) | 0 (0.0%) |
| 5-Person Households | 82 (11.9%) | 0 (0.0%) |
| 6-Person Households | 47 (6.8%) | 0 (0.0%) |
| 7+ Person Households | 8 (1.2%) | 0 (0.0%) |
| Total | 559 (81.4%) | 128 (18.6%) |
Female Fertility in Fall City
Fertility by Age in Fall City
Average fertility rate in Fall City is 167.0 births per 1,000 women. Women in the age bracket of 20 to 34 years have the highest fertility rate with 280.0 births per 1,000 women. Women in the age bracket of 20 to 34 years acount for 100.0% of all women with births.
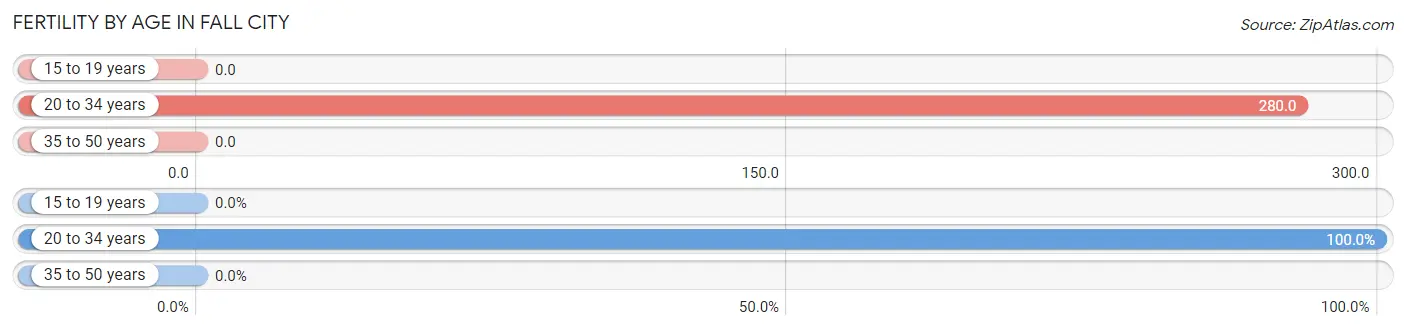
| Age Bracket | Women with Births | Births / 1,000 Women |
| 15 to 19 years | 0 (0.0%) | 0.0 |
| 20 to 34 years | 73 (100.0%) | 280.0 |
| 35 to 50 years | 0 (0.0%) | 0.0 |
| Total | 73 (100.0%) | 167.0 |
Fertility by Age by Marriage Status in Fall City
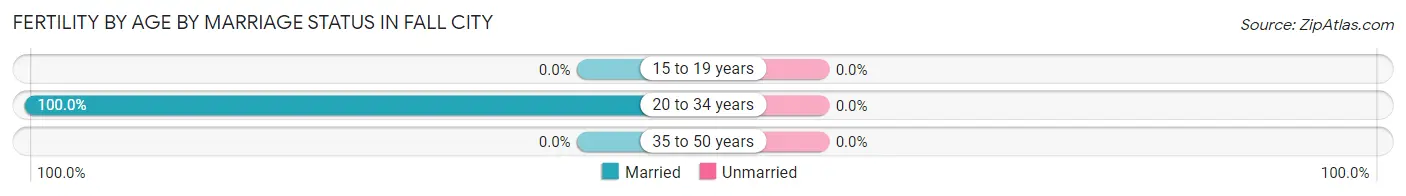
| Age Bracket | Married | Unmarried |
| 15 to 19 years | 0 (0.0%) | 0 (0.0%) |
| 20 to 34 years | 73 (100.0%) | 0 (0.0%) |
| 35 to 50 years | 0 (0.0%) | 0 (0.0%) |
| Total | 73 (100.0%) | 0 (0.0%) |
Fertility by Education in Fall City
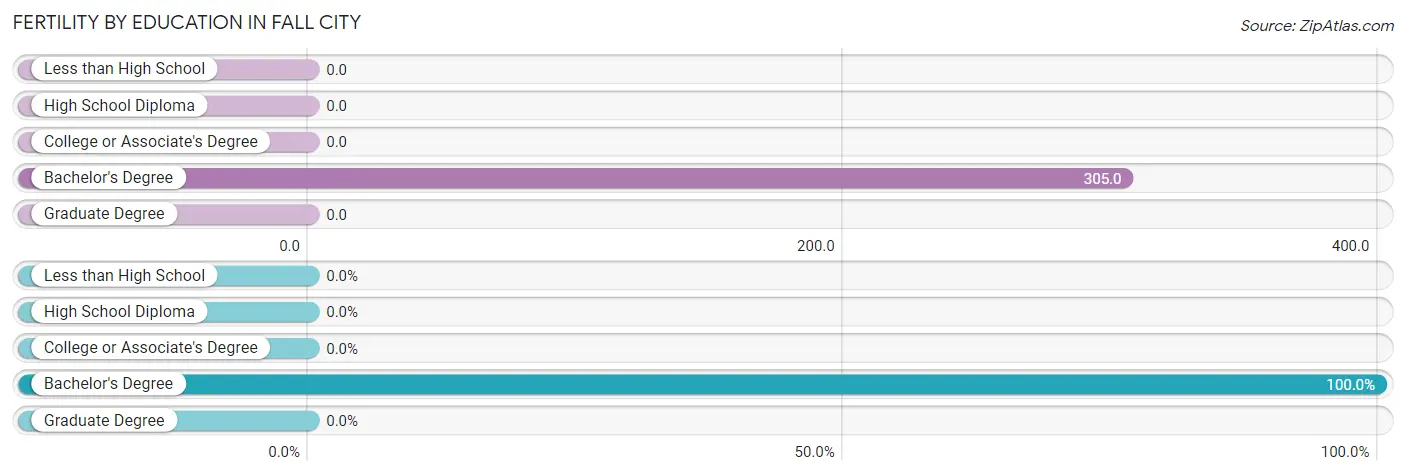
| Educational Attainment | Women with Births | Births / 1,000 Women |
| Less than High School | 0 (0.0%) | 0.0 |
| High School Diploma | 0 (0.0%) | 0.0 |
| College or Associate's Degree | 0 (0.0%) | 0.0 |
| Bachelor's Degree | 73 (100.0%) | 305.0 |
| Graduate Degree | 0 (0.0%) | 0.0 |
| Total | 73 (100.0%) | 167.0 |
Fertility by Education by Marriage Status in Fall City
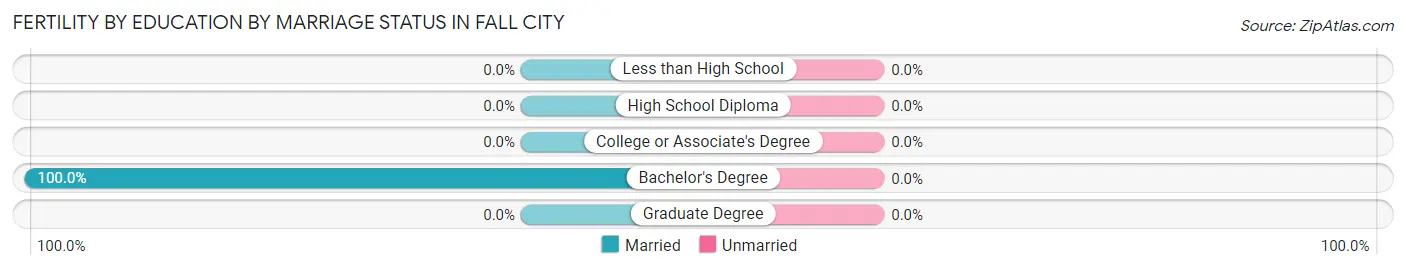
| Educational Attainment | Married | Unmarried |
| Less than High School | 0 (0.0%) | 0 (0.0%) |
| High School Diploma | 0 (0.0%) | 0 (0.0%) |
| College or Associate's Degree | 0 (0.0%) | 0 (0.0%) |
| Bachelor's Degree | 73 (100.0%) | 0 (0.0%) |
| Graduate Degree | 0 (0.0%) | 0 (0.0%) |
| Total | 73 (100.0%) | 0 (0.0%) |
Employment Characteristics in Fall City
Employment by Class of Employer in Fall City
Among the 953 employed individuals in Fall City, private company employees (675 | 70.8%), local government employees (80 | 8.4%), and self-employed (incorporated) (77 | 8.1%) make up the most common classes of employment.
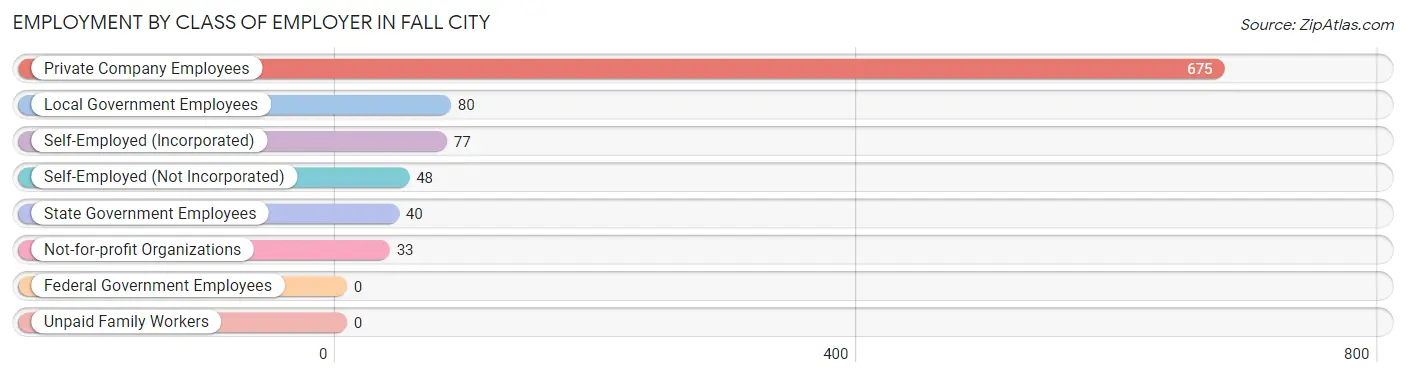
| Employer Class | # Employees | % Employees |
| Private Company Employees | 675 | 70.8% |
| Self-Employed (Incorporated) | 77 | 8.1% |
| Self-Employed (Not Incorporated) | 48 | 5.0% |
| Not-for-profit Organizations | 33 | 3.5% |
| Local Government Employees | 80 | 8.4% |
| State Government Employees | 40 | 4.2% |
| Federal Government Employees | 0 | 0.0% |
| Unpaid Family Workers | 0 | 0.0% |
| Total | 953 | 100.0% |
Employment Status by Age in Fall City
According to the labor force statistics for Fall City, out of the total population over 16 years of age (1,594), 63.7% or 1,015 individuals are in the labor force, with 3.2% or 32 of them unemployed. The age group with the highest labor force participation rate is 25 to 29 years, with 100.0% or 48 individuals in the labor force. Within the labor force, the 30 to 34 years age range has the highest percentage of unemployed individuals, with 29.2% or 33 of them being unemployed.
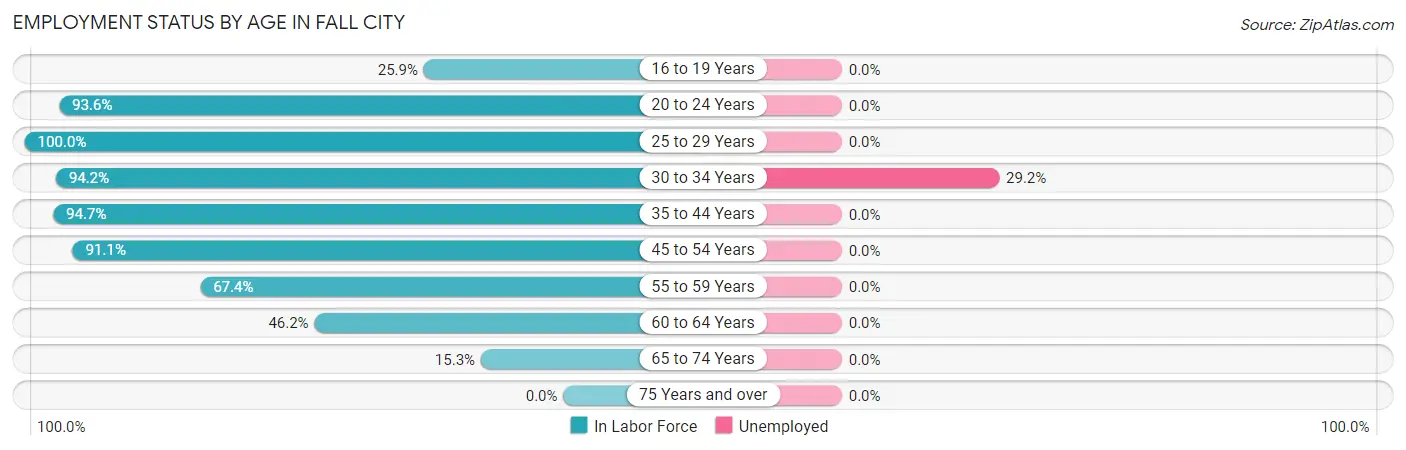
| Age Bracket | In Labor Force | Unemployed |
| 16 to 19 Years | 22 (25.9%) | 0 (0.0%) |
| 20 to 24 Years | 102 (93.6%) | 0 (0.0%) |
| 25 to 29 Years | 48 (100.0%) | 0 (0.0%) |
| 30 to 34 Years | 113 (94.2%) | 33 (29.2%) |
| 35 to 44 Years | 302 (94.7%) | 0 (0.0%) |
| 45 to 54 Years | 224 (91.1%) | 0 (0.0%) |
| 55 to 59 Years | 122 (67.4%) | 0 (0.0%) |
| 60 to 64 Years | 43 (46.2%) | 0 (0.0%) |
| 65 to 74 Years | 40 (15.3%) | 0 (0.0%) |
| 75 Years and over | 0 (0.0%) | 0 (0.0%) |
| Total | 1,015 (63.7%) | 32 (3.2%) |
Employment Status by Educational Attainment in Fall City
According to labor force statistics for Fall City, 84.6% of individuals (852) out of the total population between 25 and 64 years of age (1,007) are in the labor force, with 3.9% or 33 of them being unemployed. The group with the highest labor force participation rate are those with the educational attainment of college / associate degree, with 92.3% or 227 individuals in the labor force. Within the labor force, individuals with less than high school education have the highest percentage of unemployment, with 14.8% or 9 of them being unemployed.
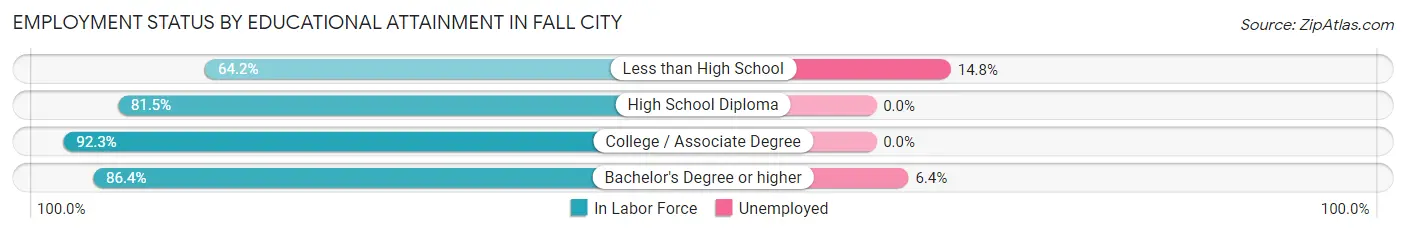
| Educational Attainment | In Labor Force | Unemployed |
| Less than High School | 61 (64.2%) | 14 (14.8%) |
| High School Diploma | 189 (81.5%) | 0 (0.0%) |
| College / Associate Degree | 227 (92.3%) | 0 (0.0%) |
| Bachelor's Degree or higher | 375 (86.4%) | 28 (6.4%) |
| Total | 852 (84.6%) | 39 (3.9%) |
Employment Occupations by Sex in Fall City
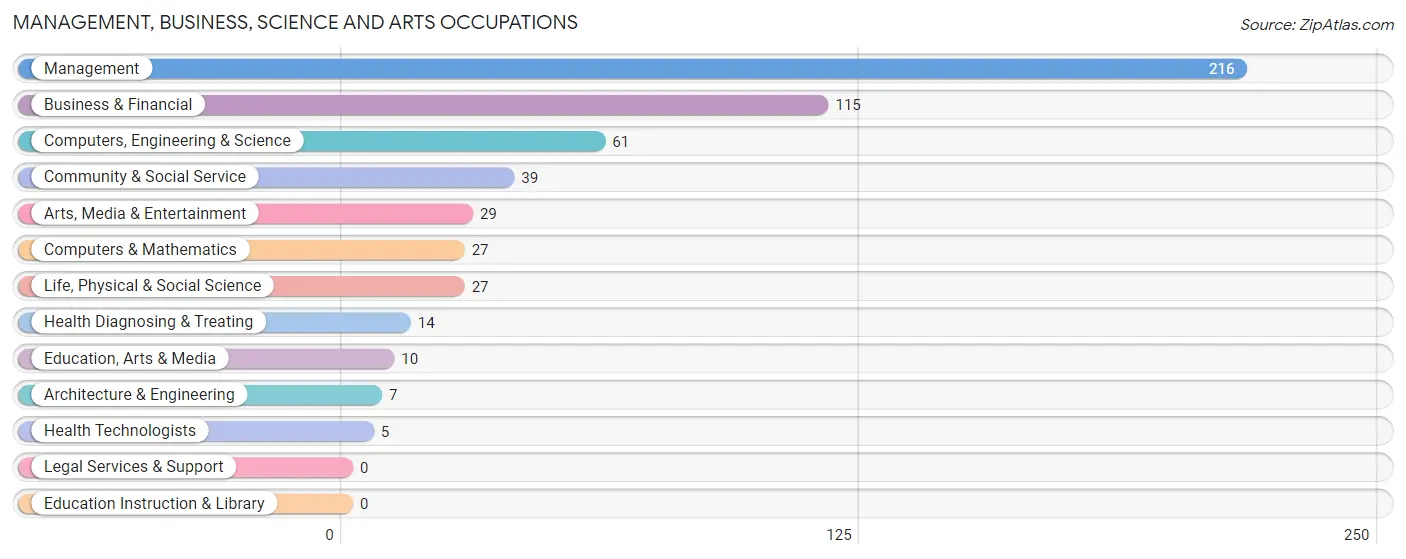
Management, Business, Science and Arts Occupations
The most common Management, Business, Science and Arts occupations in Fall City are Management (216 | 22.0%), Business & Financial (115 | 11.7%), Computers, Engineering & Science (61 | 6.2%), Community & Social Service (39 | 4.0%), and Arts, Media & Entertainment (29 | 2.9%).
Management, Business, Science and Arts Occupations by Sex
Within the Management, Business, Science and Arts occupations in Fall City, the most male-oriented occupations are Computers & Mathematics (100.0%), Architecture & Engineering (100.0%), and Community & Social Service (100.0%), while the most female-oriented occupations are Life, Physical & Social Science (100.0%), Health Diagnosing & Treating (100.0%), and Health Technologists (100.0%).
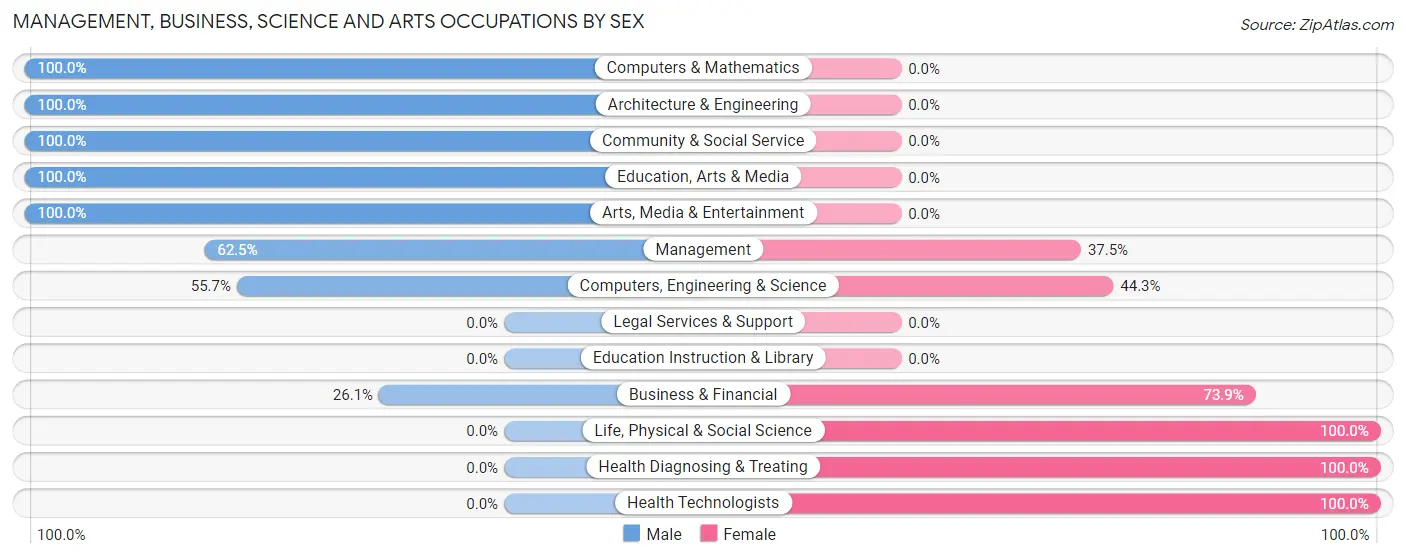
| Occupation | Male | Female |
| Management | 135 (62.5%) | 81 (37.5%) |
| Business & Financial | 30 (26.1%) | 85 (73.9%) |
| Computers, Engineering & Science | 34 (55.7%) | 27 (44.3%) |
| Computers & Mathematics | 27 (100.0%) | 0 (0.0%) |
| Architecture & Engineering | 7 (100.0%) | 0 (0.0%) |
| Life, Physical & Social Science | 0 (0.0%) | 27 (100.0%) |
| Community & Social Service | 39 (100.0%) | 0 (0.0%) |
| Education, Arts & Media | 10 (100.0%) | 0 (0.0%) |
| Legal Services & Support | 0 (0.0%) | 0 (0.0%) |
| Education Instruction & Library | 0 (0.0%) | 0 (0.0%) |
| Arts, Media & Entertainment | 29 (100.0%) | 0 (0.0%) |
| Health Diagnosing & Treating | 0 (0.0%) | 14 (100.0%) |
| Health Technologists | 0 (0.0%) | 5 (100.0%) |
| Total (Category) | 238 (53.5%) | 207 (46.5%) |
| Total (Overall) | 488 (49.6%) | 495 (50.4%) |
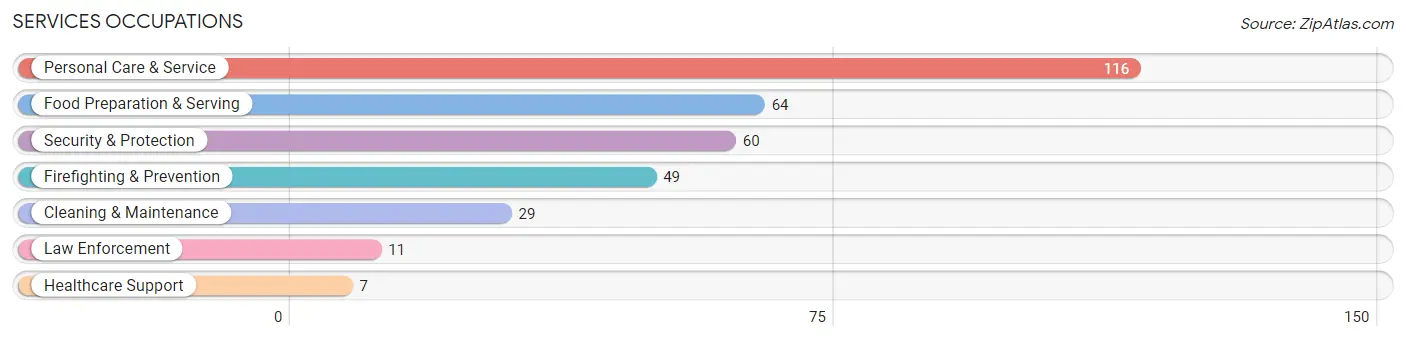
Services Occupations
The most common Services occupations in Fall City are Personal Care & Service (116 | 11.8%), Food Preparation & Serving (64 | 6.5%), Security & Protection (60 | 6.1%), Firefighting & Prevention (49 | 5.0%), and Cleaning & Maintenance (29 | 2.9%).
Services Occupations by Sex
Within the Services occupations in Fall City, the most male-oriented occupations are Security & Protection (100.0%), Firefighting & Prevention (100.0%), and Law Enforcement (100.0%), while the most female-oriented occupations are Healthcare Support (100.0%), Personal Care & Service (100.0%), and Food Preparation & Serving (85.9%).
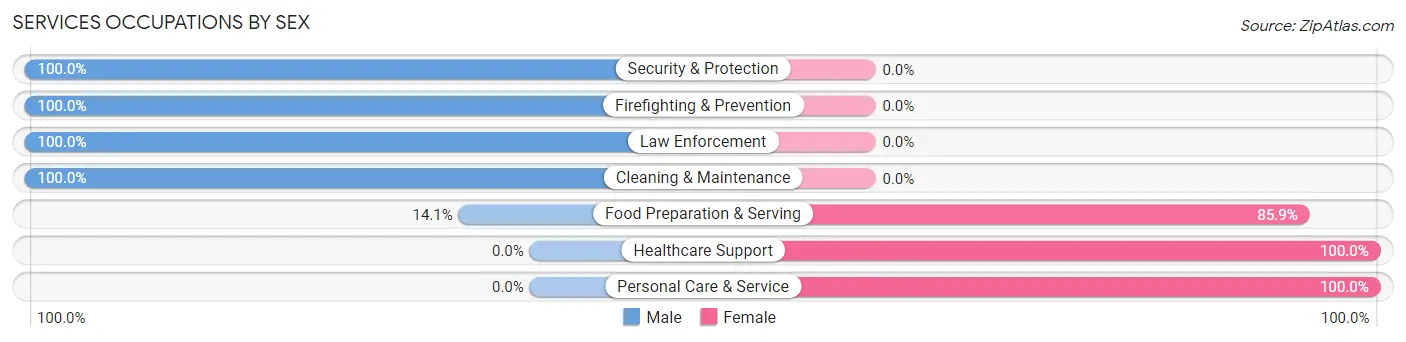
| Occupation | Male | Female |
| Healthcare Support | 0 (0.0%) | 7 (100.0%) |
| Security & Protection | 60 (100.0%) | 0 (0.0%) |
| Firefighting & Prevention | 49 (100.0%) | 0 (0.0%) |
| Law Enforcement | 11 (100.0%) | 0 (0.0%) |
| Food Preparation & Serving | 9 (14.1%) | 55 (85.9%) |
| Cleaning & Maintenance | 29 (100.0%) | 0 (0.0%) |
| Personal Care & Service | 0 (0.0%) | 116 (100.0%) |
| Total (Category) | 98 (35.5%) | 178 (64.5%) |
| Total (Overall) | 488 (49.6%) | 495 (50.4%) |
Sales and Office Occupations
The most common Sales and Office occupations in Fall City are Sales & Related (80 | 8.1%), and Office & Administration (53 | 5.4%).
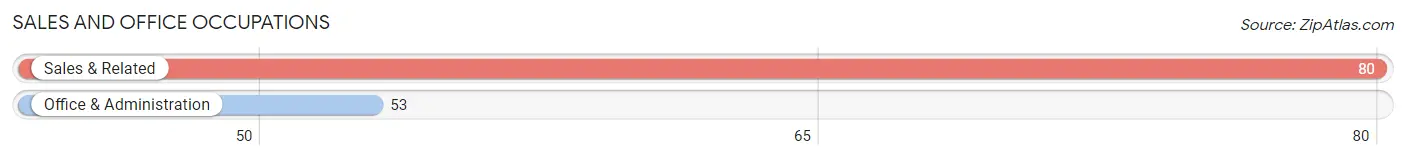
Sales and Office Occupations by Sex
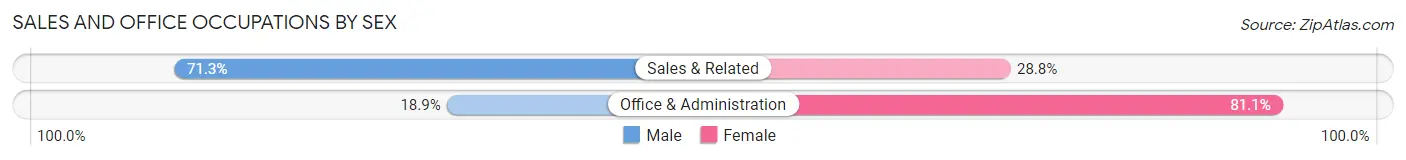
| Occupation | Male | Female |
| Sales & Related | 57 (71.3%) | 23 (28.7%) |
| Office & Administration | 10 (18.9%) | 43 (81.1%) |
| Total (Category) | 67 (50.4%) | 66 (49.6%) |
| Total (Overall) | 488 (49.6%) | 495 (50.4%) |
Natural Resources, Construction and Maintenance Occupations
The most common Natural Resources, Construction and Maintenance occupations in Fall City are Construction & Extraction (42 | 4.3%), and Installation, Maintenance & Repair (9 | 0.9%).
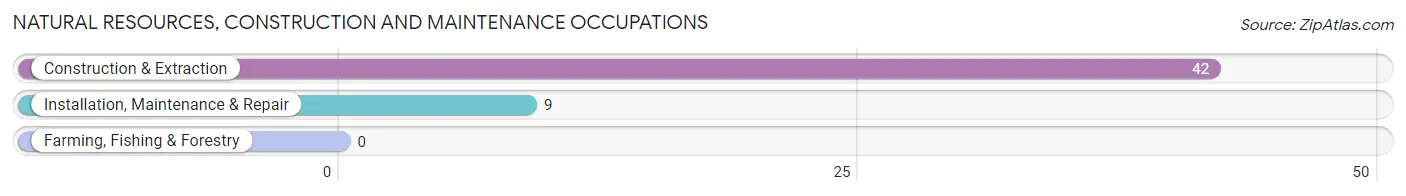
Natural Resources, Construction and Maintenance Occupations by Sex
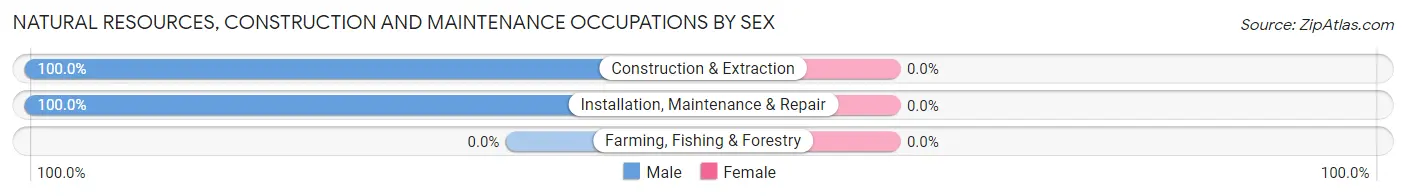
| Occupation | Male | Female |
| Farming, Fishing & Forestry | 0 (0.0%) | 0 (0.0%) |
| Construction & Extraction | 42 (100.0%) | 0 (0.0%) |
| Installation, Maintenance & Repair | 9 (100.0%) | 0 (0.0%) |
| Total (Category) | 51 (100.0%) | 0 (0.0%) |
| Total (Overall) | 488 (49.6%) | 495 (50.4%) |
Production, Transportation and Moving Occupations
The most common Production, Transportation and Moving occupations in Fall City are Material Moving (53 | 5.4%), and Transportation (25 | 2.5%).
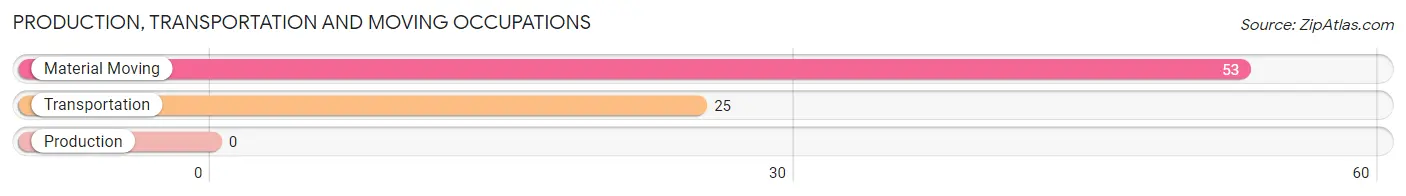
Production, Transportation and Moving Occupations by Sex
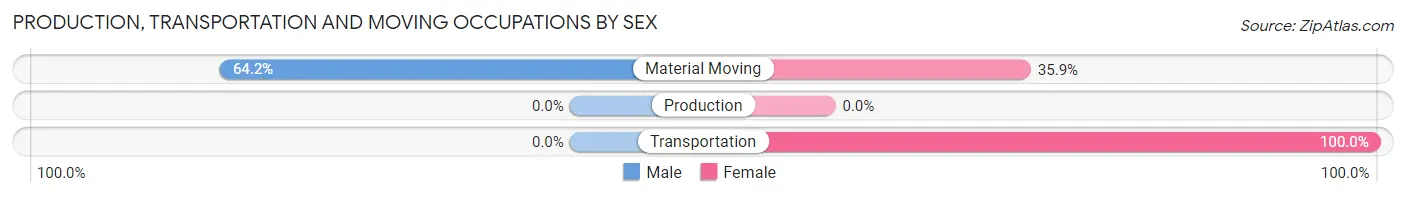
| Occupation | Male | Female |
| Production | 0 (0.0%) | 0 (0.0%) |
| Transportation | 0 (0.0%) | 25 (100.0%) |
| Material Moving | 34 (64.1%) | 19 (35.8%) |
| Total (Category) | 34 (43.6%) | 44 (56.4%) |
| Total (Overall) | 488 (49.6%) | 495 (50.4%) |
Employment Industries by Sex in Fall City
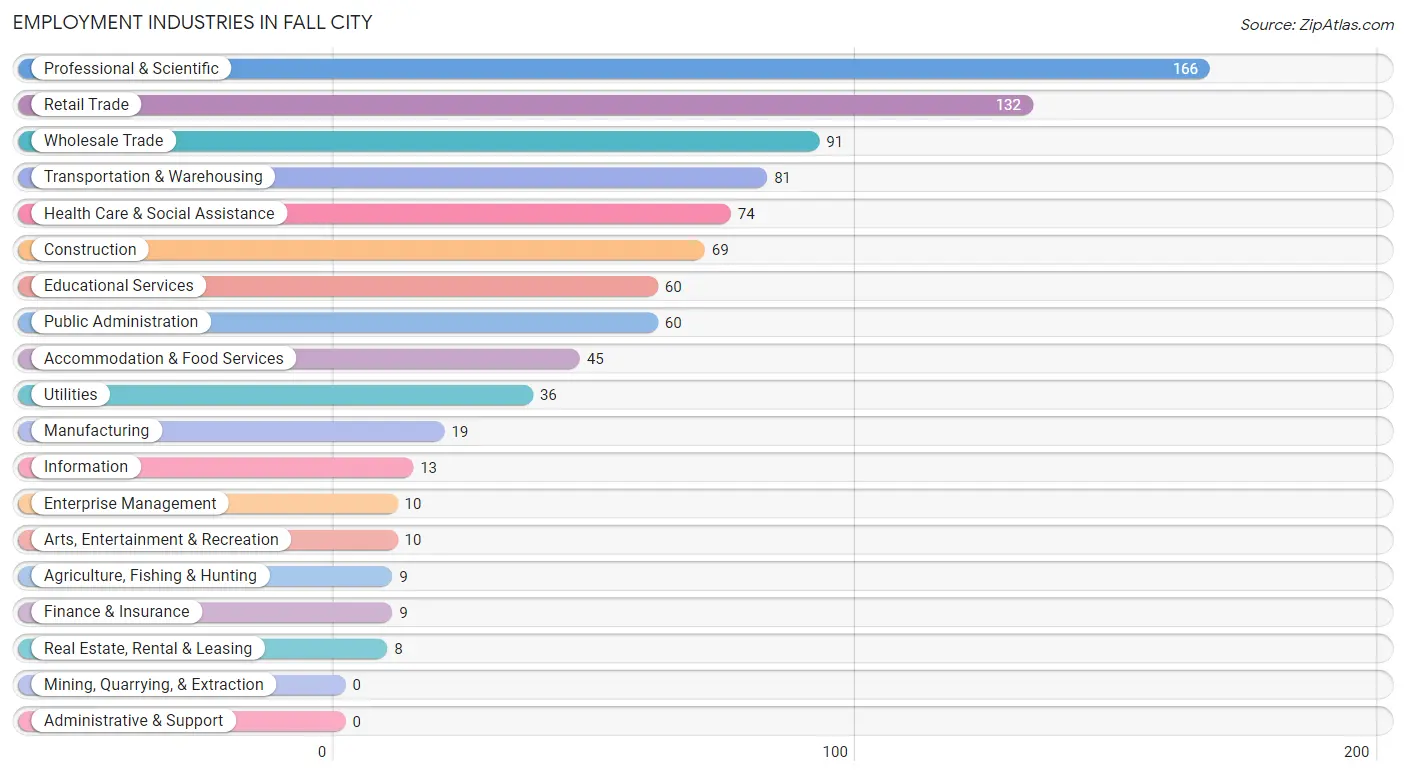
Employment Industries in Fall City
The major employment industries in Fall City include Professional & Scientific (166 | 16.9%), Retail Trade (132 | 13.4%), Wholesale Trade (91 | 9.3%), Transportation & Warehousing (81 | 8.2%), and Health Care & Social Assistance (74 | 7.5%).
Employment Industries by Sex in Fall City
The Fall City industries that see more men than women are Agriculture, Fishing & Hunting (100.0%), Construction (100.0%), and Wholesale Trade (100.0%), whereas the industries that tend to have a higher number of women are Information (100.0%), Finance & Insurance (100.0%), and Real Estate, Rental & Leasing (100.0%).
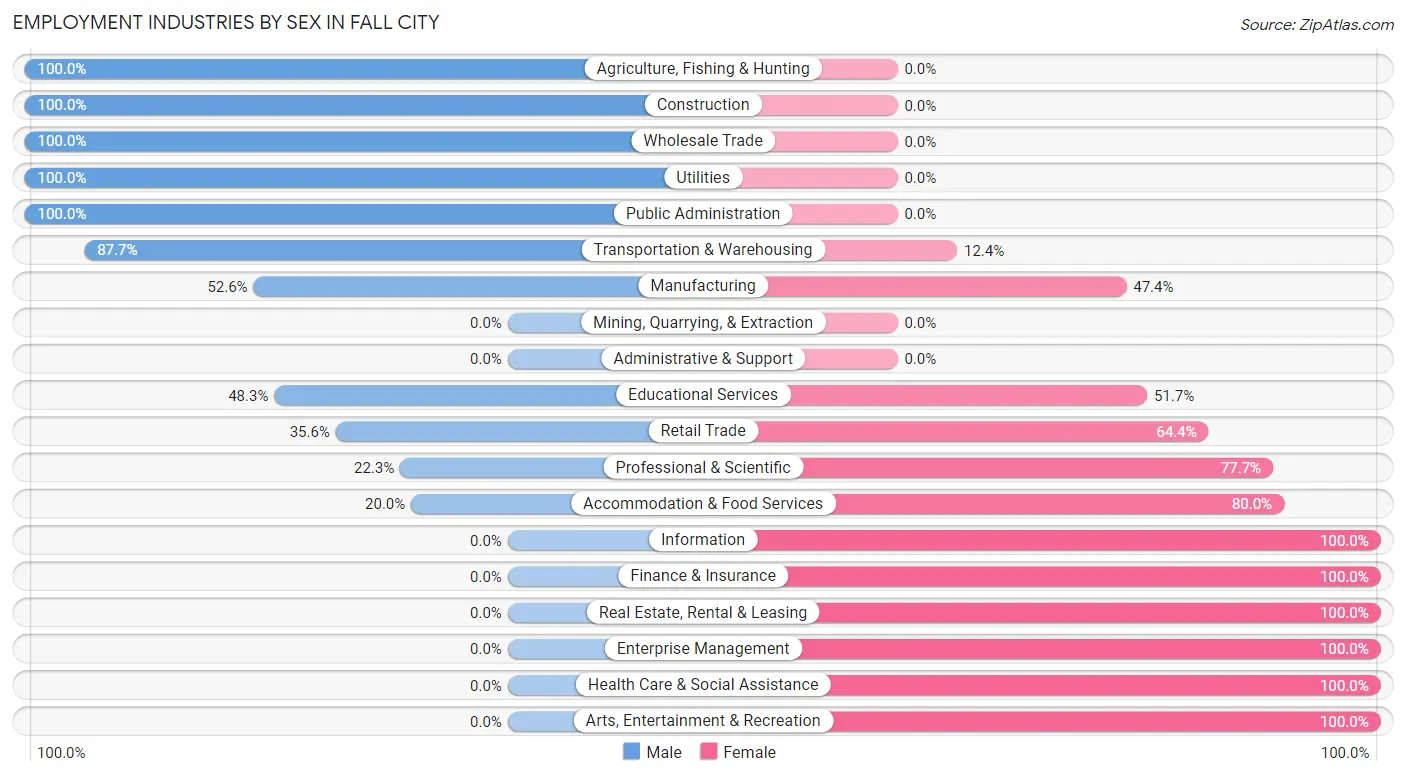
| Industry | Male | Female |
| Agriculture, Fishing & Hunting | 9 (100.0%) | 0 (0.0%) |
| Mining, Quarrying, & Extraction | 0 (0.0%) | 0 (0.0%) |
| Construction | 69 (100.0%) | 0 (0.0%) |
| Manufacturing | 10 (52.6%) | 9 (47.4%) |
| Wholesale Trade | 91 (100.0%) | 0 (0.0%) |
| Retail Trade | 47 (35.6%) | 85 (64.4%) |
| Transportation & Warehousing | 71 (87.6%) | 10 (12.3%) |
| Utilities | 36 (100.0%) | 0 (0.0%) |
| Information | 0 (0.0%) | 13 (100.0%) |
| Finance & Insurance | 0 (0.0%) | 9 (100.0%) |
| Real Estate, Rental & Leasing | 0 (0.0%) | 8 (100.0%) |
| Professional & Scientific | 37 (22.3%) | 129 (77.7%) |
| Enterprise Management | 0 (0.0%) | 10 (100.0%) |
| Administrative & Support | 0 (0.0%) | 0 (0.0%) |
| Educational Services | 29 (48.3%) | 31 (51.7%) |
| Health Care & Social Assistance | 0 (0.0%) | 74 (100.0%) |
| Arts, Entertainment & Recreation | 0 (0.0%) | 10 (100.0%) |
| Accommodation & Food Services | 9 (20.0%) | 36 (80.0%) |
| Public Administration | 60 (100.0%) | 0 (0.0%) |
| Total | 488 (49.6%) | 495 (50.4%) |
Education in Fall City
School Enrollment in Fall City
The most common levels of schooling among the 412 students in Fall City are college / undergraduate (98 | 23.8%), nursery / preschool (88 | 21.4%), and middle school (87 | 21.1%).
| School Level | # Students | % Students |
| Nursery / Preschool | 88 | 21.4% |
| Kindergarten | 16 | 3.9% |
| Elementary School | 69 | 16.8% |
| Middle School | 87 | 21.1% |
| High School | 54 | 13.1% |
| College / Undergraduate | 98 | 23.8% |
| Graduate / Professional | 0 | 0.0% |
| Total | 412 | 100.0% |
School Enrollment by Age by Funding Source in Fall City
Out of a total of 412 students who are enrolled in schools in Fall City, 212 (51.5%) attend a private institution, while the remaining 200 (48.5%) are enrolled in public schools. The age group of 3 to 4 year olds has the highest likelihood of being enrolled in private schools, with 88 (100.0% in the age bracket) enrolled. Conversely, the age group of 5 to 9 year old has the lowest likelihood of being enrolled in a private school, with 59 (100.0% in the age bracket) attending a public institution.
| Age Bracket | Public School | Private School |
| 3 to 4 Year Olds | 0 (0.0%) | 88 (100.0%) |
| 5 to 9 Year Old | 59 (100.0%) | 0 (0.0%) |
| 10 to 14 Year Olds | 87 (77.0%) | 26 (23.0%) |
| 15 to 17 Year Olds | 20 (100.0%) | 0 (0.0%) |
| 18 to 19 Year Olds | 34 (72.3%) | 13 (27.7%) |
| 20 to 24 Year Olds | 0 (0.0%) | 85 (100.0%) |
| 25 to 34 Year Olds | 0 (0.0%) | 0 (0.0%) |
| 35 Years and over | 0 (0.0%) | 0 (0.0%) |
| Total | 200 (48.5%) | 212 (51.5%) |
Educational Attainment by Field of Study in Fall City
Business (206 | 33.2%), education (82 | 13.2%), visual & performing arts (51 | 8.2%), literature & languages (46 | 7.4%), and computers & mathematics (39 | 6.3%) are the most common fields of study among 621 individuals in Fall City who have obtained a bachelor's degree or higher.
| Field of Study | # Graduates | % Graduates |
| Computers & Mathematics | 39 | 6.3% |
| Bio, Nature & Agricultural | 5 | 0.8% |
| Physical & Health Sciences | 27 | 4.3% |
| Psychology | 0 | 0.0% |
| Social Sciences | 39 | 6.3% |
| Engineering | 25 | 4.0% |
| Multidisciplinary Studies | 11 | 1.8% |
| Science & Technology | 17 | 2.7% |
| Business | 206 | 33.2% |
| Education | 82 | 13.2% |
| Literature & Languages | 46 | 7.4% |
| Liberal Arts & History | 37 | 6.0% |
| Visual & Performing Arts | 51 | 8.2% |
| Communications | 21 | 3.4% |
| Arts & Humanities | 15 | 2.4% |
| Total | 621 | 100.0% |
Transportation & Commute in Fall City
Vehicle Availability by Sex in Fall City
The most prevalent vehicle ownership categories in Fall City are males with 4 vehicles (192, accounting for 41.9%) and females with 4 vehicles (194, making up 38.8%).
| Vehicles Available | Male | Female |
| No Vehicle | 0 (0.0%) | 0 (0.0%) |
| 1 Vehicle | 0 (0.0%) | 20 (4.0%) |
| 2 Vehicles | 126 (27.5%) | 177 (35.8%) |
| 3 Vehicles | 129 (28.2%) | 72 (14.5%) |
| 4 Vehicles | 192 (41.9%) | 194 (39.2%) |
| 5 or more Vehicles | 11 (2.4%) | 32 (6.5%) |
| Total | 458 (100.0%) | 495 (100.0%) |
Commute Time in Fall City
The most frequently occuring commute durations in Fall City are 35 to 39 minutes (126 commuters, 20.0%), 45 to 59 minutes (102 commuters, 16.2%), and 60 to 89 minutes (90 commuters, 14.3%).
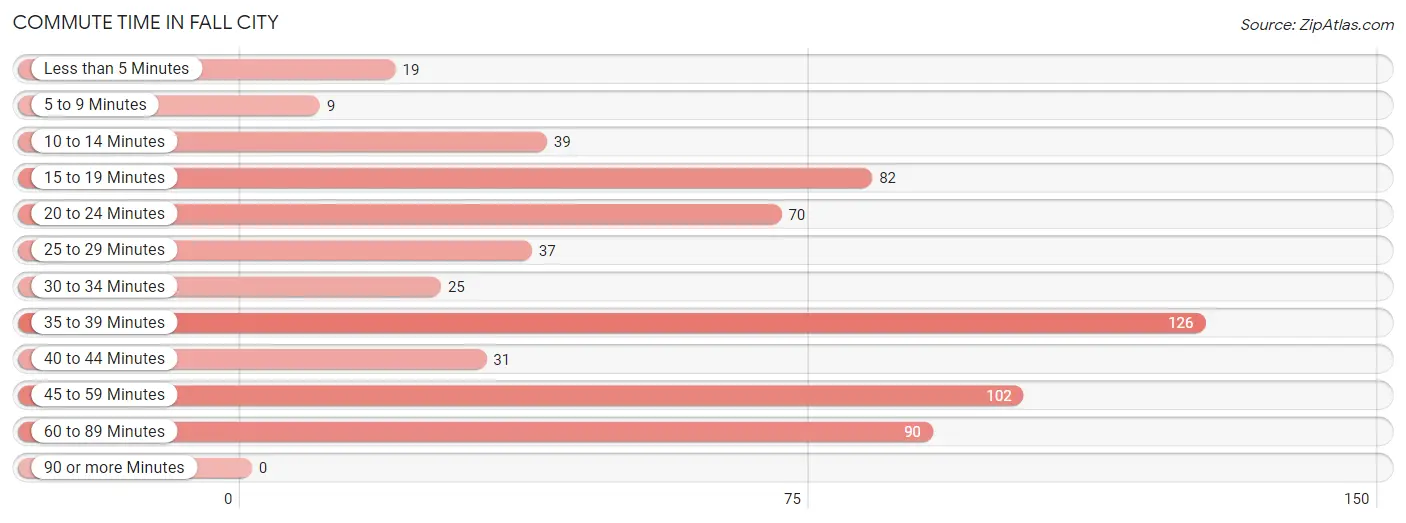
| Commute Time | # Commuters | % Commuters |
| Less than 5 Minutes | 19 | 3.0% |
| 5 to 9 Minutes | 9 | 1.4% |
| 10 to 14 Minutes | 39 | 6.2% |
| 15 to 19 Minutes | 82 | 13.0% |
| 20 to 24 Minutes | 70 | 11.1% |
| 25 to 29 Minutes | 37 | 5.9% |
| 30 to 34 Minutes | 25 | 4.0% |
| 35 to 39 Minutes | 126 | 20.0% |
| 40 to 44 Minutes | 31 | 4.9% |
| 45 to 59 Minutes | 102 | 16.2% |
| 60 to 89 Minutes | 90 | 14.3% |
| 90 or more Minutes | 0 | 0.0% |
Commute Time by Sex in Fall City
The most common commute times in Fall City are 45 to 59 minutes (93 commuters, 27.1%) for males and 35 to 39 minutes (116 commuters, 40.4%) for females.
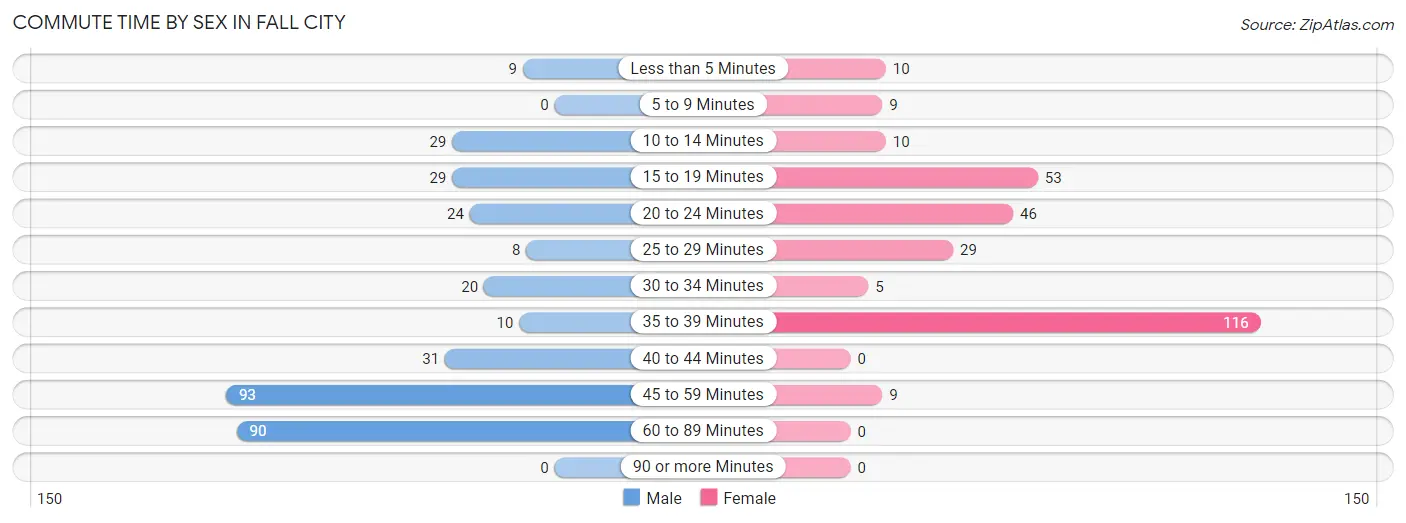
| Commute Time | Male | Female |
| Less than 5 Minutes | 9 (2.6%) | 10 (3.5%) |
| 5 to 9 Minutes | 0 (0.0%) | 9 (3.1%) |
| 10 to 14 Minutes | 29 (8.5%) | 10 (3.5%) |
| 15 to 19 Minutes | 29 (8.5%) | 53 (18.5%) |
| 20 to 24 Minutes | 24 (7.0%) | 46 (16.0%) |
| 25 to 29 Minutes | 8 (2.3%) | 29 (10.1%) |
| 30 to 34 Minutes | 20 (5.8%) | 5 (1.7%) |
| 35 to 39 Minutes | 10 (2.9%) | 116 (40.4%) |
| 40 to 44 Minutes | 31 (9.0%) | 0 (0.0%) |
| 45 to 59 Minutes | 93 (27.1%) | 9 (3.1%) |
| 60 to 89 Minutes | 90 (26.2%) | 0 (0.0%) |
| 90 or more Minutes | 0 (0.0%) | 0 (0.0%) |
Time of Departure to Work by Sex in Fall City
The most frequent times of departure to work in Fall City are 8:00 AM to 8:29 AM (100, 29.1%) for males and 9:00 AM to 9:59 AM (82, 28.6%) for females.
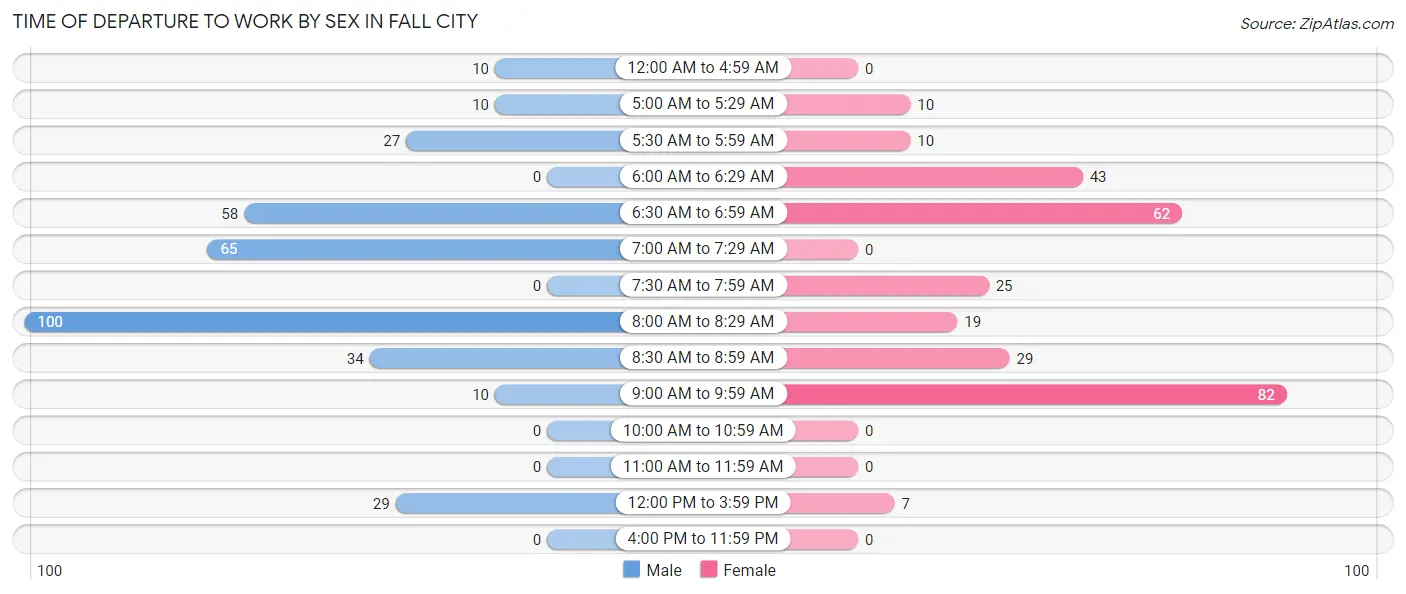
| Time of Departure | Male | Female |
| 12:00 AM to 4:59 AM | 10 (2.9%) | 0 (0.0%) |
| 5:00 AM to 5:29 AM | 10 (2.9%) | 10 (3.5%) |
| 5:30 AM to 5:59 AM | 27 (7.9%) | 10 (3.5%) |
| 6:00 AM to 6:29 AM | 0 (0.0%) | 43 (15.0%) |
| 6:30 AM to 6:59 AM | 58 (16.9%) | 62 (21.6%) |
| 7:00 AM to 7:29 AM | 65 (19.0%) | 0 (0.0%) |
| 7:30 AM to 7:59 AM | 0 (0.0%) | 25 (8.7%) |
| 8:00 AM to 8:29 AM | 100 (29.1%) | 19 (6.6%) |
| 8:30 AM to 8:59 AM | 34 (9.9%) | 29 (10.1%) |
| 9:00 AM to 9:59 AM | 10 (2.9%) | 82 (28.6%) |
| 10:00 AM to 10:59 AM | 0 (0.0%) | 0 (0.0%) |
| 11:00 AM to 11:59 AM | 0 (0.0%) | 0 (0.0%) |
| 12:00 PM to 3:59 PM | 29 (8.5%) | 7 (2.4%) |
| 4:00 PM to 11:59 PM | 0 (0.0%) | 0 (0.0%) |
| Total | 343 (100.0%) | 287 (100.0%) |
Housing Occupancy in Fall City
Occupancy by Ownership in Fall City
Of the total 687 dwellings in Fall City, owner-occupied units account for 546 (79.5%), while renter-occupied units make up 141 (20.5%).
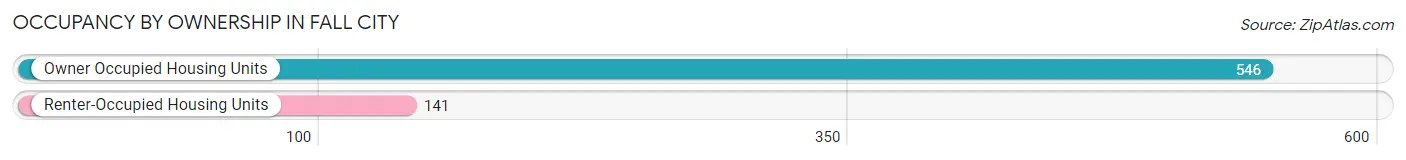
| Occupancy | # Housing Units | % Housing Units |
| Owner Occupied Housing Units | 546 | 79.5% |
| Renter-Occupied Housing Units | 141 | 20.5% |
| Total Occupied Housing Units | 687 | 100.0% |
Occupancy by Household Size in Fall City
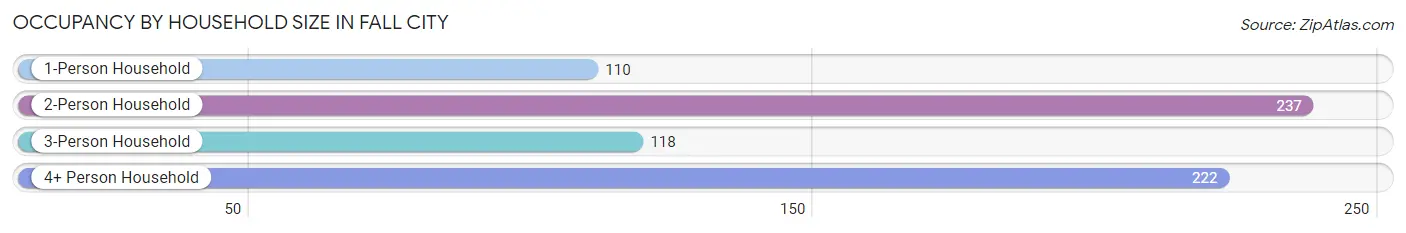
| Household Size | # Housing Units | % Housing Units |
| 1-Person Household | 110 | 16.0% |
| 2-Person Household | 237 | 34.5% |
| 3-Person Household | 118 | 17.2% |
| 4+ Person Household | 222 | 32.3% |
| Total Housing Units | 687 | 100.0% |
Occupancy by Ownership by Household Size in Fall City
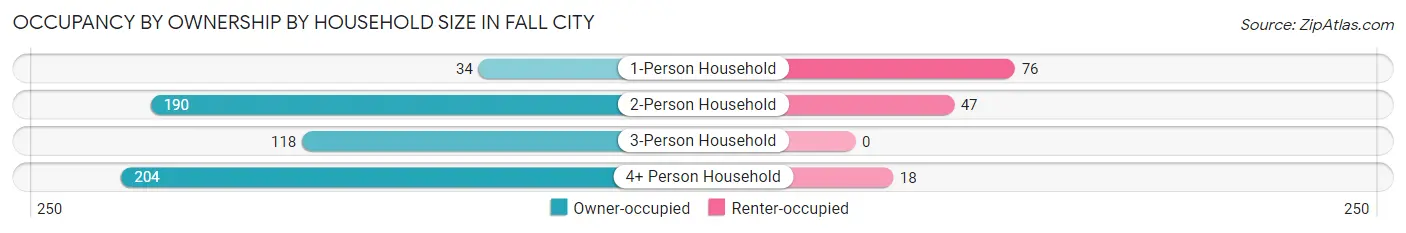
| Household Size | Owner-occupied | Renter-occupied |
| 1-Person Household | 34 (30.9%) | 76 (69.1%) |
| 2-Person Household | 190 (80.2%) | 47 (19.8%) |
| 3-Person Household | 118 (100.0%) | 0 (0.0%) |
| 4+ Person Household | 204 (91.9%) | 18 (8.1%) |
| Total Housing Units | 546 (79.5%) | 141 (20.5%) |
Occupancy by Educational Attainment in Fall City
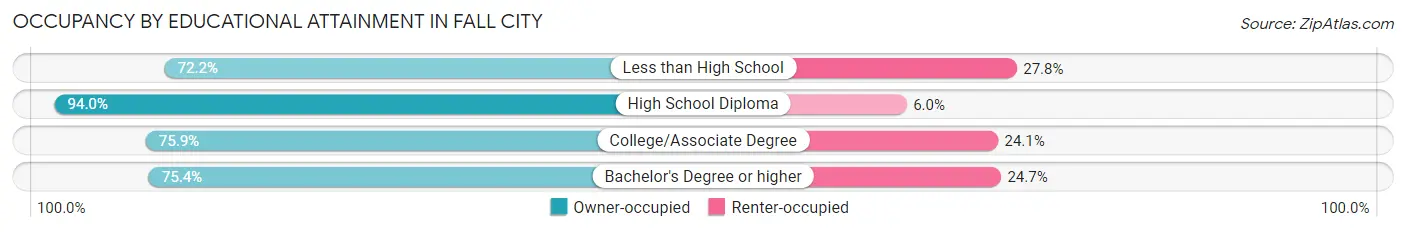
| Household Size | Owner-occupied | Renter-occupied |
| Less than High School | 26 (72.2%) | 10 (27.8%) |
| High School Diploma | 142 (94.0%) | 9 (6.0%) |
| College/Associate Degree | 161 (75.9%) | 51 (24.1%) |
| Bachelor's Degree or higher | 217 (75.3%) | 71 (24.6%) |
Occupancy by Age of Householder in Fall City
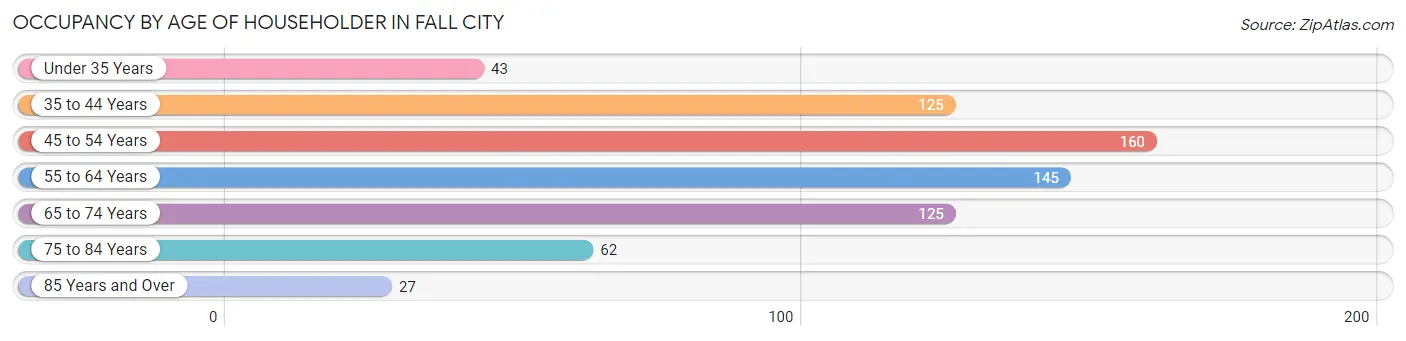
| Age Bracket | # Households | % Households |
| Under 35 Years | 43 | 6.3% |
| 35 to 44 Years | 125 | 18.2% |
| 45 to 54 Years | 160 | 23.3% |
| 55 to 64 Years | 145 | 21.1% |
| 65 to 74 Years | 125 | 18.2% |
| 75 to 84 Years | 62 | 9.0% |
| 85 Years and Over | 27 | 3.9% |
| Total | 687 | 100.0% |
Housing Finances in Fall City
Median Income by Occupancy in Fall City
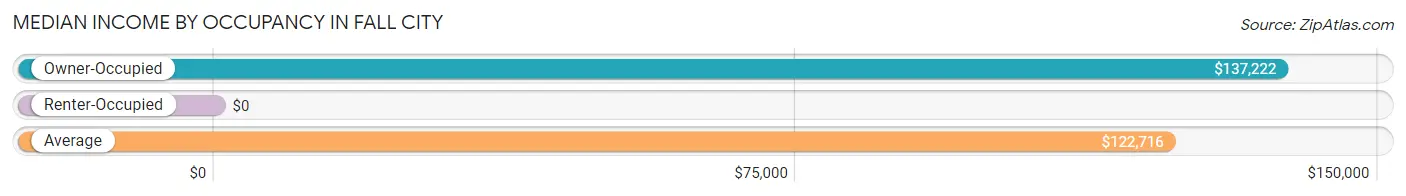
| Occupancy Type | # Households | Median Income |
| Owner-Occupied | 546 (79.5%) | $137,222 |
| Renter-Occupied | 141 (20.5%) | $0 |
| Average | 687 (100.0%) | $122,716 |
Occupancy by Householder Income Bracket in Fall City
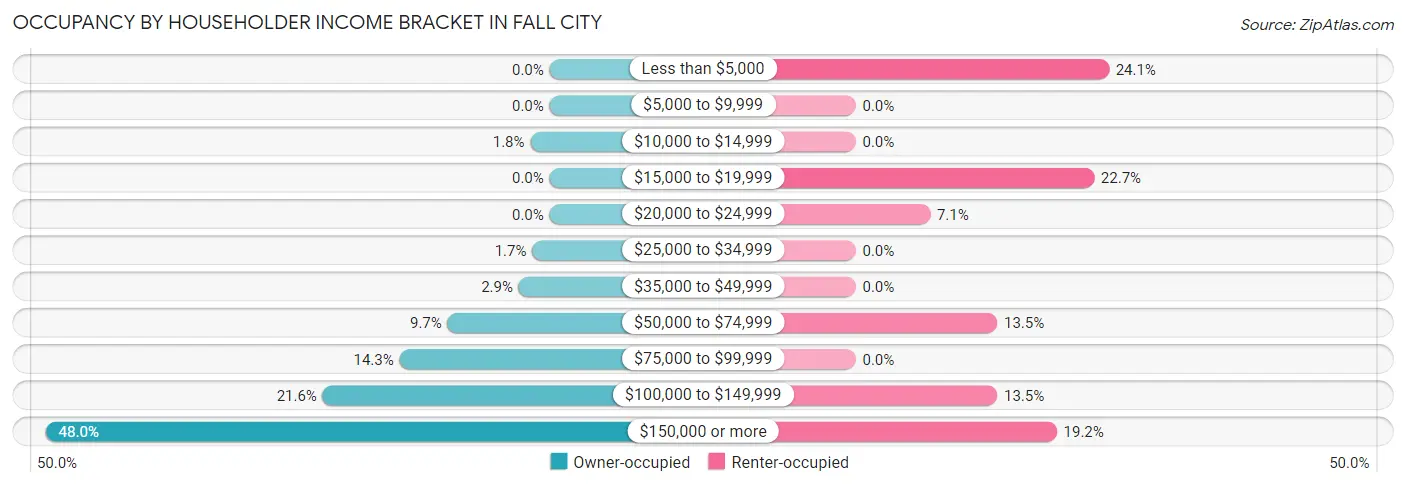
| Income Bracket | Owner-occupied | Renter-occupied |
| Less than $5,000 | 0 (0.0%) | 34 (24.1%) |
| $5,000 to $9,999 | 0 (0.0%) | 0 (0.0%) |
| $10,000 to $14,999 | 10 (1.8%) | 0 (0.0%) |
| $15,000 to $19,999 | 0 (0.0%) | 32 (22.7%) |
| $20,000 to $24,999 | 0 (0.0%) | 10 (7.1%) |
| $25,000 to $34,999 | 9 (1.7%) | 0 (0.0%) |
| $35,000 to $49,999 | 16 (2.9%) | 0 (0.0%) |
| $50,000 to $74,999 | 53 (9.7%) | 19 (13.5%) |
| $75,000 to $99,999 | 78 (14.3%) | 0 (0.0%) |
| $100,000 to $149,999 | 118 (21.6%) | 19 (13.5%) |
| $150,000 or more | 262 (48.0%) | 27 (19.2%) |
| Total | 546 (100.0%) | 141 (100.0%) |
Monthly Housing Cost Tiers in Fall City
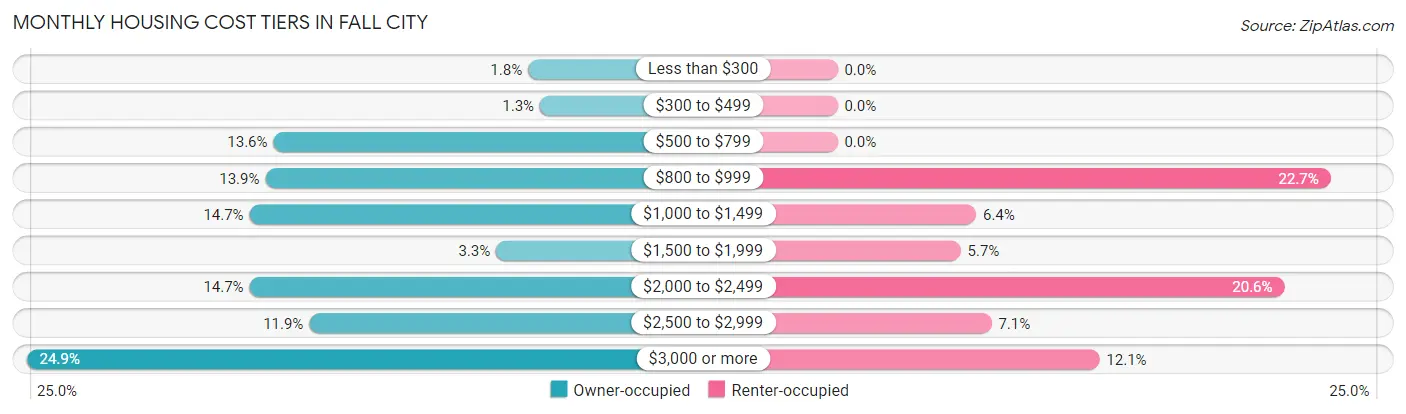
| Monthly Cost | Owner-occupied | Renter-occupied |
| Less than $300 | 10 (1.8%) | 0 (0.0%) |
| $300 to $499 | 7 (1.3%) | 0 (0.0%) |
| $500 to $799 | 74 (13.6%) | 0 (0.0%) |
| $800 to $999 | 76 (13.9%) | 32 (22.7%) |
| $1,000 to $1,499 | 80 (14.6%) | 9 (6.4%) |
| $1,500 to $1,999 | 18 (3.3%) | 8 (5.7%) |
| $2,000 to $2,499 | 80 (14.6%) | 29 (20.6%) |
| $2,500 to $2,999 | 65 (11.9%) | 10 (7.1%) |
| $3,000 or more | 136 (24.9%) | 17 (12.1%) |
| Total | 546 (100.0%) | 141 (100.0%) |
Physical Housing Characteristics in Fall City
Housing Structures in Fall City
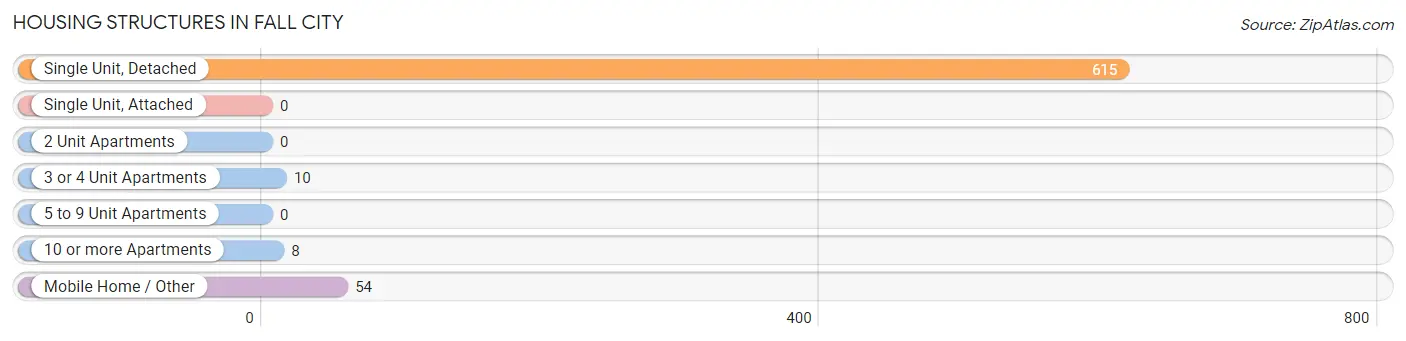
| Structure Type | # Housing Units | % Housing Units |
| Single Unit, Detached | 615 | 89.5% |
| Single Unit, Attached | 0 | 0.0% |
| 2 Unit Apartments | 0 | 0.0% |
| 3 or 4 Unit Apartments | 10 | 1.5% |
| 5 to 9 Unit Apartments | 0 | 0.0% |
| 10 or more Apartments | 8 | 1.2% |
| Mobile Home / Other | 54 | 7.9% |
| Total | 687 | 100.0% |
Housing Structures by Occupancy in Fall City
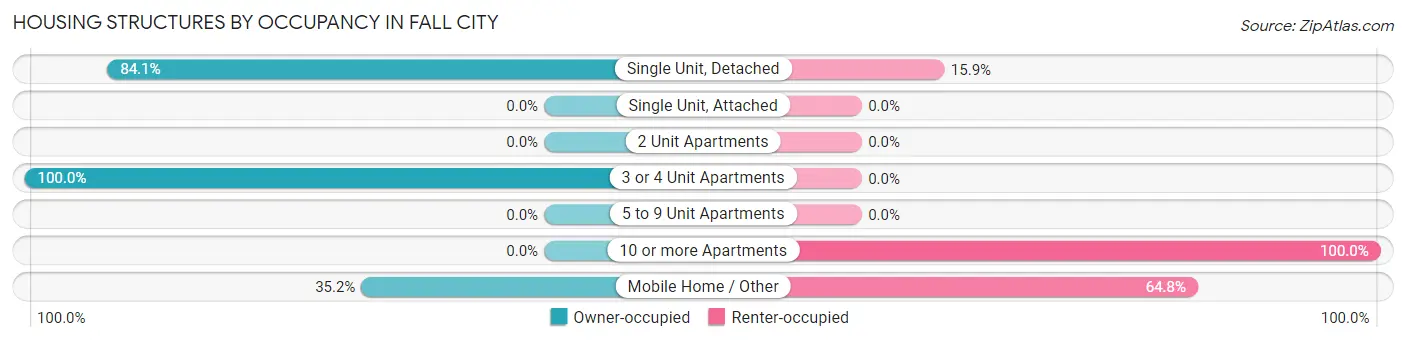
| Structure Type | Owner-occupied | Renter-occupied |
| Single Unit, Detached | 517 (84.1%) | 98 (15.9%) |
| Single Unit, Attached | 0 (0.0%) | 0 (0.0%) |
| 2 Unit Apartments | 0 (0.0%) | 0 (0.0%) |
| 3 or 4 Unit Apartments | 10 (100.0%) | 0 (0.0%) |
| 5 to 9 Unit Apartments | 0 (0.0%) | 0 (0.0%) |
| 10 or more Apartments | 0 (0.0%) | 8 (100.0%) |
| Mobile Home / Other | 19 (35.2%) | 35 (64.8%) |
| Total | 546 (79.5%) | 141 (20.5%) |
Housing Structures by Number of Rooms in Fall City
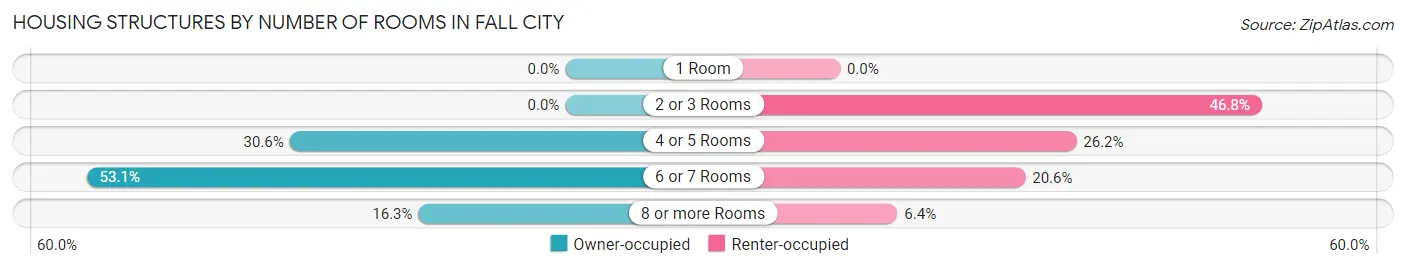
| Number of Rooms | Owner-occupied | Renter-occupied |
| 1 Room | 0 (0.0%) | 0 (0.0%) |
| 2 or 3 Rooms | 0 (0.0%) | 66 (46.8%) |
| 4 or 5 Rooms | 167 (30.6%) | 37 (26.2%) |
| 6 or 7 Rooms | 290 (53.1%) | 29 (20.6%) |
| 8 or more Rooms | 89 (16.3%) | 9 (6.4%) |
| Total | 546 (100.0%) | 141 (100.0%) |
Housing Structure by Heating Type in Fall City
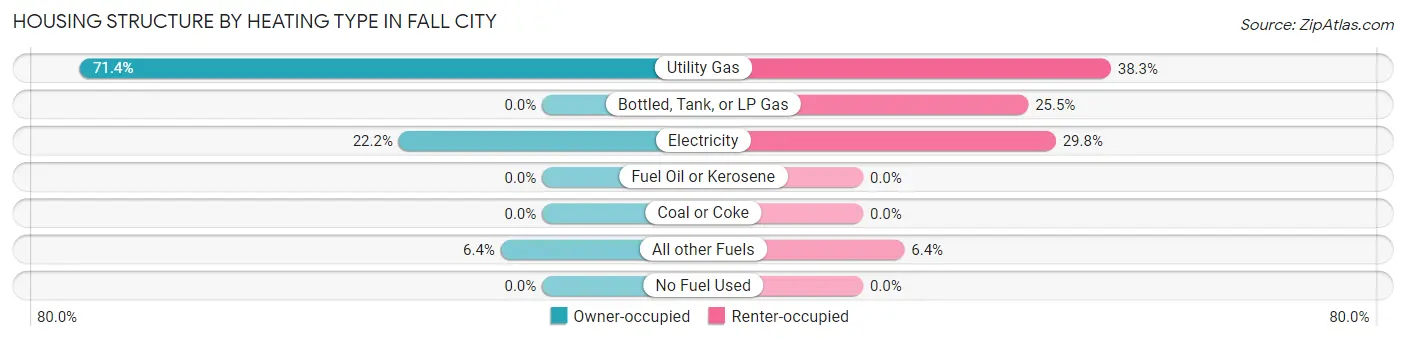
| Heating Type | Owner-occupied | Renter-occupied |
| Utility Gas | 390 (71.4%) | 54 (38.3%) |
| Bottled, Tank, or LP Gas | 0 (0.0%) | 36 (25.5%) |
| Electricity | 121 (22.2%) | 42 (29.8%) |
| Fuel Oil or Kerosene | 0 (0.0%) | 0 (0.0%) |
| Coal or Coke | 0 (0.0%) | 0 (0.0%) |
| All other Fuels | 35 (6.4%) | 9 (6.4%) |
| No Fuel Used | 0 (0.0%) | 0 (0.0%) |
| Total | 546 (100.0%) | 141 (100.0%) |
Household Vehicle Usage in Fall City
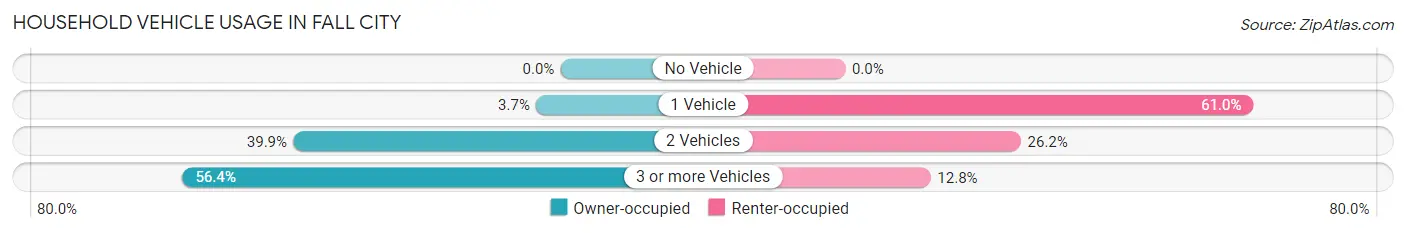
| Vehicles per Household | Owner-occupied | Renter-occupied |
| No Vehicle | 0 (0.0%) | 0 (0.0%) |
| 1 Vehicle | 20 (3.7%) | 86 (61.0%) |
| 2 Vehicles | 218 (39.9%) | 37 (26.2%) |
| 3 or more Vehicles | 308 (56.4%) | 18 (12.8%) |
| Total | 546 (100.0%) | 141 (100.0%) |
Real Estate & Mortgages in Fall City
Real Estate and Mortgage Overview in Fall City
| Characteristic | Without Mortgage | With Mortgage |
| Housing Units | 224 | 322 |
| Median Property Value | $557,700 | $737,900 |
| Median Household Income | $141,250 | $150 |
| Monthly Housing Costs | $874 | $136 |
| Real Estate Taxes | $5,000 | $0 |
Property Value by Mortgage Status in Fall City
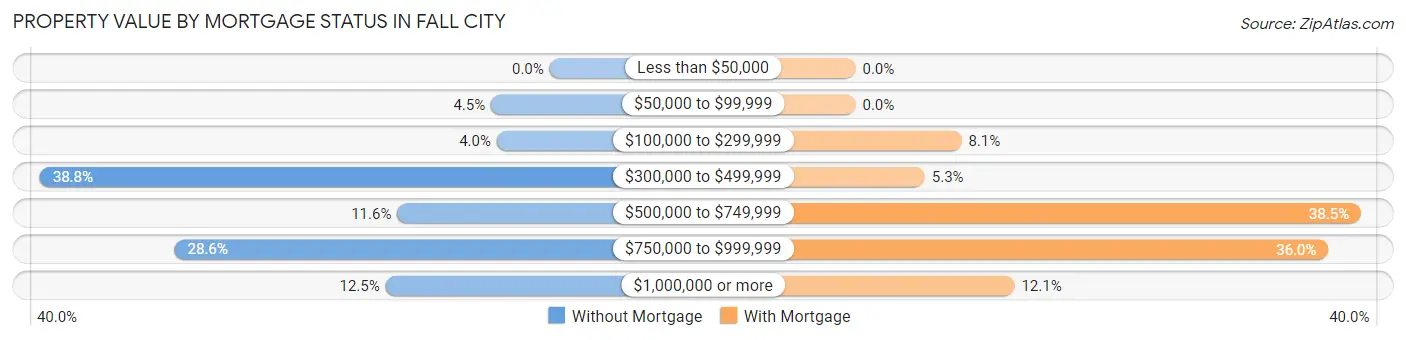
| Property Value | Without Mortgage | With Mortgage |
| Less than $50,000 | 0 (0.0%) | 0 (0.0%) |
| $50,000 to $99,999 | 10 (4.5%) | 0 (0.0%) |
| $100,000 to $299,999 | 9 (4.0%) | 26 (8.1%) |
| $300,000 to $499,999 | 87 (38.8%) | 17 (5.3%) |
| $500,000 to $749,999 | 26 (11.6%) | 124 (38.5%) |
| $750,000 to $999,999 | 64 (28.6%) | 116 (36.0%) |
| $1,000,000 or more | 28 (12.5%) | 39 (12.1%) |
| Total | 224 (100.0%) | 322 (100.0%) |
Household Income by Mortgage Status in Fall City
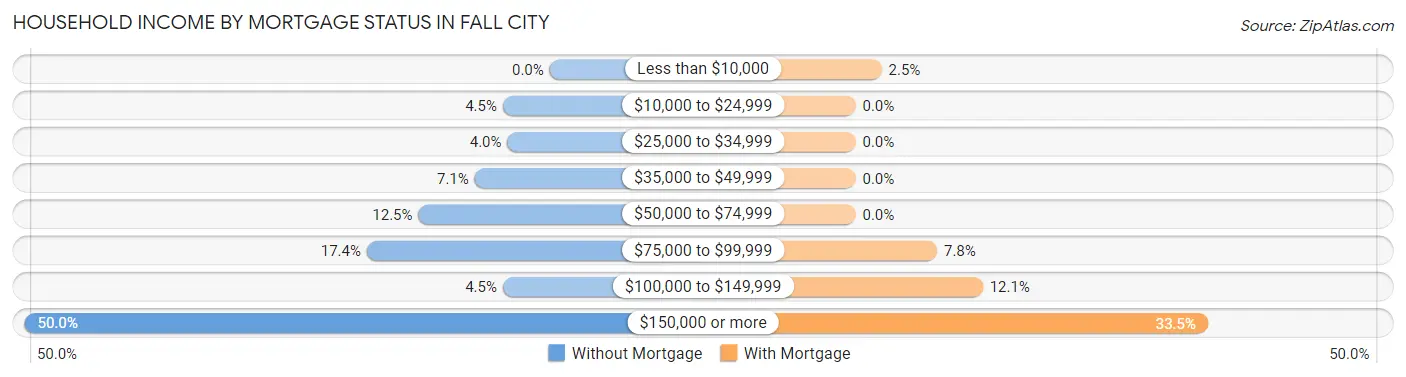
| Household Income | Without Mortgage | With Mortgage |
| Less than $10,000 | 0 (0.0%) | 8 (2.5%) |
| $10,000 to $24,999 | 10 (4.5%) | 0 (0.0%) |
| $25,000 to $34,999 | 9 (4.0%) | 0 (0.0%) |
| $35,000 to $49,999 | 16 (7.1%) | 0 (0.0%) |
| $50,000 to $74,999 | 28 (12.5%) | 0 (0.0%) |
| $75,000 to $99,999 | 39 (17.4%) | 25 (7.8%) |
| $100,000 to $149,999 | 10 (4.5%) | 39 (12.1%) |
| $150,000 or more | 112 (50.0%) | 108 (33.5%) |
| Total | 224 (100.0%) | 322 (100.0%) |
Property Value to Household Income Ratio in Fall City
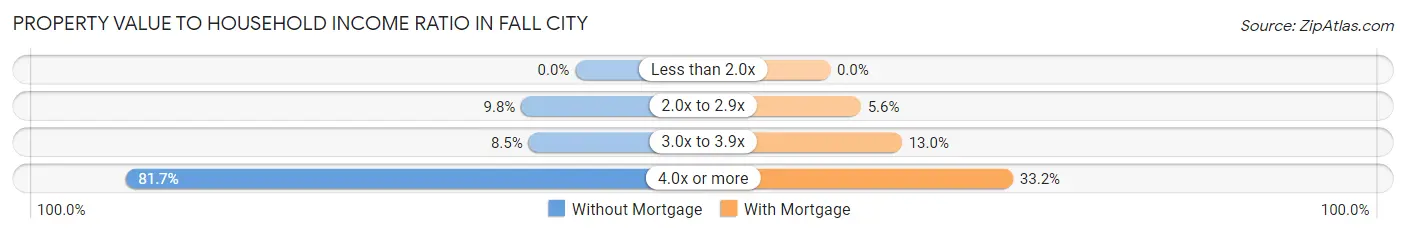
| Value-to-Income Ratio | Without Mortgage | With Mortgage |
| Less than 2.0x | 0 (0.0%) | 0 (0.0%) |
| 2.0x to 2.9x | 22 (9.8%) | 18 (5.6%) |
| 3.0x to 3.9x | 19 (8.5%) | 42 (13.0%) |
| 4.0x or more | 183 (81.7%) | 107 (33.2%) |
| Total | 224 (100.0%) | 322 (100.0%) |
Real Estate Taxes by Mortgage Status in Fall City
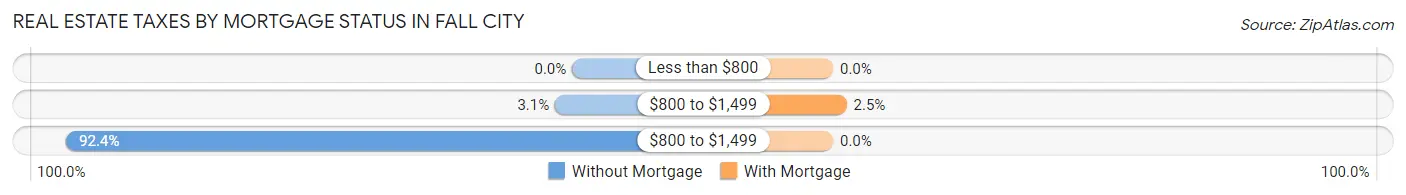
| Property Taxes | Without Mortgage | With Mortgage |
| Less than $800 | 0 (0.0%) | 0 (0.0%) |
| $800 to $1,499 | 7 (3.1%) | 8 (2.5%) |
| $800 to $1,499 | 207 (92.4%) | 0 (0.0%) |
| Total | 224 (100.0%) | 322 (100.0%) |
Health & Disability in Fall City
Health Insurance Coverage by Age in Fall City
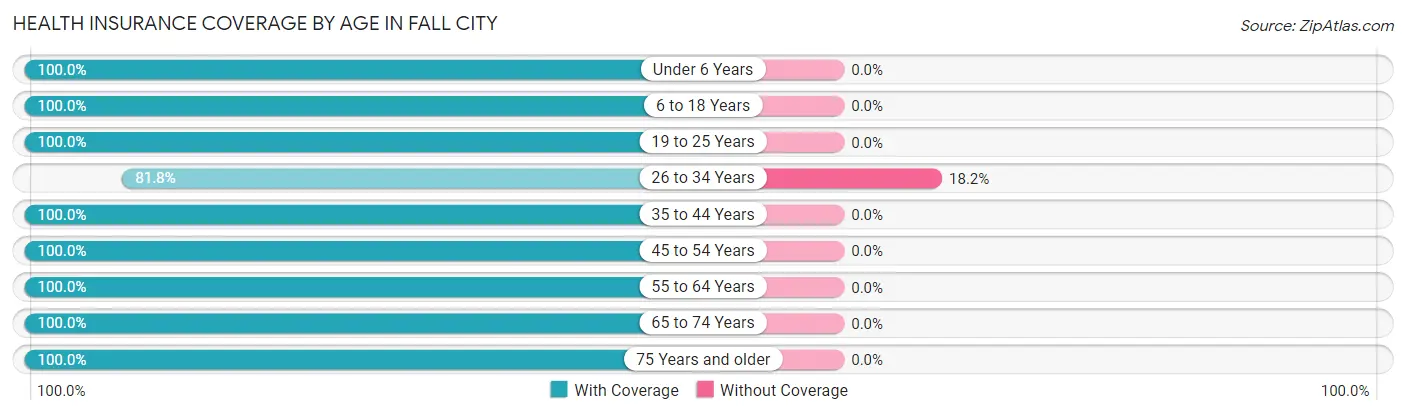
| Age Bracket | With Coverage | Without Coverage |
| Under 6 Years | 268 (100.0%) | 0 (0.0%) |
| 6 to 18 Years | 210 (100.0%) | 0 (0.0%) |
| 19 to 25 Years | 149 (100.0%) | 0 (0.0%) |
| 26 to 34 Years | 130 (81.8%) | 29 (18.2%) |
| 35 to 44 Years | 319 (100.0%) | 0 (0.0%) |
| 45 to 54 Years | 246 (100.0%) | 0 (0.0%) |
| 55 to 64 Years | 274 (100.0%) | 0 (0.0%) |
| 65 to 74 Years | 261 (100.0%) | 0 (0.0%) |
| 75 Years and older | 132 (100.0%) | 0 (0.0%) |
| Total | 1,989 (98.6%) | 29 (1.4%) |
Health Insurance Coverage by Citizenship Status in Fall City
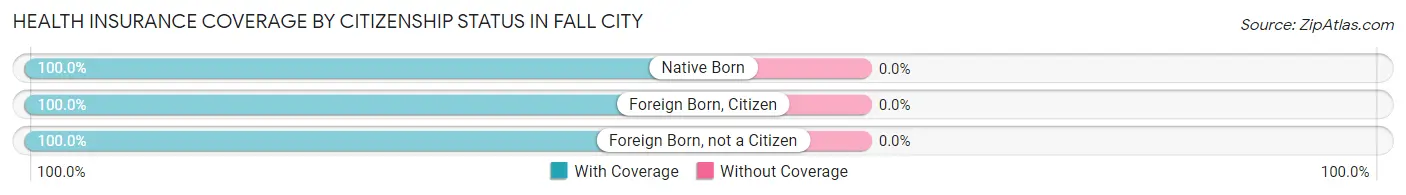
| Citizenship Status | With Coverage | Without Coverage |
| Native Born | 268 (100.0%) | 0 (0.0%) |
| Foreign Born, Citizen | 210 (100.0%) | 0 (0.0%) |
| Foreign Born, not a Citizen | 149 (100.0%) | 0 (0.0%) |
Health Insurance Coverage by Household Income in Fall City
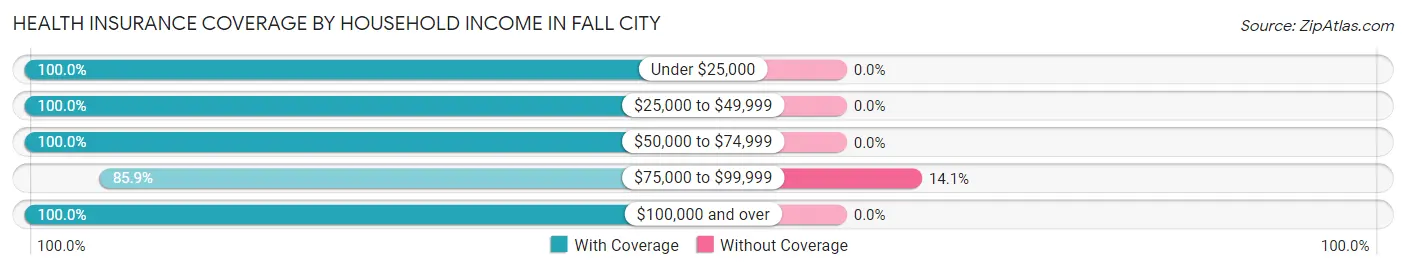
| Household Income | With Coverage | Without Coverage |
| Under $25,000 | 97 (100.0%) | 0 (0.0%) |
| $25,000 to $49,999 | 50 (100.0%) | 0 (0.0%) |
| $50,000 to $74,999 | 179 (100.0%) | 0 (0.0%) |
| $75,000 to $99,999 | 177 (85.9%) | 29 (14.1%) |
| $100,000 and over | 1,486 (100.0%) | 0 (0.0%) |
Public vs Private Health Insurance Coverage by Age in Fall City
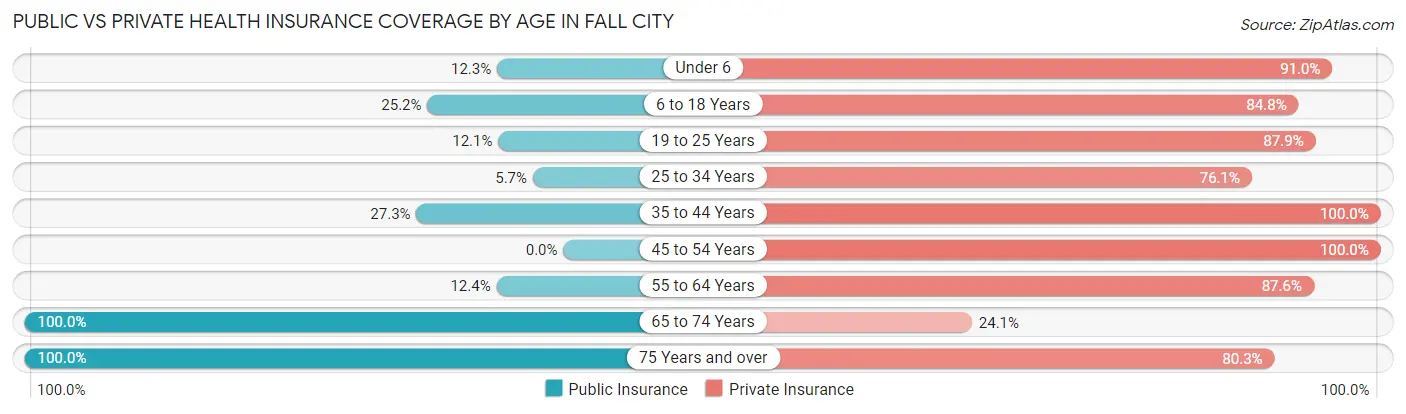
| Age Bracket | Public Insurance | Private Insurance |
| Under 6 | 33 (12.3%) | 244 (91.0%) |
| 6 to 18 Years | 53 (25.2%) | 178 (84.8%) |
| 19 to 25 Years | 18 (12.1%) | 131 (87.9%) |
| 25 to 34 Years | 9 (5.7%) | 121 (76.1%) |
| 35 to 44 Years | 87 (27.3%) | 319 (100.0%) |
| 45 to 54 Years | 0 (0.0%) | 246 (100.0%) |
| 55 to 64 Years | 34 (12.4%) | 240 (87.6%) |
| 65 to 74 Years | 261 (100.0%) | 63 (24.1%) |
| 75 Years and over | 132 (100.0%) | 106 (80.3%) |
| Total | 627 (31.1%) | 1,648 (81.7%) |
Disability Status by Sex by Age in Fall City
| Age Bracket | Male | Female |
| Under 5 Years | 0 (0.0%) | 0 (0.0%) |
| 5 to 17 Years | 10 (6.8%) | 0 (0.0%) |
| 18 to 34 Years | 18 (52.9%) | 9 (2.9%) |
| 35 to 64 Years | 40 (8.4%) | 27 (7.5%) |
| 65 to 74 Years | 47 (32.4%) | 39 (33.6%) |
| 75 Years and over | 28 (50.9%) | 42 (54.5%) |
Disability Class by Sex by Age in Fall City
Disability Class: Hearing Difficulty
| Age Bracket | Male | Female |
| Under 5 Years | 0 (0.0%) | 0 (0.0%) |
| 5 to 17 Years | 0 (0.0%) | 0 (0.0%) |
| 18 to 34 Years | 0 (0.0%) | 0 (0.0%) |
| 35 to 64 Years | 11 (2.3%) | 9 (2.5%) |
| 65 to 74 Years | 7 (4.8%) | 0 (0.0%) |
| 75 Years and over | 28 (50.9%) | 7 (9.1%) |
Disability Class: Vision Difficulty
| Age Bracket | Male | Female |
| Under 5 Years | 0 (0.0%) | 0 (0.0%) |
| 5 to 17 Years | 0 (0.0%) | 0 (0.0%) |
| 18 to 34 Years | 0 (0.0%) | 0 (0.0%) |
| 35 to 64 Years | 0 (0.0%) | 10 (2.8%) |
| 65 to 74 Years | 0 (0.0%) | 0 (0.0%) |
| 75 Years and over | 8 (14.5%) | 0 (0.0%) |
Disability Class: Cognitive Difficulty
| Age Bracket | Male | Female |
| 5 to 17 Years | 0 (0.0%) | 0 (0.0%) |
| 18 to 34 Years | 18 (52.9%) | 9 (2.9%) |
| 35 to 64 Years | 0 (0.0%) | 8 (2.2%) |
| 65 to 74 Years | 40 (27.6%) | 0 (0.0%) |
| 75 Years and over | 0 (0.0%) | 9 (11.7%) |
Disability Class: Ambulatory Difficulty
| Age Bracket | Male | Female |
| 5 to 17 Years | 0 (0.0%) | 0 (0.0%) |
| 18 to 34 Years | 0 (0.0%) | 0 (0.0%) |
| 35 to 64 Years | 29 (6.1%) | 9 (2.5%) |
| 65 to 74 Years | 30 (20.7%) | 39 (33.6%) |
| 75 Years and over | 18 (32.7%) | 16 (20.8%) |
Disability Class: Self-Care Difficulty
| Age Bracket | Male | Female |
| 5 to 17 Years | 10 (6.8%) | 0 (0.0%) |
| 18 to 34 Years | 0 (0.0%) | 0 (0.0%) |
| 35 to 64 Years | 0 (0.0%) | 0 (0.0%) |
| 65 to 74 Years | 0 (0.0%) | 0 (0.0%) |
| 75 Years and over | 18 (32.7%) | 9 (11.7%) |
Technology Access in Fall City
Computing Device Access in Fall City
| Device Type | # Households | % Households |
| Desktop or Laptop | 645 | 93.9% |
| Smartphone | 603 | 87.8% |
| Tablet | 553 | 80.5% |
| No Computing Device | 0 | 0.0% |
| Total | 687 | 100.0% |
Internet Access in Fall City
| Internet Type | # Households | % Households |
| Dial-Up Internet | 0 | 0.0% |
| Broadband Home | 596 | 86.8% |
| Cellular Data Only | 7 | 1.0% |
| Satellite Internet | 18 | 2.6% |
| No Internet | 58 | 8.4% |
| Total | 687 | 100.0% |
Fall City Summary
Fall City, Washington is a small unincorporated community located in King County, Washington, United States. It is situated along the Snoqualmie River, approximately 25 miles east of Seattle. The population of Fall City was 1,993 at the 2010 census.
History
The area that is now Fall City was first inhabited by the Snoqualmie people, who lived in the area for thousands of years before the arrival of European settlers. The first white settlers arrived in the area in the late 1850s, and the town was officially founded in 1892. The town was named after a waterfall on the Snoqualmie River, which was known as “Fall City”.
The town grew slowly over the next few decades, and by the early 1900s, it had become a popular destination for tourists and outdoor enthusiasts. The town was also home to several logging camps, which provided employment for many of the town’s residents.
In the 1920s, the town began to experience a period of rapid growth, as the nearby cities of Seattle and Bellevue began to expand. This growth was fueled by the construction of the nearby Snoqualmie Falls hydroelectric plant, which provided electricity to the region.
Geography
Fall City is located in King County, Washington, approximately 25 miles east of Seattle. It is situated along the Snoqualmie River, and is surrounded by the Cascade Mountains to the east and the Olympic Mountains to the west. The town is located at an elevation of approximately 500 feet above sea level.
The climate in Fall City is generally mild, with temperatures ranging from the mid-30s in the winter to the mid-80s in the summer. The area receives an average of 37 inches of precipitation per year, with most of it falling in the winter months.
Economy
The economy of Fall City is largely based on tourism and outdoor recreation. The town is home to several popular attractions, including the Snoqualmie Falls hydroelectric plant, the Snoqualmie River, and the nearby Snoqualmie National Forest.
The town is also home to several small businesses, including restaurants, cafes, and retail stores. The town is also home to several wineries, which produce a variety of wines from local grapes.
Demographics
As of the 2010 census, the population of Fall City was 1,993. The racial makeup of the town was 94.3% White, 0.7% African American, 0.3% Native American, 1.2% Asian, 0.1% Pacific Islander, 1.2% from other races, and 2.3% from two or more races. Hispanic or Latino of any race were 4.2% of the population.
The median income for a household in Fall City was $68,750, and the median income for a family was $76,250. The per capita income for the town was $30,945. About 5.2% of families and 7.2% of the population were below the poverty line, including 8.3% of those under age 18 and 4.2% of those age 65 or over.
Common Questions
What is Per Capita Income in Fall City?
Per Capita income in Fall City is $55,317.
What is the Median Family Income in Fall City?
Median Family Income in Fall City is $136,528.
What is the Median Household income in Fall City?
Median Household Income in Fall City is $122,716.
What is Income or Wage Gap in Fall City?
Income or Wage Gap in Fall City is 45.3%.
Women in Fall City earn 54.7 cents for every dollar earned by a man.
What is Inequality or Gini Index in Fall City?
Inequality or Gini Index in Fall City is 0.43.
What is the Total Population of Fall City?
Total Population of Fall City is 2,018.
What is the Total Male Population of Fall City?
Total Male Population of Fall City is 1,064.
What is the Total Female Population of Fall City?
Total Female Population of Fall City is 954.
What is the Ratio of Males per 100 Females in Fall City?
There are 111.53 Males per 100 Females in Fall City.
What is the Ratio of Females per 100 Males in Fall City?
There are 89.66 Females per 100 Males in Fall City.
What is the Median Population Age in Fall City?
Median Population Age in Fall City is 38.8 Years.
What is the Average Family Size in Fall City
Average Family Size in Fall City is 3.2 People.
What is the Average Household Size in Fall City
Average Household Size in Fall City is 2.9 People.
How Large is the Labor Force in Fall City?
There are 1,015 People in the Labor Forcein in Fall City.
What is the Percentage of People in the Labor Force in Fall City?
63.7% of People are in the Labor Force in Fall City.
What is the Unemployment Rate in Fall City?
Unemployment Rate in Fall City is 3.2%.