Colton, WA Map & Demographics
Colton Map
Colton Overview
$36,354
PER CAPITA INCOME
$91,719
AVG FAMILY INCOME
$81,250
AVG HOUSEHOLD INCOME
19.5%
WAGE / INCOME GAP [ % ]
80.5¢/ $1
WAGE / INCOME GAP [ $ ]
0.37
INEQUALITY / GINI INDEX
340
TOTAL POPULATION
149
MALE POPULATION
191
FEMALE POPULATION
78.01
MALES / 100 FEMALES
128.19
FEMALES / 100 MALES
41.5
MEDIAN AGE
2.8
AVG FAMILY SIZE
2.4
AVG HOUSEHOLD SIZE
164
LABOR FORCE [ PEOPLE ]
62.6%
PERCENT IN LABOR FORCE
3.0%
UNEMPLOYMENT RATE
Colton Zip Codes
Colton Area Codes
Income in Colton
Income Overview in Colton
Per Capita Income in Colton is $36,354, while median incomes of families and households are $91,719 and $81,250 respectively.
| Characteristic | Number | Measure |
| Per Capita Income | 340 | $36,354 |
| Median Family Income | 105 | $91,719 |
| Mean Family Income | 105 | $102,192 |
| Median Household Income | 141 | $81,250 |
| Mean Household Income | 141 | $87,522 |
| Income Deficit | 105 | $0 |
| Wage / Income Gap (%) | 340 | 19.49% |
| Wage / Income Gap ($) | 340 | 80.51¢ per $1 |
| Gini / Inequality Index | 340 | 0.37 |
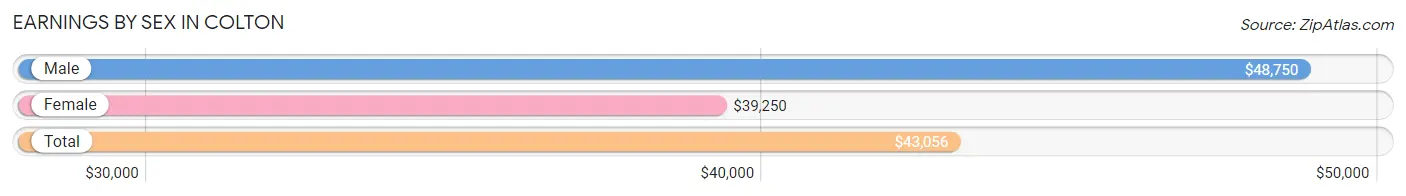
Earnings by Sex in Colton
Average Earnings in Colton are $43,056, $48,750 for men and $39,250 for women, a difference of 19.5%.
| Sex | Number | Average Earnings |
| Male | 75 (44.1%) | $48,750 |
| Female | 95 (55.9%) | $39,250 |
| Total | 170 (100.0%) | $43,056 |
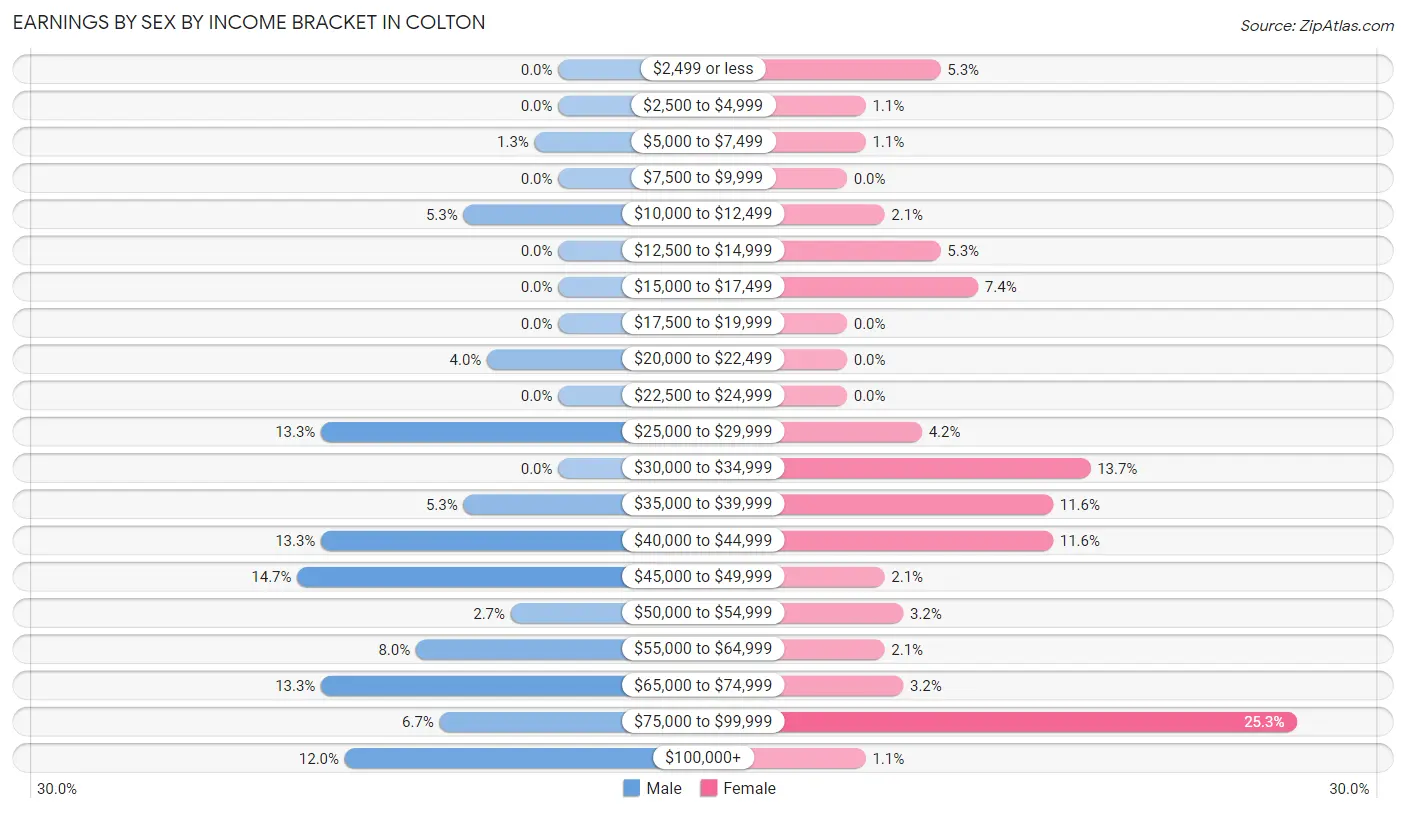
Earnings by Sex by Income Bracket in Colton
The most common earnings brackets in Colton are $45,000 to $49,999 for men (11 | 14.7%) and $75,000 to $99,999 for women (24 | 25.3%).
| Income | Male | Female |
| $2,499 or less | 0 (0.0%) | 5 (5.3%) |
| $2,500 to $4,999 | 0 (0.0%) | 1 (1.1%) |
| $5,000 to $7,499 | 1 (1.3%) | 1 (1.1%) |
| $7,500 to $9,999 | 0 (0.0%) | 0 (0.0%) |
| $10,000 to $12,499 | 4 (5.3%) | 2 (2.1%) |
| $12,500 to $14,999 | 0 (0.0%) | 5 (5.3%) |
| $15,000 to $17,499 | 0 (0.0%) | 7 (7.4%) |
| $17,500 to $19,999 | 0 (0.0%) | 0 (0.0%) |
| $20,000 to $22,499 | 3 (4.0%) | 0 (0.0%) |
| $22,500 to $24,999 | 0 (0.0%) | 0 (0.0%) |
| $25,000 to $29,999 | 10 (13.3%) | 4 (4.2%) |
| $30,000 to $34,999 | 0 (0.0%) | 13 (13.7%) |
| $35,000 to $39,999 | 4 (5.3%) | 11 (11.6%) |
| $40,000 to $44,999 | 10 (13.3%) | 11 (11.6%) |
| $45,000 to $49,999 | 11 (14.7%) | 2 (2.1%) |
| $50,000 to $54,999 | 2 (2.7%) | 3 (3.2%) |
| $55,000 to $64,999 | 6 (8.0%) | 2 (2.1%) |
| $65,000 to $74,999 | 10 (13.3%) | 3 (3.2%) |
| $75,000 to $99,999 | 5 (6.7%) | 24 (25.3%) |
| $100,000+ | 9 (12.0%) | 1 (1.1%) |
| Total | 75 (100.0%) | 95 (100.0%) |
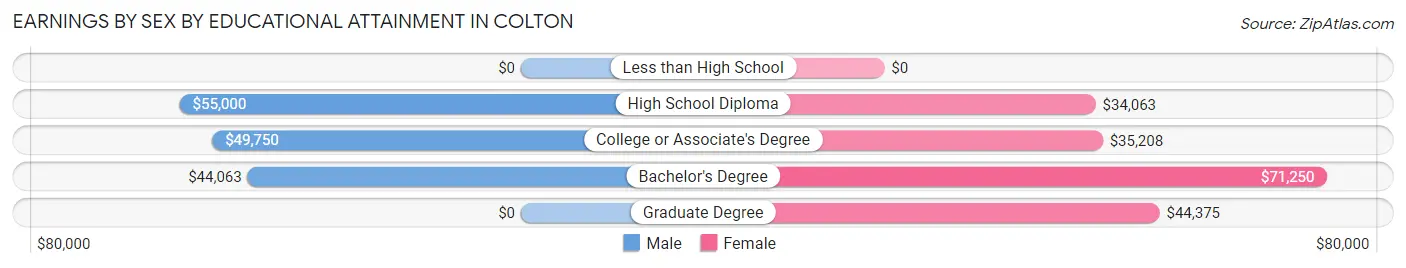
Earnings by Sex by Educational Attainment in Colton
Average earnings in Colton are $48,750 for men and $39,750 for women, a difference of 18.5%. Men with an educational attainment of high school diploma enjoy the highest average annual earnings of $55,000, while those with bachelor's degree education earn the least with $44,063. Women with an educational attainment of bachelor's degree earn the most with the average annual earnings of $71,250, while those with high school diploma education have the smallest earnings of $34,063.
| Educational Attainment | Male Income | Female Income |
| Less than High School | - | - |
| High School Diploma | $55,000 | $34,063 |
| College or Associate's Degree | $49,750 | $35,208 |
| Bachelor's Degree | $44,063 | $71,250 |
| Graduate Degree | - | - |
| Total | $48,750 | $39,750 |
Family Income in Colton
Family Income Brackets in Colton
According to the Colton family income data, there are 30 families falling into the $75,000 to $99,999 income range, which is the most common income bracket and makes up 28.6% of all families.
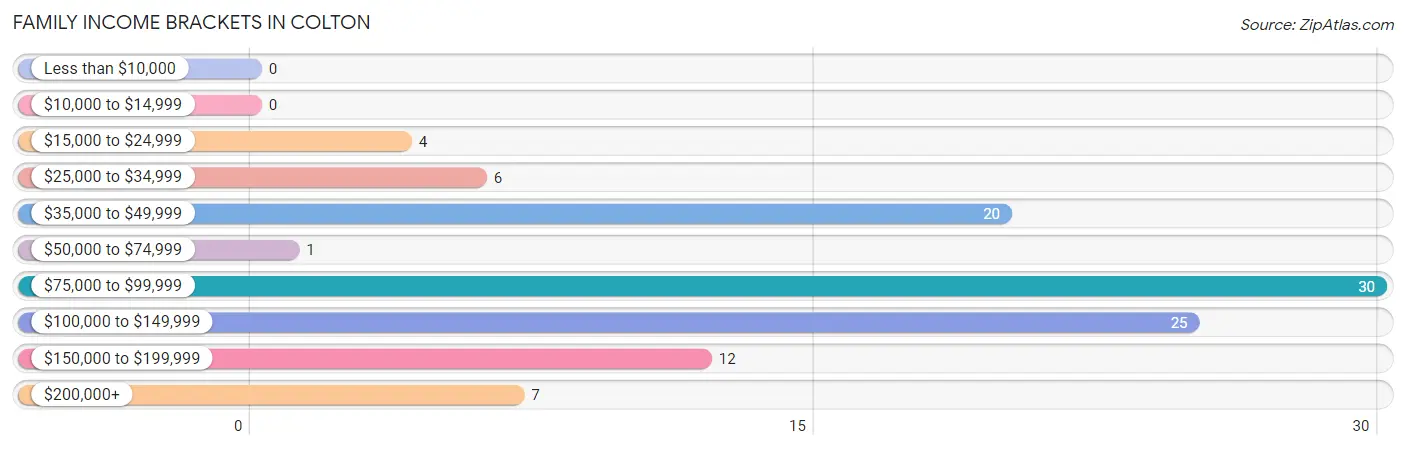
| Income Bracket | # Families | % Families |
| Less than $10,000 | 0 | 0.0% |
| $10,000 to $14,999 | 0 | 0.0% |
| $15,000 to $24,999 | 4 | 3.8% |
| $25,000 to $34,999 | 6 | 5.7% |
| $35,000 to $49,999 | 20 | 19.0% |
| $50,000 to $74,999 | 1 | 1.0% |
| $75,000 to $99,999 | 30 | 28.6% |
| $100,000 to $149,999 | 25 | 23.8% |
| $150,000 to $199,999 | 12 | 11.4% |
| $200,000+ | 7 | 6.7% |
Family Income by Famaliy Size in Colton
4-person families (16 | 15.2%) account for the highest median family income in Colton with $153,750 per family, while 2-person families (62 | 59.1%) have the highest median income of $45,782 per family member.
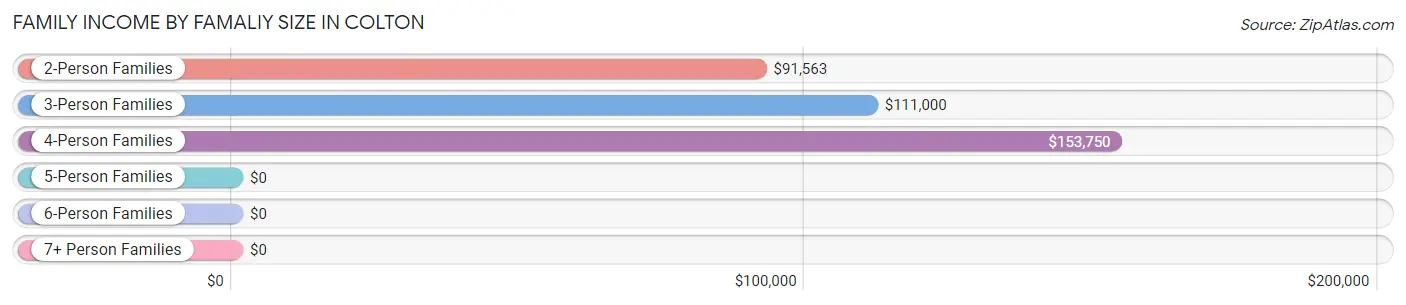
| Income Bracket | # Families | Median Income |
| 2-Person Families | 62 (59.1%) | $91,563 |
| 3-Person Families | 12 (11.4%) | $111,000 |
| 4-Person Families | 16 (15.2%) | $153,750 |
| 5-Person Families | 8 (7.6%) | $0 |
| 6-Person Families | 0 (0.0%) | $0 |
| 7+ Person Families | 7 (6.7%) | $0 |
| Total | 105 (100.0%) | $91,719 |
Family Income by Number of Earners in Colton
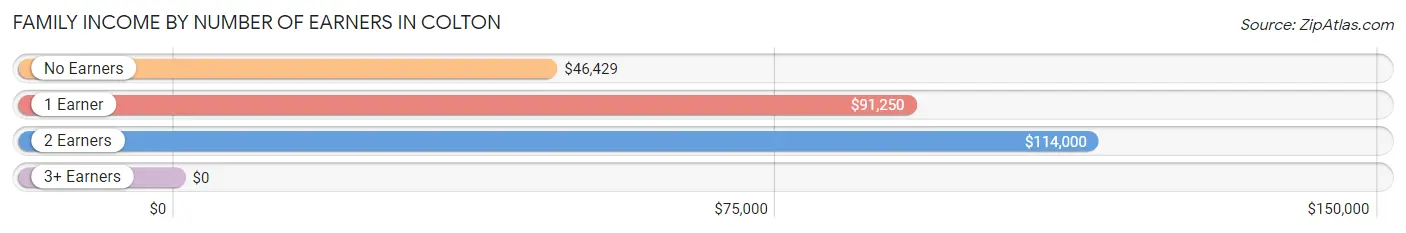
| Number of Earners | # Families | Median Income |
| No Earners | 24 (22.9%) | $46,429 |
| 1 Earner | 28 (26.7%) | $91,250 |
| 2 Earners | 52 (49.5%) | $114,000 |
| 3+ Earners | 1 (0.9%) | $0 |
| Total | 105 (100.0%) | $91,719 |
Household Income in Colton
Household Income Brackets in Colton
With 33 households falling in the category, the $35,000 to $49,999 income range is the most frequent in Colton, accounting for 23.4% of all households.
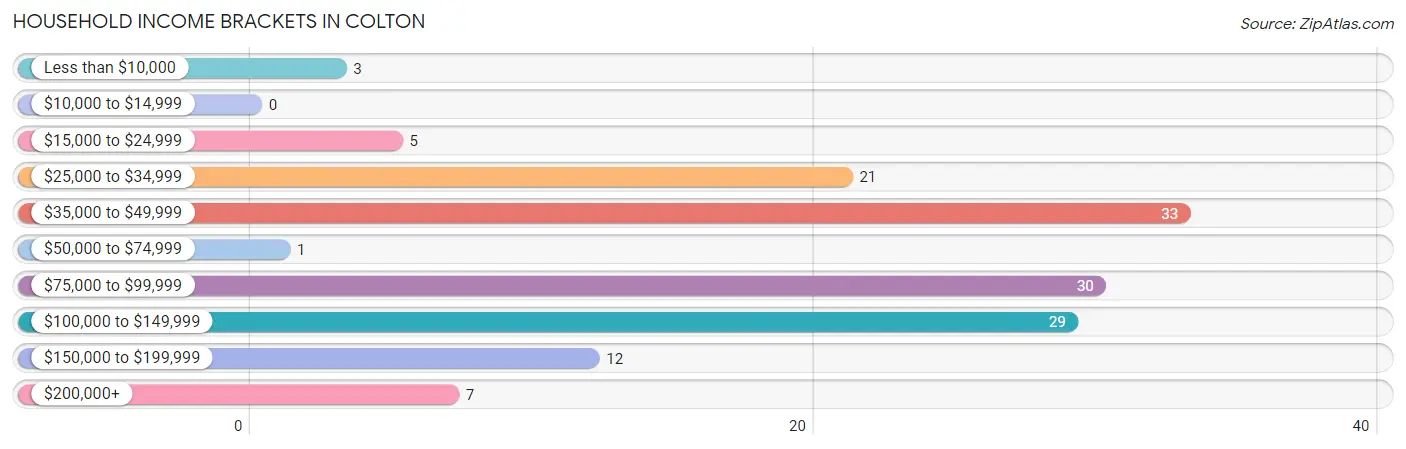
| Income Bracket | # Households | % Households |
| Less than $10,000 | 3 | 2.1% |
| $10,000 to $14,999 | 0 | 0.0% |
| $15,000 to $24,999 | 5 | 3.5% |
| $25,000 to $34,999 | 21 | 14.9% |
| $35,000 to $49,999 | 33 | 23.4% |
| $50,000 to $74,999 | 1 | 0.7% |
| $75,000 to $99,999 | 30 | 21.3% |
| $100,000 to $149,999 | 29 | 20.6% |
| $150,000 to $199,999 | 12 | 8.5% |
| $200,000+ | 7 | 5.0% |
Household Income by Householder Age in Colton
The median household income in Colton is $81,250, with the highest median household income of $110,250 found in the 25 to 44 years age bracket for the primary householder. A total of 47 households (33.3%) fall into this category.
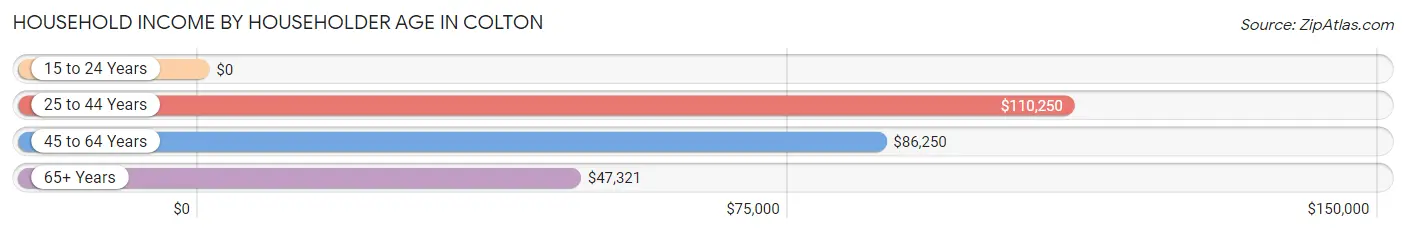
| Income Bracket | # Households | Median Income |
| 15 to 24 Years | 0 (0.0%) | $0 |
| 25 to 44 Years | 47 (33.3%) | $110,250 |
| 45 to 64 Years | 47 (33.3%) | $86,250 |
| 65+ Years | 47 (33.3%) | $47,321 |
| Total | 141 (100.0%) | $81,250 |
Poverty in Colton
Income Below Poverty by Sex and Age in Colton
With 1.3% poverty level for males and 1.6% for females among the residents of Colton, 25 to 34 year old males and 65 to 74 year old females are the most vulnerable to poverty, with 2 males (11.1%) and 3 females (16.7%) in their respective age groups living below the poverty level.
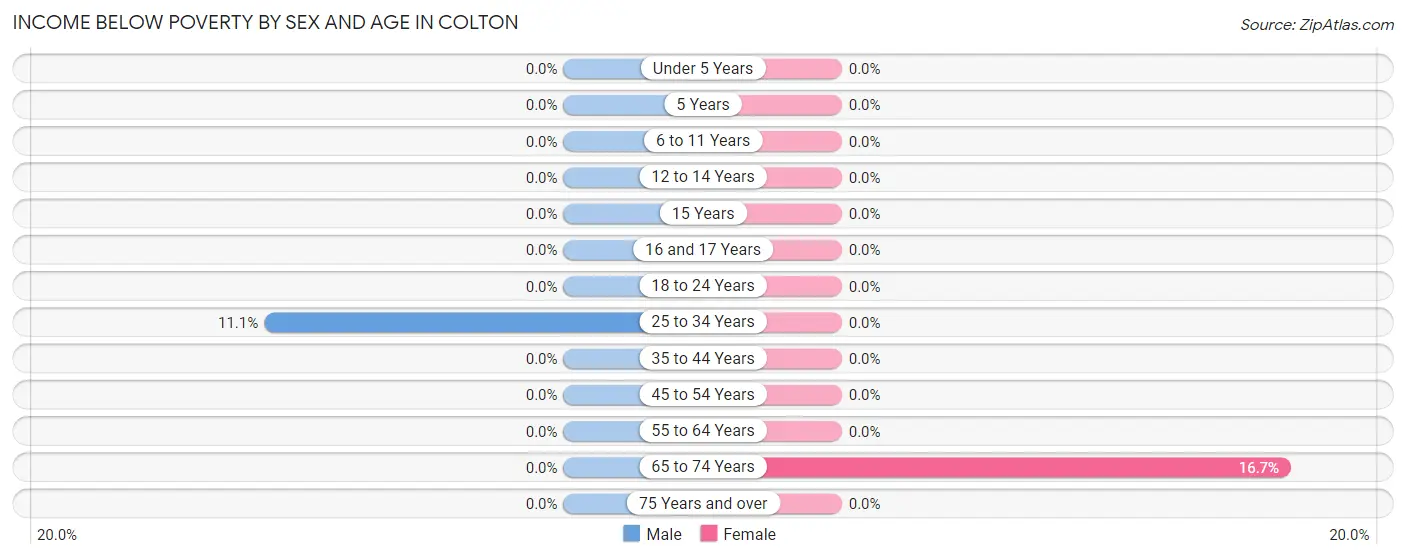
| Age Bracket | Male | Female |
| Under 5 Years | 0 (0.0%) | 0 (0.0%) |
| 5 Years | 0 (0.0%) | 0 (0.0%) |
| 6 to 11 Years | 0 (0.0%) | 0 (0.0%) |
| 12 to 14 Years | 0 (0.0%) | 0 (0.0%) |
| 15 Years | 0 (0.0%) | 0 (0.0%) |
| 16 and 17 Years | 0 (0.0%) | 0 (0.0%) |
| 18 to 24 Years | 0 (0.0%) | 0 (0.0%) |
| 25 to 34 Years | 2 (11.1%) | 0 (0.0%) |
| 35 to 44 Years | 0 (0.0%) | 0 (0.0%) |
| 45 to 54 Years | 0 (0.0%) | 0 (0.0%) |
| 55 to 64 Years | 0 (0.0%) | 0 (0.0%) |
| 65 to 74 Years | 0 (0.0%) | 3 (16.7%) |
| 75 Years and over | 0 (0.0%) | 0 (0.0%) |
| Total | 2 (1.3%) | 3 (1.6%) |
Income Above Poverty by Sex and Age in Colton
According to the poverty statistics in Colton, males aged under 5 years and females aged under 5 years are the age groups that are most secure financially, with 100.0% of males and 100.0% of females in these age groups living above the poverty line.
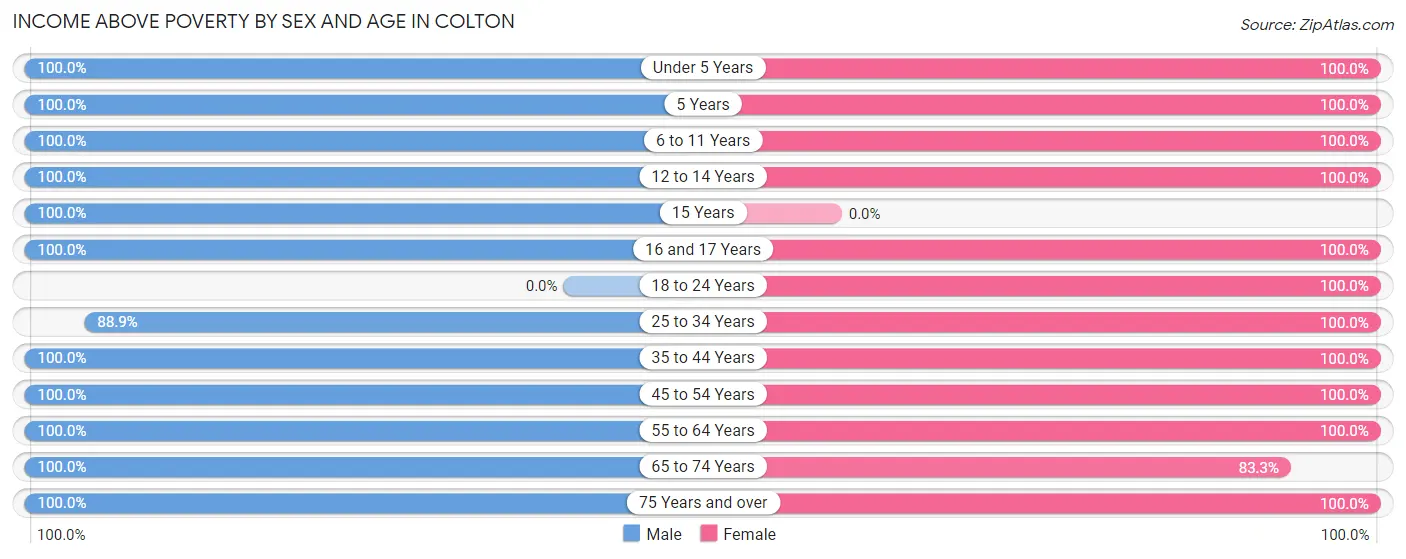
| Age Bracket | Male | Female |
| Under 5 Years | 9 (100.0%) | 7 (100.0%) |
| 5 Years | 2 (100.0%) | 4 (100.0%) |
| 6 to 11 Years | 7 (100.0%) | 23 (100.0%) |
| 12 to 14 Years | 4 (100.0%) | 16 (100.0%) |
| 15 Years | 6 (100.0%) | 0 (0.0%) |
| 16 and 17 Years | 9 (100.0%) | 6 (100.0%) |
| 18 to 24 Years | 0 (0.0%) | 2 (100.0%) |
| 25 to 34 Years | 16 (88.9%) | 16 (100.0%) |
| 35 to 44 Years | 20 (100.0%) | 31 (100.0%) |
| 45 to 54 Years | 13 (100.0%) | 18 (100.0%) |
| 55 to 64 Years | 13 (100.0%) | 33 (100.0%) |
| 65 to 74 Years | 32 (100.0%) | 15 (83.3%) |
| 75 Years and over | 16 (100.0%) | 17 (100.0%) |
| Total | 147 (98.7%) | 188 (98.4%) |
Income Below Poverty Among Married-Couple Families in Colton
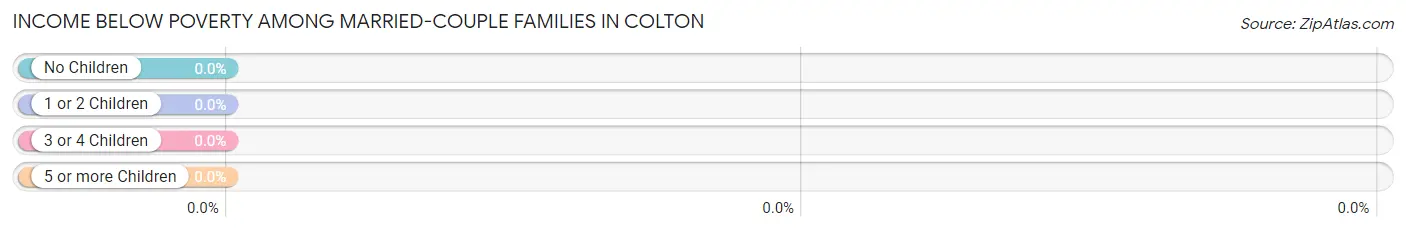
| Children | Above Poverty | Below Poverty |
| No Children | 53 (100.0%) | 0 (0.0%) |
| 1 or 2 Children | 23 (100.0%) | 0 (0.0%) |
| 3 or 4 Children | 3 (100.0%) | 0 (0.0%) |
| 5 or more Children | 7 (100.0%) | 0 (0.0%) |
| Total | 86 (100.0%) | 0 (0.0%) |
Income Below Poverty Among Single-Parent Households in Colton
| Children | Single Father | Single Mother |
| No Children | 0 (0.0%) | 0 (0.0%) |
| 1 or 2 Children | 0 (0.0%) | 0 (0.0%) |
| 3 or 4 Children | 0 (0.0%) | 0 (0.0%) |
| 5 or more Children | 0 (0.0%) | 0 (0.0%) |
| Total | 0 (0.0%) | 0 (0.0%) |
Income Below Poverty Among Married-Couple vs Single-Parent Households in Colton
| Children | Married-Couple Families | Single-Parent Households |
| No Children | 0 (0.0%) | 0 (0.0%) |
| 1 or 2 Children | 0 (0.0%) | 0 (0.0%) |
| 3 or 4 Children | 0 (0.0%) | 0 (0.0%) |
| 5 or more Children | 0 (0.0%) | 0 (0.0%) |
| Total | 0 (0.0%) | 0 (0.0%) |
Race in Colton
The most populous races in Colton are White / Caucasian (322 | 94.7%), Hispanic or Latino (20 | 5.9%), and Two or more Races (17 | 5.0%).
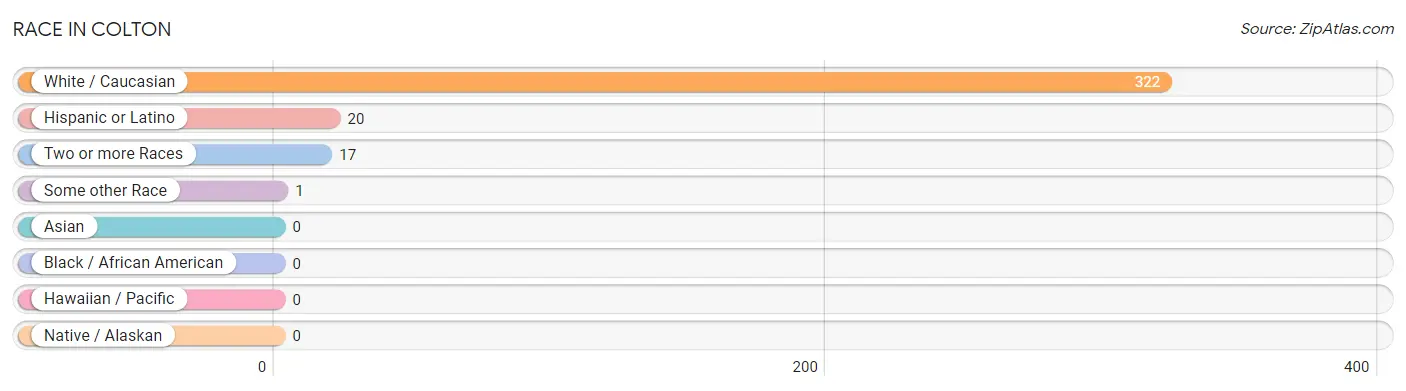
| Race | # Population | % Population |
| Asian | 0 | 0.0% |
| Black / African American | 0 | 0.0% |
| Hawaiian / Pacific | 0 | 0.0% |
| Hispanic or Latino | 20 | 5.9% |
| Native / Alaskan | 0 | 0.0% |
| White / Caucasian | 322 | 94.7% |
| Two or more Races | 17 | 5.0% |
| Some other Race | 1 | 0.3% |
| Total | 340 | 100.0% |
Ancestry in Colton
The most populous ancestries reported in Colton are German (122 | 35.9%), English (72 | 21.2%), Swedish (39 | 11.5%), Irish (29 | 8.5%), and Italian (28 | 8.2%), together accounting for 85.3% of all Colton residents.
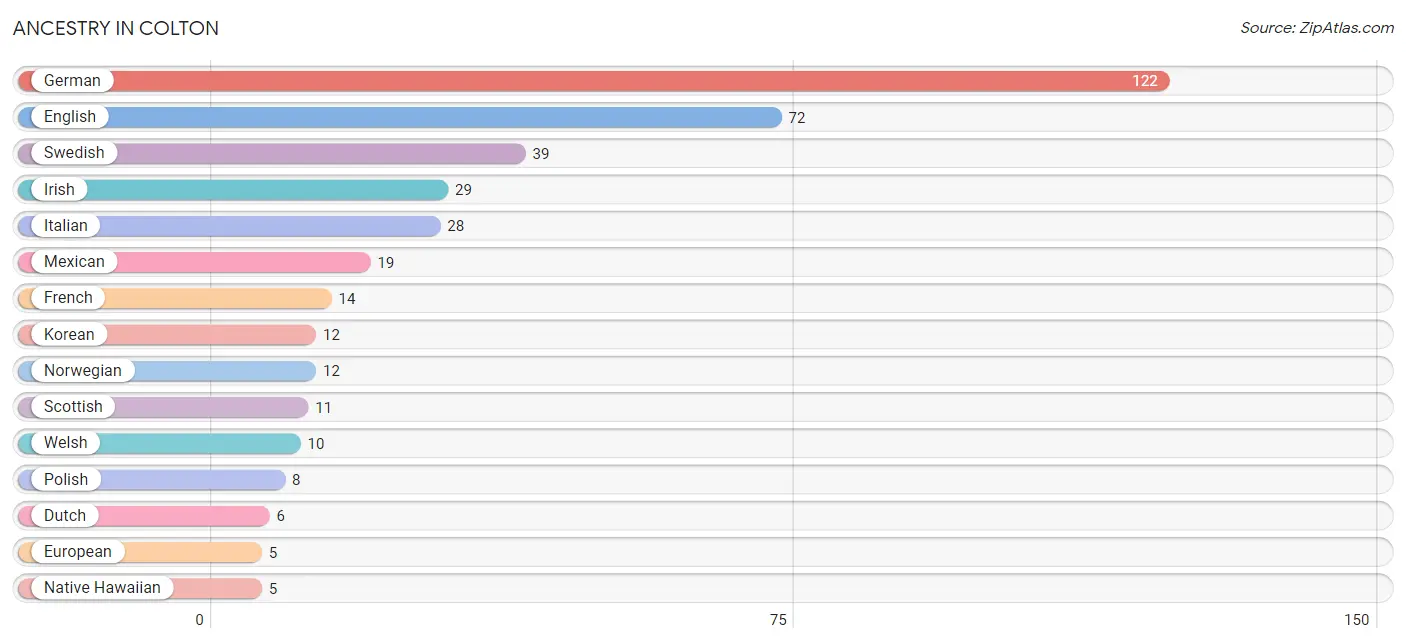
| Ancestry | # Population | % Population |
| American | 2 | 0.6% |
| British | 2 | 0.6% |
| Dutch | 6 | 1.8% |
| English | 72 | 21.2% |
| European | 5 | 1.5% |
| French | 14 | 4.1% |
| German | 122 | 35.9% |
| Irish | 29 | 8.5% |
| Italian | 28 | 8.2% |
| Korean | 12 | 3.5% |
| Latvian | 2 | 0.6% |
| Mexican | 19 | 5.6% |
| Native Hawaiian | 5 | 1.5% |
| Norwegian | 12 | 3.5% |
| Peruvian | 1 | 0.3% |
| Polish | 8 | 2.4% |
| Scandinavian | 4 | 1.2% |
| Scotch-Irish | 4 | 1.2% |
| Scottish | 11 | 3.2% |
| South American | 1 | 0.3% |
| Swedish | 39 | 11.5% |
| Swiss | 2 | 0.6% |
| Welsh | 10 | 2.9% | View All 23 Rows |
Immigrants in Colton
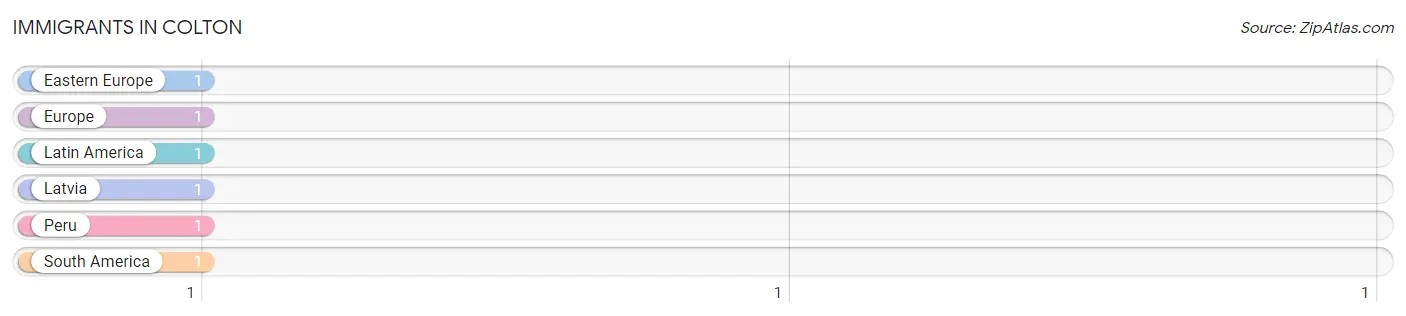
The most numerous immigrant groups reported in Colton came from Eastern Europe (1 | 0.3%), Europe (1 | 0.3%), Latin America (1 | 0.3%), Latvia (1 | 0.3%), and Peru (1 | 0.3%), together accounting for 1.4% of all Colton residents.
| Immigration Origin | # Population | % Population |
| Eastern Europe | 1 | 0.3% |
| Europe | 1 | 0.3% |
| Latin America | 1 | 0.3% |
| Latvia | 1 | 0.3% |
| Peru | 1 | 0.3% |
| South America | 1 | 0.3% | View All 6 Rows |
Sex and Age in Colton
Sex and Age in Colton
The most populous age groups in Colton are 65 to 69 Years (22 | 14.8%) for men and 35 to 39 Years (26 | 13.6%) for women.
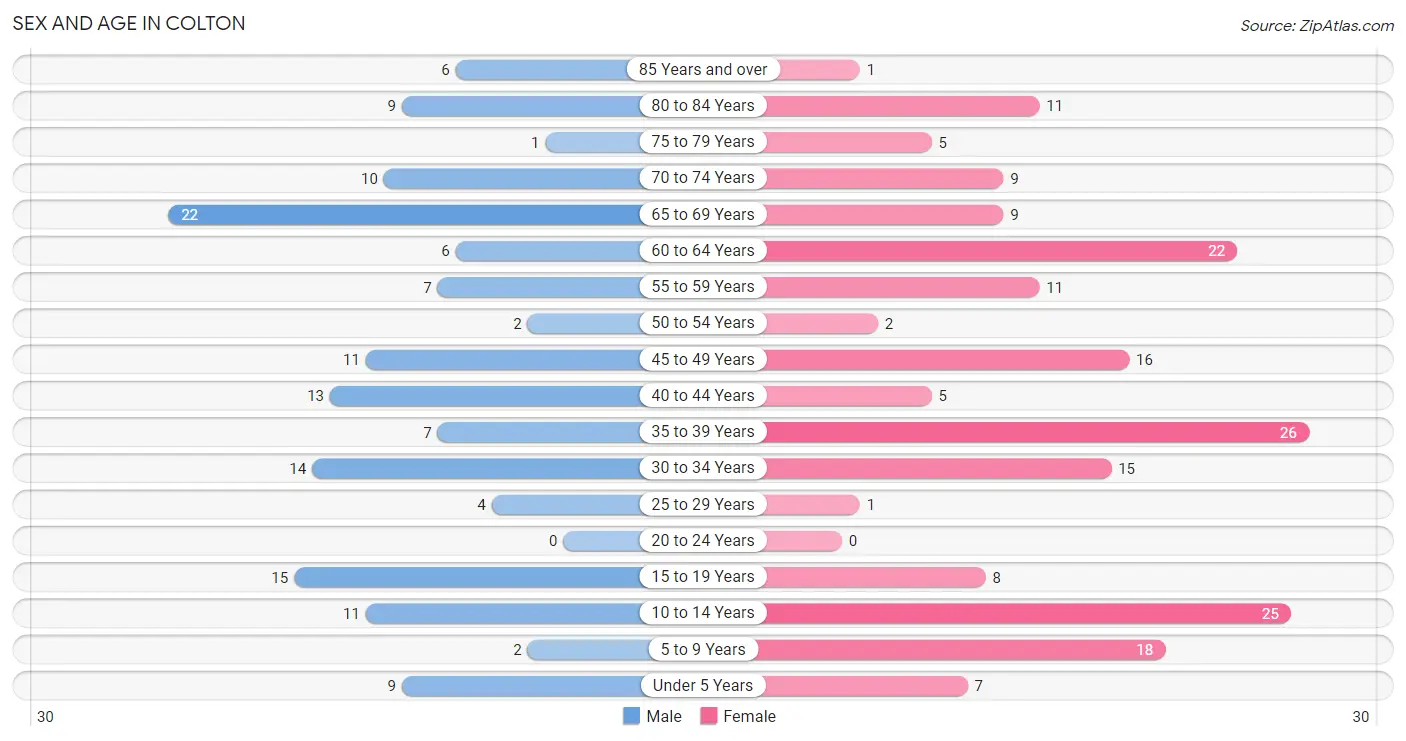
| Age Bracket | Male | Female |
| Under 5 Years | 9 (6.0%) | 7 (3.7%) |
| 5 to 9 Years | 2 (1.3%) | 18 (9.4%) |
| 10 to 14 Years | 11 (7.4%) | 25 (13.1%) |
| 15 to 19 Years | 15 (10.1%) | 8 (4.2%) |
| 20 to 24 Years | 0 (0.0%) | 0 (0.0%) |
| 25 to 29 Years | 4 (2.7%) | 1 (0.5%) |
| 30 to 34 Years | 14 (9.4%) | 15 (7.9%) |
| 35 to 39 Years | 7 (4.7%) | 26 (13.6%) |
| 40 to 44 Years | 13 (8.7%) | 5 (2.6%) |
| 45 to 49 Years | 11 (7.4%) | 16 (8.4%) |
| 50 to 54 Years | 2 (1.3%) | 2 (1.1%) |
| 55 to 59 Years | 7 (4.7%) | 11 (5.8%) |
| 60 to 64 Years | 6 (4.0%) | 22 (11.5%) |
| 65 to 69 Years | 22 (14.8%) | 9 (4.7%) |
| 70 to 74 Years | 10 (6.7%) | 9 (4.7%) |
| 75 to 79 Years | 1 (0.7%) | 5 (2.6%) |
| 80 to 84 Years | 9 (6.0%) | 11 (5.8%) |
| 85 Years and over | 6 (4.0%) | 1 (0.5%) |
| Total | 149 (100.0%) | 191 (100.0%) |
Families and Households in Colton
Median Family Size in Colton
The median family size in Colton is 2.84 persons per family, with single female/mother families (18 | 17.1%) accounting for the largest median family size of 2.94 persons per family. On the other hand, single male/father families (1 | 0.9%) represent the smallest median family size with 2.00 persons per family.
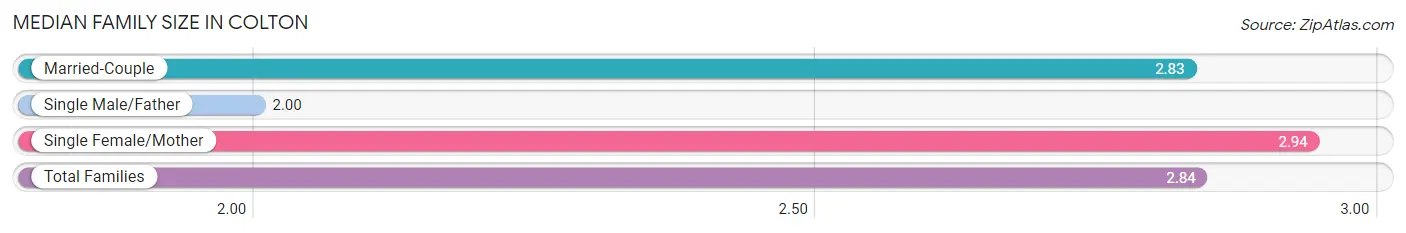
| Family Type | # Families | Family Size |
| Married-Couple | 86 (81.9%) | 2.83 |
| Single Male/Father | 1 (0.9%) | 2.00 |
| Single Female/Mother | 18 (17.1%) | 2.94 |
| Total Families | 105 (100.0%) | 2.84 |
Median Household Size in Colton
The median household size in Colton is 2.41 persons per household, with single female/mother households (18 | 12.8%) accounting for the largest median household size of 3.06 persons per household. non-family households (36 | 25.5%) represent the smallest median household size with 1.11 persons per household.
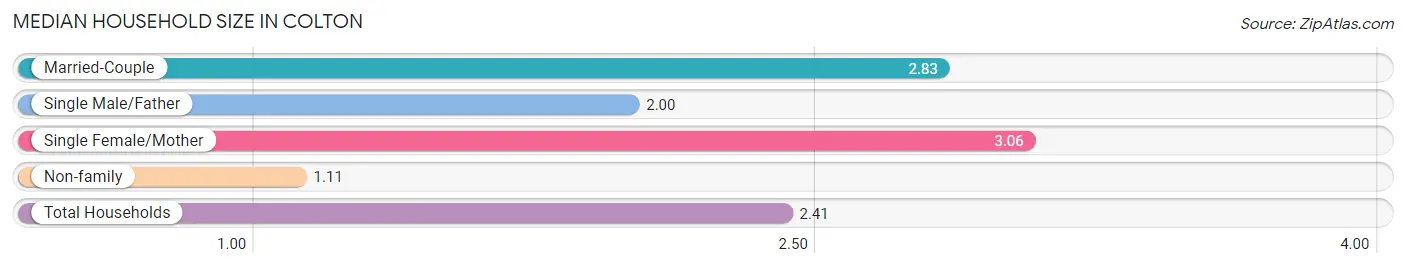
| Household Type | # Households | Household Size |
| Married-Couple | 86 (61.0%) | 2.83 |
| Single Male/Father | 1 (0.7%) | 2.00 |
| Single Female/Mother | 18 (12.8%) | 3.06 |
| Non-family | 36 (25.5%) | 1.11 |
| Total Households | 141 (100.0%) | 2.41 |
Household Size by Marriage Status in Colton
Out of a total of 141 households in Colton, 105 (74.5%) are family households, while 36 (25.5%) are nonfamily households. The most numerous type of family households are 2-person households, comprising 60, and the most common type of nonfamily households are 1-person households, comprising 32.
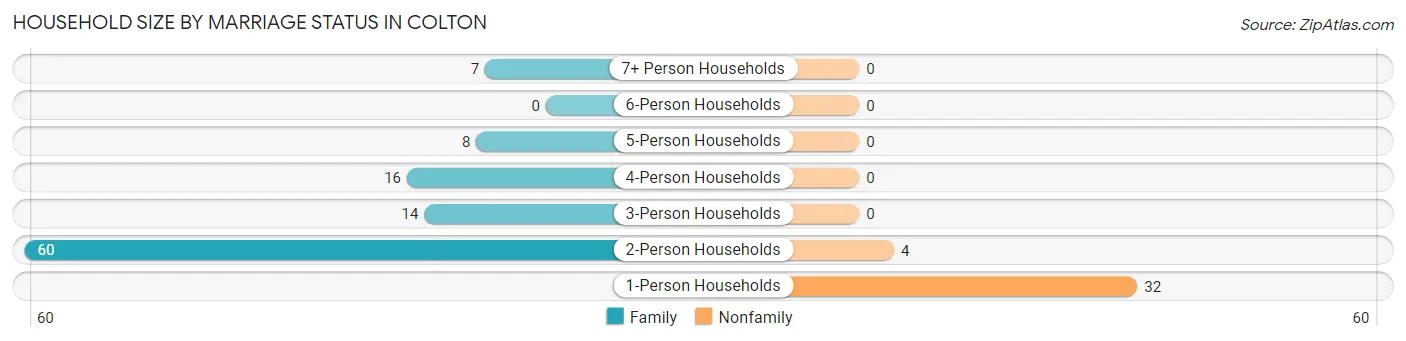
| Household Size | Family Households | Nonfamily Households |
| 1-Person Households | - | 32 (22.7%) |
| 2-Person Households | 60 (42.5%) | 4 (2.8%) |
| 3-Person Households | 14 (9.9%) | 0 (0.0%) |
| 4-Person Households | 16 (11.4%) | 0 (0.0%) |
| 5-Person Households | 8 (5.7%) | 0 (0.0%) |
| 6-Person Households | 0 (0.0%) | 0 (0.0%) |
| 7+ Person Households | 7 (5.0%) | 0 (0.0%) |
| Total | 105 (74.5%) | 36 (25.5%) |
Female Fertility in Colton
Fertility by Age in Colton
| Age Bracket | Women with Births | Births / 1,000 Women |
| 15 to 19 years | 0 (0.0%) | 0.0 |
| 20 to 34 years | 0 (0.0%) | 0.0 |
| 35 to 50 years | 0 (0.0%) | 0.0 |
| Total | 0 (0.0%) | 0.0 |
Fertility by Age by Marriage Status in Colton
| Age Bracket | Married | Unmarried |
| 15 to 19 years | 0 (0.0%) | 0 (0.0%) |
| 20 to 34 years | 0 (0.0%) | 0 (0.0%) |
| 35 to 50 years | 0 (0.0%) | 0 (0.0%) |
| Total | 0 (0.0%) | 0 (0.0%) |
Fertility by Education in Colton
| Educational Attainment | Women with Births | Births / 1,000 Women |
| Less than High School | 0 (0.0%) | 0.0 |
| High School Diploma | 0 (0.0%) | 0.0 |
| College or Associate's Degree | 0 (0.0%) | 0.0 |
| Bachelor's Degree | 0 (0.0%) | 0.0 |
| Graduate Degree | 0 (0.0%) | 0.0 |
| Total | 0 (0.0%) | 0.0 |
Fertility by Education by Marriage Status in Colton
| Educational Attainment | Married | Unmarried |
| Less than High School | 0 (0.0%) | 0 (0.0%) |
| High School Diploma | 0 (0.0%) | 0 (0.0%) |
| College or Associate's Degree | 0 (0.0%) | 0 (0.0%) |
| Bachelor's Degree | 0 (0.0%) | 0 (0.0%) |
| Graduate Degree | 0 (0.0%) | 0 (0.0%) |
| Total | 0 (0.0%) | 0 (0.0%) |
Employment Characteristics in Colton
Employment by Class of Employer in Colton
Among the 153 employed individuals in Colton, private company employees (61 | 39.9%), state government employees (40 | 26.1%), and local government employees (25 | 16.3%) make up the most common classes of employment.
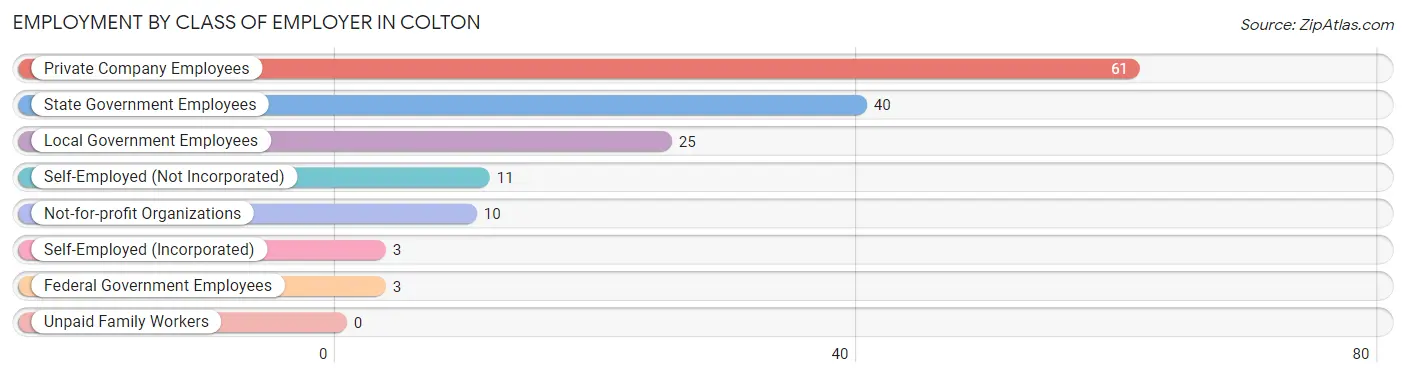
| Employer Class | # Employees | % Employees |
| Private Company Employees | 61 | 39.9% |
| Self-Employed (Incorporated) | 3 | 2.0% |
| Self-Employed (Not Incorporated) | 11 | 7.2% |
| Not-for-profit Organizations | 10 | 6.5% |
| Local Government Employees | 25 | 16.3% |
| State Government Employees | 40 | 26.1% |
| Federal Government Employees | 3 | 2.0% |
| Unpaid Family Workers | 0 | 0.0% |
| Total | 153 | 100.0% |
Employment Status by Age in Colton
According to the labor force statistics for Colton, out of the total population over 16 years of age (262), 62.6% or 164 individuals are in the labor force, with 3.0% or 5 of them unemployed. The age group with the highest labor force participation rate is 30 to 34 years, with 100.0% or 29 individuals in the labor force. Within the labor force, the 30 to 34 years age range has the highest percentage of unemployed individuals, with 13.8% or 4 of them being unemployed.
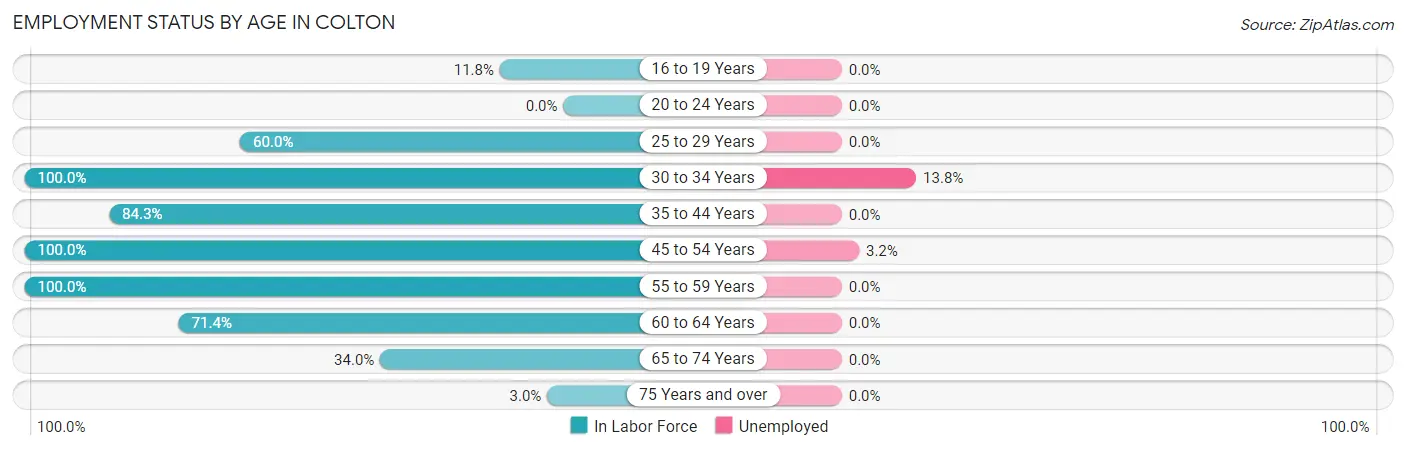
| Age Bracket | In Labor Force | Unemployed |
| 16 to 19 Years | 2 (11.8%) | 0 (0.0%) |
| 20 to 24 Years | 0 (0.0%) | 0 (0.0%) |
| 25 to 29 Years | 3 (60.0%) | 0 (0.0%) |
| 30 to 34 Years | 29 (100.0%) | 4 (13.8%) |
| 35 to 44 Years | 43 (84.3%) | 0 (0.0%) |
| 45 to 54 Years | 31 (100.0%) | 1 (3.2%) |
| 55 to 59 Years | 18 (100.0%) | 0 (0.0%) |
| 60 to 64 Years | 20 (71.4%) | 0 (0.0%) |
| 65 to 74 Years | 17 (34.0%) | 0 (0.0%) |
| 75 Years and over | 1 (3.0%) | 0 (0.0%) |
| Total | 164 (62.6%) | 5 (3.0%) |
Employment Status by Educational Attainment in Colton
According to labor force statistics for Colton, 88.9% of individuals (144) out of the total population between 25 and 64 years of age (162) are in the labor force, with 3.5% or 5 of them being unemployed. The group with the highest labor force participation rate are those with the educational attainment of bachelor's degree or higher, with 94.6% or 70 individuals in the labor force. Within the labor force, individuals with bachelor's degree or higher education have the highest percentage of unemployment, with 7.1% or 5 of them being unemployed.
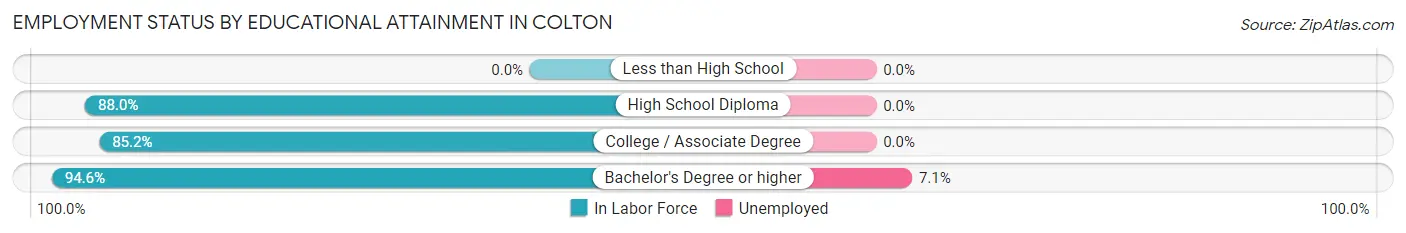
| Educational Attainment | In Labor Force | Unemployed |
| Less than High School | 0 (0.0%) | 0 (0.0%) |
| High School Diploma | 22 (88.0%) | 0 (0.0%) |
| College / Associate Degree | 52 (85.2%) | 0 (0.0%) |
| Bachelor's Degree or higher | 70 (94.6%) | 5 (7.1%) |
| Total | 144 (88.9%) | 6 (3.5%) |
Employment Occupations by Sex in Colton
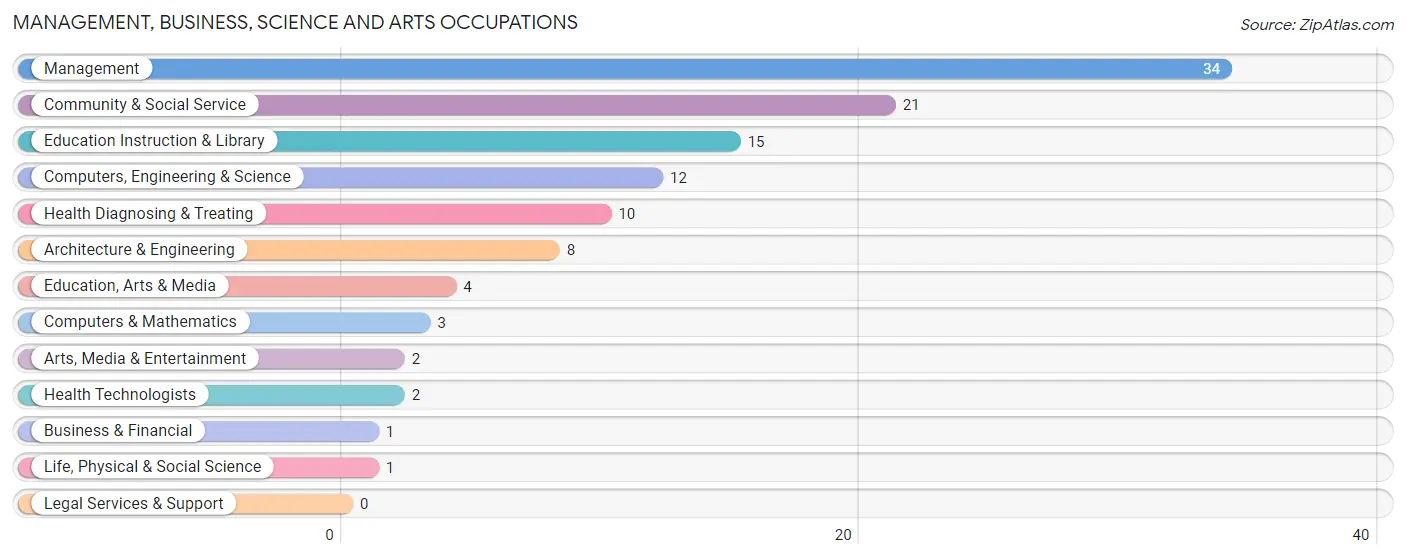
Management, Business, Science and Arts Occupations
The most common Management, Business, Science and Arts occupations in Colton are Management (34 | 21.4%), Community & Social Service (21 | 13.2%), Education Instruction & Library (15 | 9.4%), Computers, Engineering & Science (12 | 7.5%), and Health Diagnosing & Treating (10 | 6.3%).
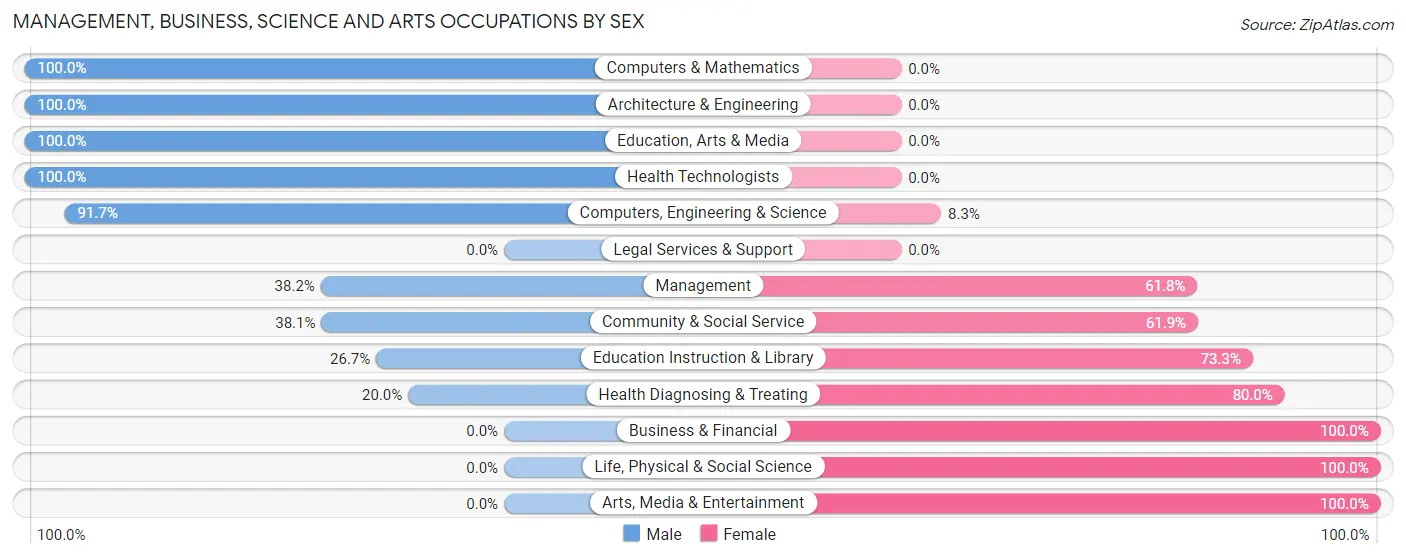
Management, Business, Science and Arts Occupations by Sex
Within the Management, Business, Science and Arts occupations in Colton, the most male-oriented occupations are Computers & Mathematics (100.0%), Architecture & Engineering (100.0%), and Education, Arts & Media (100.0%), while the most female-oriented occupations are Business & Financial (100.0%), Life, Physical & Social Science (100.0%), and Arts, Media & Entertainment (100.0%).
| Occupation | Male | Female |
| Management | 13 (38.2%) | 21 (61.8%) |
| Business & Financial | 0 (0.0%) | 1 (100.0%) |
| Computers, Engineering & Science | 11 (91.7%) | 1 (8.3%) |
| Computers & Mathematics | 3 (100.0%) | 0 (0.0%) |
| Architecture & Engineering | 8 (100.0%) | 0 (0.0%) |
| Life, Physical & Social Science | 0 (0.0%) | 1 (100.0%) |
| Community & Social Service | 8 (38.1%) | 13 (61.9%) |
| Education, Arts & Media | 4 (100.0%) | 0 (0.0%) |
| Legal Services & Support | 0 (0.0%) | 0 (0.0%) |
| Education Instruction & Library | 4 (26.7%) | 11 (73.3%) |
| Arts, Media & Entertainment | 0 (0.0%) | 2 (100.0%) |
| Health Diagnosing & Treating | 2 (20.0%) | 8 (80.0%) |
| Health Technologists | 2 (100.0%) | 0 (0.0%) |
| Total (Category) | 34 (43.6%) | 44 (56.4%) |
| Total (Overall) | 65 (40.9%) | 94 (59.1%) |
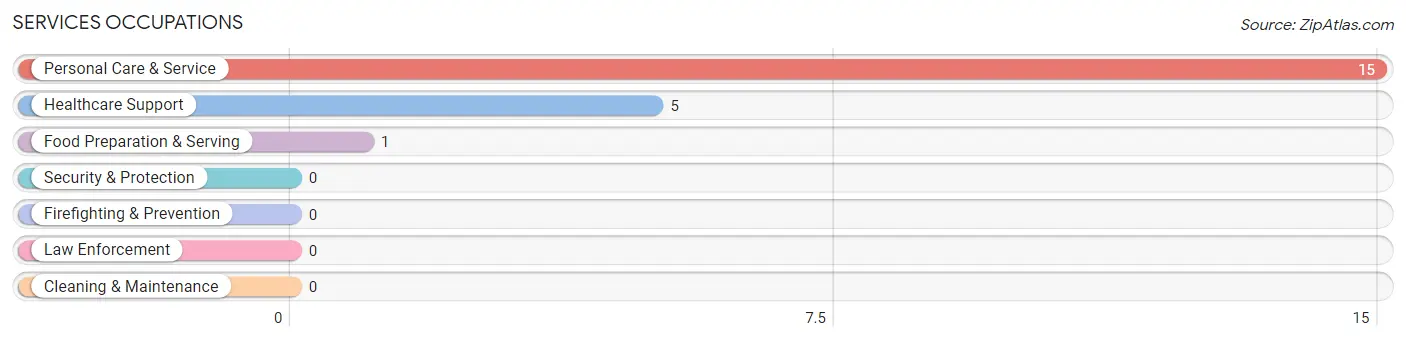
Services Occupations
The most common Services occupations in Colton are Personal Care & Service (15 | 9.4%), Healthcare Support (5 | 3.1%), and Food Preparation & Serving (1 | 0.6%).
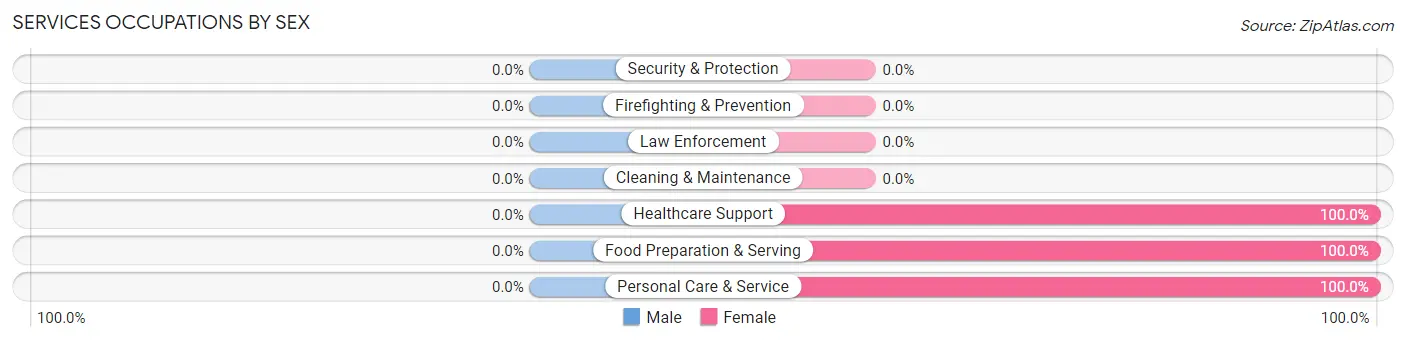
Services Occupations by Sex
| Occupation | Male | Female |
| Healthcare Support | 0 (0.0%) | 5 (100.0%) |
| Security & Protection | 0 (0.0%) | 0 (0.0%) |
| Firefighting & Prevention | 0 (0.0%) | 0 (0.0%) |
| Law Enforcement | 0 (0.0%) | 0 (0.0%) |
| Food Preparation & Serving | 0 (0.0%) | 1 (100.0%) |
| Cleaning & Maintenance | 0 (0.0%) | 0 (0.0%) |
| Personal Care & Service | 0 (0.0%) | 15 (100.0%) |
| Total (Category) | 0 (0.0%) | 21 (100.0%) |
| Total (Overall) | 65 (40.9%) | 94 (59.1%) |
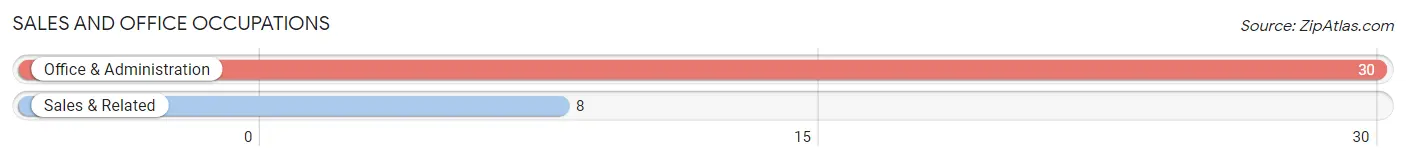
Sales and Office Occupations
The most common Sales and Office occupations in Colton are Office & Administration (30 | 18.9%), and Sales & Related (8 | 5.0%).
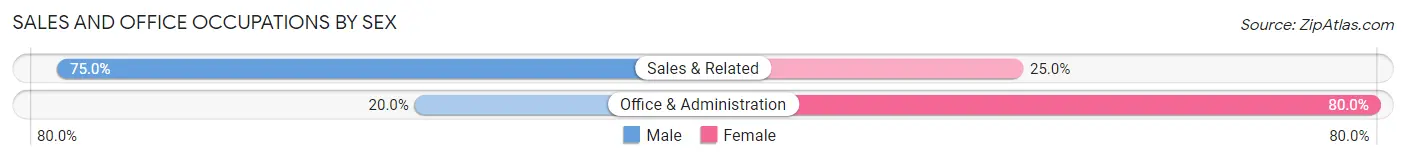
Sales and Office Occupations by Sex
| Occupation | Male | Female |
| Sales & Related | 6 (75.0%) | 2 (25.0%) |
| Office & Administration | 6 (20.0%) | 24 (80.0%) |
| Total (Category) | 12 (31.6%) | 26 (68.4%) |
| Total (Overall) | 65 (40.9%) | 94 (59.1%) |
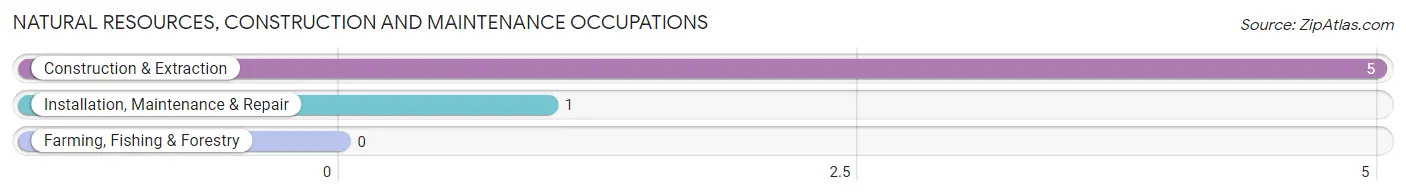
Natural Resources, Construction and Maintenance Occupations
The most common Natural Resources, Construction and Maintenance occupations in Colton are Construction & Extraction (5 | 3.1%), and Installation, Maintenance & Repair (1 | 0.6%).
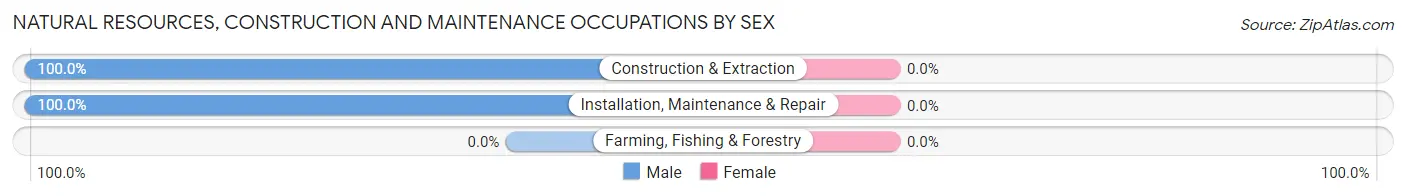
Natural Resources, Construction and Maintenance Occupations by Sex
| Occupation | Male | Female |
| Farming, Fishing & Forestry | 0 (0.0%) | 0 (0.0%) |
| Construction & Extraction | 5 (100.0%) | 0 (0.0%) |
| Installation, Maintenance & Repair | 1 (100.0%) | 0 (0.0%) |
| Total (Category) | 6 (100.0%) | 0 (0.0%) |
| Total (Overall) | 65 (40.9%) | 94 (59.1%) |
Production, Transportation and Moving Occupations
The most common Production, Transportation and Moving occupations in Colton are Production (11 | 6.9%), and Transportation (5 | 3.1%).
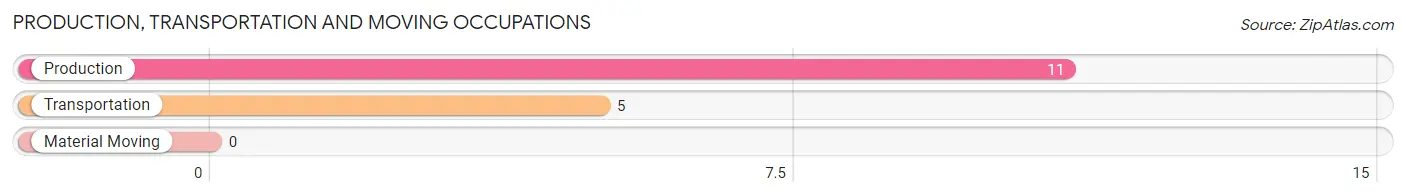
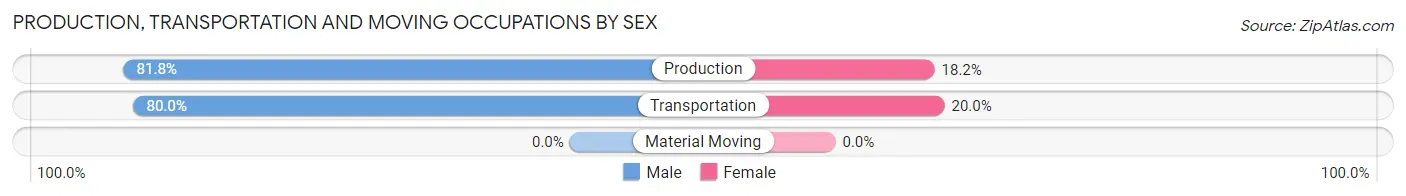
Production, Transportation and Moving Occupations by Sex
| Occupation | Male | Female |
| Production | 9 (81.8%) | 2 (18.2%) |
| Transportation | 4 (80.0%) | 1 (20.0%) |
| Material Moving | 0 (0.0%) | 0 (0.0%) |
| Total (Category) | 13 (81.2%) | 3 (18.8%) |
| Total (Overall) | 65 (40.9%) | 94 (59.1%) |
Employment Industries by Sex in Colton
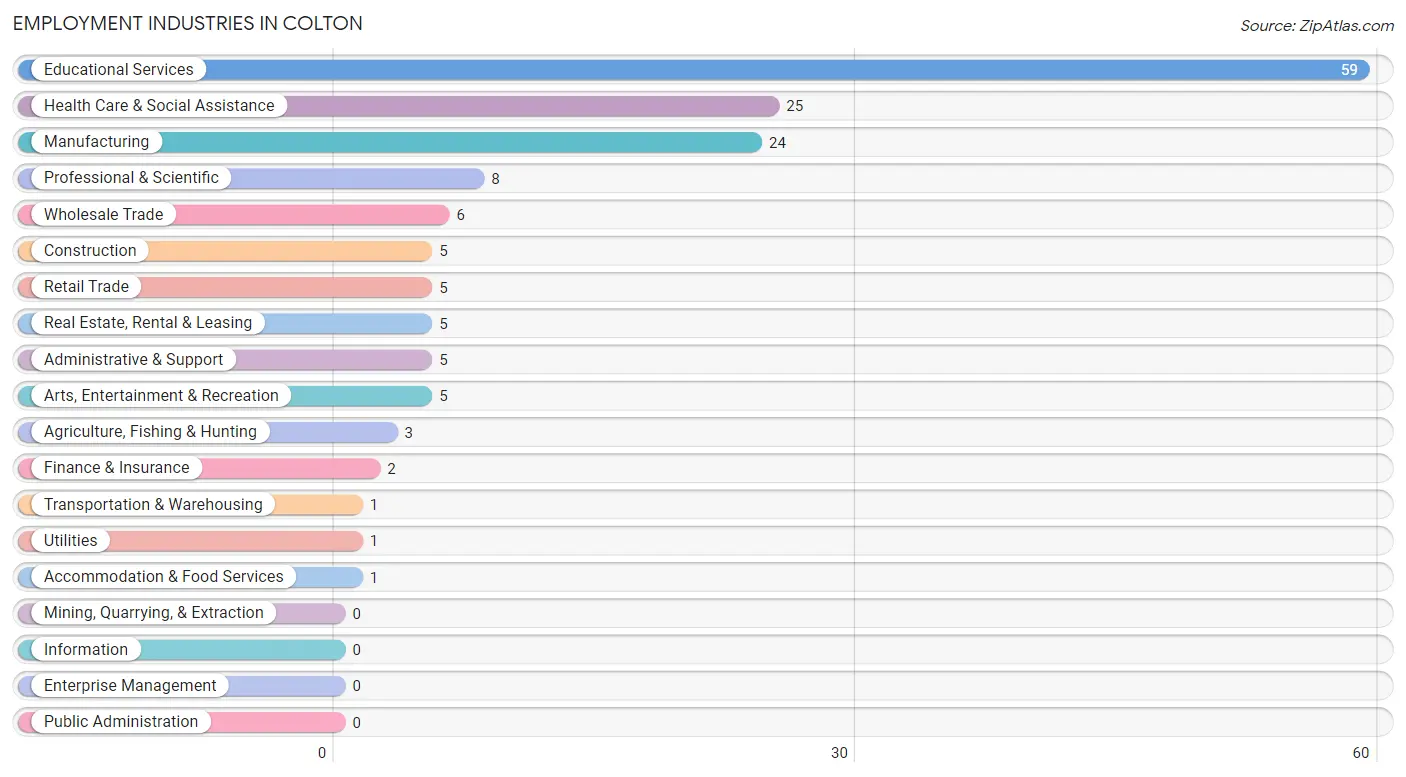
Employment Industries in Colton
The major employment industries in Colton include Educational Services (59 | 37.1%), Health Care & Social Assistance (25 | 15.7%), Manufacturing (24 | 15.1%), Professional & Scientific (8 | 5.0%), and Wholesale Trade (6 | 3.8%).
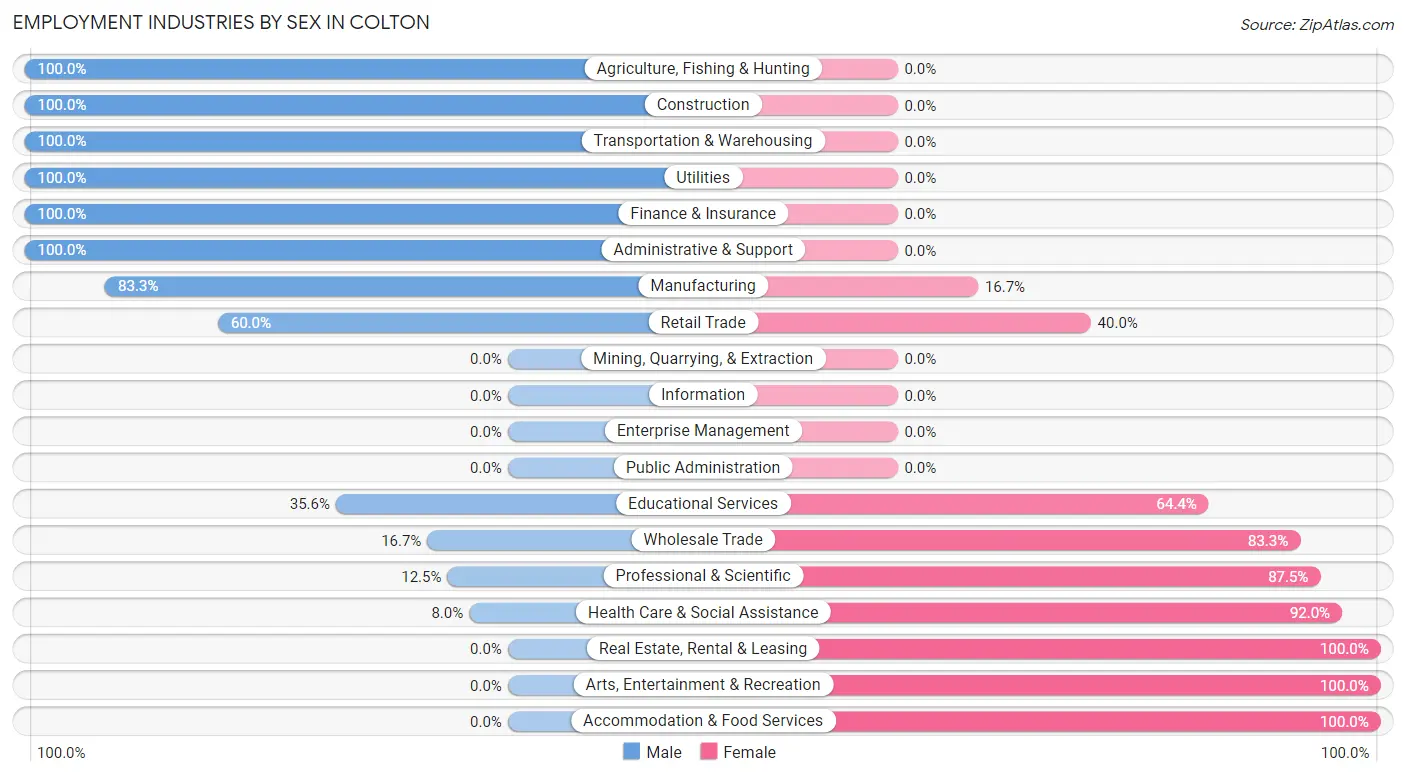
Employment Industries by Sex in Colton
The Colton industries that see more men than women are Agriculture, Fishing & Hunting (100.0%), Construction (100.0%), and Transportation & Warehousing (100.0%), whereas the industries that tend to have a higher number of women are Real Estate, Rental & Leasing (100.0%), Arts, Entertainment & Recreation (100.0%), and Accommodation & Food Services (100.0%).
| Industry | Male | Female |
| Agriculture, Fishing & Hunting | 3 (100.0%) | 0 (0.0%) |
| Mining, Quarrying, & Extraction | 0 (0.0%) | 0 (0.0%) |
| Construction | 5 (100.0%) | 0 (0.0%) |
| Manufacturing | 20 (83.3%) | 4 (16.7%) |
| Wholesale Trade | 1 (16.7%) | 5 (83.3%) |
| Retail Trade | 3 (60.0%) | 2 (40.0%) |
| Transportation & Warehousing | 1 (100.0%) | 0 (0.0%) |
| Utilities | 1 (100.0%) | 0 (0.0%) |
| Information | 0 (0.0%) | 0 (0.0%) |
| Finance & Insurance | 2 (100.0%) | 0 (0.0%) |
| Real Estate, Rental & Leasing | 0 (0.0%) | 5 (100.0%) |
| Professional & Scientific | 1 (12.5%) | 7 (87.5%) |
| Enterprise Management | 0 (0.0%) | 0 (0.0%) |
| Administrative & Support | 5 (100.0%) | 0 (0.0%) |
| Educational Services | 21 (35.6%) | 38 (64.4%) |
| Health Care & Social Assistance | 2 (8.0%) | 23 (92.0%) |
| Arts, Entertainment & Recreation | 0 (0.0%) | 5 (100.0%) |
| Accommodation & Food Services | 0 (0.0%) | 1 (100.0%) |
| Public Administration | 0 (0.0%) | 0 (0.0%) |
| Total | 65 (40.9%) | 94 (59.1%) |
Education in Colton
School Enrollment in Colton
The most common levels of schooling among the 91 students in Colton are middle school (24 | 26.4%), high school (21 | 23.1%), and elementary school (20 | 22.0%).
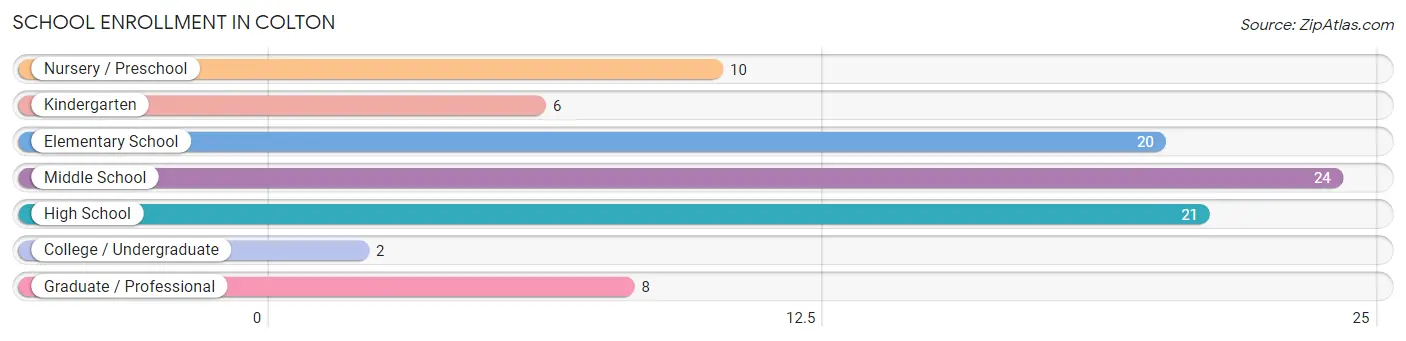
| School Level | # Students | % Students |
| Nursery / Preschool | 10 | 11.0% |
| Kindergarten | 6 | 6.6% |
| Elementary School | 20 | 22.0% |
| Middle School | 24 | 26.4% |
| High School | 21 | 23.1% |
| College / Undergraduate | 2 | 2.2% |
| Graduate / Professional | 8 | 8.8% |
| Total | 91 | 100.0% |
School Enrollment by Age by Funding Source in Colton
Out of a total of 91 students who are enrolled in schools in Colton, 10 (11.0%) attend a private institution, while the remaining 81 (89.0%) are enrolled in public schools. The age group of 3 to 4 year olds has the highest likelihood of being enrolled in private schools, with 4 (100.0% in the age bracket) enrolled. Conversely, the age group of 10 to 14 year olds has the lowest likelihood of being enrolled in a private school, with 36 (100.0% in the age bracket) attending a public institution.
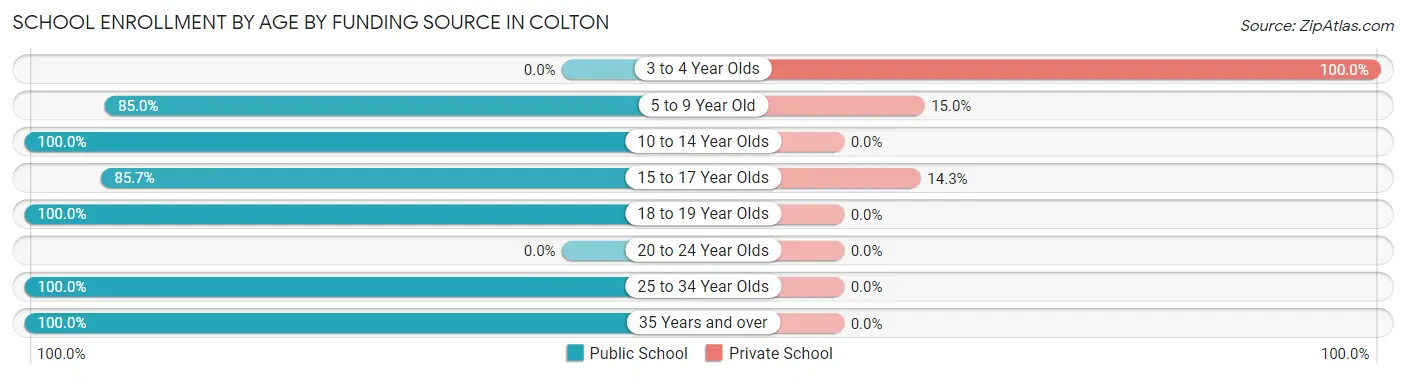
| Age Bracket | Public School | Private School |
| 3 to 4 Year Olds | 0 (0.0%) | 4 (100.0%) |
| 5 to 9 Year Old | 17 (85.0%) | 3 (15.0%) |
| 10 to 14 Year Olds | 36 (100.0%) | 0 (0.0%) |
| 15 to 17 Year Olds | 18 (85.7%) | 3 (14.3%) |
| 18 to 19 Year Olds | 2 (100.0%) | 0 (0.0%) |
| 20 to 24 Year Olds | 0 (0.0%) | 0 (0.0%) |
| 25 to 34 Year Olds | 4 (100.0%) | 0 (0.0%) |
| 35 Years and over | 4 (100.0%) | 0 (0.0%) |
| Total | 81 (89.0%) | 10 (11.0%) |
Educational Attainment by Field of Study in Colton
Business (17 | 15.9%), education (16 | 14.9%), literature & languages (15 | 14.0%), liberal arts & history (15 | 14.0%), and science & technology (12 | 11.2%) are the most common fields of study among 107 individuals in Colton who have obtained a bachelor's degree or higher.
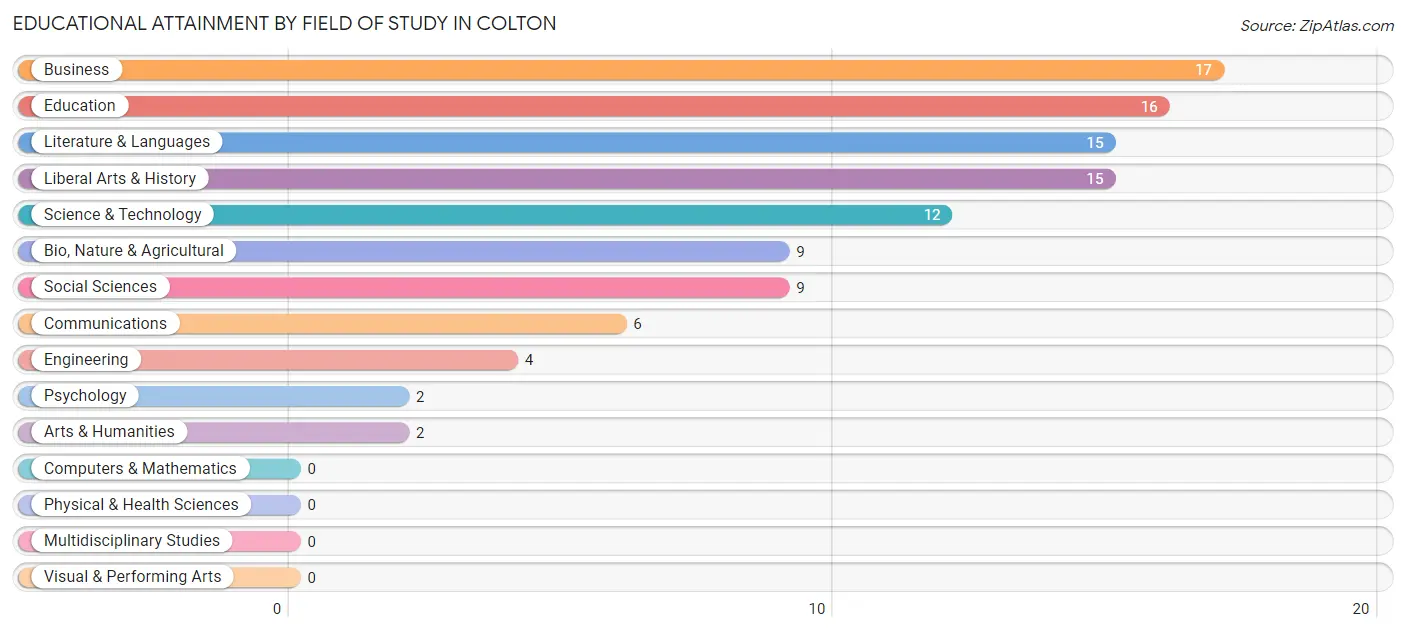
| Field of Study | # Graduates | % Graduates |
| Computers & Mathematics | 0 | 0.0% |
| Bio, Nature & Agricultural | 9 | 8.4% |
| Physical & Health Sciences | 0 | 0.0% |
| Psychology | 2 | 1.9% |
| Social Sciences | 9 | 8.4% |
| Engineering | 4 | 3.7% |
| Multidisciplinary Studies | 0 | 0.0% |
| Science & Technology | 12 | 11.2% |
| Business | 17 | 15.9% |
| Education | 16 | 14.9% |
| Literature & Languages | 15 | 14.0% |
| Liberal Arts & History | 15 | 14.0% |
| Visual & Performing Arts | 0 | 0.0% |
| Communications | 6 | 5.6% |
| Arts & Humanities | 2 | 1.9% |
| Total | 107 | 100.0% |
Transportation & Commute in Colton
Vehicle Availability by Sex in Colton
The most prevalent vehicle ownership categories in Colton are males with 2 vehicles (27, accounting for 42.9%) and females with 2 vehicles (46, making up 30.0%).
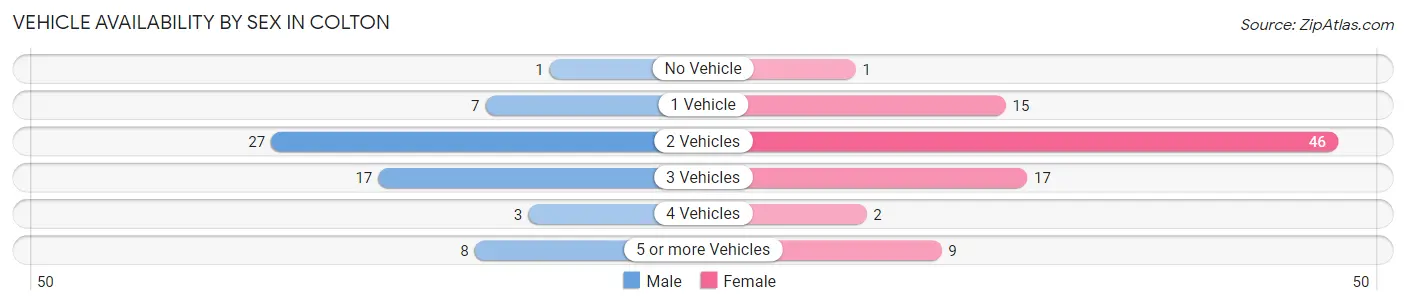
| Vehicles Available | Male | Female |
| No Vehicle | 1 (1.6%) | 1 (1.1%) |
| 1 Vehicle | 7 (11.1%) | 15 (16.7%) |
| 2 Vehicles | 27 (42.9%) | 46 (51.1%) |
| 3 Vehicles | 17 (27.0%) | 17 (18.9%) |
| 4 Vehicles | 3 (4.8%) | 2 (2.2%) |
| 5 or more Vehicles | 8 (12.7%) | 9 (10.0%) |
| Total | 63 (100.0%) | 90 (100.0%) |
Commute Time in Colton
The most frequently occuring commute durations in Colton are 25 to 29 minutes (42 commuters, 28.8%), 30 to 34 minutes (32 commuters, 21.9%), and 20 to 24 minutes (27 commuters, 18.5%).
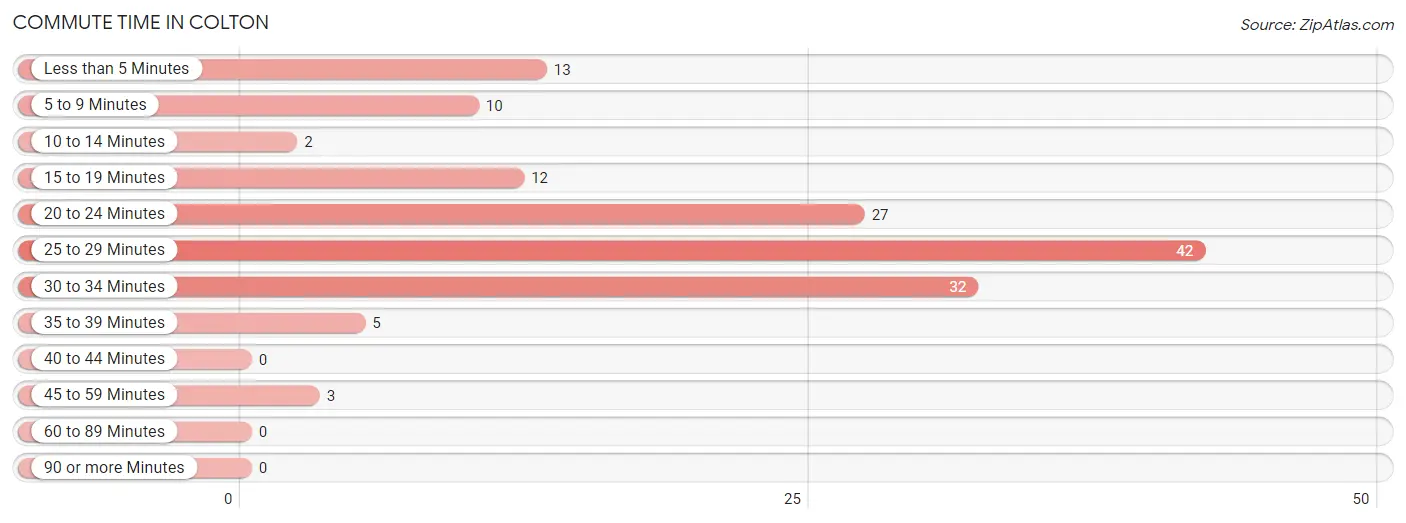
| Commute Time | # Commuters | % Commuters |
| Less than 5 Minutes | 13 | 8.9% |
| 5 to 9 Minutes | 10 | 6.9% |
| 10 to 14 Minutes | 2 | 1.4% |
| 15 to 19 Minutes | 12 | 8.2% |
| 20 to 24 Minutes | 27 | 18.5% |
| 25 to 29 Minutes | 42 | 28.8% |
| 30 to 34 Minutes | 32 | 21.9% |
| 35 to 39 Minutes | 5 | 3.4% |
| 40 to 44 Minutes | 0 | 0.0% |
| 45 to 59 Minutes | 3 | 2.1% |
| 60 to 89 Minutes | 0 | 0.0% |
| 90 or more Minutes | 0 | 0.0% |
Commute Time by Sex in Colton
The most common commute times in Colton are 25 to 29 minutes (20 commuters, 32.3%) for males and 25 to 29 minutes (22 commuters, 26.2%) for females.
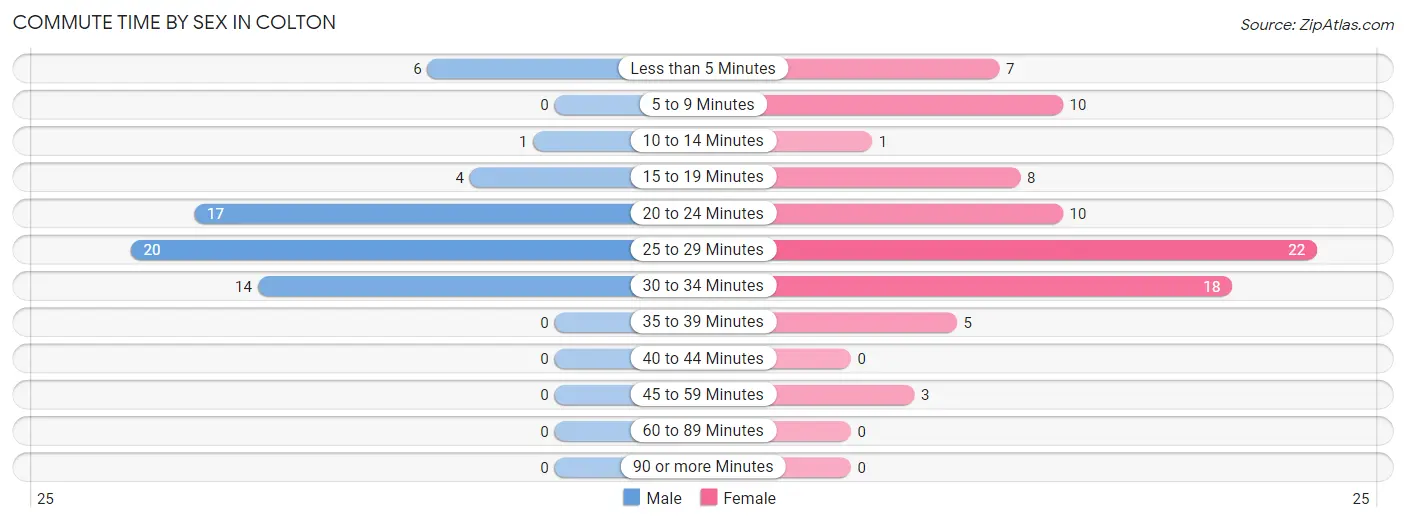
| Commute Time | Male | Female |
| Less than 5 Minutes | 6 (9.7%) | 7 (8.3%) |
| 5 to 9 Minutes | 0 (0.0%) | 10 (11.9%) |
| 10 to 14 Minutes | 1 (1.6%) | 1 (1.2%) |
| 15 to 19 Minutes | 4 (6.5%) | 8 (9.5%) |
| 20 to 24 Minutes | 17 (27.4%) | 10 (11.9%) |
| 25 to 29 Minutes | 20 (32.3%) | 22 (26.2%) |
| 30 to 34 Minutes | 14 (22.6%) | 18 (21.4%) |
| 35 to 39 Minutes | 0 (0.0%) | 5 (5.9%) |
| 40 to 44 Minutes | 0 (0.0%) | 0 (0.0%) |
| 45 to 59 Minutes | 0 (0.0%) | 3 (3.6%) |
| 60 to 89 Minutes | 0 (0.0%) | 0 (0.0%) |
| 90 or more Minutes | 0 (0.0%) | 0 (0.0%) |
Time of Departure to Work by Sex in Colton
The most frequent times of departure to work in Colton are 7:00 AM to 7:29 AM (13, 21.0%) for males and 7:00 AM to 7:29 AM (29, 34.5%) for females.
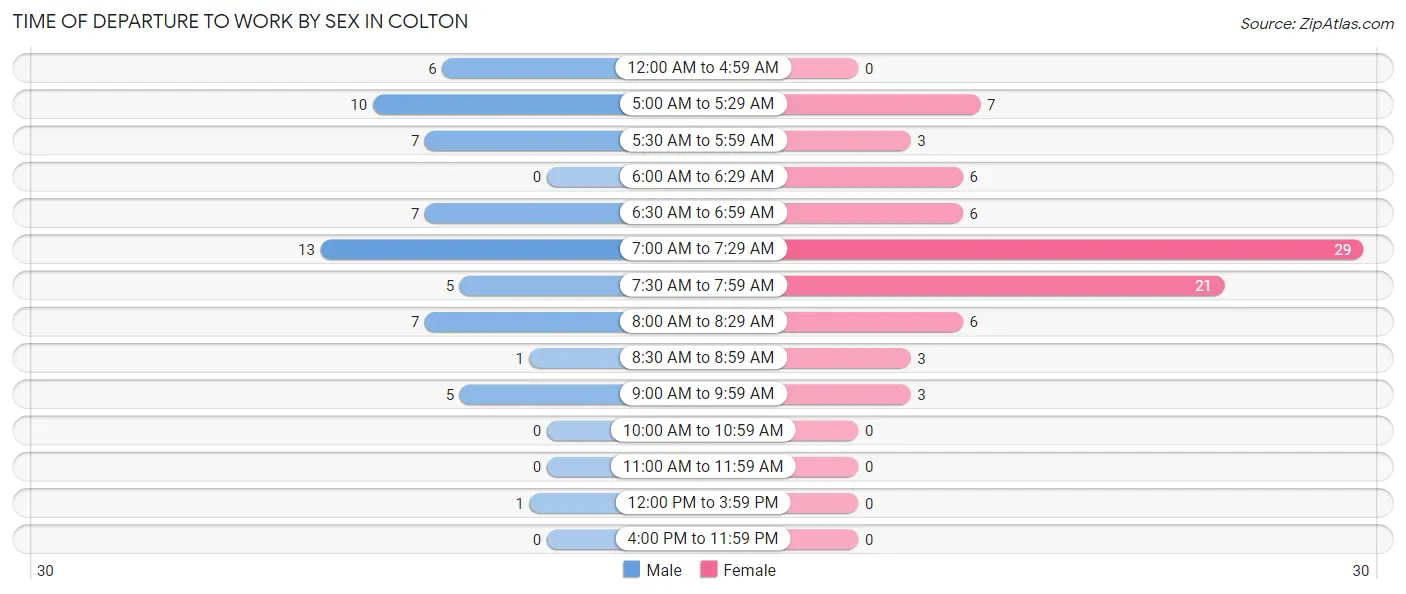
| Time of Departure | Male | Female |
| 12:00 AM to 4:59 AM | 6 (9.7%) | 0 (0.0%) |
| 5:00 AM to 5:29 AM | 10 (16.1%) | 7 (8.3%) |
| 5:30 AM to 5:59 AM | 7 (11.3%) | 3 (3.6%) |
| 6:00 AM to 6:29 AM | 0 (0.0%) | 6 (7.1%) |
| 6:30 AM to 6:59 AM | 7 (11.3%) | 6 (7.1%) |
| 7:00 AM to 7:29 AM | 13 (21.0%) | 29 (34.5%) |
| 7:30 AM to 7:59 AM | 5 (8.1%) | 21 (25.0%) |
| 8:00 AM to 8:29 AM | 7 (11.3%) | 6 (7.1%) |
| 8:30 AM to 8:59 AM | 1 (1.6%) | 3 (3.6%) |
| 9:00 AM to 9:59 AM | 5 (8.1%) | 3 (3.6%) |
| 10:00 AM to 10:59 AM | 0 (0.0%) | 0 (0.0%) |
| 11:00 AM to 11:59 AM | 0 (0.0%) | 0 (0.0%) |
| 12:00 PM to 3:59 PM | 1 (1.6%) | 0 (0.0%) |
| 4:00 PM to 11:59 PM | 0 (0.0%) | 0 (0.0%) |
| Total | 62 (100.0%) | 84 (100.0%) |
Housing Occupancy in Colton
Occupancy by Ownership in Colton
Of the total 141 dwellings in Colton, owner-occupied units account for 121 (85.8%), while renter-occupied units make up 20 (14.2%).
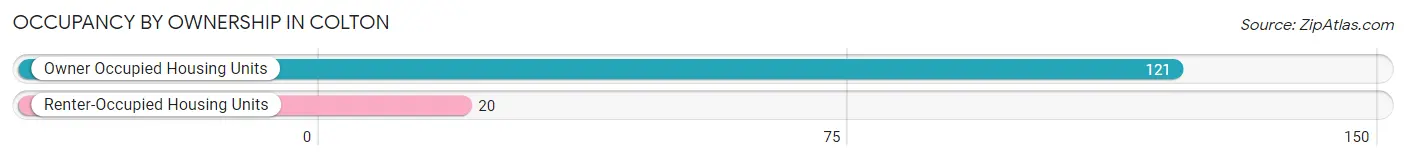
| Occupancy | # Housing Units | % Housing Units |
| Owner Occupied Housing Units | 121 | 85.8% |
| Renter-Occupied Housing Units | 20 | 14.2% |
| Total Occupied Housing Units | 141 | 100.0% |
Occupancy by Household Size in Colton
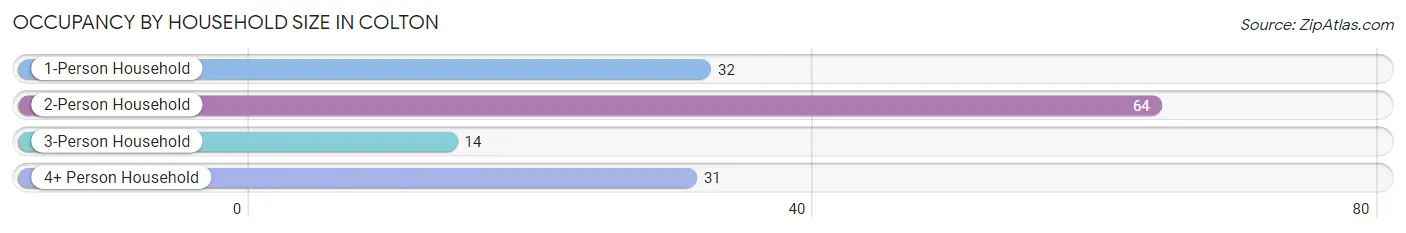
| Household Size | # Housing Units | % Housing Units |
| 1-Person Household | 32 | 22.7% |
| 2-Person Household | 64 | 45.4% |
| 3-Person Household | 14 | 9.9% |
| 4+ Person Household | 31 | 22.0% |
| Total Housing Units | 141 | 100.0% |
Occupancy by Ownership by Household Size in Colton
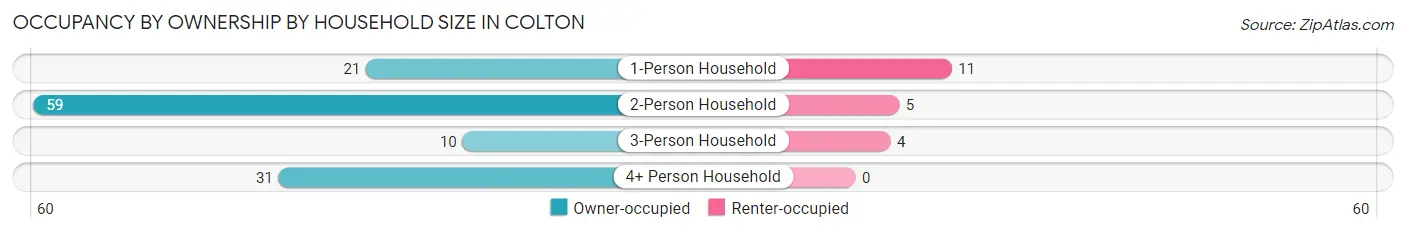
| Household Size | Owner-occupied | Renter-occupied |
| 1-Person Household | 21 (65.6%) | 11 (34.4%) |
| 2-Person Household | 59 (92.2%) | 5 (7.8%) |
| 3-Person Household | 10 (71.4%) | 4 (28.6%) |
| 4+ Person Household | 31 (100.0%) | 0 (0.0%) |
| Total Housing Units | 121 (85.8%) | 20 (14.2%) |
Occupancy by Educational Attainment in Colton
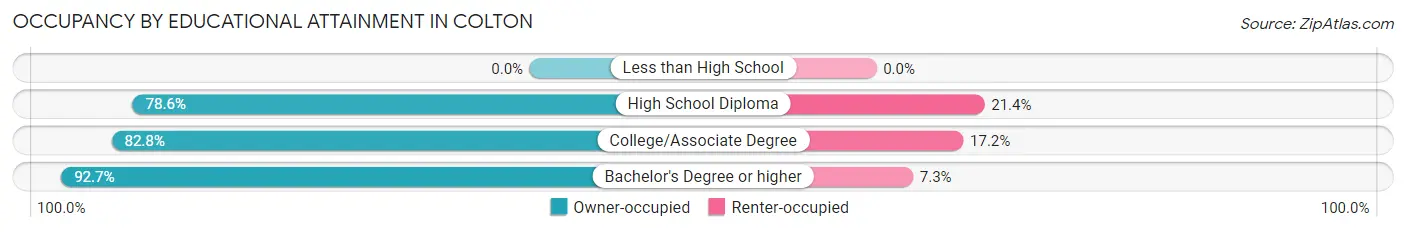
| Household Size | Owner-occupied | Renter-occupied |
| Less than High School | 0 (0.0%) | 0 (0.0%) |
| High School Diploma | 22 (78.6%) | 6 (21.4%) |
| College/Associate Degree | 48 (82.8%) | 10 (17.2%) |
| Bachelor's Degree or higher | 51 (92.7%) | 4 (7.3%) |
Occupancy by Age of Householder in Colton
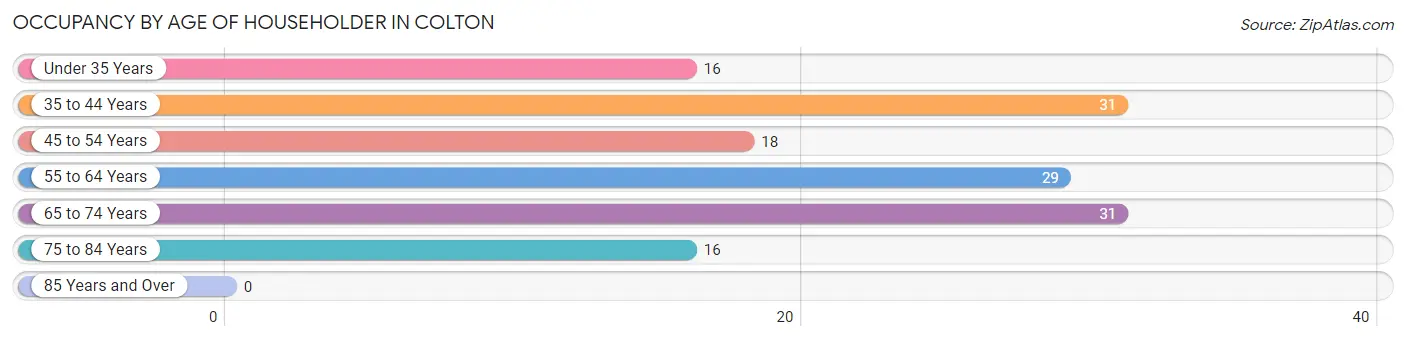
| Age Bracket | # Households | % Households |
| Under 35 Years | 16 | 11.4% |
| 35 to 44 Years | 31 | 22.0% |
| 45 to 54 Years | 18 | 12.8% |
| 55 to 64 Years | 29 | 20.6% |
| 65 to 74 Years | 31 | 22.0% |
| 75 to 84 Years | 16 | 11.4% |
| 85 Years and Over | 0 | 0.0% |
| Total | 141 | 100.0% |
Housing Finances in Colton
Median Income by Occupancy in Colton
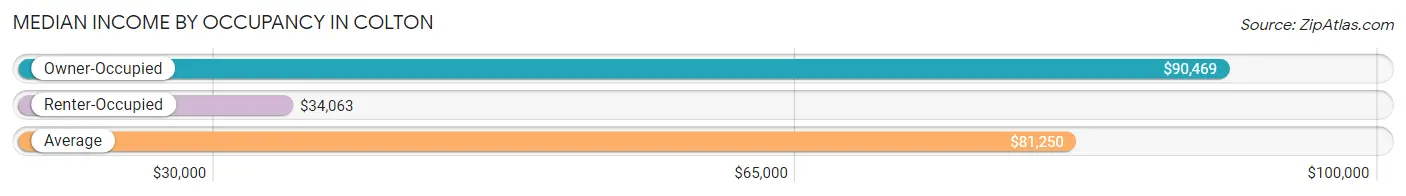
| Occupancy Type | # Households | Median Income |
| Owner-Occupied | 121 (85.8%) | $90,469 |
| Renter-Occupied | 20 (14.2%) | $34,063 |
| Average | 141 (100.0%) | $81,250 |
Occupancy by Householder Income Bracket in Colton
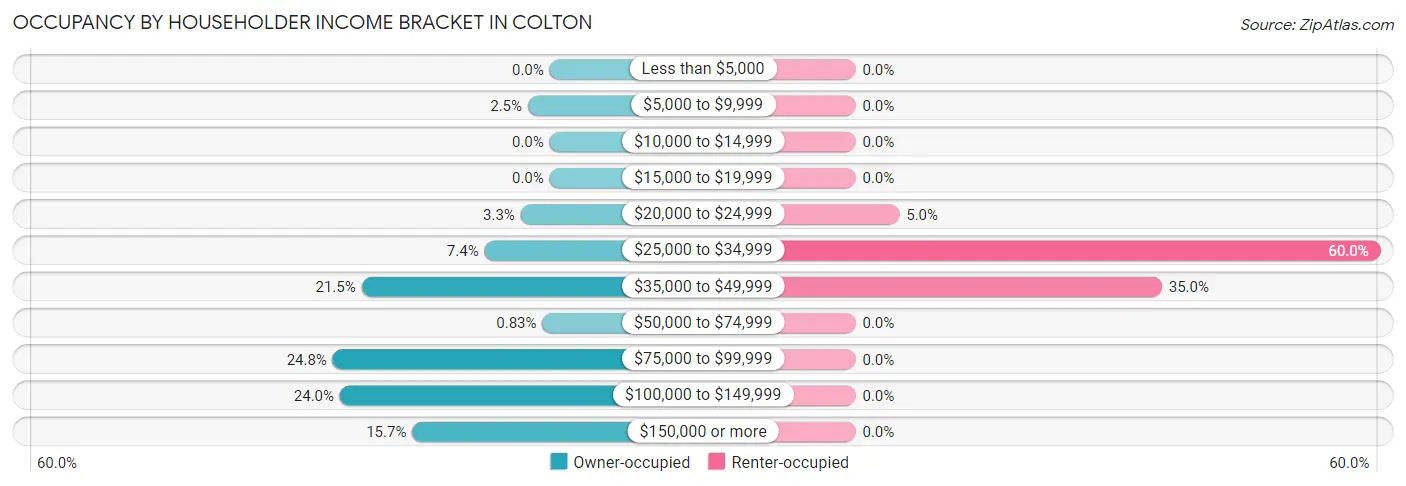
| Income Bracket | Owner-occupied | Renter-occupied |
| Less than $5,000 | 0 (0.0%) | 0 (0.0%) |
| $5,000 to $9,999 | 3 (2.5%) | 0 (0.0%) |
| $10,000 to $14,999 | 0 (0.0%) | 0 (0.0%) |
| $15,000 to $19,999 | 0 (0.0%) | 0 (0.0%) |
| $20,000 to $24,999 | 4 (3.3%) | 1 (5.0%) |
| $25,000 to $34,999 | 9 (7.4%) | 12 (60.0%) |
| $35,000 to $49,999 | 26 (21.5%) | 7 (35.0%) |
| $50,000 to $74,999 | 1 (0.8%) | 0 (0.0%) |
| $75,000 to $99,999 | 30 (24.8%) | 0 (0.0%) |
| $100,000 to $149,999 | 29 (24.0%) | 0 (0.0%) |
| $150,000 or more | 19 (15.7%) | 0 (0.0%) |
| Total | 121 (100.0%) | 20 (100.0%) |
Monthly Housing Cost Tiers in Colton
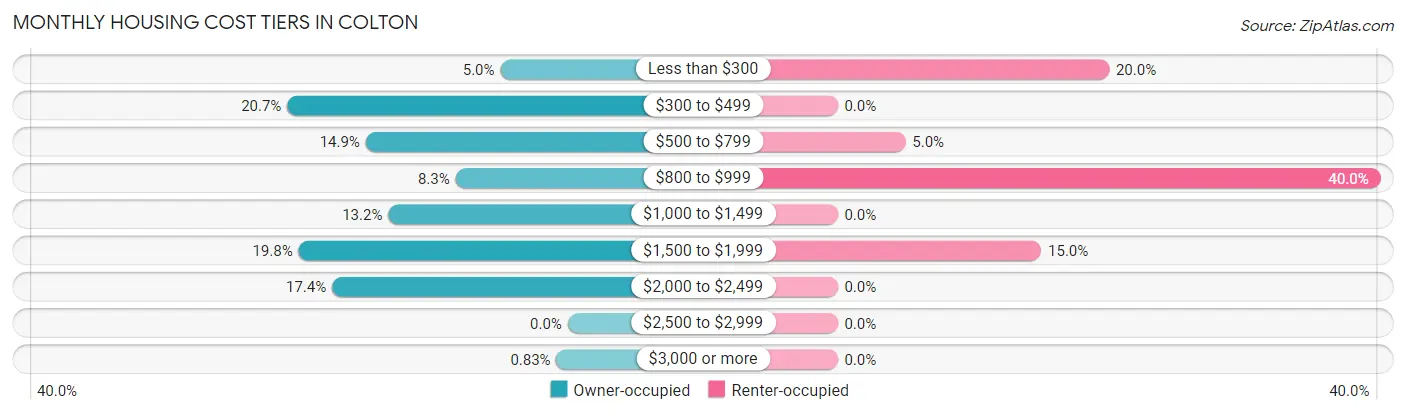
| Monthly Cost | Owner-occupied | Renter-occupied |
| Less than $300 | 6 (5.0%) | 4 (20.0%) |
| $300 to $499 | 25 (20.7%) | 0 (0.0%) |
| $500 to $799 | 18 (14.9%) | 1 (5.0%) |
| $800 to $999 | 10 (8.3%) | 8 (40.0%) |
| $1,000 to $1,499 | 16 (13.2%) | 0 (0.0%) |
| $1,500 to $1,999 | 24 (19.8%) | 3 (15.0%) |
| $2,000 to $2,499 | 21 (17.4%) | 0 (0.0%) |
| $2,500 to $2,999 | 0 (0.0%) | 0 (0.0%) |
| $3,000 or more | 1 (0.8%) | 0 (0.0%) |
| Total | 121 (100.0%) | 20 (100.0%) |
Physical Housing Characteristics in Colton
Housing Structures in Colton
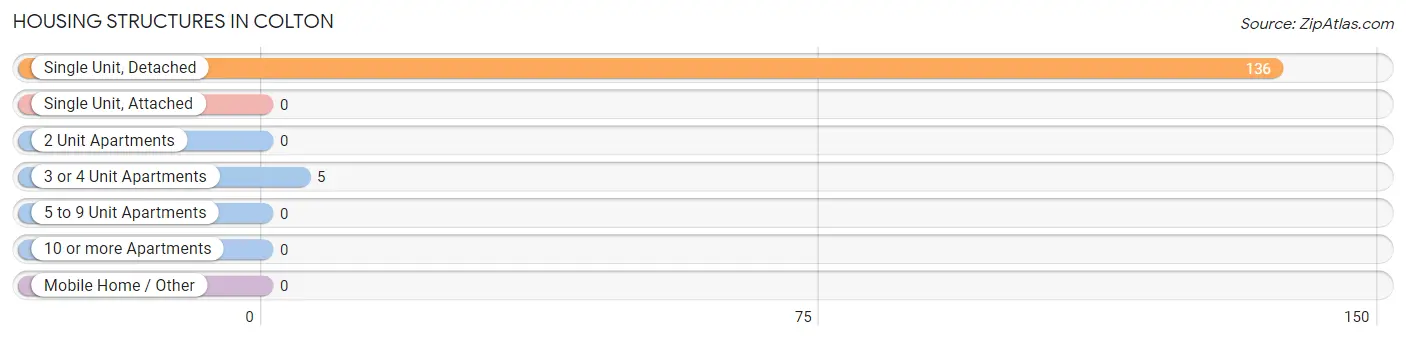
| Structure Type | # Housing Units | % Housing Units |
| Single Unit, Detached | 136 | 96.5% |
| Single Unit, Attached | 0 | 0.0% |
| 2 Unit Apartments | 0 | 0.0% |
| 3 or 4 Unit Apartments | 5 | 3.5% |
| 5 to 9 Unit Apartments | 0 | 0.0% |
| 10 or more Apartments | 0 | 0.0% |
| Mobile Home / Other | 0 | 0.0% |
| Total | 141 | 100.0% |
Housing Structures by Occupancy in Colton
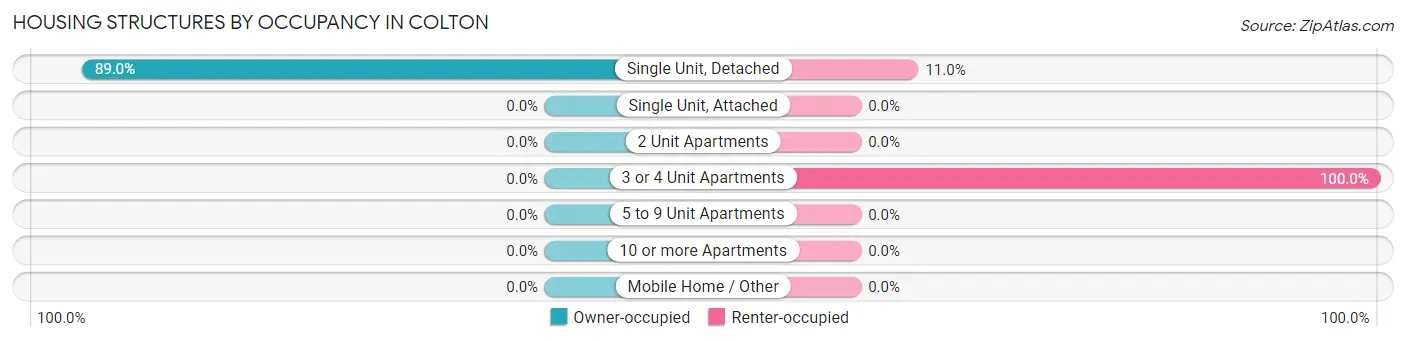
| Structure Type | Owner-occupied | Renter-occupied |
| Single Unit, Detached | 121 (89.0%) | 15 (11.0%) |
| Single Unit, Attached | 0 (0.0%) | 0 (0.0%) |
| 2 Unit Apartments | 0 (0.0%) | 0 (0.0%) |
| 3 or 4 Unit Apartments | 0 (0.0%) | 5 (100.0%) |
| 5 to 9 Unit Apartments | 0 (0.0%) | 0 (0.0%) |
| 10 or more Apartments | 0 (0.0%) | 0 (0.0%) |
| Mobile Home / Other | 0 (0.0%) | 0 (0.0%) |
| Total | 121 (85.8%) | 20 (14.2%) |
Housing Structures by Number of Rooms in Colton
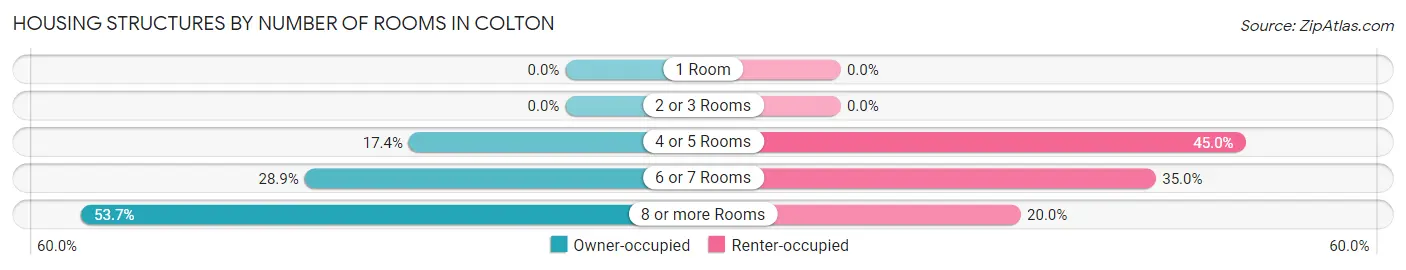
| Number of Rooms | Owner-occupied | Renter-occupied |
| 1 Room | 0 (0.0%) | 0 (0.0%) |
| 2 or 3 Rooms | 0 (0.0%) | 0 (0.0%) |
| 4 or 5 Rooms | 21 (17.4%) | 9 (45.0%) |
| 6 or 7 Rooms | 35 (28.9%) | 7 (35.0%) |
| 8 or more Rooms | 65 (53.7%) | 4 (20.0%) |
| Total | 121 (100.0%) | 20 (100.0%) |
Housing Structure by Heating Type in Colton
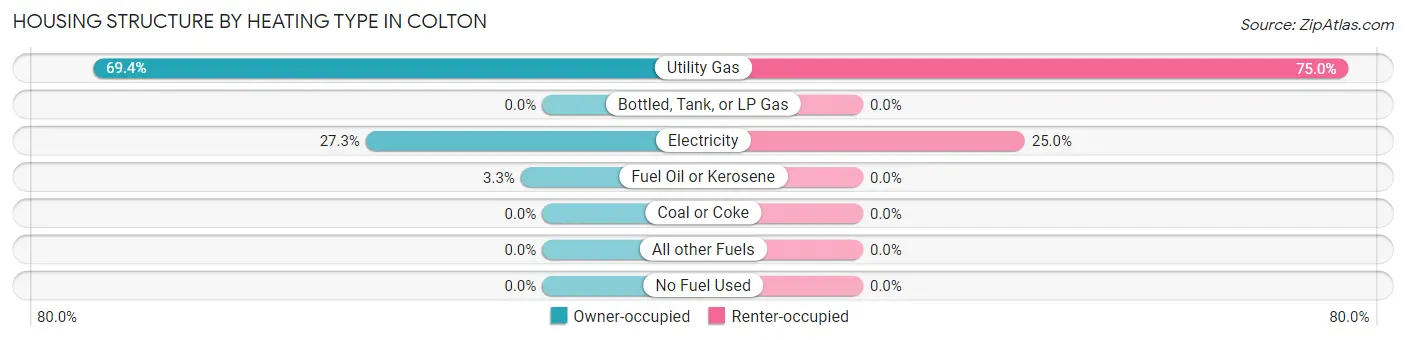
| Heating Type | Owner-occupied | Renter-occupied |
| Utility Gas | 84 (69.4%) | 15 (75.0%) |
| Bottled, Tank, or LP Gas | 0 (0.0%) | 0 (0.0%) |
| Electricity | 33 (27.3%) | 5 (25.0%) |
| Fuel Oil or Kerosene | 4 (3.3%) | 0 (0.0%) |
| Coal or Coke | 0 (0.0%) | 0 (0.0%) |
| All other Fuels | 0 (0.0%) | 0 (0.0%) |
| No Fuel Used | 0 (0.0%) | 0 (0.0%) |
| Total | 121 (100.0%) | 20 (100.0%) |
Household Vehicle Usage in Colton
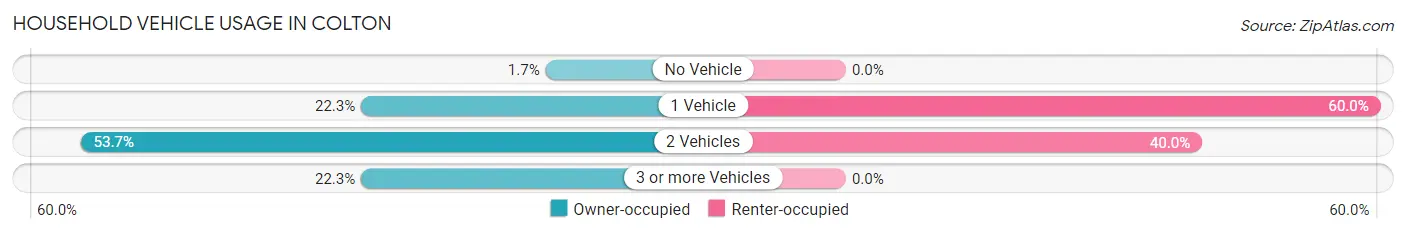
| Vehicles per Household | Owner-occupied | Renter-occupied |
| No Vehicle | 2 (1.7%) | 0 (0.0%) |
| 1 Vehicle | 27 (22.3%) | 12 (60.0%) |
| 2 Vehicles | 65 (53.7%) | 8 (40.0%) |
| 3 or more Vehicles | 27 (22.3%) | 0 (0.0%) |
| Total | 121 (100.0%) | 20 (100.0%) |
Real Estate & Mortgages in Colton
Real Estate and Mortgage Overview in Colton
| Characteristic | Without Mortgage | With Mortgage |
| Housing Units | 55 | 66 |
| Median Property Value | $239,000 | $319,200 |
| Median Household Income | $49,464 | $19 |
| Monthly Housing Costs | $485 | $1 |
| Real Estate Taxes | $2,075 | $0 |
Property Value by Mortgage Status in Colton
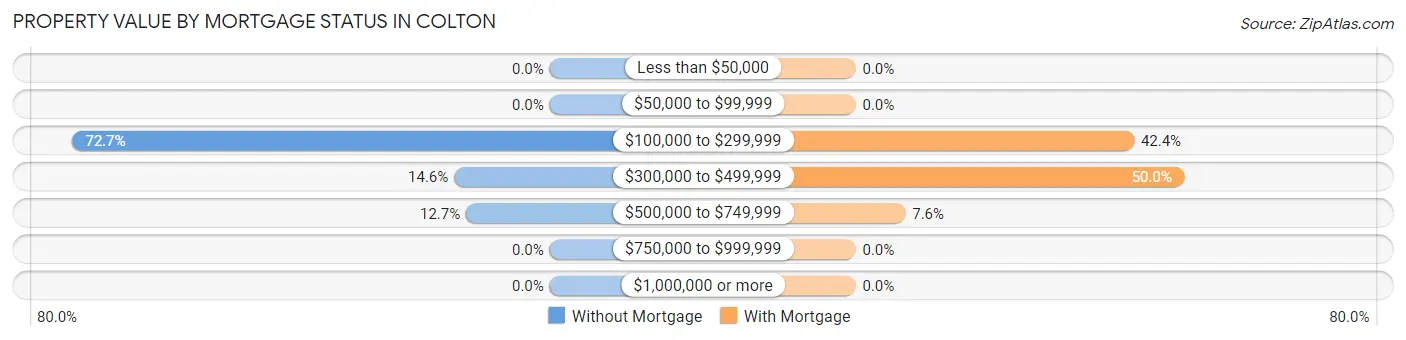
| Property Value | Without Mortgage | With Mortgage |
| Less than $50,000 | 0 (0.0%) | 0 (0.0%) |
| $50,000 to $99,999 | 0 (0.0%) | 0 (0.0%) |
| $100,000 to $299,999 | 40 (72.7%) | 28 (42.4%) |
| $300,000 to $499,999 | 8 (14.5%) | 33 (50.0%) |
| $500,000 to $749,999 | 7 (12.7%) | 5 (7.6%) |
| $750,000 to $999,999 | 0 (0.0%) | 0 (0.0%) |
| $1,000,000 or more | 0 (0.0%) | 0 (0.0%) |
| Total | 55 (100.0%) | 66 (100.0%) |
Household Income by Mortgage Status in Colton
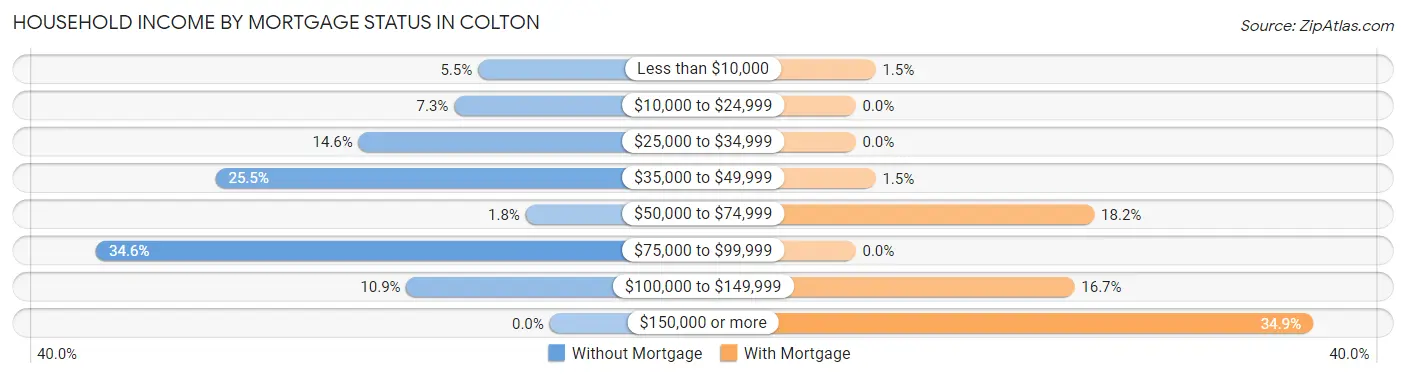
| Household Income | Without Mortgage | With Mortgage |
| Less than $10,000 | 3 (5.4%) | 1 (1.5%) |
| $10,000 to $24,999 | 4 (7.3%) | 0 (0.0%) |
| $25,000 to $34,999 | 8 (14.5%) | 0 (0.0%) |
| $35,000 to $49,999 | 14 (25.5%) | 1 (1.5%) |
| $50,000 to $74,999 | 1 (1.8%) | 12 (18.2%) |
| $75,000 to $99,999 | 19 (34.5%) | 0 (0.0%) |
| $100,000 to $149,999 | 6 (10.9%) | 11 (16.7%) |
| $150,000 or more | 0 (0.0%) | 23 (34.8%) |
| Total | 55 (100.0%) | 66 (100.0%) |
Property Value to Household Income Ratio in Colton
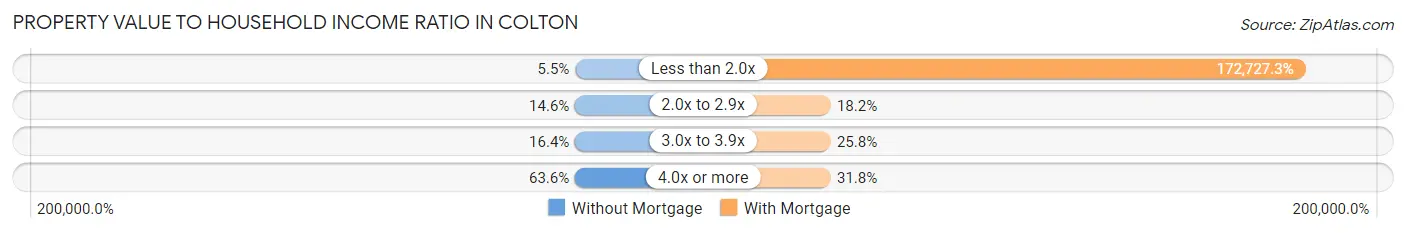
| Value-to-Income Ratio | Without Mortgage | With Mortgage |
| Less than 2.0x | 3 (5.4%) | 114,000 (172,727.3%) |
| 2.0x to 2.9x | 8 (14.5%) | 12 (18.2%) |
| 3.0x to 3.9x | 9 (16.4%) | 17 (25.8%) |
| 4.0x or more | 35 (63.6%) | 21 (31.8%) |
| Total | 55 (100.0%) | 66 (100.0%) |
Real Estate Taxes by Mortgage Status in Colton
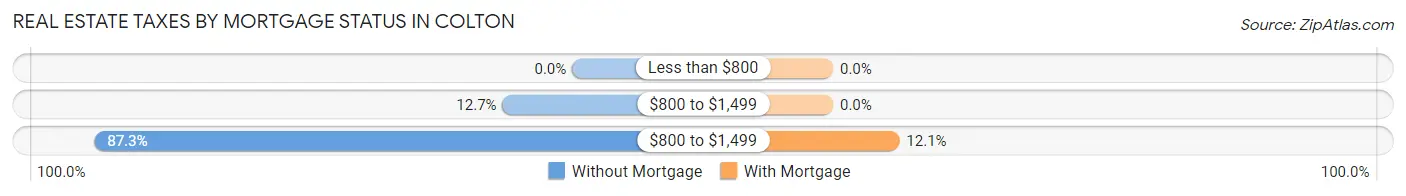
| Property Taxes | Without Mortgage | With Mortgage |
| Less than $800 | 0 (0.0%) | 0 (0.0%) |
| $800 to $1,499 | 7 (12.7%) | 0 (0.0%) |
| $800 to $1,499 | 48 (87.3%) | 8 (12.1%) |
| Total | 55 (100.0%) | 66 (100.0%) |
Health & Disability in Colton
Health Insurance Coverage by Age in Colton
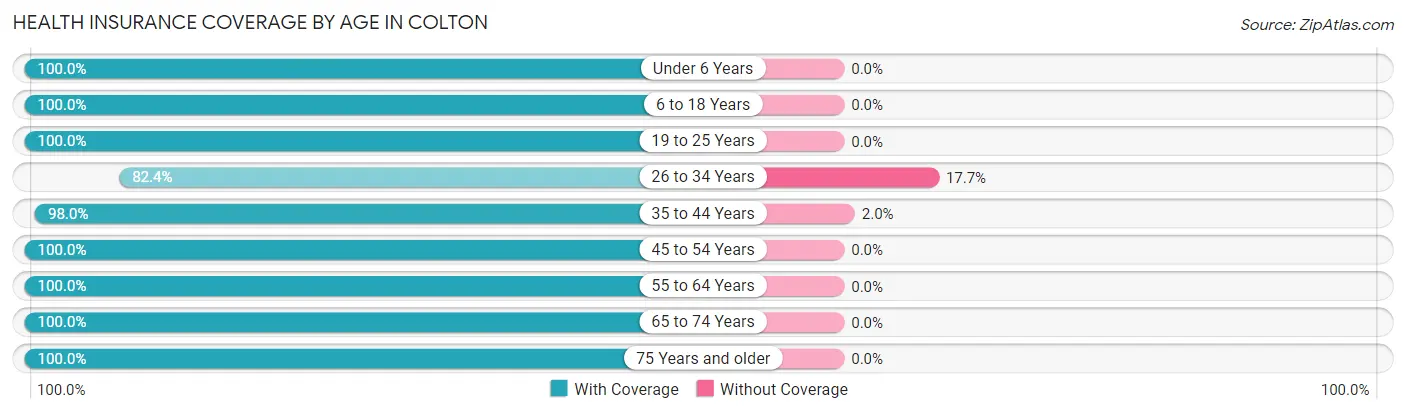
| Age Bracket | With Coverage | Without Coverage |
| Under 6 Years | 22 (100.0%) | 0 (0.0%) |
| 6 to 18 Years | 72 (100.0%) | 0 (0.0%) |
| 19 to 25 Years | 1 (100.0%) | 0 (0.0%) |
| 26 to 34 Years | 28 (82.4%) | 6 (17.6%) |
| 35 to 44 Years | 50 (98.0%) | 1 (2.0%) |
| 45 to 54 Years | 31 (100.0%) | 0 (0.0%) |
| 55 to 64 Years | 46 (100.0%) | 0 (0.0%) |
| 65 to 74 Years | 50 (100.0%) | 0 (0.0%) |
| 75 Years and older | 33 (100.0%) | 0 (0.0%) |
| Total | 333 (97.9%) | 7 (2.1%) |
Health Insurance Coverage by Citizenship Status in Colton
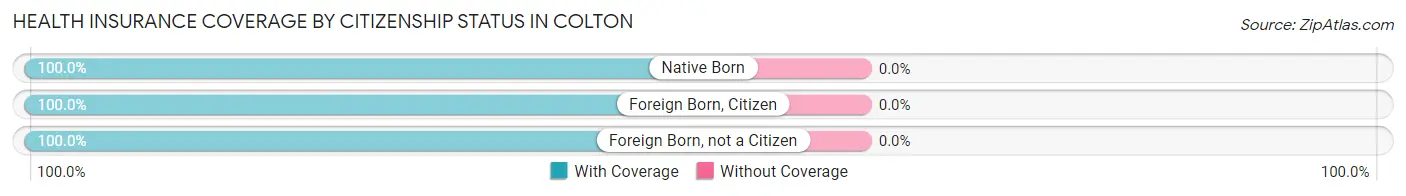
| Citizenship Status | With Coverage | Without Coverage |
| Native Born | 22 (100.0%) | 0 (0.0%) |
| Foreign Born, Citizen | 72 (100.0%) | 0 (0.0%) |
| Foreign Born, not a Citizen | 1 (100.0%) | 0 (0.0%) |
Health Insurance Coverage by Household Income in Colton
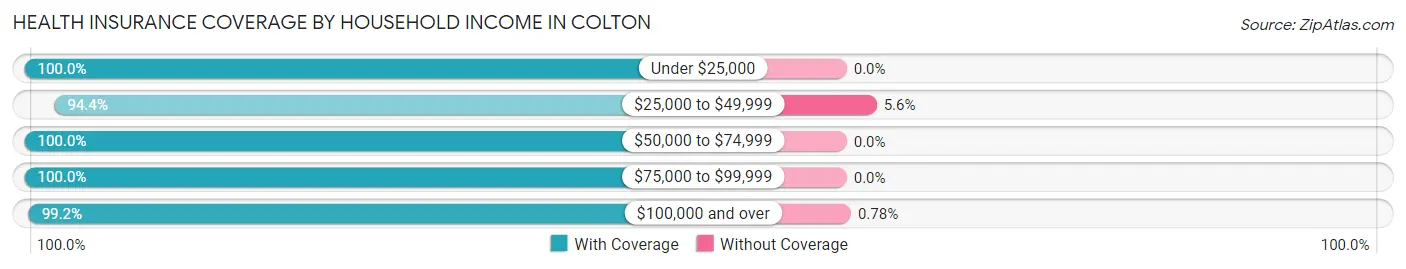
| Household Income | With Coverage | Without Coverage |
| Under $25,000 | 14 (100.0%) | 0 (0.0%) |
| $25,000 to $49,999 | 101 (94.4%) | 6 (5.6%) |
| $50,000 to $74,999 | 2 (100.0%) | 0 (0.0%) |
| $75,000 to $99,999 | 88 (100.0%) | 0 (0.0%) |
| $100,000 and over | 128 (99.2%) | 1 (0.8%) |
Public vs Private Health Insurance Coverage by Age in Colton
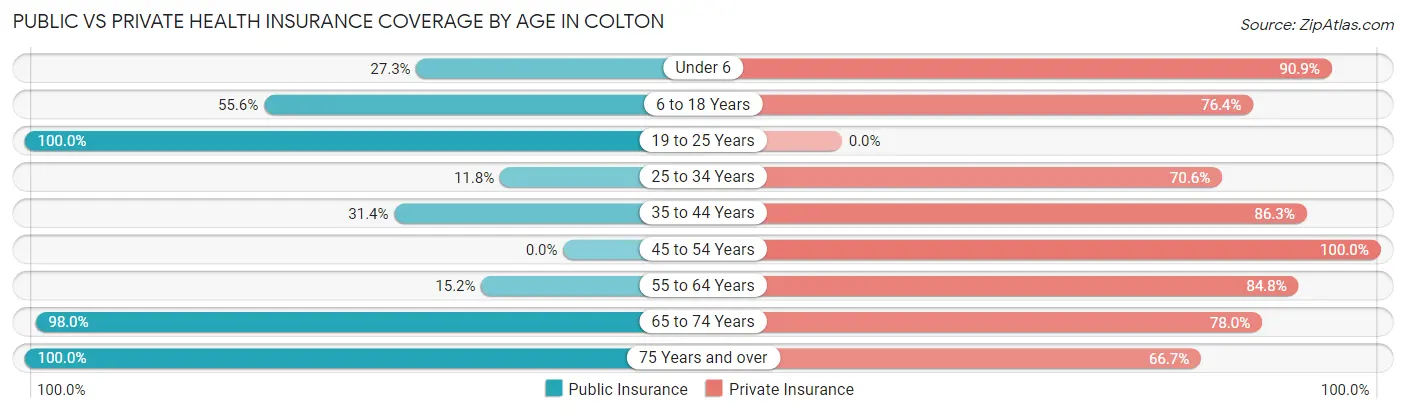
| Age Bracket | Public Insurance | Private Insurance |
| Under 6 | 6 (27.3%) | 20 (90.9%) |
| 6 to 18 Years | 40 (55.6%) | 55 (76.4%) |
| 19 to 25 Years | 1 (100.0%) | 0 (0.0%) |
| 25 to 34 Years | 4 (11.8%) | 24 (70.6%) |
| 35 to 44 Years | 16 (31.4%) | 44 (86.3%) |
| 45 to 54 Years | 0 (0.0%) | 31 (100.0%) |
| 55 to 64 Years | 7 (15.2%) | 39 (84.8%) |
| 65 to 74 Years | 49 (98.0%) | 39 (78.0%) |
| 75 Years and over | 33 (100.0%) | 22 (66.7%) |
| Total | 156 (45.9%) | 274 (80.6%) |
Disability Status by Sex by Age in Colton
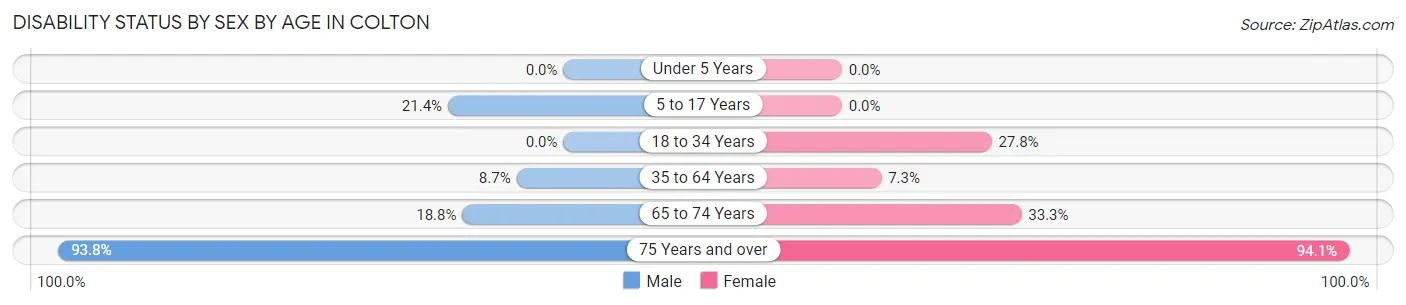
| Age Bracket | Male | Female |
| Under 5 Years | 0 (0.0%) | 0 (0.0%) |
| 5 to 17 Years | 6 (21.4%) | 0 (0.0%) |
| 18 to 34 Years | 0 (0.0%) | 5 (27.8%) |
| 35 to 64 Years | 4 (8.7%) | 6 (7.3%) |
| 65 to 74 Years | 6 (18.8%) | 6 (33.3%) |
| 75 Years and over | 15 (93.8%) | 16 (94.1%) |
Disability Class by Sex by Age in Colton
Disability Class: Hearing Difficulty
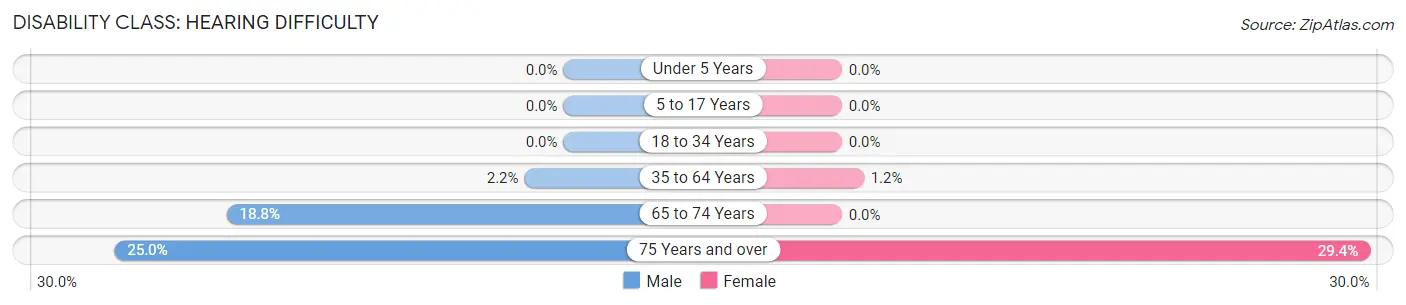
| Age Bracket | Male | Female |
| Under 5 Years | 0 (0.0%) | 0 (0.0%) |
| 5 to 17 Years | 0 (0.0%) | 0 (0.0%) |
| 18 to 34 Years | 0 (0.0%) | 0 (0.0%) |
| 35 to 64 Years | 1 (2.2%) | 1 (1.2%) |
| 65 to 74 Years | 6 (18.8%) | 0 (0.0%) |
| 75 Years and over | 4 (25.0%) | 5 (29.4%) |
Disability Class: Vision Difficulty
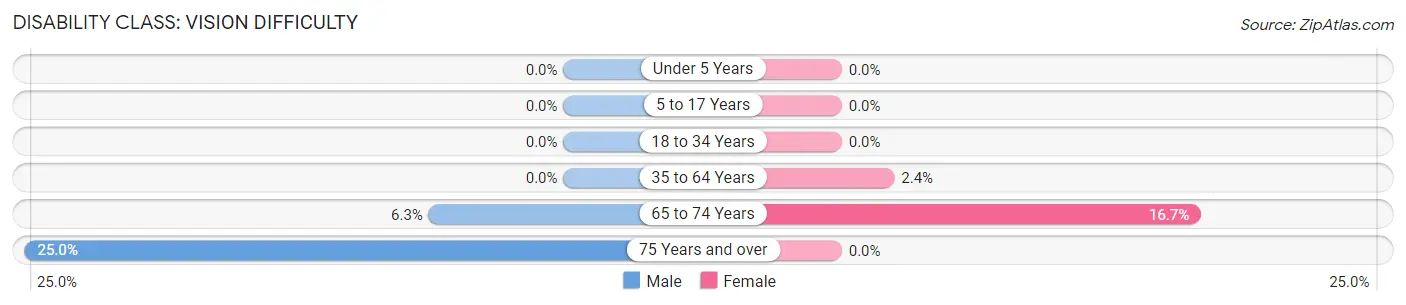
| Age Bracket | Male | Female |
| Under 5 Years | 0 (0.0%) | 0 (0.0%) |
| 5 to 17 Years | 0 (0.0%) | 0 (0.0%) |
| 18 to 34 Years | 0 (0.0%) | 0 (0.0%) |
| 35 to 64 Years | 0 (0.0%) | 2 (2.4%) |
| 65 to 74 Years | 2 (6.2%) | 3 (16.7%) |
| 75 Years and over | 4 (25.0%) | 0 (0.0%) |
Disability Class: Cognitive Difficulty
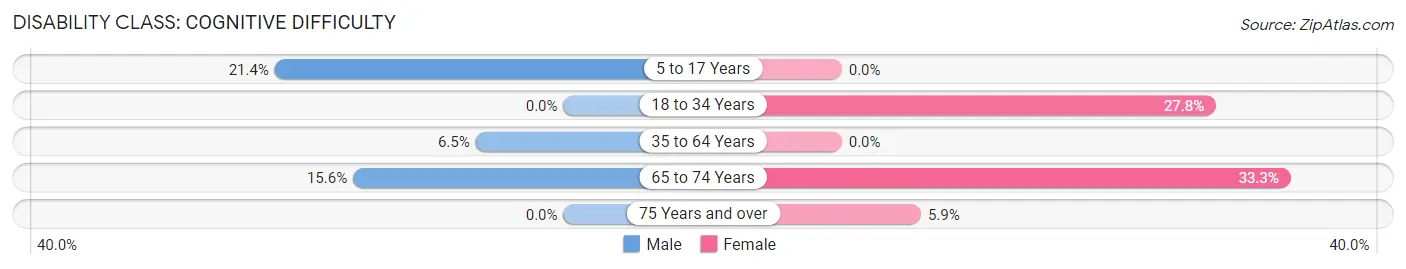
| Age Bracket | Male | Female |
| 5 to 17 Years | 6 (21.4%) | 0 (0.0%) |
| 18 to 34 Years | 0 (0.0%) | 5 (27.8%) |
| 35 to 64 Years | 3 (6.5%) | 0 (0.0%) |
| 65 to 74 Years | 5 (15.6%) | 6 (33.3%) |
| 75 Years and over | 0 (0.0%) | 1 (5.9%) |
Disability Class: Ambulatory Difficulty
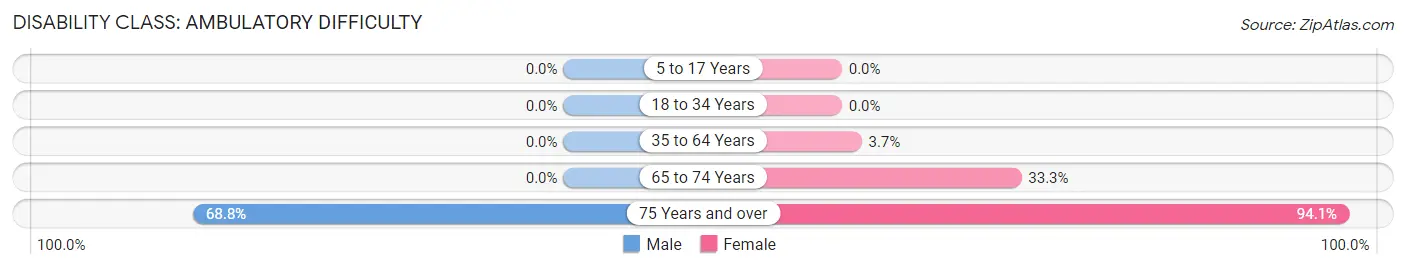
| Age Bracket | Male | Female |
| 5 to 17 Years | 0 (0.0%) | 0 (0.0%) |
| 18 to 34 Years | 0 (0.0%) | 0 (0.0%) |
| 35 to 64 Years | 0 (0.0%) | 3 (3.7%) |
| 65 to 74 Years | 0 (0.0%) | 6 (33.3%) |
| 75 Years and over | 11 (68.8%) | 16 (94.1%) |
Disability Class: Self-Care Difficulty
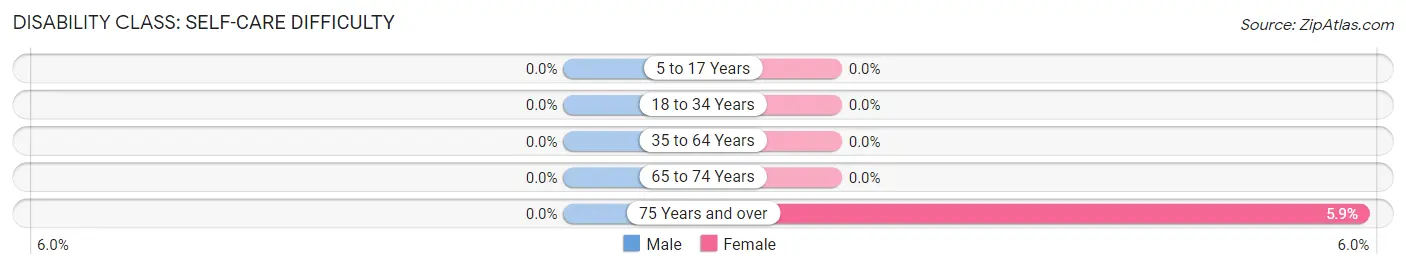
| Age Bracket | Male | Female |
| 5 to 17 Years | 0 (0.0%) | 0 (0.0%) |
| 18 to 34 Years | 0 (0.0%) | 0 (0.0%) |
| 35 to 64 Years | 0 (0.0%) | 0 (0.0%) |
| 65 to 74 Years | 0 (0.0%) | 0 (0.0%) |
| 75 Years and over | 0 (0.0%) | 1 (5.9%) |
Technology Access in Colton
Computing Device Access in Colton
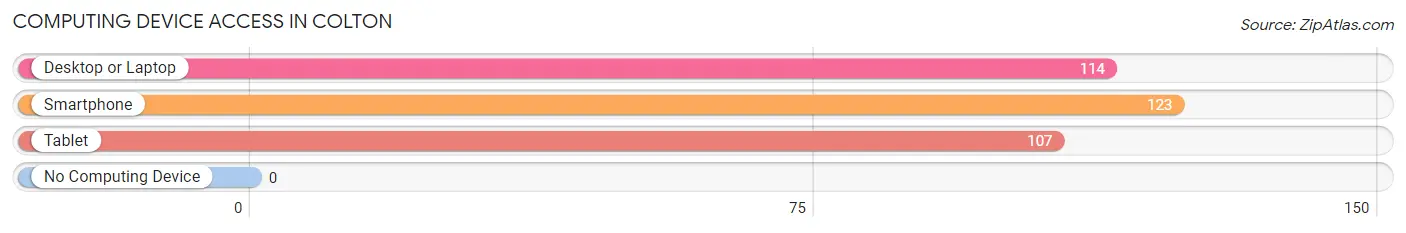
| Device Type | # Households | % Households |
| Desktop or Laptop | 114 | 80.8% |
| Smartphone | 123 | 87.2% |
| Tablet | 107 | 75.9% |
| No Computing Device | 0 | 0.0% |
| Total | 141 | 100.0% |
Internet Access in Colton
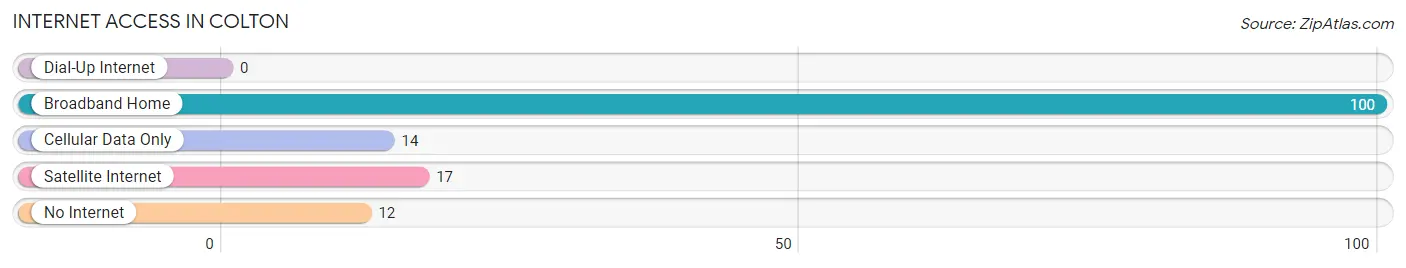
| Internet Type | # Households | % Households |
| Dial-Up Internet | 0 | 0.0% |
| Broadband Home | 100 | 70.9% |
| Cellular Data Only | 14 | 9.9% |
| Satellite Internet | 17 | 12.1% |
| No Internet | 12 | 8.5% |
| Total | 141 | 100.0% |
Colton Summary
Colton, Washington is a small town located in the southeastern corner of the state, about 25 miles south of Spokane. It is situated in the rolling hills of the Palouse region, and is surrounded by wheat fields and rolling hills. The town has a population of about 1,500 people, and is the county seat of Whitman County.
History
Colton was founded in 1883 by a group of settlers from the Midwest. The town was named after the Colton family, who were among the first settlers. The Coltons were originally from Ohio, and had moved to the area in search of a better life. The town was officially incorporated in 1891.
In the early days, Colton was a farming and ranching community. The town was also home to a number of small businesses, including a general store, a blacksmith shop, and a hotel. The town also had a school, which was built in 1891.
In the early 1900s, Colton began to experience a period of growth. The town was connected to the Spokane, Portland and Seattle Railway in 1906, which allowed for increased trade and commerce. The town also experienced a population boom, as many people moved to the area to take advantage of the new opportunities.
Geography
Colton is located in the southeastern corner of Washington, about 25 miles south of Spokane. The town is situated in the rolling hills of the Palouse region, and is surrounded by wheat fields and rolling hills. The town is located at an elevation of 1,890 feet above sea level.
The climate in Colton is generally mild, with hot summers and cold winters. The average annual temperature is around 50 degrees Fahrenheit. The town receives an average of 16 inches of precipitation per year, with most of it falling in the winter months.
Economy
The economy of Colton is largely based on agriculture. The town is surrounded by wheat fields, and many of the residents are involved in farming and ranching. The town also has a number of small businesses, including a general store, a blacksmith shop, and a hotel.
The town is also home to a number of manufacturing companies, including a furniture factory and a woodworking shop. The town also has a number of service-based businesses, including a bank, a post office, and a library.
Demographics
As of the 2010 census, the population of Colton was 1,500 people. The racial makeup of the town was 95.3% White, 0.7% African American, 0.7% Native American, 0.3% Asian, 0.3% from other races, and 2.0% from two or more races. Hispanic or Latino of any race were 1.3% of the population.
The median household income in Colton was $37,500, and the median family income was $45,000. The per capita income was $19,000. About 11.3% of the population was below the poverty line.
Colton is a small town with a rich history and a strong sense of community. The town is surrounded by beautiful scenery, and the economy is largely based on agriculture. The town has a diverse population, and is a great place to live and work.
Common Questions
What is Per Capita Income in Colton?
Per Capita income in Colton is $36,354.
What is the Median Family Income in Colton?
Median Family Income in Colton is $91,719.
What is the Median Household income in Colton?
Median Household Income in Colton is $81,250.
What is Income or Wage Gap in Colton?
Income or Wage Gap in Colton is 19.5%.
Women in Colton earn 80.5 cents for every dollar earned by a man.
What is Inequality or Gini Index in Colton?
Inequality or Gini Index in Colton is 0.37.
What is the Total Population of Colton?
Total Population of Colton is 340.
What is the Total Male Population of Colton?
Total Male Population of Colton is 149.
What is the Total Female Population of Colton?
Total Female Population of Colton is 191.
What is the Ratio of Males per 100 Females in Colton?
There are 78.01 Males per 100 Females in Colton.
What is the Ratio of Females per 100 Males in Colton?
There are 128.19 Females per 100 Males in Colton.
What is the Median Population Age in Colton?
Median Population Age in Colton is 41.5 Years.
What is the Average Family Size in Colton
Average Family Size in Colton is 2.8 People.
What is the Average Household Size in Colton
Average Household Size in Colton is 2.4 People.
How Large is the Labor Force in Colton?
There are 164 People in the Labor Forcein in Colton.
What is the Percentage of People in the Labor Force in Colton?
62.6% of People are in the Labor Force in Colton.
What is the Unemployment Rate in Colton?
Unemployment Rate in Colton is 3.0%.