Medical Lake, WA Map & Demographics
Medical Lake Map
Medical Lake Overview
$30,284
PER CAPITA INCOME
$100,393
AVG FAMILY INCOME
$73,456
AVG HOUSEHOLD INCOME
26.6%
WAGE / INCOME GAP [ % ]
73.4¢/ $1
WAGE / INCOME GAP [ $ ]
0.31
INEQUALITY / GINI INDEX
4,909
TOTAL POPULATION
2,569
MALE POPULATION
2,340
FEMALE POPULATION
109.79
MALES / 100 FEMALES
91.09
FEMALES / 100 MALES
36.1
MEDIAN AGE
3.1
AVG FAMILY SIZE
2.5
AVG HOUSEHOLD SIZE
2,123
LABOR FORCE [ PEOPLE ]
53.0%
PERCENT IN LABOR FORCE
4.5%
UNEMPLOYMENT RATE
Medical Lake Zip Codes
Medical Lake Area Codes
Income in Medical Lake
Income Overview in Medical Lake
Per Capita Income in Medical Lake is $30,284, while median incomes of families and households are $100,393 and $73,456 respectively.
| Characteristic | Number | Measure |
| Per Capita Income | 4,909 | $30,284 |
| Median Family Income | 1,142 | $100,393 |
| Mean Family Income | 1,142 | $99,711 |
| Median Household Income | 1,761 | $73,456 |
| Mean Household Income | 1,761 | $81,223 |
| Income Deficit | 1,142 | $0 |
| Wage / Income Gap (%) | 4,909 | 26.55% |
| Wage / Income Gap ($) | 4,909 | 73.45¢ per $1 |
| Gini / Inequality Index | 4,909 | 0.31 |
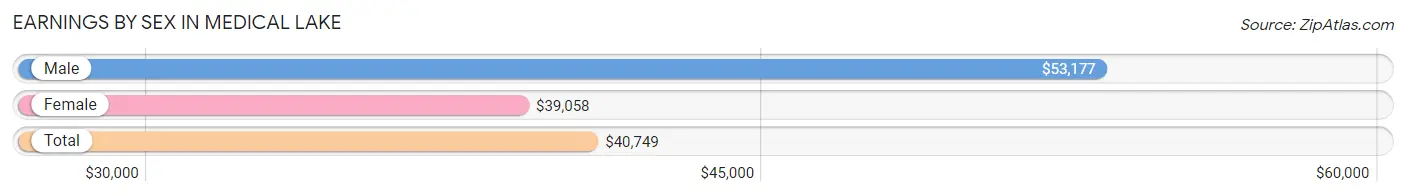
Earnings by Sex in Medical Lake
Average Earnings in Medical Lake are $40,749, $53,177 for men and $39,058 for women, a difference of 26.6%.
| Sex | Number | Average Earnings |
| Male | 1,147 (48.9%) | $53,177 |
| Female | 1,197 (51.1%) | $39,058 |
| Total | 2,344 (100.0%) | $40,749 |
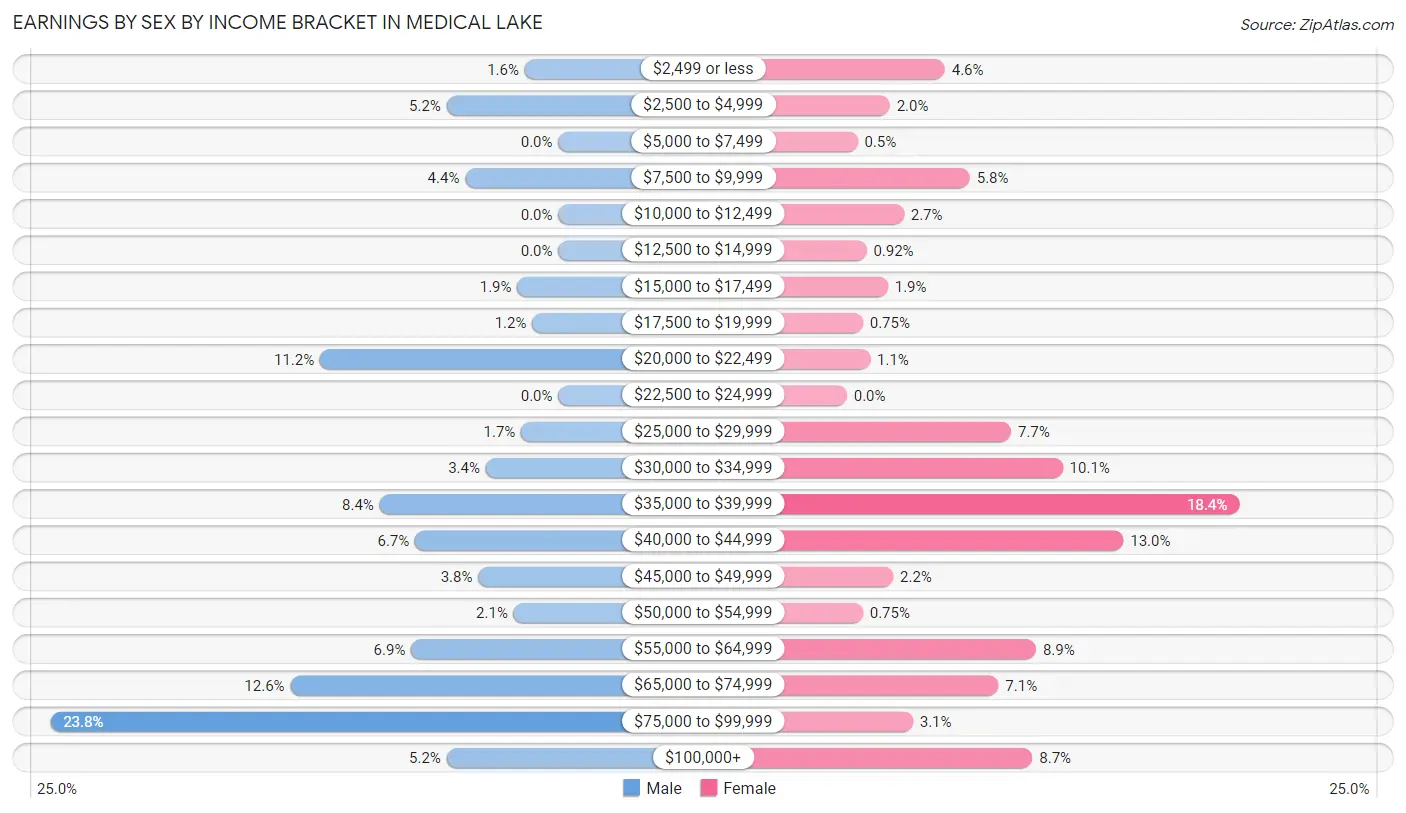
Earnings by Sex by Income Bracket in Medical Lake
The most common earnings brackets in Medical Lake are $75,000 to $99,999 for men (273 | 23.8%) and $35,000 to $39,999 for women (220 | 18.4%).
| Income | Male | Female |
| $2,499 or less | 18 (1.6%) | 55 (4.6%) |
| $2,500 to $4,999 | 60 (5.2%) | 24 (2.0%) |
| $5,000 to $7,499 | 0 (0.0%) | 6 (0.5%) |
| $7,500 to $9,999 | 50 (4.4%) | 69 (5.8%) |
| $10,000 to $12,499 | 0 (0.0%) | 32 (2.7%) |
| $12,500 to $14,999 | 0 (0.0%) | 11 (0.9%) |
| $15,000 to $17,499 | 22 (1.9%) | 23 (1.9%) |
| $17,500 to $19,999 | 14 (1.2%) | 9 (0.7%) |
| $20,000 to $22,499 | 128 (11.2%) | 13 (1.1%) |
| $22,500 to $24,999 | 0 (0.0%) | 0 (0.0%) |
| $25,000 to $29,999 | 20 (1.7%) | 92 (7.7%) |
| $30,000 to $34,999 | 39 (3.4%) | 121 (10.1%) |
| $35,000 to $39,999 | 96 (8.4%) | 220 (18.4%) |
| $40,000 to $44,999 | 77 (6.7%) | 155 (13.0%) |
| $45,000 to $49,999 | 43 (3.7%) | 26 (2.2%) |
| $50,000 to $54,999 | 24 (2.1%) | 9 (0.7%) |
| $55,000 to $64,999 | 79 (6.9%) | 106 (8.9%) |
| $65,000 to $74,999 | 144 (12.6%) | 85 (7.1%) |
| $75,000 to $99,999 | 273 (23.8%) | 37 (3.1%) |
| $100,000+ | 60 (5.2%) | 104 (8.7%) |
| Total | 1,147 (100.0%) | 1,197 (100.0%) |
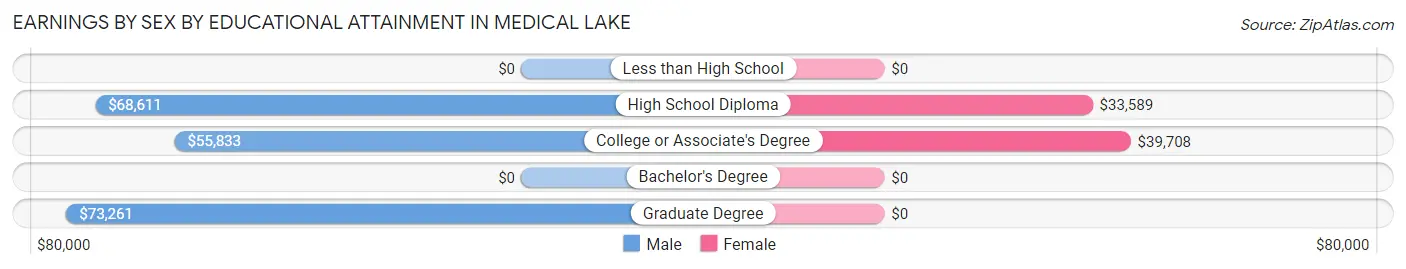
Earnings by Sex by Educational Attainment in Medical Lake
Average earnings in Medical Lake are $57,578 for men and $39,877 for women, a difference of 30.7%. Men with an educational attainment of graduate degree enjoy the highest average annual earnings of $73,261, while those with college or associate's degree education earn the least with $55,833. Women with an educational attainment of college or associate's degree earn the most with the average annual earnings of $39,708, while those with high school diploma education have the smallest earnings of $33,589.
| Educational Attainment | Male Income | Female Income |
| Less than High School | - | - |
| High School Diploma | $68,611 | $33,589 |
| College or Associate's Degree | $55,833 | $39,708 |
| Bachelor's Degree | - | - |
| Graduate Degree | $73,261 | $0 |
| Total | $57,578 | $39,877 |
Family Income in Medical Lake
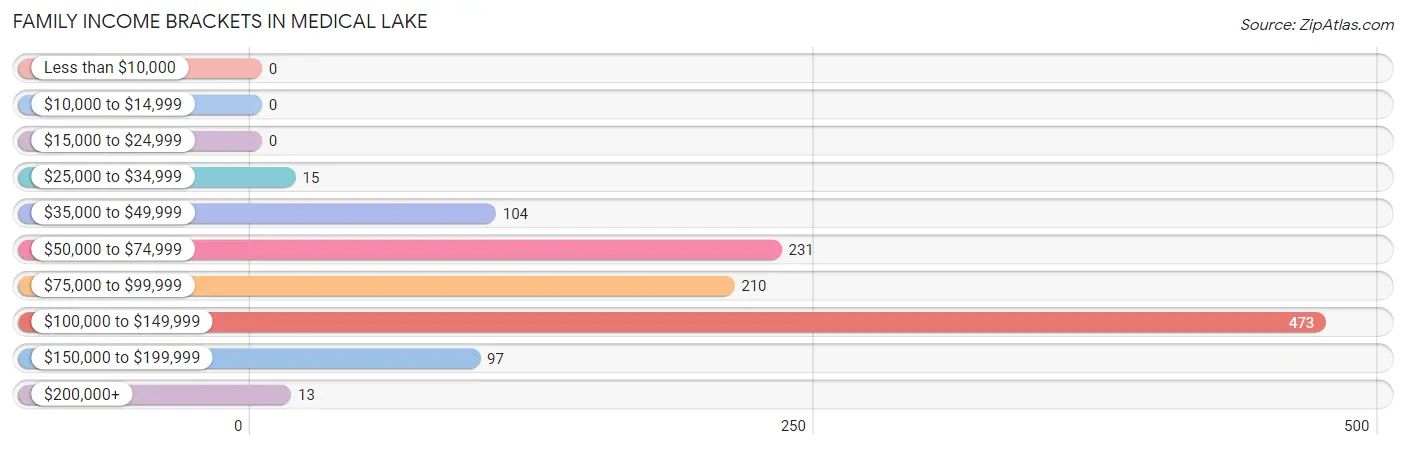
Family Income Brackets in Medical Lake
According to the Medical Lake family income data, there are 473 families falling into the $100,000 to $149,999 income range, which is the most common income bracket and makes up 41.4% of all families.
| Income Bracket | # Families | % Families |
| Less than $10,000 | 0 | 0.0% |
| $10,000 to $14,999 | 0 | 0.0% |
| $15,000 to $24,999 | 0 | 0.0% |
| $25,000 to $34,999 | 15 | 1.3% |
| $35,000 to $49,999 | 104 | 9.1% |
| $50,000 to $74,999 | 231 | 20.2% |
| $75,000 to $99,999 | 210 | 18.4% |
| $100,000 to $149,999 | 473 | 41.4% |
| $150,000 to $199,999 | 97 | 8.5% |
| $200,000+ | 13 | 1.1% |
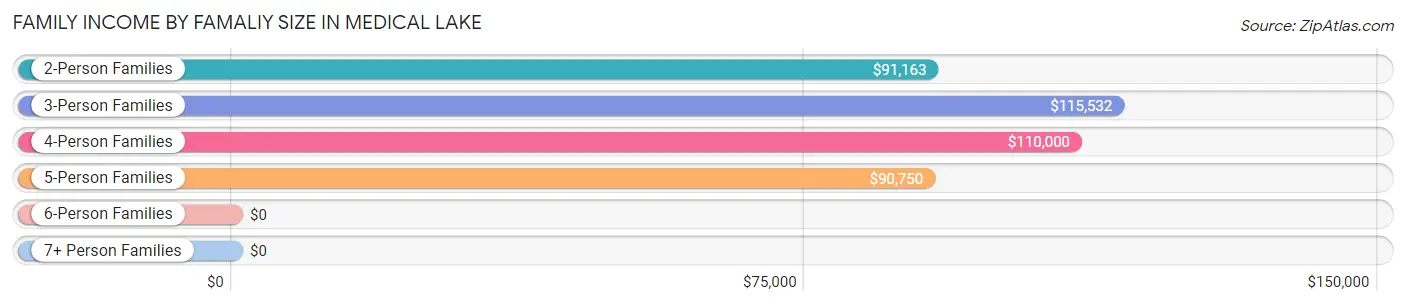
Family Income by Famaliy Size in Medical Lake
3-person families (185 | 16.2%) account for the highest median family income in Medical Lake with $115,532 per family, while 2-person families (518 | 45.4%) have the highest median income of $45,582 per family member.
| Income Bracket | # Families | Median Income |
| 2-Person Families | 518 (45.4%) | $91,163 |
| 3-Person Families | 185 (16.2%) | $115,532 |
| 4-Person Families | 298 (26.1%) | $110,000 |
| 5-Person Families | 99 (8.7%) | $90,750 |
| 6-Person Families | 42 (3.7%) | $0 |
| 7+ Person Families | 0 (0.0%) | $0 |
| Total | 1,142 (100.0%) | $100,393 |
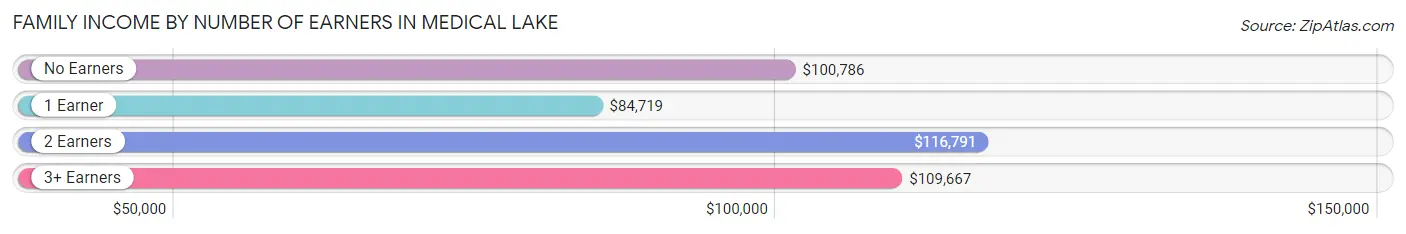
Family Income by Number of Earners in Medical Lake
The median family income in Medical Lake is $100,393, with families comprising 2 earners (578) having the highest median family income of $116,791, while families with 1 earner (412) have the lowest median family income of $84,719, accounting for 50.6% and 36.1% of families, respectively.
| Number of Earners | # Families | Median Income |
| No Earners | 116 (10.2%) | $100,786 |
| 1 Earner | 412 (36.1%) | $84,719 |
| 2 Earners | 578 (50.6%) | $116,791 |
| 3+ Earners | 36 (3.2%) | $109,667 |
| Total | 1,142 (100.0%) | $100,393 |
Household Income in Medical Lake
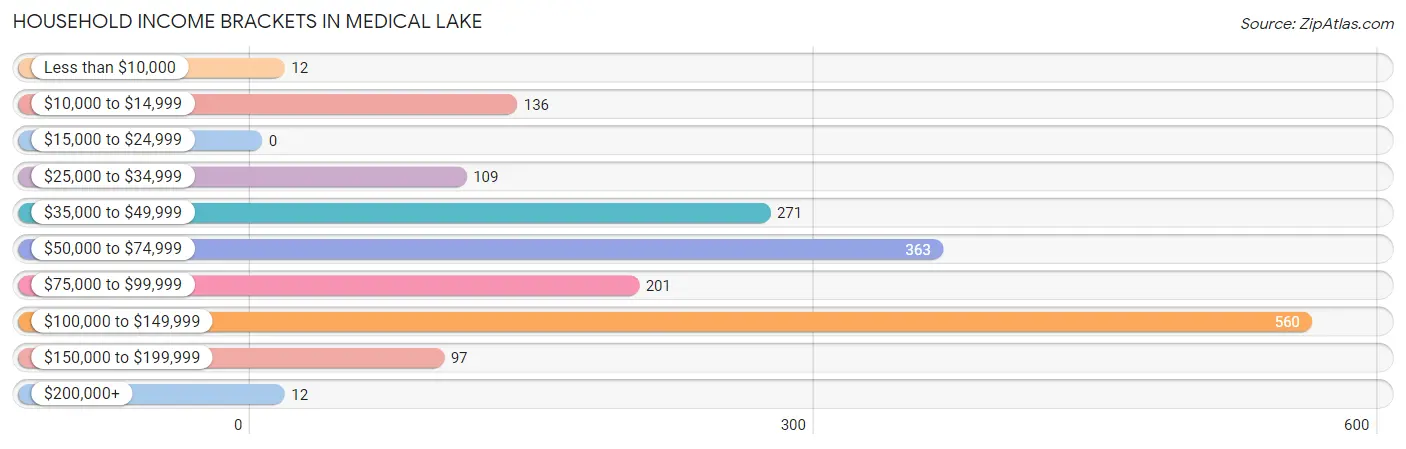
Household Income Brackets in Medical Lake
With 560 households falling in the category, the $100,000 to $149,999 income range is the most frequent in Medical Lake, accounting for 31.8% of all households.
| Income Bracket | # Households | % Households |
| Less than $10,000 | 12 | 0.7% |
| $10,000 to $14,999 | 136 | 7.7% |
| $15,000 to $24,999 | 0 | 0.0% |
| $25,000 to $34,999 | 109 | 6.2% |
| $35,000 to $49,999 | 271 | 15.4% |
| $50,000 to $74,999 | 363 | 20.6% |
| $75,000 to $99,999 | 201 | 11.4% |
| $100,000 to $149,999 | 560 | 31.8% |
| $150,000 to $199,999 | 97 | 5.5% |
| $200,000+ | 12 | 0.7% |
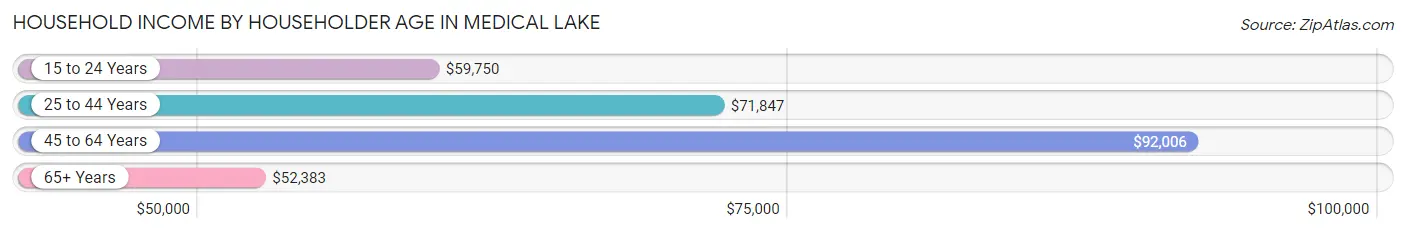
Household Income by Householder Age in Medical Lake
The median household income in Medical Lake is $73,456, with the highest median household income of $92,006 found in the 45 to 64 years age bracket for the primary householder. A total of 485 households (27.5%) fall into this category. Meanwhile, the 65+ years age bracket for the primary householder has the lowest median household income of $52,383, with 279 households (15.8%) in this group.
| Income Bracket | # Households | Median Income |
| 15 to 24 Years | 72 (4.1%) | $59,750 |
| 25 to 44 Years | 925 (52.5%) | $71,847 |
| 45 to 64 Years | 485 (27.5%) | $92,006 |
| 65+ Years | 279 (15.8%) | $52,383 |
| Total | 1,761 (100.0%) | $73,456 |
Poverty in Medical Lake
Income Below Poverty by Sex and Age in Medical Lake
With 2.6% poverty level for males and 11.3% for females among the residents of Medical Lake, 65 to 74 year old males and 18 to 24 year old females are the most vulnerable to poverty, with 16 males (16.8%) and 83 females (48.8%) in their respective age groups living below the poverty level.
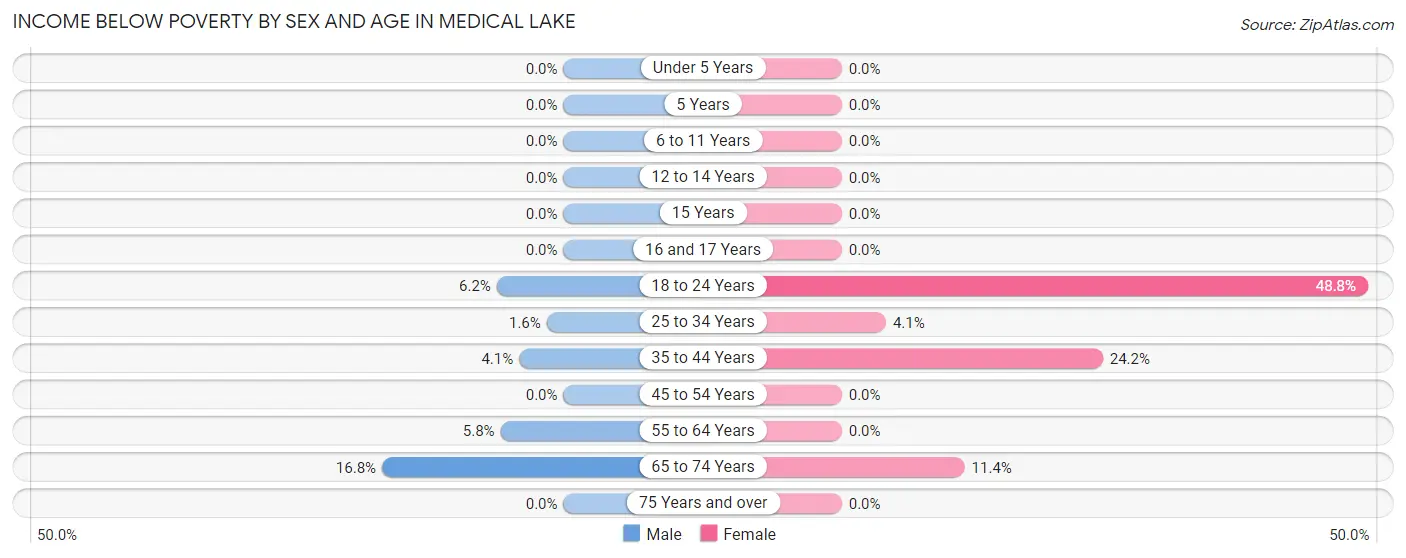
| Age Bracket | Male | Female |
| Under 5 Years | 0 (0.0%) | 0 (0.0%) |
| 5 Years | 0 (0.0%) | 0 (0.0%) |
| 6 to 11 Years | 0 (0.0%) | 0 (0.0%) |
| 12 to 14 Years | 0 (0.0%) | 0 (0.0%) |
| 15 Years | 0 (0.0%) | 0 (0.0%) |
| 16 and 17 Years | 0 (0.0%) | 0 (0.0%) |
| 18 to 24 Years | 7 (6.2%) | 83 (48.8%) |
| 25 to 34 Years | 7 (1.5%) | 15 (4.1%) |
| 35 to 44 Years | 12 (4.1%) | 132 (24.2%) |
| 45 to 54 Years | 0 (0.0%) | 0 (0.0%) |
| 55 to 64 Years | 17 (5.8%) | 0 (0.0%) |
| 65 to 74 Years | 16 (16.8%) | 13 (11.4%) |
| 75 Years and over | 0 (0.0%) | 0 (0.0%) |
| Total | 59 (2.6%) | 243 (11.3%) |
Income Above Poverty by Sex and Age in Medical Lake
According to the poverty statistics in Medical Lake, males aged under 5 years and females aged under 5 years are the age groups that are most secure financially, with 100.0% of males and 100.0% of females in these age groups living above the poverty line.
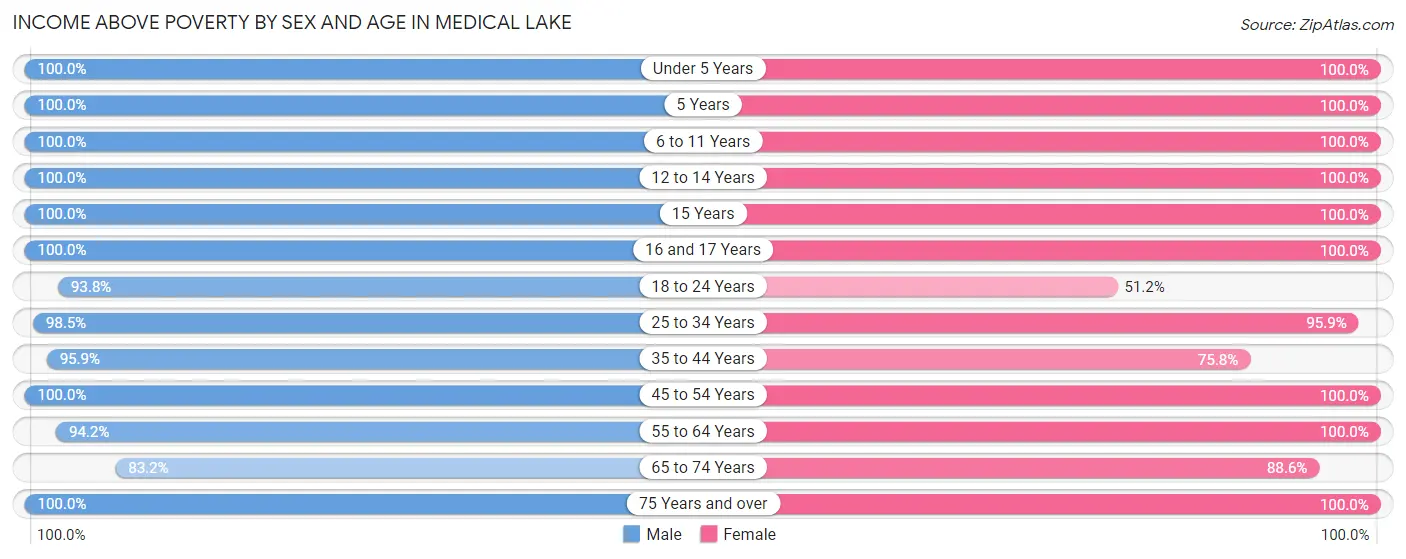
| Age Bracket | Male | Female |
| Under 5 Years | 80 (100.0%) | 100 (100.0%) |
| 5 Years | 37 (100.0%) | 11 (100.0%) |
| 6 to 11 Years | 180 (100.0%) | 137 (100.0%) |
| 12 to 14 Years | 192 (100.0%) | 50 (100.0%) |
| 15 Years | 85 (100.0%) | 29 (100.0%) |
| 16 and 17 Years | 122 (100.0%) | 94 (100.0%) |
| 18 to 24 Years | 106 (93.8%) | 87 (51.2%) |
| 25 to 34 Years | 446 (98.5%) | 351 (95.9%) |
| 35 to 44 Years | 280 (95.9%) | 413 (75.8%) |
| 45 to 54 Years | 175 (100.0%) | 206 (100.0%) |
| 55 to 64 Years | 274 (94.2%) | 188 (100.0%) |
| 65 to 74 Years | 79 (83.2%) | 101 (88.6%) |
| 75 Years and over | 145 (100.0%) | 137 (100.0%) |
| Total | 2,201 (97.4%) | 1,904 (88.7%) |
Income Below Poverty Among Married-Couple Families in Medical Lake
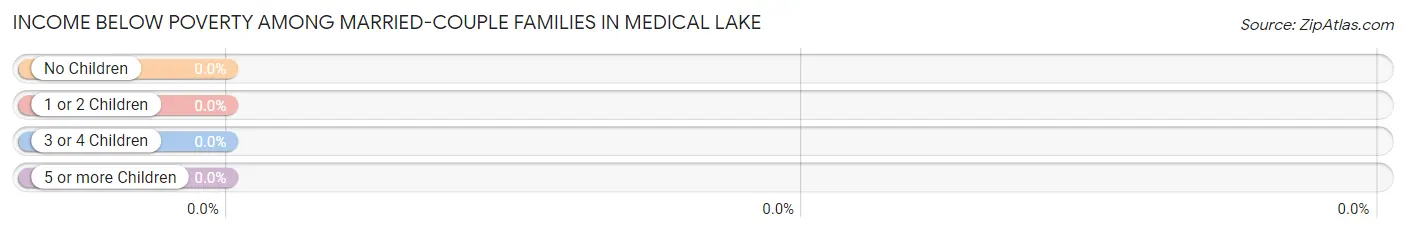
| Children | Above Poverty | Below Poverty |
| No Children | 535 (100.0%) | 0 (0.0%) |
| 1 or 2 Children | 334 (100.0%) | 0 (0.0%) |
| 3 or 4 Children | 99 (100.0%) | 0 (0.0%) |
| 5 or more Children | 0 (0.0%) | 0 (0.0%) |
| Total | 968 (100.0%) | 0 (0.0%) |
Income Below Poverty Among Single-Parent Households in Medical Lake
| Children | Single Father | Single Mother |
| No Children | 0 (0.0%) | 0 (0.0%) |
| 1 or 2 Children | 0 (0.0%) | 0 (0.0%) |
| 3 or 4 Children | 0 (0.0%) | 0 (0.0%) |
| 5 or more Children | 0 (0.0%) | 0 (0.0%) |
| Total | 0 (0.0%) | 0 (0.0%) |
Income Below Poverty Among Married-Couple vs Single-Parent Households in Medical Lake
| Children | Married-Couple Families | Single-Parent Households |
| No Children | 0 (0.0%) | 0 (0.0%) |
| 1 or 2 Children | 0 (0.0%) | 0 (0.0%) |
| 3 or 4 Children | 0 (0.0%) | 0 (0.0%) |
| 5 or more Children | 0 (0.0%) | 0 (0.0%) |
| Total | 0 (0.0%) | 0 (0.0%) |
Race in Medical Lake
The most populous races in Medical Lake are White / Caucasian (4,300 | 87.6%), Some other Race (335 | 6.8%), and Hispanic or Latino (278 | 5.7%).
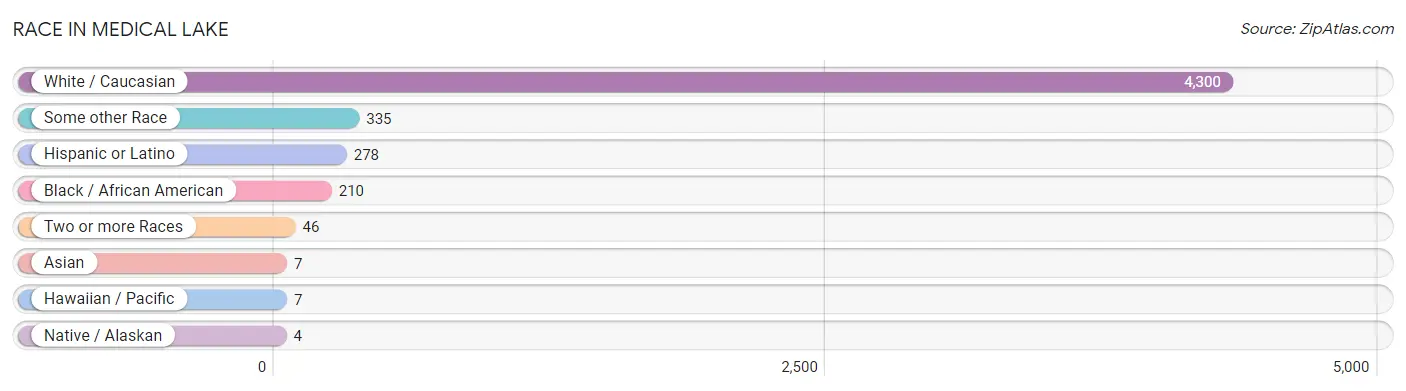
| Race | # Population | % Population |
| Asian | 7 | 0.1% |
| Black / African American | 210 | 4.3% |
| Hawaiian / Pacific | 7 | 0.1% |
| Hispanic or Latino | 278 | 5.7% |
| Native / Alaskan | 4 | 0.1% |
| White / Caucasian | 4,300 | 87.6% |
| Two or more Races | 46 | 0.9% |
| Some other Race | 335 | 6.8% |
| Total | 4,909 | 100.0% |
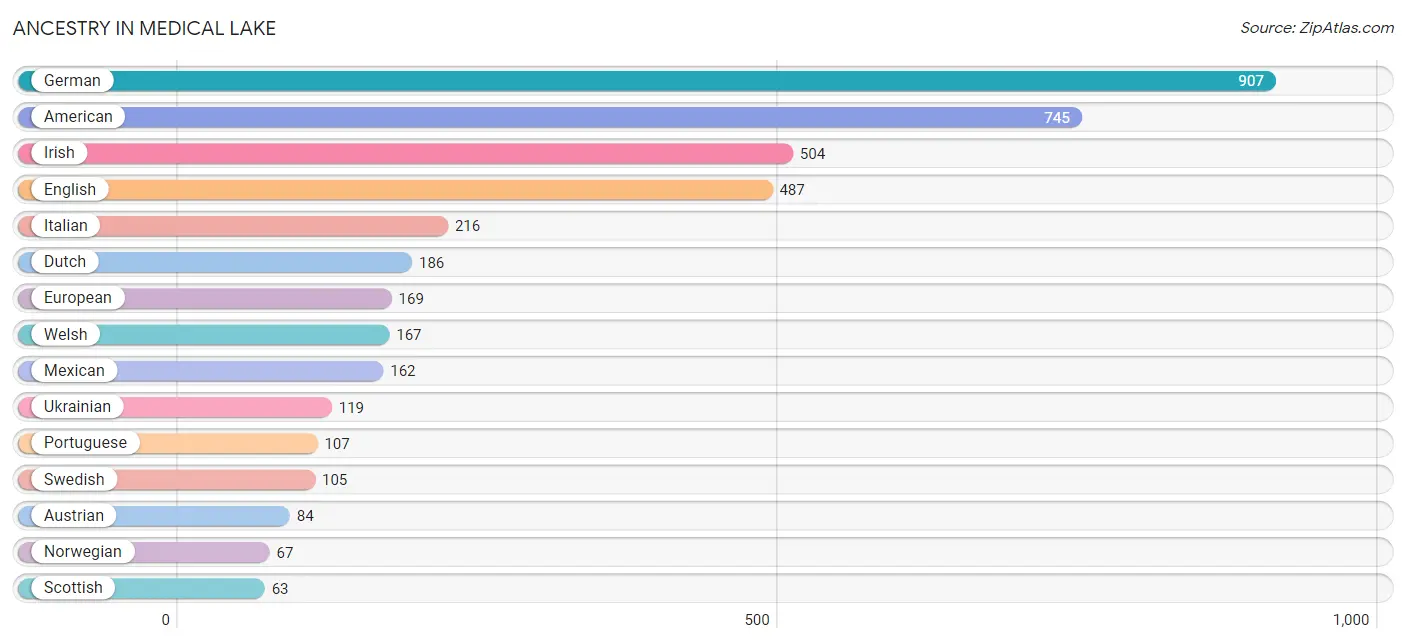
Ancestry in Medical Lake
The most populous ancestries reported in Medical Lake are German (907 | 18.5%), American (745 | 15.2%), Irish (504 | 10.3%), English (487 | 9.9%), and Italian (216 | 4.4%), together accounting for 58.3% of all Medical Lake residents.
| Ancestry | # Population | % Population |
| American | 745 | 15.2% |
| Austrian | 84 | 1.7% |
| British | 52 | 1.1% |
| Burmese | 7 | 0.1% |
| Canadian | 13 | 0.3% |
| Central American | 7 | 0.1% |
| Cherokee | 29 | 0.6% |
| Chilean | 2 | 0.0% |
| Cree | 5 | 0.1% |
| Czech | 43 | 0.9% |
| Danish | 5 | 0.1% |
| Dutch | 186 | 3.8% |
| Ecuadorian | 17 | 0.4% |
| English | 487 | 9.9% |
| European | 169 | 3.4% |
| Finnish | 7 | 0.1% |
| French | 44 | 0.9% |
| German | 907 | 18.5% |
| Greek | 12 | 0.2% |
| Guatemalan | 7 | 0.1% |
| Irish | 504 | 10.3% |
| Italian | 216 | 4.4% |
| Mexican | 162 | 3.3% |
| Nigerian | 8 | 0.2% |
| Northern European | 13 | 0.3% |
| Norwegian | 67 | 1.4% |
| Polish | 25 | 0.5% |
| Portuguese | 107 | 2.2% |
| Puerto Rican | 7 | 0.1% |
| Romanian | 18 | 0.4% |
| Russian | 49 | 1.0% |
| Samoan | 7 | 0.1% |
| Scotch-Irish | 47 | 1.0% |
| Scottish | 63 | 1.3% |
| Sioux | 5 | 0.1% |
| South American | 19 | 0.4% |
| Spaniard | 43 | 0.9% |
| Subsaharan African | 8 | 0.2% |
| Swedish | 105 | 2.1% |
| Ukrainian | 119 | 2.4% |
| Welsh | 167 | 3.4% | View All 41 Rows |
Immigrants in Medical Lake
The most numerous immigrant groups reported in Medical Lake came from Latin America (92 | 1.9%), Eastern Europe (78 | 1.6%), Europe (78 | 1.6%), Central America (73 | 1.5%), and Mexico (73 | 1.5%), together accounting for 8.0% of all Medical Lake residents.
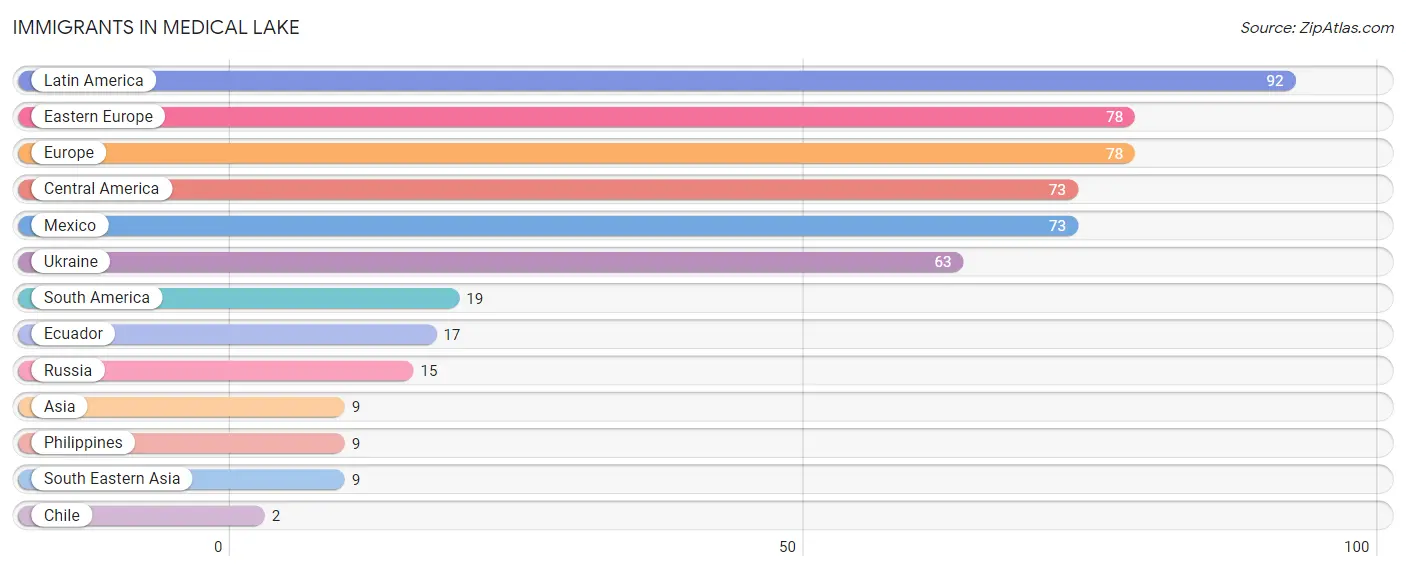
| Immigration Origin | # Population | % Population |
| Asia | 9 | 0.2% |
| Central America | 73 | 1.5% |
| Chile | 2 | 0.0% |
| Eastern Europe | 78 | 1.6% |
| Ecuador | 17 | 0.4% |
| Europe | 78 | 1.6% |
| Latin America | 92 | 1.9% |
| Mexico | 73 | 1.5% |
| Philippines | 9 | 0.2% |
| Russia | 15 | 0.3% |
| South America | 19 | 0.4% |
| South Eastern Asia | 9 | 0.2% |
| Ukraine | 63 | 1.3% | View All 13 Rows |
Sex and Age in Medical Lake
Sex and Age in Medical Lake
The most populous age groups in Medical Lake are 30 to 34 Years (344 | 13.4%) for men and 35 to 39 Years (308 | 13.2%) for women.
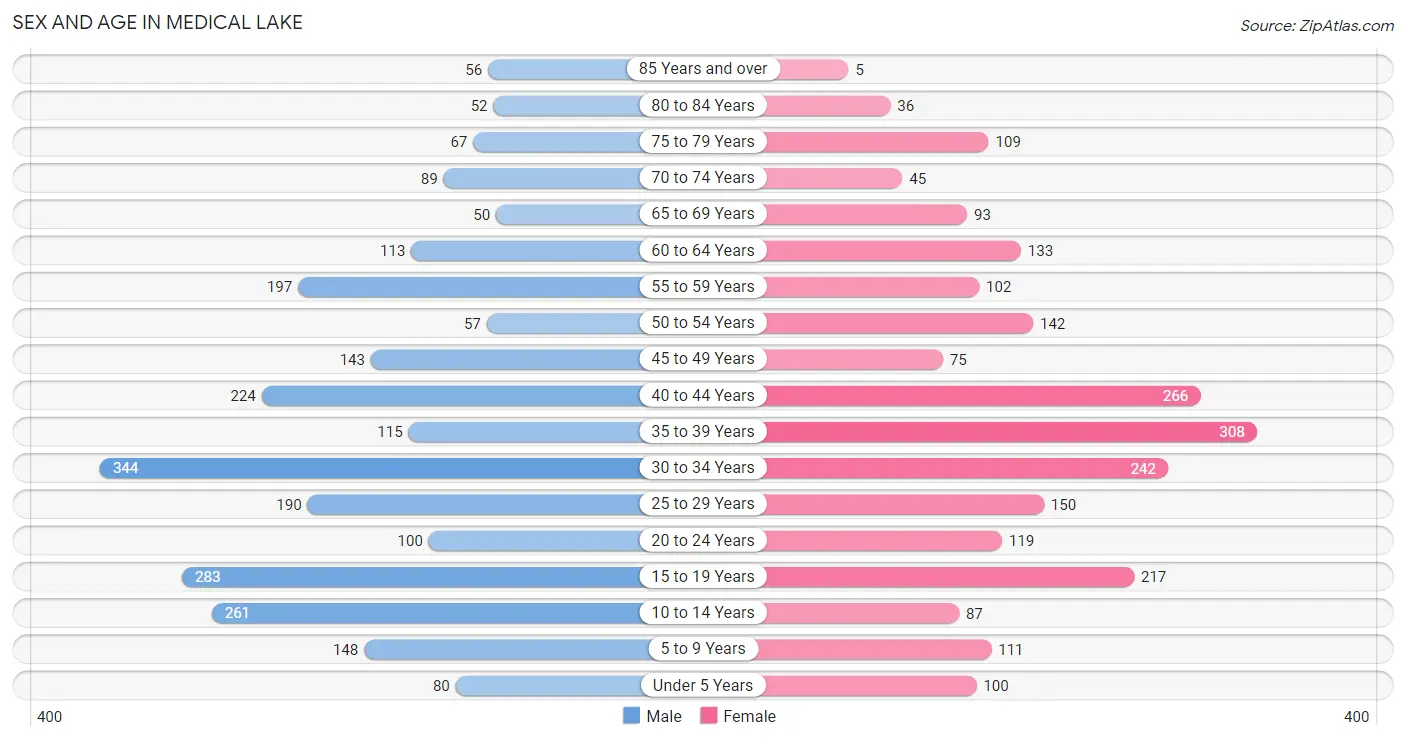
| Age Bracket | Male | Female |
| Under 5 Years | 80 (3.1%) | 100 (4.3%) |
| 5 to 9 Years | 148 (5.8%) | 111 (4.7%) |
| 10 to 14 Years | 261 (10.2%) | 87 (3.7%) |
| 15 to 19 Years | 283 (11.0%) | 217 (9.3%) |
| 20 to 24 Years | 100 (3.9%) | 119 (5.1%) |
| 25 to 29 Years | 190 (7.4%) | 150 (6.4%) |
| 30 to 34 Years | 344 (13.4%) | 242 (10.3%) |
| 35 to 39 Years | 115 (4.5%) | 308 (13.2%) |
| 40 to 44 Years | 224 (8.7%) | 266 (11.4%) |
| 45 to 49 Years | 143 (5.6%) | 75 (3.2%) |
| 50 to 54 Years | 57 (2.2%) | 142 (6.1%) |
| 55 to 59 Years | 197 (7.7%) | 102 (4.4%) |
| 60 to 64 Years | 113 (4.4%) | 133 (5.7%) |
| 65 to 69 Years | 50 (1.9%) | 93 (4.0%) |
| 70 to 74 Years | 89 (3.5%) | 45 (1.9%) |
| 75 to 79 Years | 67 (2.6%) | 109 (4.7%) |
| 80 to 84 Years | 52 (2.0%) | 36 (1.5%) |
| 85 Years and over | 56 (2.2%) | 5 (0.2%) |
| Total | 2,569 (100.0%) | 2,340 (100.0%) |
Families and Households in Medical Lake
Median Family Size in Medical Lake
The median family size in Medical Lake is 3.08 persons per family, with single male/father families (117 | 10.2%) accounting for the largest median family size of 3.26 persons per family. On the other hand, married-couple families (968 | 84.8%) represent the smallest median family size with 3.05 persons per family.
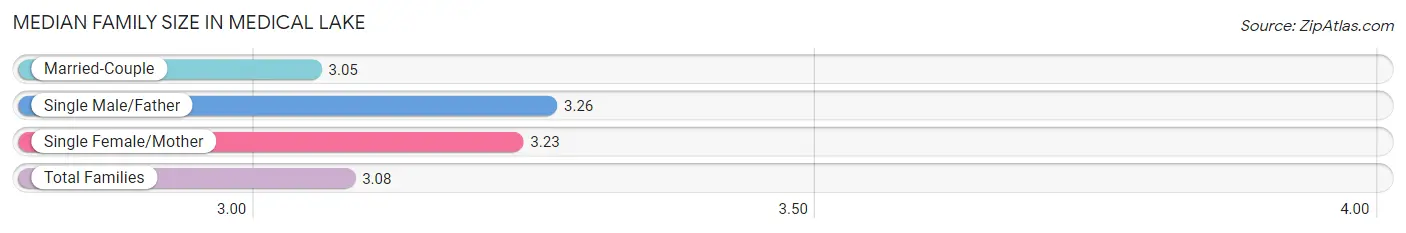
| Family Type | # Families | Family Size |
| Married-Couple | 968 (84.8%) | 3.05 |
| Single Male/Father | 117 (10.2%) | 3.26 |
| Single Female/Mother | 57 (5.0%) | 3.23 |
| Total Families | 1,142 (100.0%) | 3.08 |
Median Household Size in Medical Lake
The median household size in Medical Lake is 2.46 persons per household, with single male/father households (117 | 6.6%) accounting for the largest median household size of 3.72 persons per household. non-family households (619 | 35.1%) represent the smallest median household size with 1.19 persons per household.
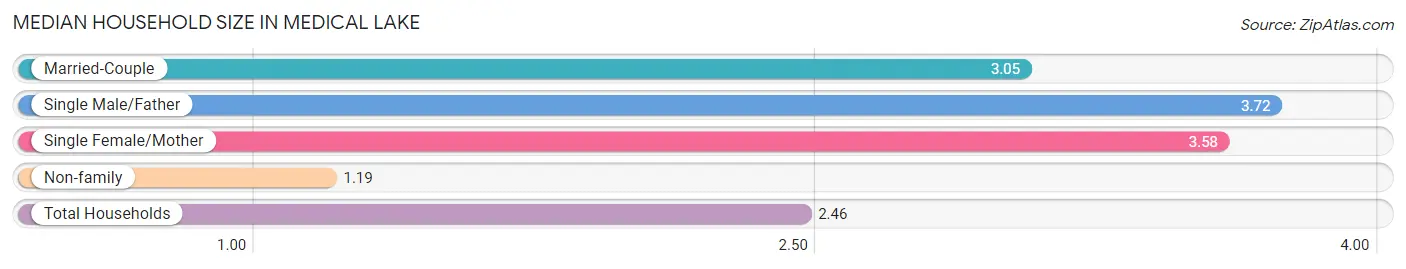
| Household Type | # Households | Household Size |
| Married-Couple | 968 (55.0%) | 3.05 |
| Single Male/Father | 117 (6.6%) | 3.72 |
| Single Female/Mother | 57 (3.2%) | 3.58 |
| Non-family | 619 (35.1%) | 1.19 |
| Total Households | 1,761 (100.0%) | 2.46 |
Household Size by Marriage Status in Medical Lake
Out of a total of 1,761 households in Medical Lake, 1,142 (64.8%) are family households, while 619 (35.1%) are nonfamily households. The most numerous type of family households are 2-person households, comprising 503, and the most common type of nonfamily households are 1-person households, comprising 494.
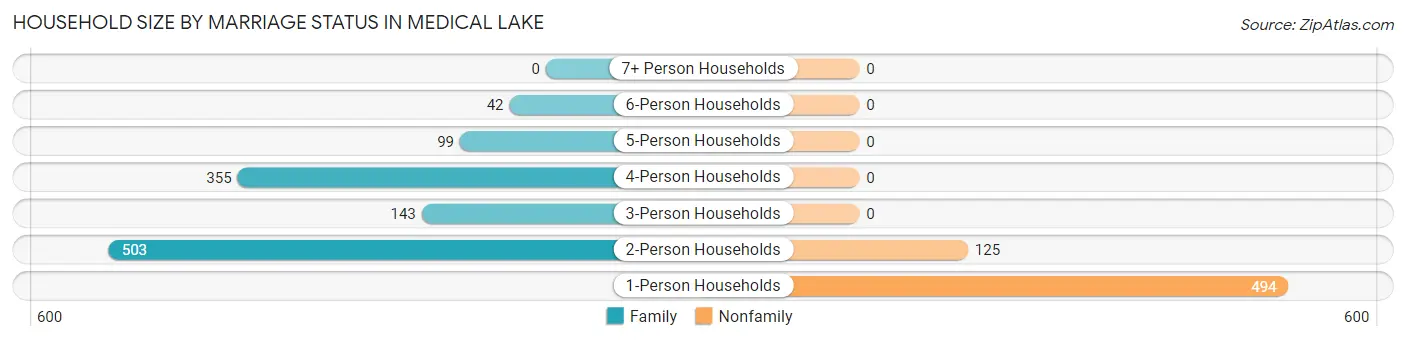
| Household Size | Family Households | Nonfamily Households |
| 1-Person Households | - | 494 (28.1%) |
| 2-Person Households | 503 (28.6%) | 125 (7.1%) |
| 3-Person Households | 143 (8.1%) | 0 (0.0%) |
| 4-Person Households | 355 (20.2%) | 0 (0.0%) |
| 5-Person Households | 99 (5.6%) | 0 (0.0%) |
| 6-Person Households | 42 (2.4%) | 0 (0.0%) |
| 7+ Person Households | 0 (0.0%) | 0 (0.0%) |
| Total | 1,142 (64.8%) | 619 (35.1%) |
Female Fertility in Medical Lake
Fertility by Age in Medical Lake
Average fertility rate in Medical Lake is 22.0 births per 1,000 women. Women in the age bracket of 20 to 34 years have the highest fertility rate with 61.0 births per 1,000 women. Women in the age bracket of 20 to 34 years acount for 100.0% of all women with births.
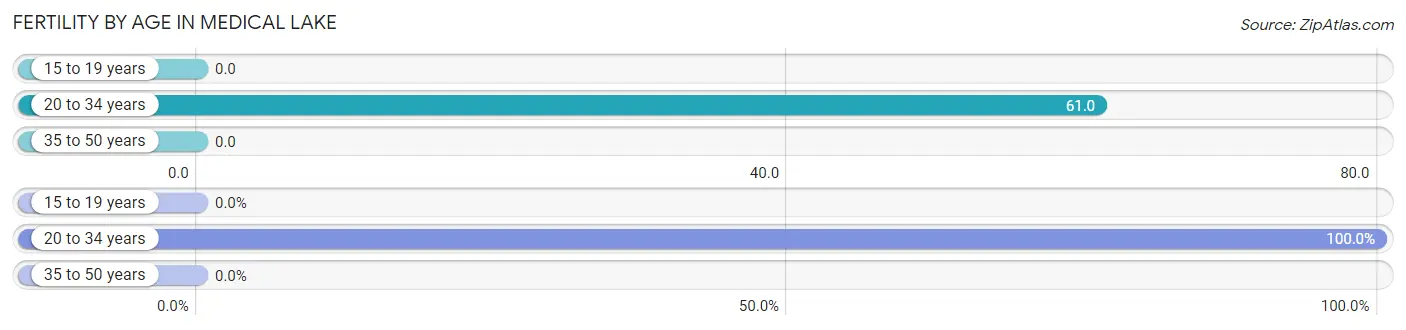
| Age Bracket | Women with Births | Births / 1,000 Women |
| 15 to 19 years | 0 (0.0%) | 0.0 |
| 20 to 34 years | 31 (100.0%) | 61.0 |
| 35 to 50 years | 0 (0.0%) | 0.0 |
| Total | 31 (100.0%) | 22.0 |
Fertility by Age by Marriage Status in Medical Lake
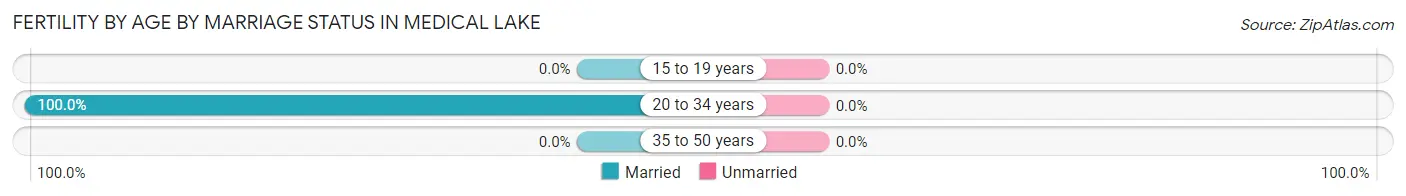
| Age Bracket | Married | Unmarried |
| 15 to 19 years | 0 (0.0%) | 0 (0.0%) |
| 20 to 34 years | 31 (100.0%) | 0 (0.0%) |
| 35 to 50 years | 0 (0.0%) | 0 (0.0%) |
| Total | 31 (100.0%) | 0 (0.0%) |
Fertility by Education in Medical Lake
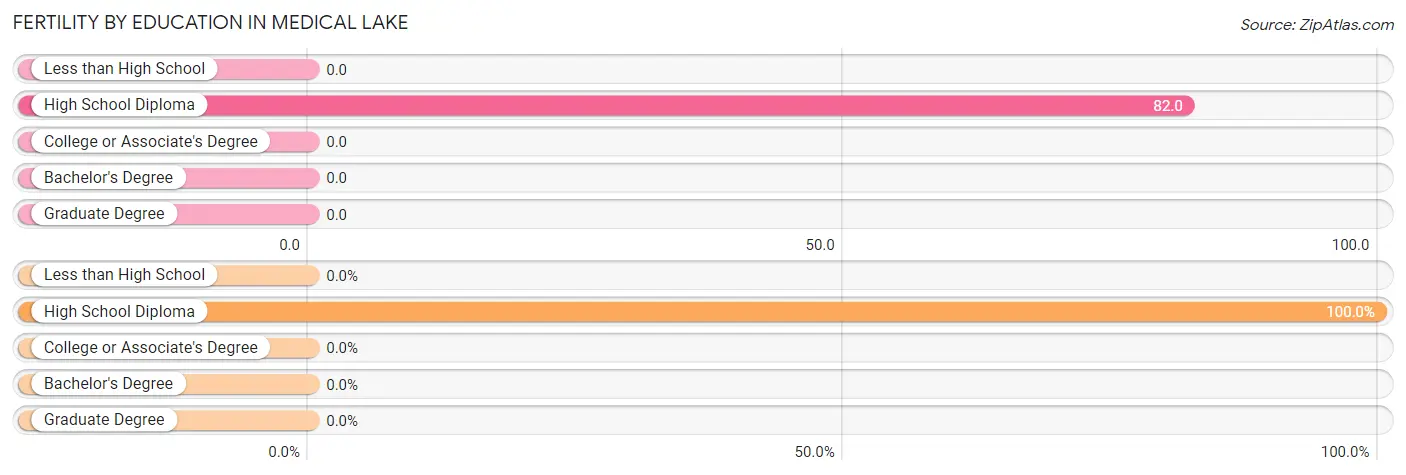
| Educational Attainment | Women with Births | Births / 1,000 Women |
| Less than High School | 0 (0.0%) | 0.0 |
| High School Diploma | 31 (100.0%) | 82.0 |
| College or Associate's Degree | 0 (0.0%) | 0.0 |
| Bachelor's Degree | 0 (0.0%) | 0.0 |
| Graduate Degree | 0 (0.0%) | 0.0 |
| Total | 31 (100.0%) | 22.0 |
Fertility by Education by Marriage Status in Medical Lake
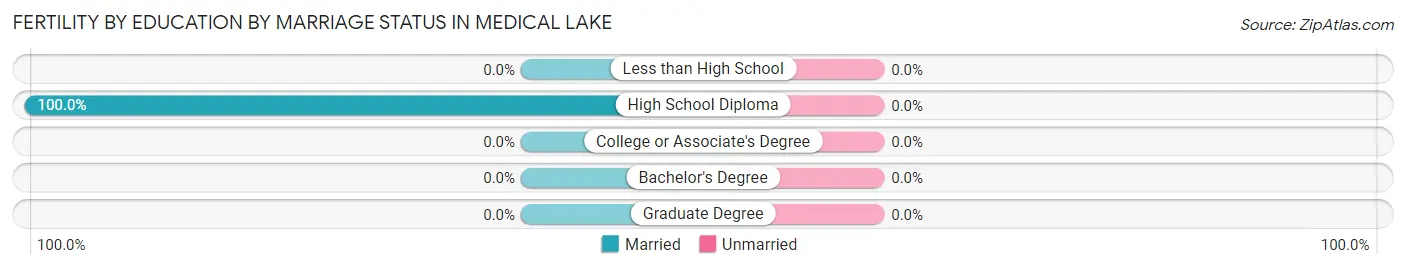
| Educational Attainment | Married | Unmarried |
| Less than High School | 0 (0.0%) | 0 (0.0%) |
| High School Diploma | 31 (100.0%) | 0 (0.0%) |
| College or Associate's Degree | 0 (0.0%) | 0 (0.0%) |
| Bachelor's Degree | 0 (0.0%) | 0 (0.0%) |
| Graduate Degree | 0 (0.0%) | 0 (0.0%) |
| Total | 31 (100.0%) | 0 (0.0%) |
Employment Characteristics in Medical Lake
Employment by Class of Employer in Medical Lake
Among the 2,018 employed individuals in Medical Lake, private company employees (1,218 | 60.4%), state government employees (335 | 16.6%), and federal government employees (172 | 8.5%) make up the most common classes of employment.
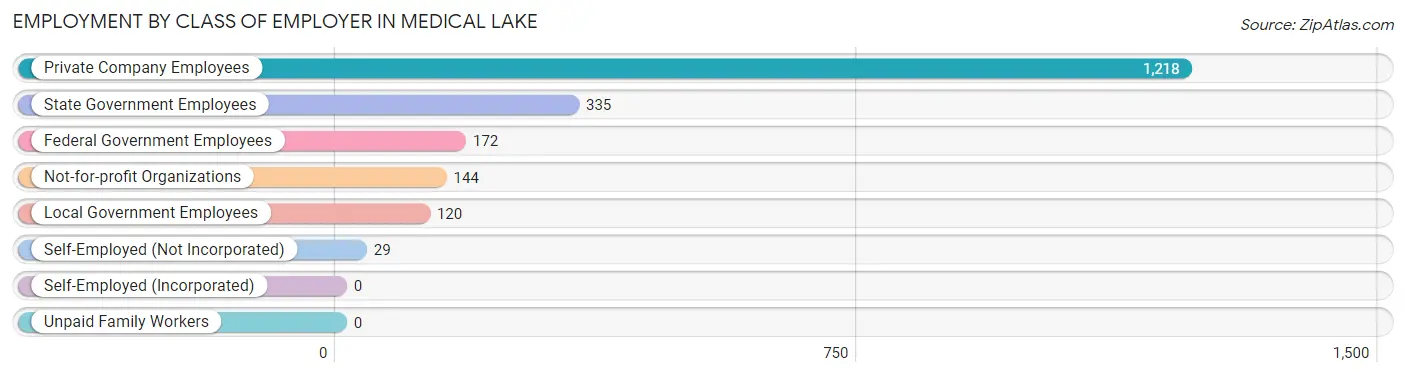
| Employer Class | # Employees | % Employees |
| Private Company Employees | 1,218 | 60.4% |
| Self-Employed (Incorporated) | 0 | 0.0% |
| Self-Employed (Not Incorporated) | 29 | 1.4% |
| Not-for-profit Organizations | 144 | 7.1% |
| Local Government Employees | 120 | 5.9% |
| State Government Employees | 335 | 16.6% |
| Federal Government Employees | 172 | 8.5% |
| Unpaid Family Workers | 0 | 0.0% |
| Total | 2,018 | 100.0% |
Employment Status by Age in Medical Lake
According to the labor force statistics for Medical Lake, out of the total population over 16 years of age (4,005), 53.0% or 2,123 individuals are in the labor force, with 4.5% or 96 of them unemployed. The age group with the highest labor force participation rate is 25 to 29 years, with 83.5% or 284 individuals in the labor force. Within the labor force, the 16 to 19 years age range has the highest percentage of unemployed individuals, with 24.1% or 42 of them being unemployed.
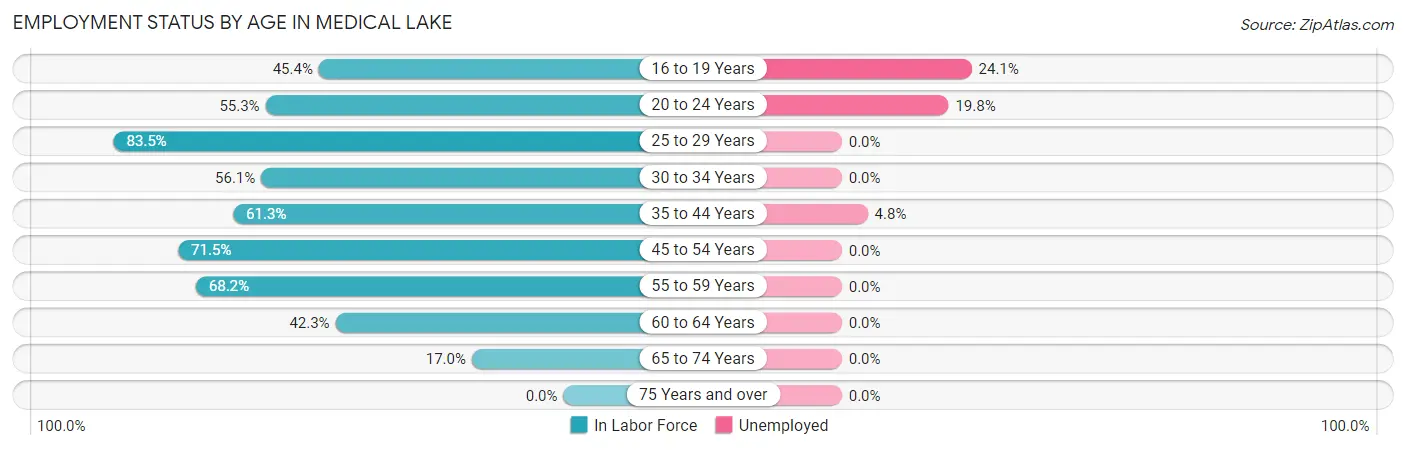
| Age Bracket | In Labor Force | Unemployed |
| 16 to 19 Years | 174 (45.4%) | 42 (24.1%) |
| 20 to 24 Years | 121 (55.3%) | 24 (19.8%) |
| 25 to 29 Years | 284 (83.5%) | 0 (0.0%) |
| 30 to 34 Years | 329 (56.1%) | 0 (0.0%) |
| 35 to 44 Years | 560 (61.3%) | 27 (4.8%) |
| 45 to 54 Years | 298 (71.5%) | 0 (0.0%) |
| 55 to 59 Years | 204 (68.2%) | 0 (0.0%) |
| 60 to 64 Years | 104 (42.3%) | 0 (0.0%) |
| 65 to 74 Years | 47 (17.0%) | 0 (0.0%) |
| 75 Years and over | 0 (0.0%) | 0 (0.0%) |
| Total | 2,123 (53.0%) | 96 (4.5%) |
Employment Status by Educational Attainment in Medical Lake
According to labor force statistics for Medical Lake, 63.5% of individuals (1,779) out of the total population between 25 and 64 years of age (2,801) are in the labor force, with 1.5% or 27 of them being unemployed. The group with the highest labor force participation rate are those with the educational attainment of bachelor's degree or higher, with 91.8% or 836 individuals in the labor force. Within the labor force, individuals with college / associate degree education have the highest percentage of unemployment, with 4.3% or 28 of them being unemployed.
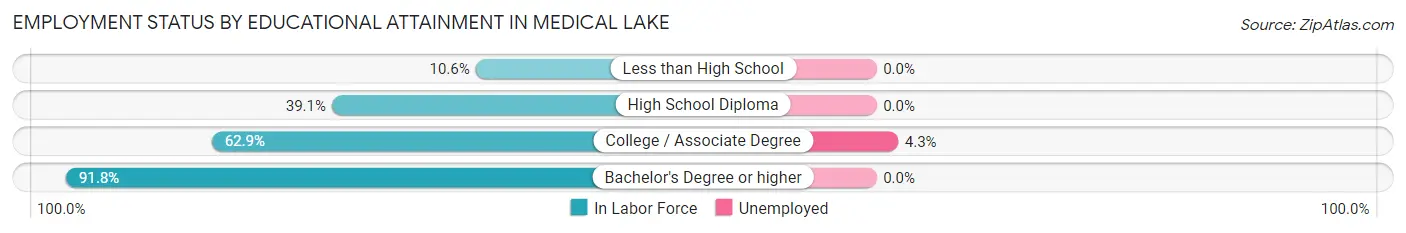
| Educational Attainment | In Labor Force | Unemployed |
| Less than High School | 16 (10.6%) | 0 (0.0%) |
| High School Diploma | 274 (39.1%) | 0 (0.0%) |
| College / Associate Degree | 653 (62.9%) | 45 (4.3%) |
| Bachelor's Degree or higher | 836 (91.8%) | 0 (0.0%) |
| Total | 1,779 (63.5%) | 42 (1.5%) |
Employment Occupations by Sex in Medical Lake
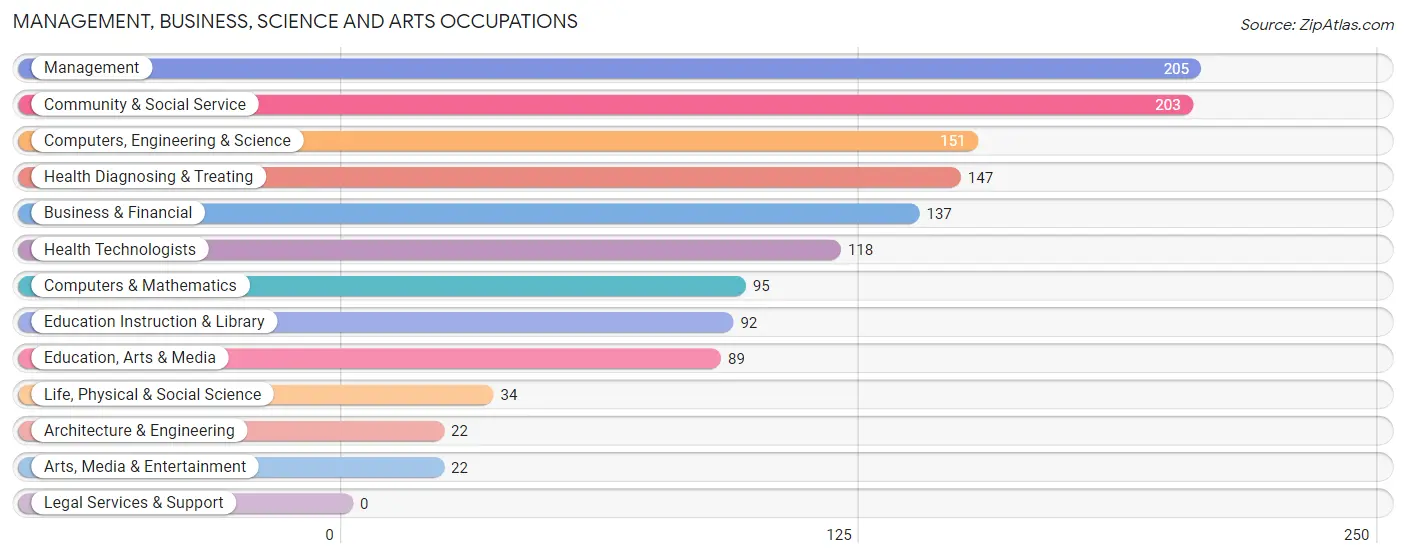
Management, Business, Science and Arts Occupations
The most common Management, Business, Science and Arts occupations in Medical Lake are Management (205 | 10.5%), Community & Social Service (203 | 10.4%), Computers, Engineering & Science (151 | 7.7%), Health Diagnosing & Treating (147 | 7.5%), and Business & Financial (137 | 7.0%).
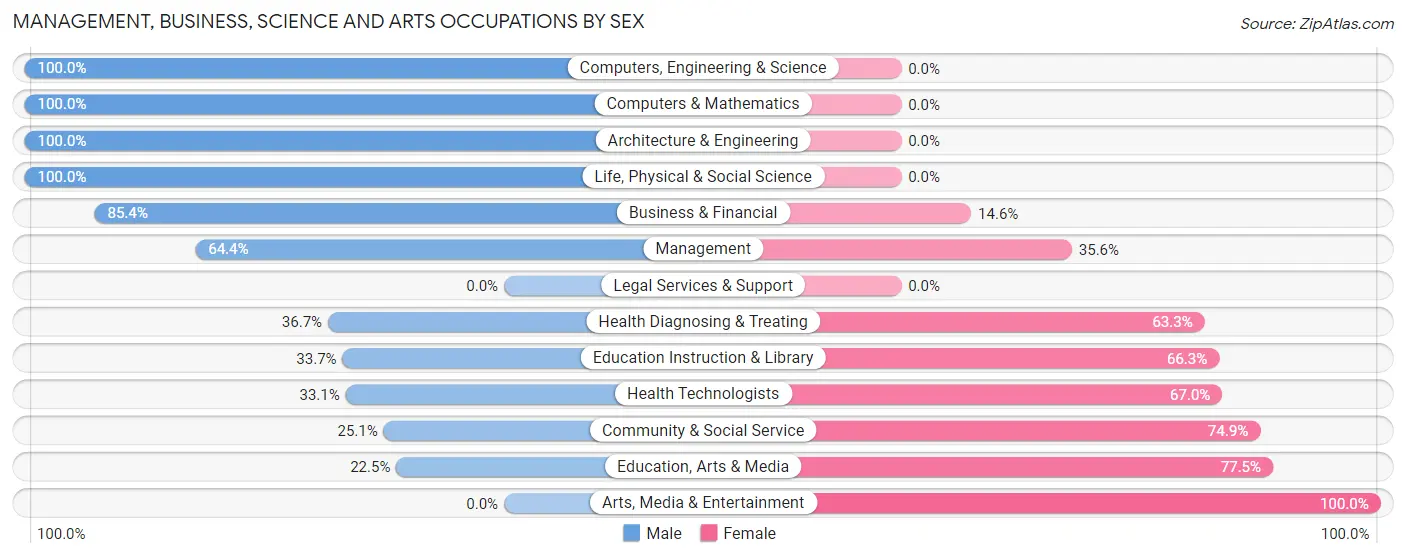
Management, Business, Science and Arts Occupations by Sex
Within the Management, Business, Science and Arts occupations in Medical Lake, the most male-oriented occupations are Computers, Engineering & Science (100.0%), Computers & Mathematics (100.0%), and Architecture & Engineering (100.0%), while the most female-oriented occupations are Arts, Media & Entertainment (100.0%), Education, Arts & Media (77.5%), and Community & Social Service (74.9%).
| Occupation | Male | Female |
| Management | 132 (64.4%) | 73 (35.6%) |
| Business & Financial | 117 (85.4%) | 20 (14.6%) |
| Computers, Engineering & Science | 151 (100.0%) | 0 (0.0%) |
| Computers & Mathematics | 95 (100.0%) | 0 (0.0%) |
| Architecture & Engineering | 22 (100.0%) | 0 (0.0%) |
| Life, Physical & Social Science | 34 (100.0%) | 0 (0.0%) |
| Community & Social Service | 51 (25.1%) | 152 (74.9%) |
| Education, Arts & Media | 20 (22.5%) | 69 (77.5%) |
| Legal Services & Support | 0 (0.0%) | 0 (0.0%) |
| Education Instruction & Library | 31 (33.7%) | 61 (66.3%) |
| Arts, Media & Entertainment | 0 (0.0%) | 22 (100.0%) |
| Health Diagnosing & Treating | 54 (36.7%) | 93 (63.3%) |
| Health Technologists | 39 (33.1%) | 79 (66.9%) |
| Total (Category) | 505 (59.9%) | 338 (40.1%) |
| Total (Overall) | 991 (50.8%) | 959 (49.2%) |
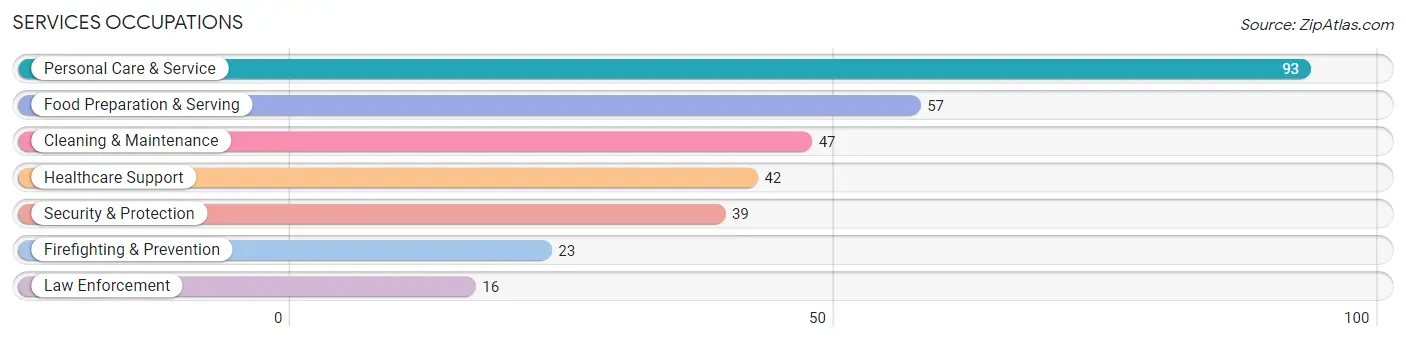
Services Occupations
The most common Services occupations in Medical Lake are Personal Care & Service (93 | 4.8%), Food Preparation & Serving (57 | 2.9%), Cleaning & Maintenance (47 | 2.4%), Healthcare Support (42 | 2.1%), and Security & Protection (39 | 2.0%).
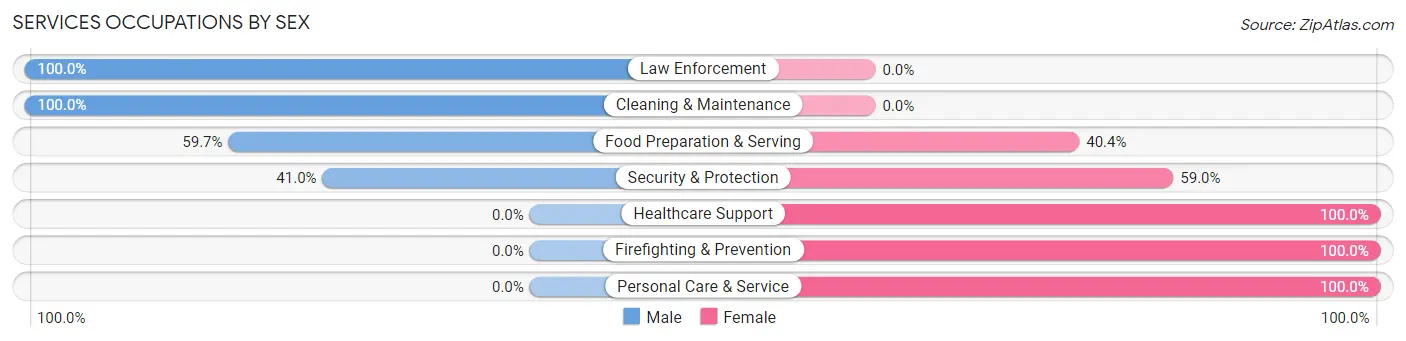
Services Occupations by Sex
Within the Services occupations in Medical Lake, the most male-oriented occupations are Law Enforcement (100.0%), Cleaning & Maintenance (100.0%), and Food Preparation & Serving (59.7%), while the most female-oriented occupations are Healthcare Support (100.0%), Firefighting & Prevention (100.0%), and Personal Care & Service (100.0%).
| Occupation | Male | Female |
| Healthcare Support | 0 (0.0%) | 42 (100.0%) |
| Security & Protection | 16 (41.0%) | 23 (59.0%) |
| Firefighting & Prevention | 0 (0.0%) | 23 (100.0%) |
| Law Enforcement | 16 (100.0%) | 0 (0.0%) |
| Food Preparation & Serving | 34 (59.7%) | 23 (40.4%) |
| Cleaning & Maintenance | 47 (100.0%) | 0 (0.0%) |
| Personal Care & Service | 0 (0.0%) | 93 (100.0%) |
| Total (Category) | 97 (34.9%) | 181 (65.1%) |
| Total (Overall) | 991 (50.8%) | 959 (49.2%) |
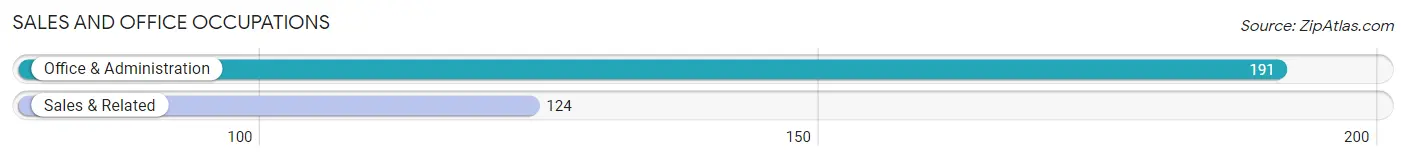
Sales and Office Occupations
The most common Sales and Office occupations in Medical Lake are Office & Administration (191 | 9.8%), and Sales & Related (124 | 6.4%).
Sales and Office Occupations by Sex
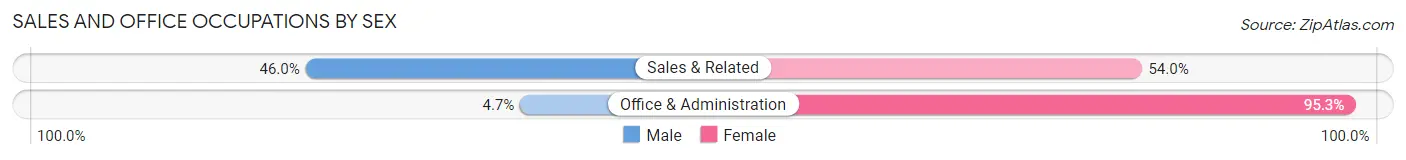
| Occupation | Male | Female |
| Sales & Related | 57 (46.0%) | 67 (54.0%) |
| Office & Administration | 9 (4.7%) | 182 (95.3%) |
| Total (Category) | 66 (20.9%) | 249 (79.0%) |
| Total (Overall) | 991 (50.8%) | 959 (49.2%) |
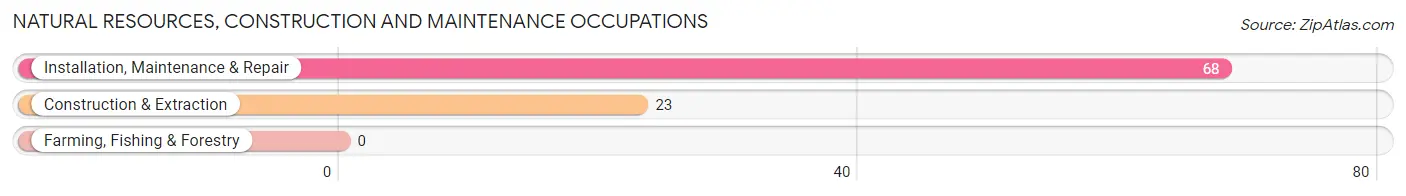
Natural Resources, Construction and Maintenance Occupations
The most common Natural Resources, Construction and Maintenance occupations in Medical Lake are Installation, Maintenance & Repair (68 | 3.5%), and Construction & Extraction (23 | 1.2%).
Natural Resources, Construction and Maintenance Occupations by Sex
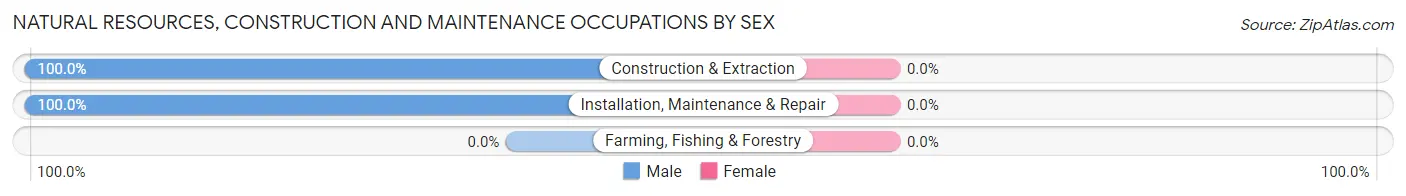
| Occupation | Male | Female |
| Farming, Fishing & Forestry | 0 (0.0%) | 0 (0.0%) |
| Construction & Extraction | 23 (100.0%) | 0 (0.0%) |
| Installation, Maintenance & Repair | 68 (100.0%) | 0 (0.0%) |
| Total (Category) | 91 (100.0%) | 0 (0.0%) |
| Total (Overall) | 991 (50.8%) | 959 (49.2%) |
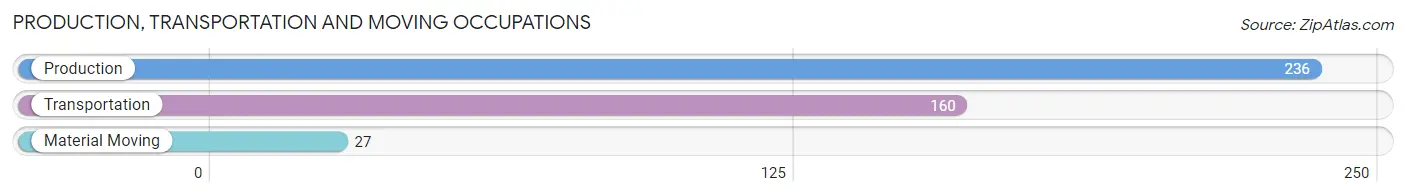
Production, Transportation and Moving Occupations
The most common Production, Transportation and Moving occupations in Medical Lake are Production (236 | 12.1%), Transportation (160 | 8.2%), and Material Moving (27 | 1.4%).
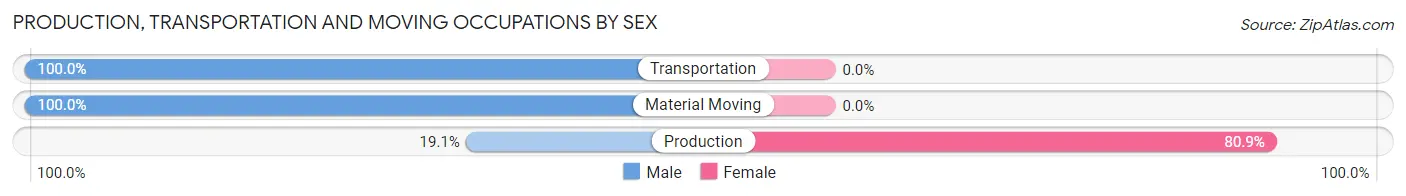
Production, Transportation and Moving Occupations by Sex
| Occupation | Male | Female |
| Production | 45 (19.1%) | 191 (80.9%) |
| Transportation | 160 (100.0%) | 0 (0.0%) |
| Material Moving | 27 (100.0%) | 0 (0.0%) |
| Total (Category) | 232 (54.8%) | 191 (45.2%) |
| Total (Overall) | 991 (50.8%) | 959 (49.2%) |
Employment Industries by Sex in Medical Lake
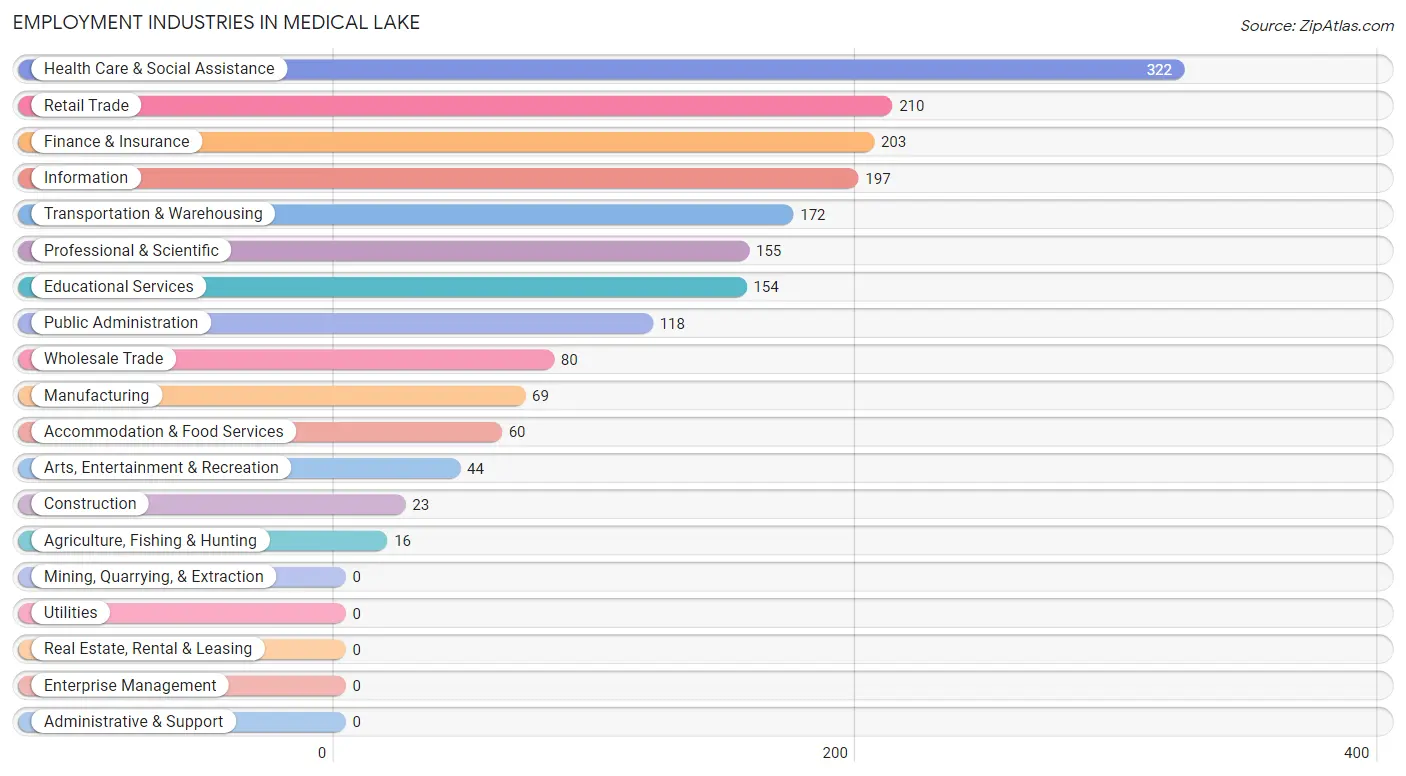
Employment Industries in Medical Lake
The major employment industries in Medical Lake include Health Care & Social Assistance (322 | 16.5%), Retail Trade (210 | 10.8%), Finance & Insurance (203 | 10.4%), Information (197 | 10.1%), and Transportation & Warehousing (172 | 8.8%).
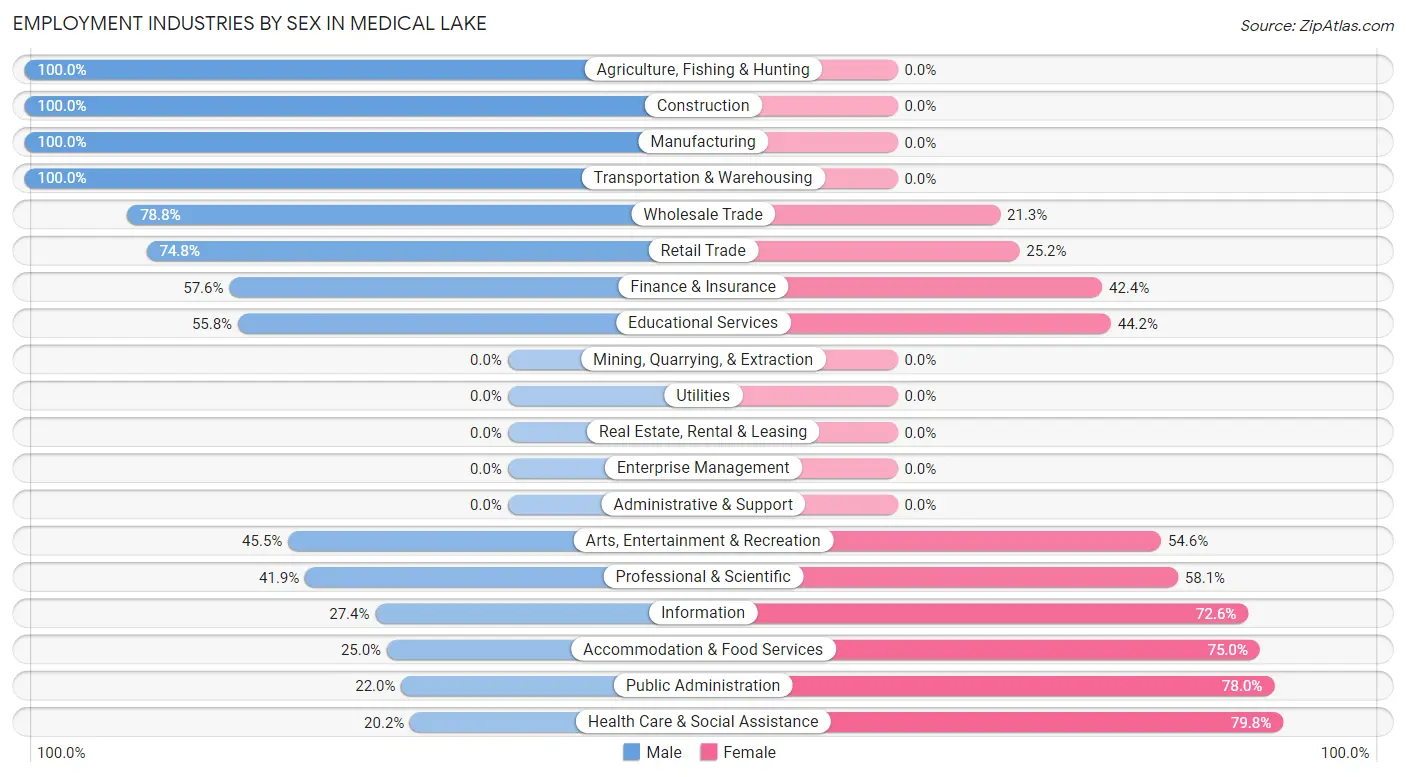
Employment Industries by Sex in Medical Lake
The Medical Lake industries that see more men than women are Agriculture, Fishing & Hunting (100.0%), Construction (100.0%), and Manufacturing (100.0%), whereas the industries that tend to have a higher number of women are Health Care & Social Assistance (79.8%), Public Administration (78.0%), and Accommodation & Food Services (75.0%).
| Industry | Male | Female |
| Agriculture, Fishing & Hunting | 16 (100.0%) | 0 (0.0%) |
| Mining, Quarrying, & Extraction | 0 (0.0%) | 0 (0.0%) |
| Construction | 23 (100.0%) | 0 (0.0%) |
| Manufacturing | 69 (100.0%) | 0 (0.0%) |
| Wholesale Trade | 63 (78.7%) | 17 (21.2%) |
| Retail Trade | 157 (74.8%) | 53 (25.2%) |
| Transportation & Warehousing | 172 (100.0%) | 0 (0.0%) |
| Utilities | 0 (0.0%) | 0 (0.0%) |
| Information | 54 (27.4%) | 143 (72.6%) |
| Finance & Insurance | 117 (57.6%) | 86 (42.4%) |
| Real Estate, Rental & Leasing | 0 (0.0%) | 0 (0.0%) |
| Professional & Scientific | 65 (41.9%) | 90 (58.1%) |
| Enterprise Management | 0 (0.0%) | 0 (0.0%) |
| Administrative & Support | 0 (0.0%) | 0 (0.0%) |
| Educational Services | 86 (55.8%) | 68 (44.2%) |
| Health Care & Social Assistance | 65 (20.2%) | 257 (79.8%) |
| Arts, Entertainment & Recreation | 20 (45.5%) | 24 (54.5%) |
| Accommodation & Food Services | 15 (25.0%) | 45 (75.0%) |
| Public Administration | 26 (22.0%) | 92 (78.0%) |
| Total | 991 (50.8%) | 959 (49.2%) |
Education in Medical Lake
School Enrollment in Medical Lake
The most common levels of schooling among the 1,117 students in Medical Lake are high school (356 | 31.9%), middle school (339 | 30.3%), and elementary school (185 | 16.6%).
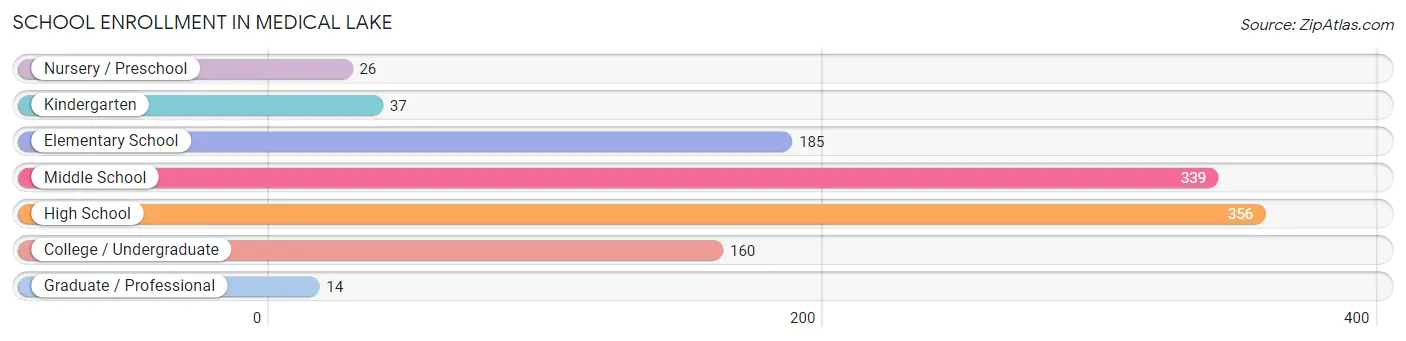
| School Level | # Students | % Students |
| Nursery / Preschool | 26 | 2.3% |
| Kindergarten | 37 | 3.3% |
| Elementary School | 185 | 16.6% |
| Middle School | 339 | 30.3% |
| High School | 356 | 31.9% |
| College / Undergraduate | 160 | 14.3% |
| Graduate / Professional | 14 | 1.3% |
| Total | 1,117 | 100.0% |
School Enrollment by Age by Funding Source in Medical Lake
Out of a total of 1,117 students who are enrolled in schools in Medical Lake, 124 (11.1%) attend a private institution, while the remaining 993 (88.9%) are enrolled in public schools. The age group of 18 to 19 year olds has the highest likelihood of being enrolled in private schools, with 30 (52.6% in the age bracket) enrolled. Conversely, the age group of 3 to 4 year olds has the lowest likelihood of being enrolled in a private school, with 15 (100.0% in the age bracket) attending a public institution.
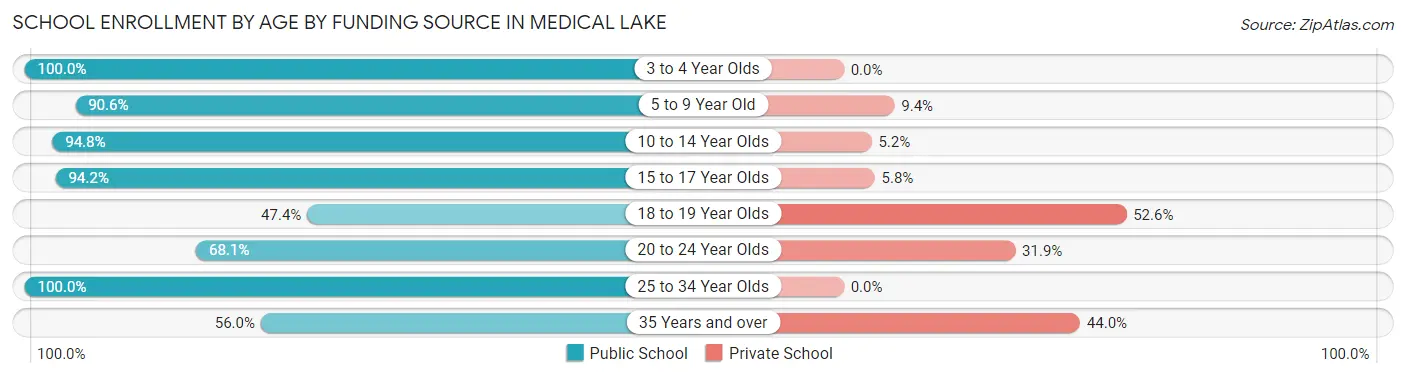
| Age Bracket | Public School | Private School |
| 3 to 4 Year Olds | 15 (100.0%) | 0 (0.0%) |
| 5 to 9 Year Old | 211 (90.6%) | 22 (9.4%) |
| 10 to 14 Year Olds | 330 (94.8%) | 18 (5.2%) |
| 15 to 17 Year Olds | 327 (94.2%) | 20 (5.8%) |
| 18 to 19 Year Olds | 27 (47.4%) | 30 (52.6%) |
| 20 to 24 Year Olds | 49 (68.1%) | 23 (31.9%) |
| 25 to 34 Year Olds | 20 (100.0%) | 0 (0.0%) |
| 35 Years and over | 14 (56.0%) | 11 (44.0%) |
| Total | 993 (88.9%) | 124 (11.1%) |
Educational Attainment by Field of Study in Medical Lake
Visual & performing arts (242 | 21.3%), social sciences (232 | 20.4%), business (158 | 13.9%), science & technology (110 | 9.7%), and education (103 | 9.0%) are the most common fields of study among 1,138 individuals in Medical Lake who have obtained a bachelor's degree or higher.
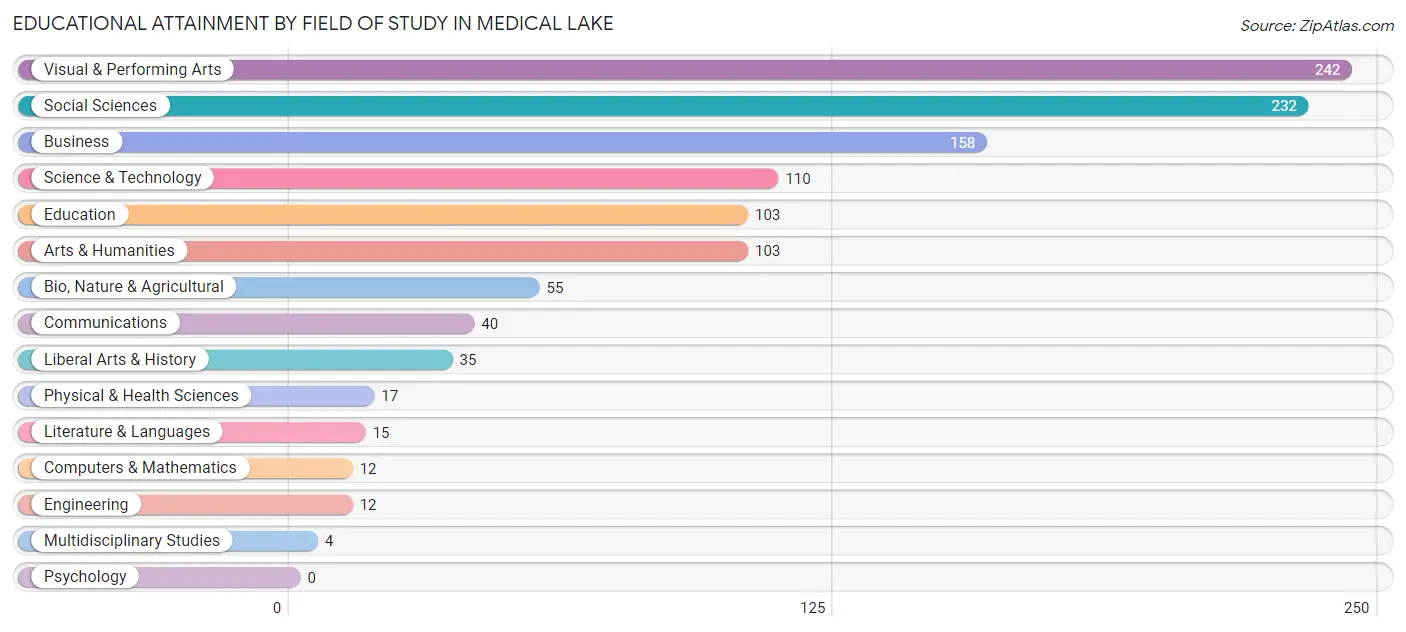
| Field of Study | # Graduates | % Graduates |
| Computers & Mathematics | 12 | 1.1% |
| Bio, Nature & Agricultural | 55 | 4.8% |
| Physical & Health Sciences | 17 | 1.5% |
| Psychology | 0 | 0.0% |
| Social Sciences | 232 | 20.4% |
| Engineering | 12 | 1.1% |
| Multidisciplinary Studies | 4 | 0.4% |
| Science & Technology | 110 | 9.7% |
| Business | 158 | 13.9% |
| Education | 103 | 9.0% |
| Literature & Languages | 15 | 1.3% |
| Liberal Arts & History | 35 | 3.1% |
| Visual & Performing Arts | 242 | 21.3% |
| Communications | 40 | 3.5% |
| Arts & Humanities | 103 | 9.0% |
| Total | 1,138 | 100.0% |
Transportation & Commute in Medical Lake
Vehicle Availability by Sex in Medical Lake
The most prevalent vehicle ownership categories in Medical Lake are males with 2 vehicles (490, accounting for 45.8%) and females with 2 vehicles (473, making up 53.1%).
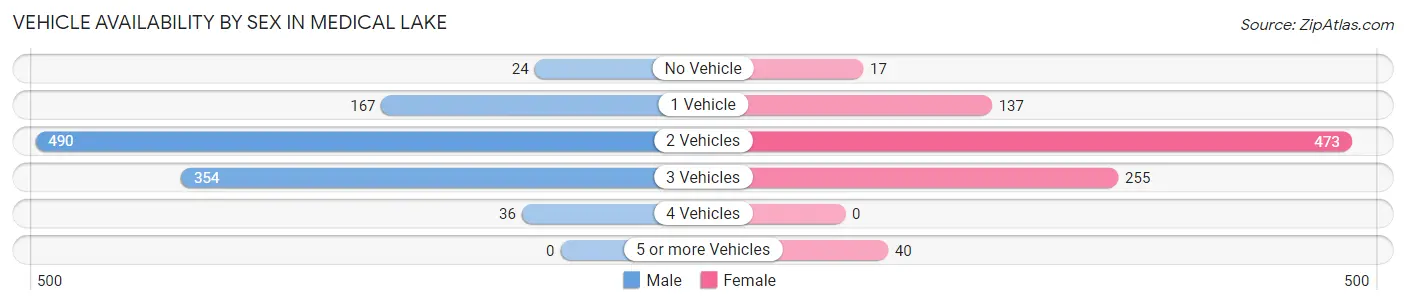
| Vehicles Available | Male | Female |
| No Vehicle | 24 (2.2%) | 17 (1.8%) |
| 1 Vehicle | 167 (15.6%) | 137 (14.9%) |
| 2 Vehicles | 490 (45.8%) | 473 (51.3%) |
| 3 Vehicles | 354 (33.1%) | 255 (27.7%) |
| 4 Vehicles | 36 (3.4%) | 0 (0.0%) |
| 5 or more Vehicles | 0 (0.0%) | 40 (4.3%) |
| Total | 1,071 (100.0%) | 922 (100.0%) |
Commute Time in Medical Lake
The most frequently occuring commute durations in Medical Lake are 30 to 34 minutes (559 commuters, 30.5%), 15 to 19 minutes (253 commuters, 13.8%), and 5 to 9 minutes (251 commuters, 13.7%).
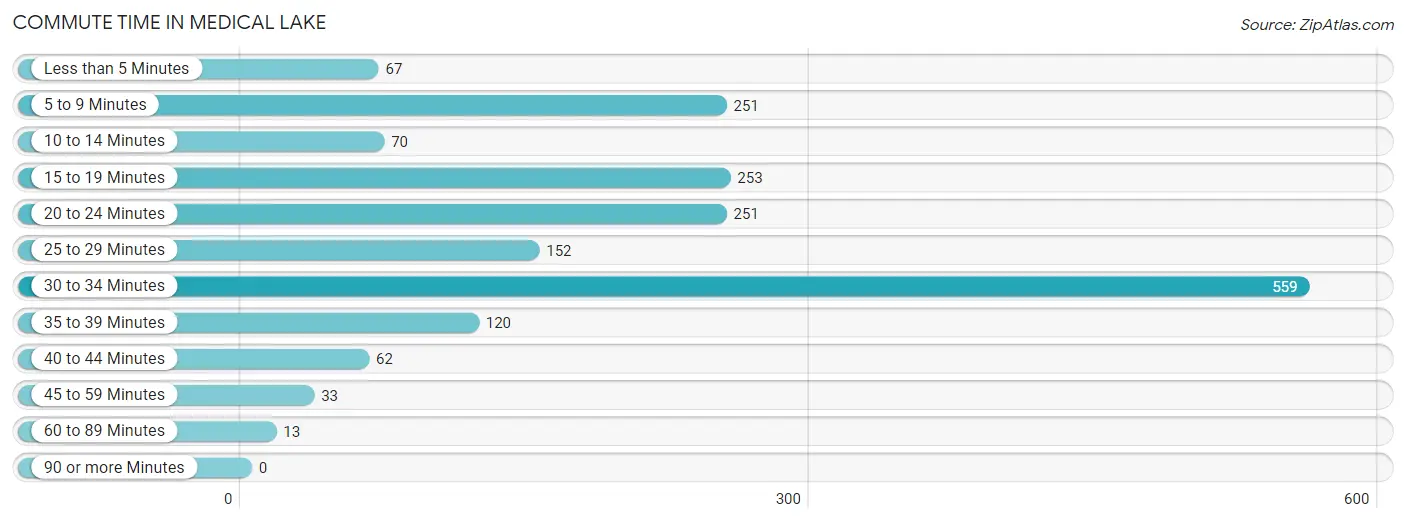
| Commute Time | # Commuters | % Commuters |
| Less than 5 Minutes | 67 | 3.7% |
| 5 to 9 Minutes | 251 | 13.7% |
| 10 to 14 Minutes | 70 | 3.8% |
| 15 to 19 Minutes | 253 | 13.8% |
| 20 to 24 Minutes | 251 | 13.7% |
| 25 to 29 Minutes | 152 | 8.3% |
| 30 to 34 Minutes | 559 | 30.5% |
| 35 to 39 Minutes | 120 | 6.6% |
| 40 to 44 Minutes | 62 | 3.4% |
| 45 to 59 Minutes | 33 | 1.8% |
| 60 to 89 Minutes | 13 | 0.7% |
| 90 or more Minutes | 0 | 0.0% |
Commute Time by Sex in Medical Lake
The most common commute times in Medical Lake are 30 to 34 minutes (330 commuters, 34.6%) for males and 30 to 34 minutes (229 commuters, 26.1%) for females.
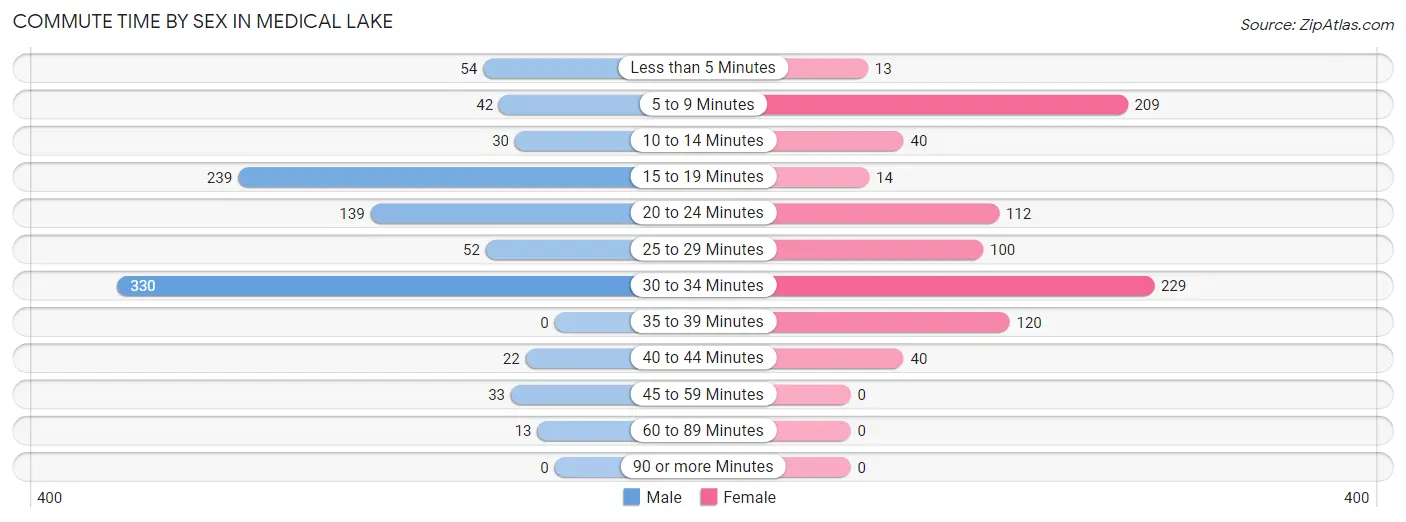
| Commute Time | Male | Female |
| Less than 5 Minutes | 54 (5.7%) | 13 (1.5%) |
| 5 to 9 Minutes | 42 (4.4%) | 209 (23.8%) |
| 10 to 14 Minutes | 30 (3.1%) | 40 (4.6%) |
| 15 to 19 Minutes | 239 (25.1%) | 14 (1.6%) |
| 20 to 24 Minutes | 139 (14.6%) | 112 (12.8%) |
| 25 to 29 Minutes | 52 (5.4%) | 100 (11.4%) |
| 30 to 34 Minutes | 330 (34.6%) | 229 (26.1%) |
| 35 to 39 Minutes | 0 (0.0%) | 120 (13.7%) |
| 40 to 44 Minutes | 22 (2.3%) | 40 (4.6%) |
| 45 to 59 Minutes | 33 (3.5%) | 0 (0.0%) |
| 60 to 89 Minutes | 13 (1.4%) | 0 (0.0%) |
| 90 or more Minutes | 0 (0.0%) | 0 (0.0%) |
Time of Departure to Work by Sex in Medical Lake
The most frequent times of departure to work in Medical Lake are 7:00 AM to 7:29 AM (154, 16.1%) for males and 12:00 PM to 3:59 PM (308, 35.1%) for females.
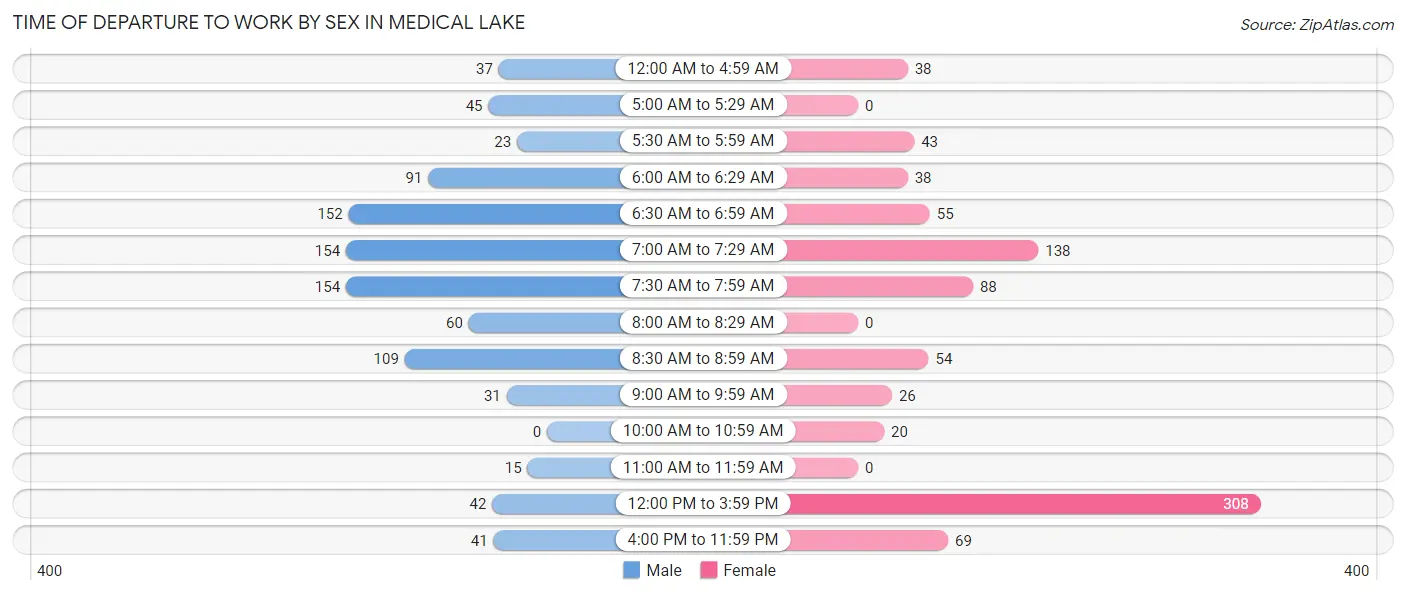
| Time of Departure | Male | Female |
| 12:00 AM to 4:59 AM | 37 (3.9%) | 38 (4.3%) |
| 5:00 AM to 5:29 AM | 45 (4.7%) | 0 (0.0%) |
| 5:30 AM to 5:59 AM | 23 (2.4%) | 43 (4.9%) |
| 6:00 AM to 6:29 AM | 91 (9.5%) | 38 (4.3%) |
| 6:30 AM to 6:59 AM | 152 (15.9%) | 55 (6.3%) |
| 7:00 AM to 7:29 AM | 154 (16.1%) | 138 (15.7%) |
| 7:30 AM to 7:59 AM | 154 (16.1%) | 88 (10.0%) |
| 8:00 AM to 8:29 AM | 60 (6.3%) | 0 (0.0%) |
| 8:30 AM to 8:59 AM | 109 (11.4%) | 54 (6.2%) |
| 9:00 AM to 9:59 AM | 31 (3.3%) | 26 (3.0%) |
| 10:00 AM to 10:59 AM | 0 (0.0%) | 20 (2.3%) |
| 11:00 AM to 11:59 AM | 15 (1.6%) | 0 (0.0%) |
| 12:00 PM to 3:59 PM | 42 (4.4%) | 308 (35.1%) |
| 4:00 PM to 11:59 PM | 41 (4.3%) | 69 (7.9%) |
| Total | 954 (100.0%) | 877 (100.0%) |
Housing Occupancy in Medical Lake
Occupancy by Ownership in Medical Lake
Of the total 1,761 dwellings in Medical Lake, owner-occupied units account for 1,257 (71.4%), while renter-occupied units make up 504 (28.6%).
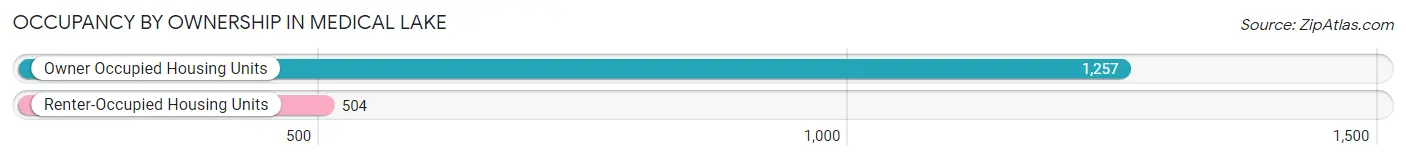
| Occupancy | # Housing Units | % Housing Units |
| Owner Occupied Housing Units | 1,257 | 71.4% |
| Renter-Occupied Housing Units | 504 | 28.6% |
| Total Occupied Housing Units | 1,761 | 100.0% |
Occupancy by Household Size in Medical Lake
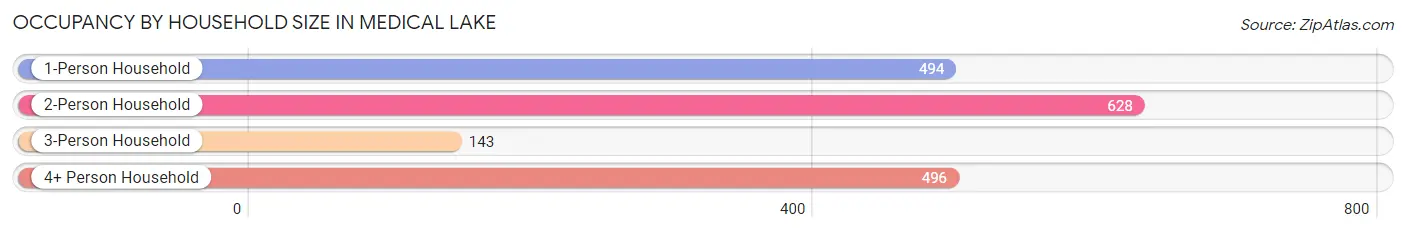
| Household Size | # Housing Units | % Housing Units |
| 1-Person Household | 494 | 28.1% |
| 2-Person Household | 628 | 35.7% |
| 3-Person Household | 143 | 8.1% |
| 4+ Person Household | 496 | 28.2% |
| Total Housing Units | 1,761 | 100.0% |
Occupancy by Ownership by Household Size in Medical Lake
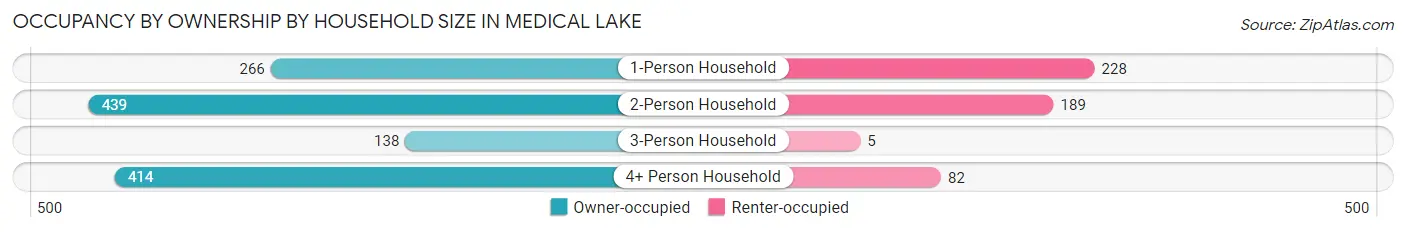
| Household Size | Owner-occupied | Renter-occupied |
| 1-Person Household | 266 (53.8%) | 228 (46.2%) |
| 2-Person Household | 439 (69.9%) | 189 (30.1%) |
| 3-Person Household | 138 (96.5%) | 5 (3.5%) |
| 4+ Person Household | 414 (83.5%) | 82 (16.5%) |
| Total Housing Units | 1,257 (71.4%) | 504 (28.6%) |
Occupancy by Educational Attainment in Medical Lake
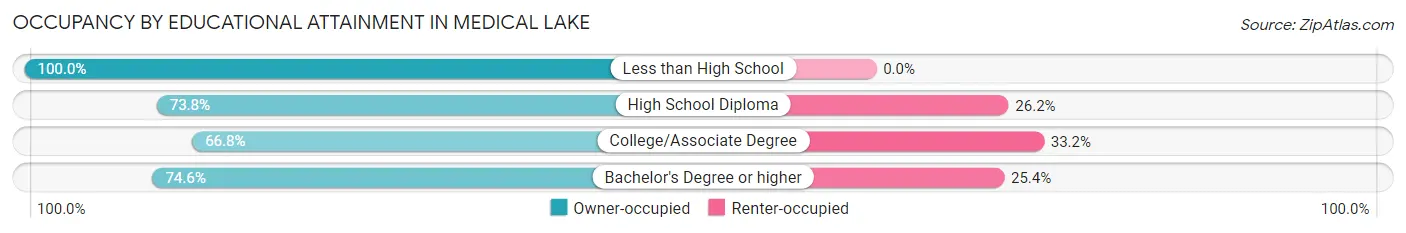
| Household Size | Owner-occupied | Renter-occupied |
| Less than High School | 16 (100.0%) | 0 (0.0%) |
| High School Diploma | 287 (73.8%) | 102 (26.2%) |
| College/Associate Degree | 492 (66.8%) | 245 (33.2%) |
| Bachelor's Degree or higher | 462 (74.6%) | 157 (25.4%) |
Occupancy by Age of Householder in Medical Lake
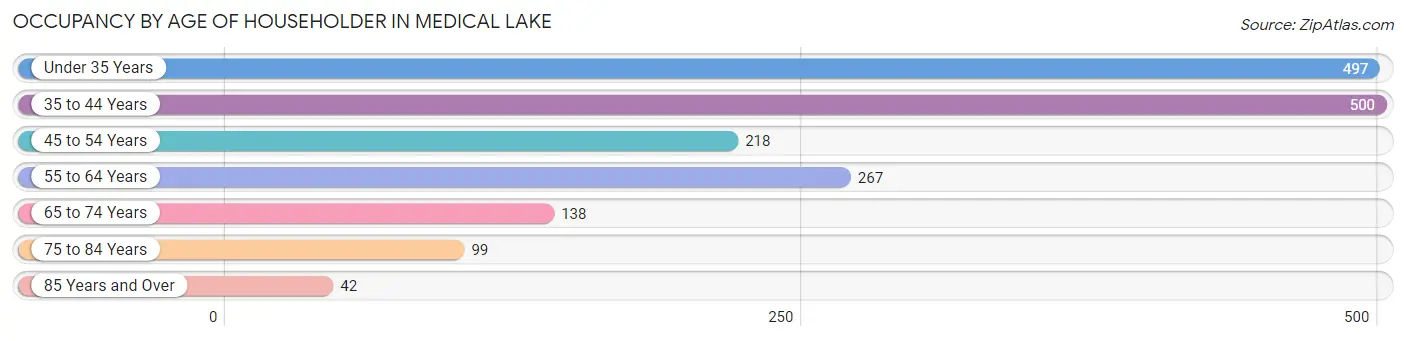
| Age Bracket | # Households | % Households |
| Under 35 Years | 497 | 28.2% |
| 35 to 44 Years | 500 | 28.4% |
| 45 to 54 Years | 218 | 12.4% |
| 55 to 64 Years | 267 | 15.2% |
| 65 to 74 Years | 138 | 7.8% |
| 75 to 84 Years | 99 | 5.6% |
| 85 Years and Over | 42 | 2.4% |
| Total | 1,761 | 100.0% |
Housing Finances in Medical Lake
Median Income by Occupancy in Medical Lake
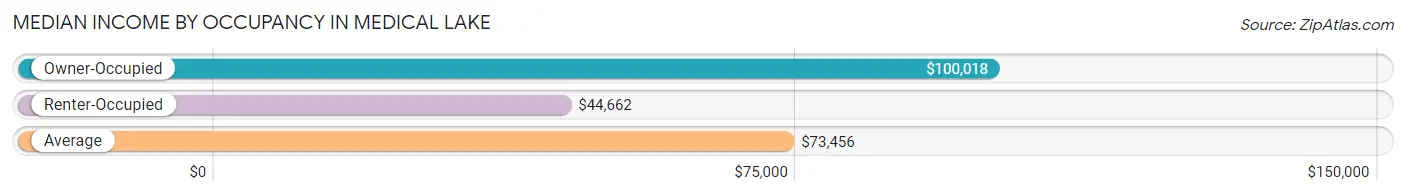
| Occupancy Type | # Households | Median Income |
| Owner-Occupied | 1,257 (71.4%) | $100,018 |
| Renter-Occupied | 504 (28.6%) | $44,662 |
| Average | 1,761 (100.0%) | $73,456 |
Occupancy by Householder Income Bracket in Medical Lake
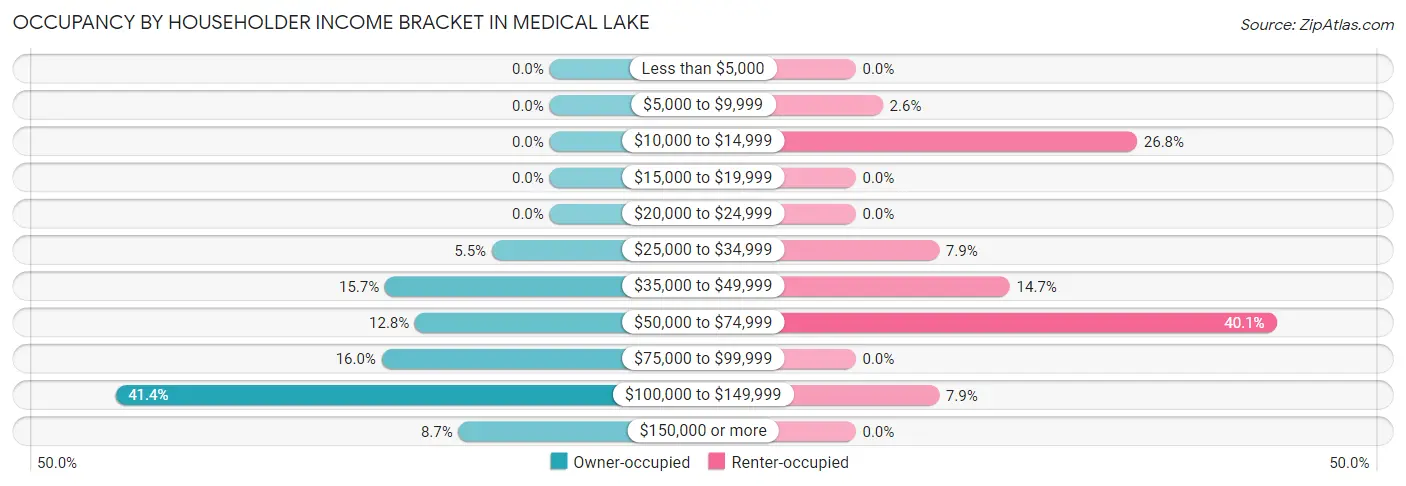
| Income Bracket | Owner-occupied | Renter-occupied |
| Less than $5,000 | 0 (0.0%) | 0 (0.0%) |
| $5,000 to $9,999 | 0 (0.0%) | 13 (2.6%) |
| $10,000 to $14,999 | 0 (0.0%) | 135 (26.8%) |
| $15,000 to $19,999 | 0 (0.0%) | 0 (0.0%) |
| $20,000 to $24,999 | 0 (0.0%) | 0 (0.0%) |
| $25,000 to $34,999 | 69 (5.5%) | 40 (7.9%) |
| $35,000 to $49,999 | 197 (15.7%) | 74 (14.7%) |
| $50,000 to $74,999 | 161 (12.8%) | 202 (40.1%) |
| $75,000 to $99,999 | 201 (16.0%) | 0 (0.0%) |
| $100,000 to $149,999 | 520 (41.4%) | 40 (7.9%) |
| $150,000 or more | 109 (8.7%) | 0 (0.0%) |
| Total | 1,257 (100.0%) | 504 (100.0%) |
Monthly Housing Cost Tiers in Medical Lake
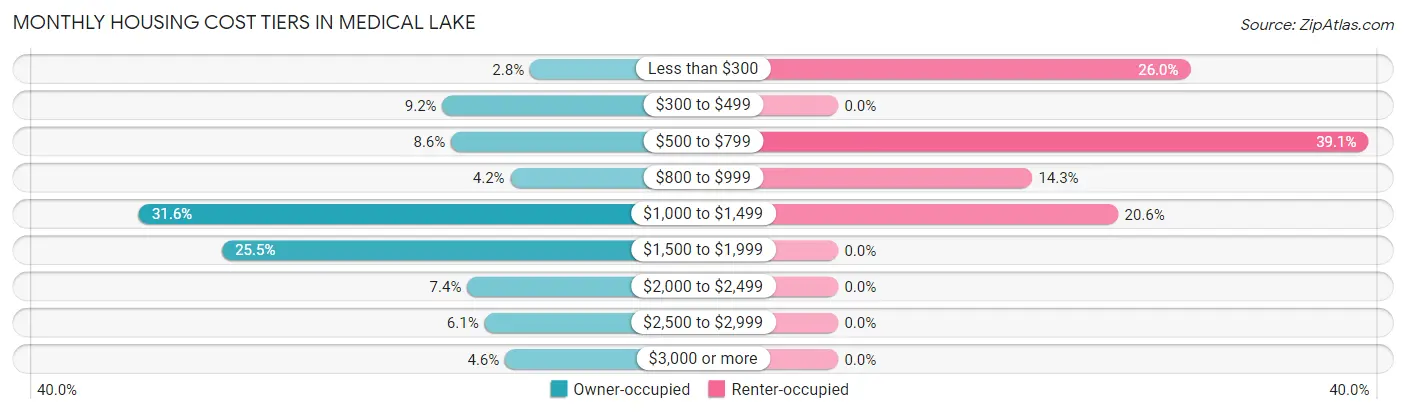
| Monthly Cost | Owner-occupied | Renter-occupied |
| Less than $300 | 35 (2.8%) | 131 (26.0%) |
| $300 to $499 | 116 (9.2%) | 0 (0.0%) |
| $500 to $799 | 108 (8.6%) | 197 (39.1%) |
| $800 to $999 | 53 (4.2%) | 72 (14.3%) |
| $1,000 to $1,499 | 397 (31.6%) | 104 (20.6%) |
| $1,500 to $1,999 | 320 (25.5%) | 0 (0.0%) |
| $2,000 to $2,499 | 93 (7.4%) | 0 (0.0%) |
| $2,500 to $2,999 | 77 (6.1%) | 0 (0.0%) |
| $3,000 or more | 58 (4.6%) | 0 (0.0%) |
| Total | 1,257 (100.0%) | 504 (100.0%) |
Physical Housing Characteristics in Medical Lake
Housing Structures in Medical Lake
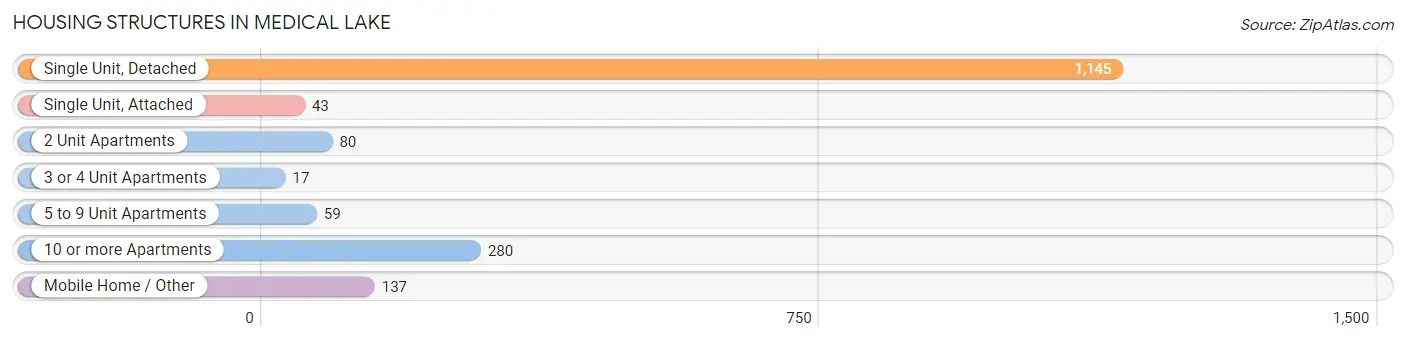
| Structure Type | # Housing Units | % Housing Units |
| Single Unit, Detached | 1,145 | 65.0% |
| Single Unit, Attached | 43 | 2.4% |
| 2 Unit Apartments | 80 | 4.5% |
| 3 or 4 Unit Apartments | 17 | 1.0% |
| 5 to 9 Unit Apartments | 59 | 3.4% |
| 10 or more Apartments | 280 | 15.9% |
| Mobile Home / Other | 137 | 7.8% |
| Total | 1,761 | 100.0% |
Housing Structures by Occupancy in Medical Lake
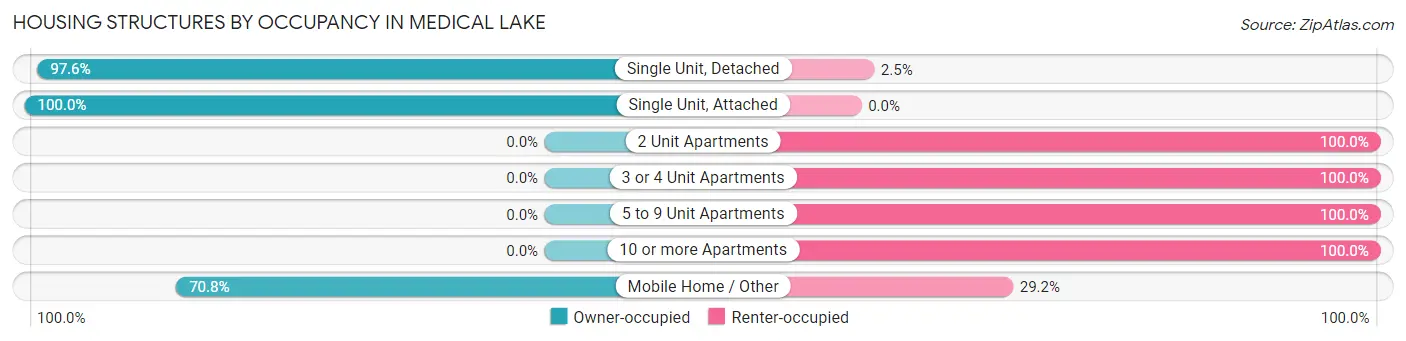
| Structure Type | Owner-occupied | Renter-occupied |
| Single Unit, Detached | 1,117 (97.6%) | 28 (2.5%) |
| Single Unit, Attached | 43 (100.0%) | 0 (0.0%) |
| 2 Unit Apartments | 0 (0.0%) | 80 (100.0%) |
| 3 or 4 Unit Apartments | 0 (0.0%) | 17 (100.0%) |
| 5 to 9 Unit Apartments | 0 (0.0%) | 59 (100.0%) |
| 10 or more Apartments | 0 (0.0%) | 280 (100.0%) |
| Mobile Home / Other | 97 (70.8%) | 40 (29.2%) |
| Total | 1,257 (71.4%) | 504 (28.6%) |
Housing Structures by Number of Rooms in Medical Lake
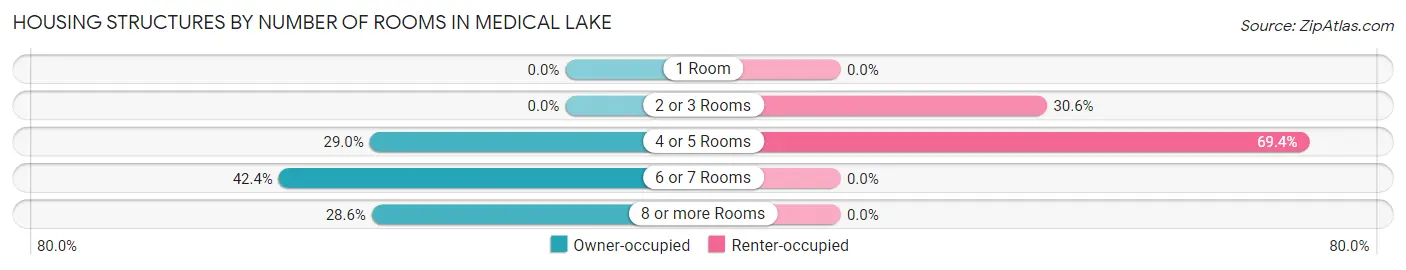
| Number of Rooms | Owner-occupied | Renter-occupied |
| 1 Room | 0 (0.0%) | 0 (0.0%) |
| 2 or 3 Rooms | 0 (0.0%) | 154 (30.6%) |
| 4 or 5 Rooms | 364 (29.0%) | 350 (69.4%) |
| 6 or 7 Rooms | 533 (42.4%) | 0 (0.0%) |
| 8 or more Rooms | 360 (28.6%) | 0 (0.0%) |
| Total | 1,257 (100.0%) | 504 (100.0%) |
Housing Structure by Heating Type in Medical Lake
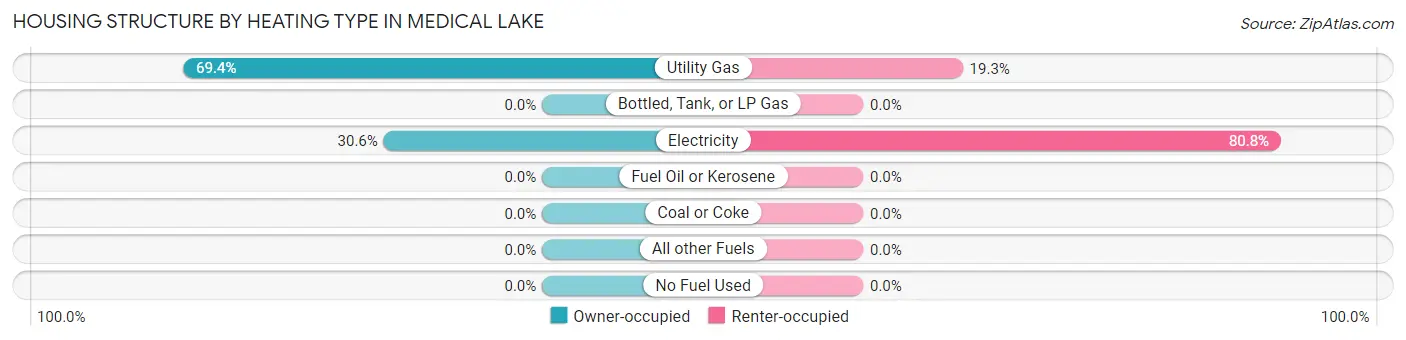
| Heating Type | Owner-occupied | Renter-occupied |
| Utility Gas | 872 (69.4%) | 97 (19.3%) |
| Bottled, Tank, or LP Gas | 0 (0.0%) | 0 (0.0%) |
| Electricity | 385 (30.6%) | 407 (80.7%) |
| Fuel Oil or Kerosene | 0 (0.0%) | 0 (0.0%) |
| Coal or Coke | 0 (0.0%) | 0 (0.0%) |
| All other Fuels | 0 (0.0%) | 0 (0.0%) |
| No Fuel Used | 0 (0.0%) | 0 (0.0%) |
| Total | 1,257 (100.0%) | 504 (100.0%) |
Household Vehicle Usage in Medical Lake
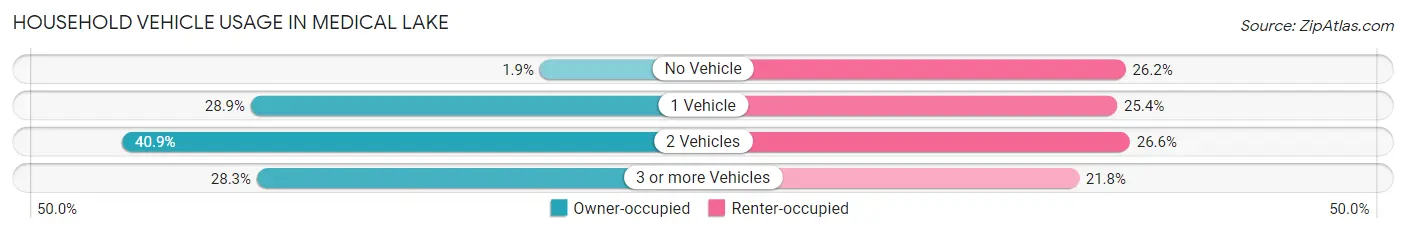
| Vehicles per Household | Owner-occupied | Renter-occupied |
| No Vehicle | 24 (1.9%) | 132 (26.2%) |
| 1 Vehicle | 363 (28.9%) | 128 (25.4%) |
| 2 Vehicles | 514 (40.9%) | 134 (26.6%) |
| 3 or more Vehicles | 356 (28.3%) | 110 (21.8%) |
| Total | 1,257 (100.0%) | 504 (100.0%) |
Real Estate & Mortgages in Medical Lake
Real Estate and Mortgage Overview in Medical Lake
| Characteristic | Without Mortgage | With Mortgage |
| Housing Units | 302 | 955 |
| Median Property Value | $251,700 | $291,700 |
| Median Household Income | $82,679 | $88 |
| Monthly Housing Costs | $500 | $58 |
| Real Estate Taxes | $2,304 | $17 |
Property Value by Mortgage Status in Medical Lake
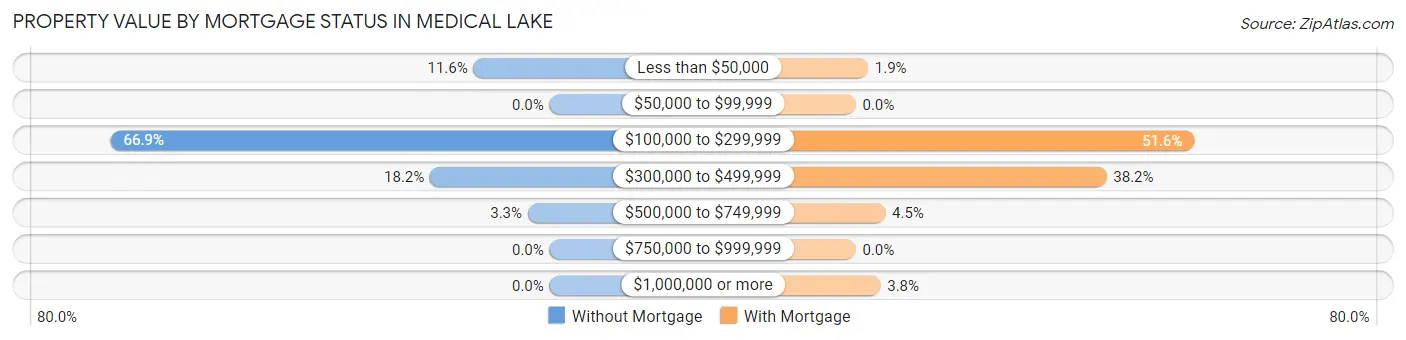
| Property Value | Without Mortgage | With Mortgage |
| Less than $50,000 | 35 (11.6%) | 18 (1.9%) |
| $50,000 to $99,999 | 0 (0.0%) | 0 (0.0%) |
| $100,000 to $299,999 | 202 (66.9%) | 493 (51.6%) |
| $300,000 to $499,999 | 55 (18.2%) | 365 (38.2%) |
| $500,000 to $749,999 | 10 (3.3%) | 43 (4.5%) |
| $750,000 to $999,999 | 0 (0.0%) | 0 (0.0%) |
| $1,000,000 or more | 0 (0.0%) | 36 (3.8%) |
| Total | 302 (100.0%) | 955 (100.0%) |
Household Income by Mortgage Status in Medical Lake
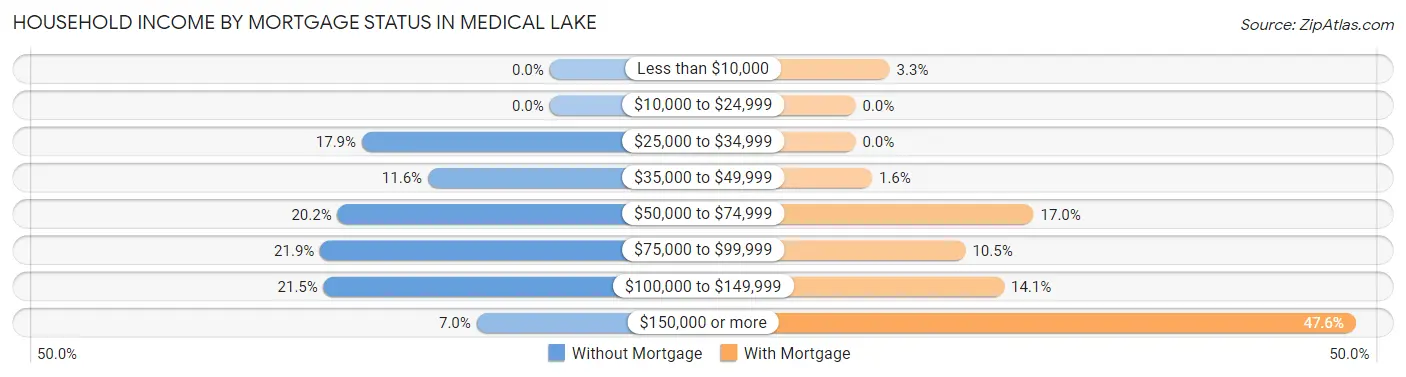
| Household Income | Without Mortgage | With Mortgage |
| Less than $10,000 | 0 (0.0%) | 31 (3.3%) |
| $10,000 to $24,999 | 0 (0.0%) | 0 (0.0%) |
| $25,000 to $34,999 | 54 (17.9%) | 0 (0.0%) |
| $35,000 to $49,999 | 35 (11.6%) | 15 (1.6%) |
| $50,000 to $74,999 | 61 (20.2%) | 162 (17.0%) |
| $75,000 to $99,999 | 66 (21.8%) | 100 (10.5%) |
| $100,000 to $149,999 | 65 (21.5%) | 135 (14.1%) |
| $150,000 or more | 21 (7.0%) | 455 (47.6%) |
| Total | 302 (100.0%) | 955 (100.0%) |
Property Value to Household Income Ratio in Medical Lake
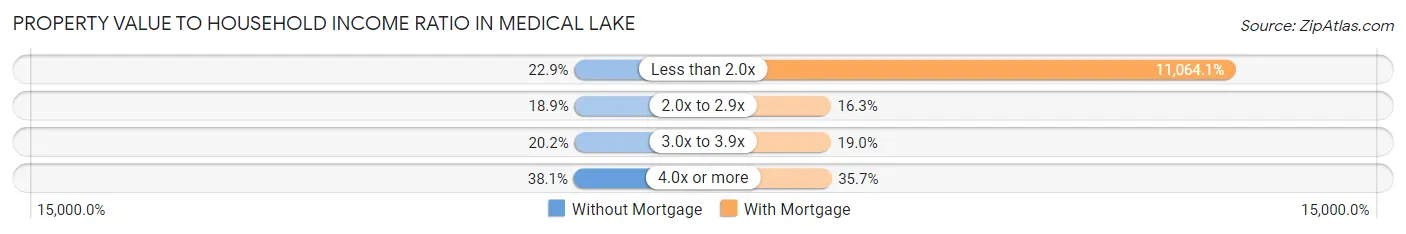
| Value-to-Income Ratio | Without Mortgage | With Mortgage |
| Less than 2.0x | 69 (22.9%) | 105,662 (11,064.1%) |
| 2.0x to 2.9x | 57 (18.9%) | 156 (16.3%) |
| 3.0x to 3.9x | 61 (20.2%) | 181 (19.0%) |
| 4.0x or more | 115 (38.1%) | 341 (35.7%) |
| Total | 302 (100.0%) | 955 (100.0%) |
Real Estate Taxes by Mortgage Status in Medical Lake
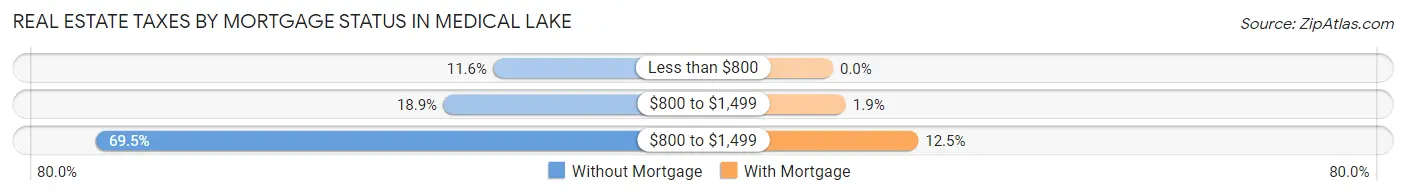
| Property Taxes | Without Mortgage | With Mortgage |
| Less than $800 | 35 (11.6%) | 0 (0.0%) |
| $800 to $1,499 | 57 (18.9%) | 18 (1.9%) |
| $800 to $1,499 | 210 (69.5%) | 119 (12.5%) |
| Total | 302 (100.0%) | 955 (100.0%) |
Health & Disability in Medical Lake
Health Insurance Coverage by Age in Medical Lake
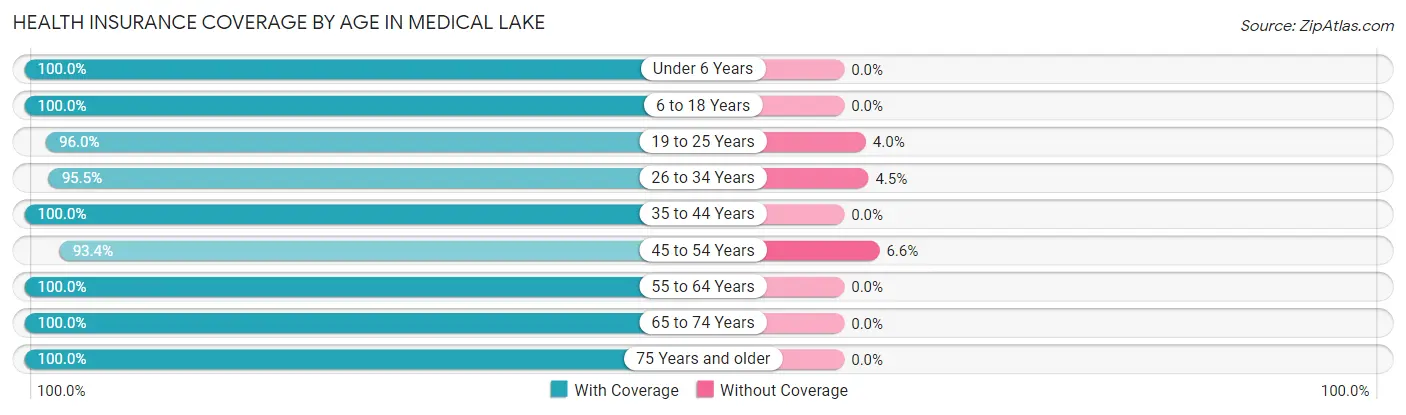
| Age Bracket | With Coverage | Without Coverage |
| Under 6 Years | 228 (100.0%) | 0 (0.0%) |
| 6 to 18 Years | 914 (100.0%) | 0 (0.0%) |
| 19 to 25 Years | 357 (96.0%) | 15 (4.0%) |
| 26 to 34 Years | 698 (95.5%) | 33 (4.5%) |
| 35 to 44 Years | 801 (100.0%) | 0 (0.0%) |
| 45 to 54 Years | 356 (93.4%) | 25 (6.6%) |
| 55 to 64 Years | 479 (100.0%) | 0 (0.0%) |
| 65 to 74 Years | 209 (100.0%) | 0 (0.0%) |
| 75 Years and older | 282 (100.0%) | 0 (0.0%) |
| Total | 4,324 (98.3%) | 73 (1.7%) |
Health Insurance Coverage by Citizenship Status in Medical Lake
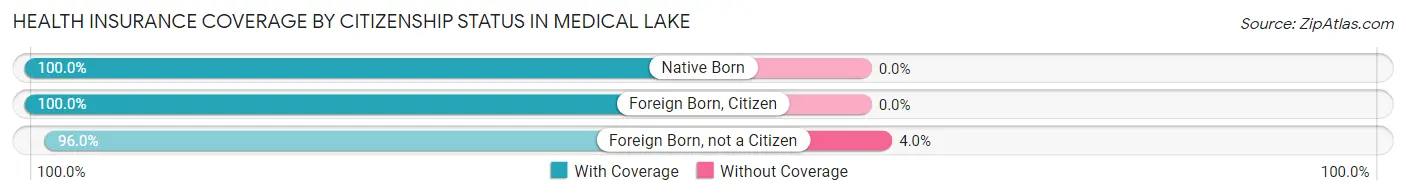
| Citizenship Status | With Coverage | Without Coverage |
| Native Born | 228 (100.0%) | 0 (0.0%) |
| Foreign Born, Citizen | 914 (100.0%) | 0 (0.0%) |
| Foreign Born, not a Citizen | 357 (96.0%) | 15 (4.0%) |
Health Insurance Coverage by Household Income in Medical Lake
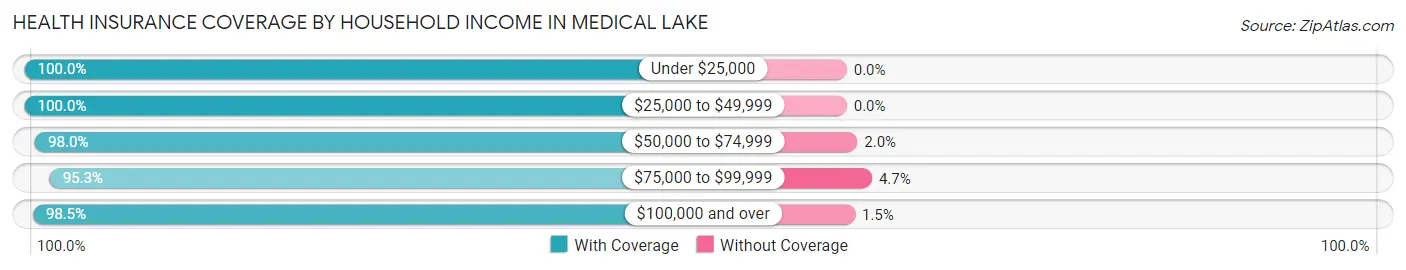
| Household Income | With Coverage | Without Coverage |
| Under $25,000 | 148 (100.0%) | 0 (0.0%) |
| $25,000 to $49,999 | 676 (100.0%) | 0 (0.0%) |
| $50,000 to $74,999 | 741 (98.0%) | 15 (2.0%) |
| $75,000 to $99,999 | 506 (95.3%) | 25 (4.7%) |
| $100,000 and over | 2,108 (98.5%) | 33 (1.5%) |
Public vs Private Health Insurance Coverage by Age in Medical Lake
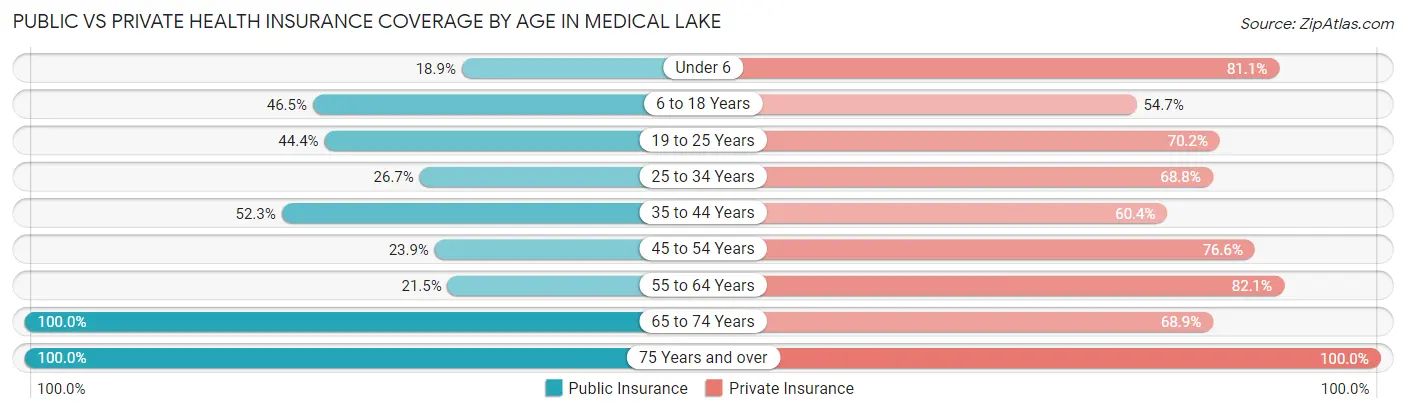
| Age Bracket | Public Insurance | Private Insurance |
| Under 6 | 43 (18.9%) | 185 (81.1%) |
| 6 to 18 Years | 425 (46.5%) | 500 (54.7%) |
| 19 to 25 Years | 165 (44.4%) | 261 (70.2%) |
| 25 to 34 Years | 195 (26.7%) | 503 (68.8%) |
| 35 to 44 Years | 419 (52.3%) | 484 (60.4%) |
| 45 to 54 Years | 91 (23.9%) | 292 (76.6%) |
| 55 to 64 Years | 103 (21.5%) | 393 (82.1%) |
| 65 to 74 Years | 209 (100.0%) | 144 (68.9%) |
| 75 Years and over | 282 (100.0%) | 282 (100.0%) |
| Total | 1,932 (43.9%) | 3,044 (69.2%) |
Disability Status by Sex by Age in Medical Lake
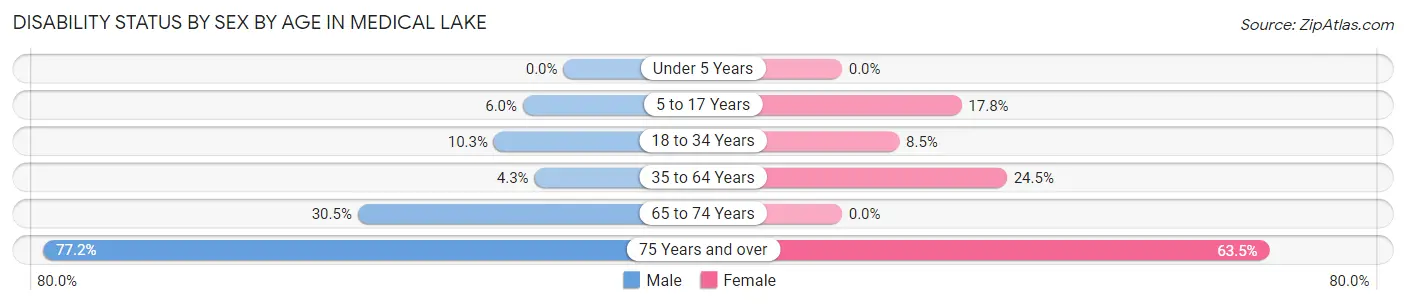
| Age Bracket | Male | Female |
| Under 5 Years | 0 (0.0%) | 0 (0.0%) |
| 5 to 17 Years | 37 (6.0%) | 57 (17.8%) |
| 18 to 34 Years | 57 (10.3%) | 49 (8.5%) |
| 35 to 64 Years | 31 (4.3%) | 230 (24.5%) |
| 65 to 74 Years | 29 (30.5%) | 0 (0.0%) |
| 75 Years and over | 112 (77.2%) | 87 (63.5%) |
Disability Class by Sex by Age in Medical Lake
Disability Class: Hearing Difficulty
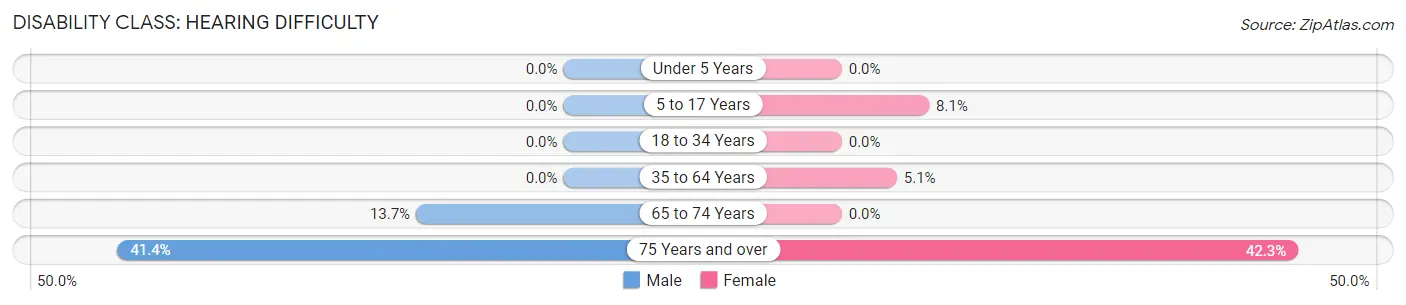
| Age Bracket | Male | Female |
| Under 5 Years | 0 (0.0%) | 0 (0.0%) |
| 5 to 17 Years | 0 (0.0%) | 26 (8.1%) |
| 18 to 34 Years | 0 (0.0%) | 0 (0.0%) |
| 35 to 64 Years | 0 (0.0%) | 48 (5.1%) |
| 65 to 74 Years | 13 (13.7%) | 0 (0.0%) |
| 75 Years and over | 60 (41.4%) | 58 (42.3%) |
Disability Class: Vision Difficulty
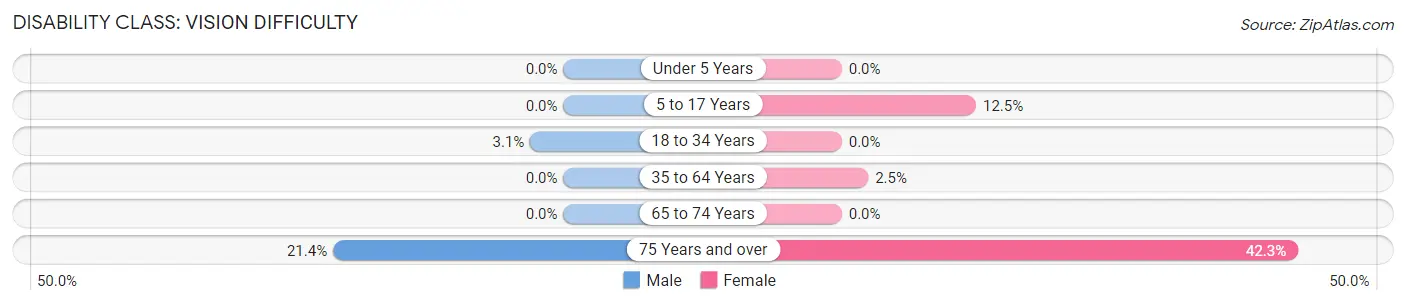
| Age Bracket | Male | Female |
| Under 5 Years | 0 (0.0%) | 0 (0.0%) |
| 5 to 17 Years | 0 (0.0%) | 40 (12.5%) |
| 18 to 34 Years | 17 (3.1%) | 0 (0.0%) |
| 35 to 64 Years | 0 (0.0%) | 23 (2.5%) |
| 65 to 74 Years | 0 (0.0%) | 0 (0.0%) |
| 75 Years and over | 31 (21.4%) | 58 (42.3%) |
Disability Class: Cognitive Difficulty
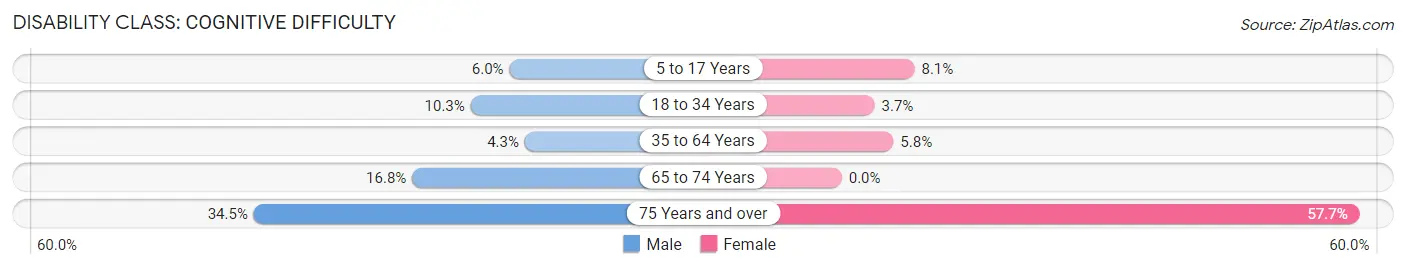
| Age Bracket | Male | Female |
| 5 to 17 Years | 37 (6.0%) | 26 (8.1%) |
| 18 to 34 Years | 57 (10.3%) | 21 (3.6%) |
| 35 to 64 Years | 31 (4.3%) | 54 (5.8%) |
| 65 to 74 Years | 16 (16.8%) | 0 (0.0%) |
| 75 Years and over | 50 (34.5%) | 79 (57.7%) |
Disability Class: Ambulatory Difficulty
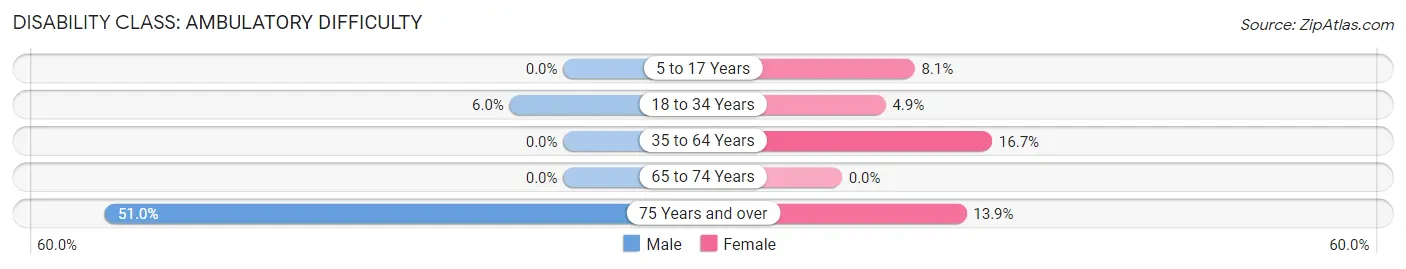
| Age Bracket | Male | Female |
| 5 to 17 Years | 0 (0.0%) | 26 (8.1%) |
| 18 to 34 Years | 33 (6.0%) | 28 (4.9%) |
| 35 to 64 Years | 0 (0.0%) | 157 (16.7%) |
| 65 to 74 Years | 0 (0.0%) | 0 (0.0%) |
| 75 Years and over | 74 (51.0%) | 19 (13.9%) |
Disability Class: Self-Care Difficulty
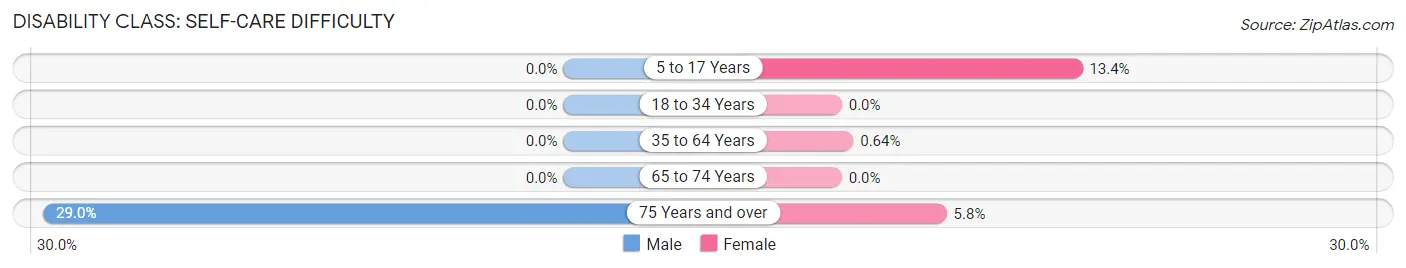
| Age Bracket | Male | Female |
| 5 to 17 Years | 0 (0.0%) | 43 (13.4%) |
| 18 to 34 Years | 0 (0.0%) | 0 (0.0%) |
| 35 to 64 Years | 0 (0.0%) | 6 (0.6%) |
| 65 to 74 Years | 0 (0.0%) | 0 (0.0%) |
| 75 Years and over | 42 (29.0%) | 8 (5.8%) |
Technology Access in Medical Lake
Computing Device Access in Medical Lake
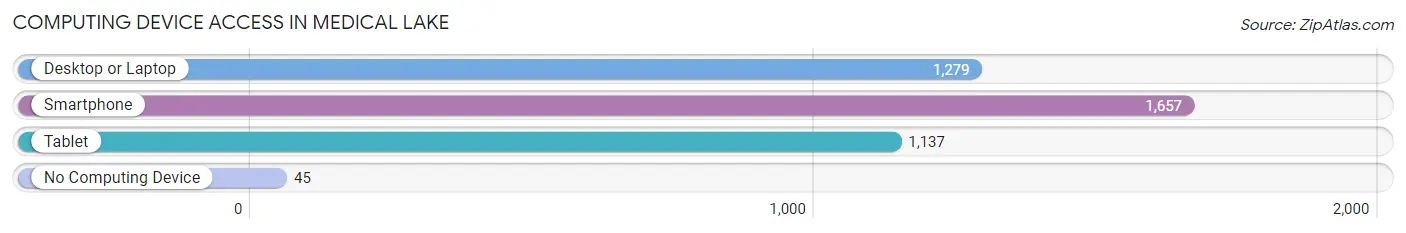
| Device Type | # Households | % Households |
| Desktop or Laptop | 1,279 | 72.6% |
| Smartphone | 1,657 | 94.1% |
| Tablet | 1,137 | 64.6% |
| No Computing Device | 45 | 2.6% |
| Total | 1,761 | 100.0% |
Internet Access in Medical Lake
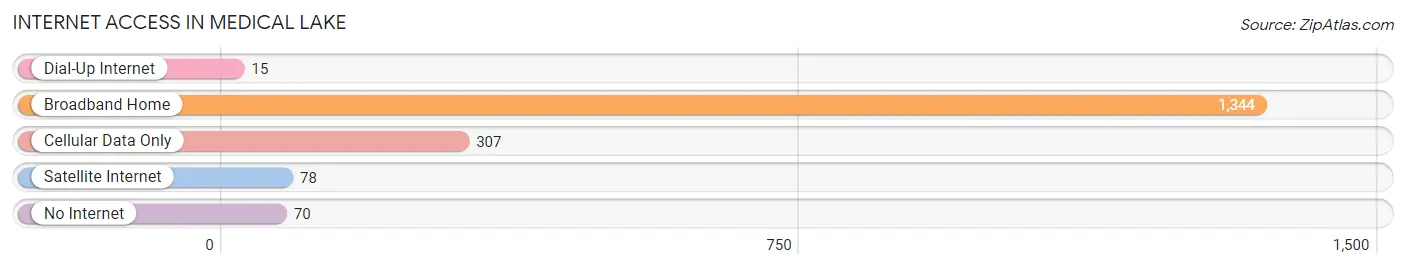
| Internet Type | # Households | % Households |
| Dial-Up Internet | 15 | 0.9% |
| Broadband Home | 1,344 | 76.3% |
| Cellular Data Only | 307 | 17.4% |
| Satellite Internet | 78 | 4.4% |
| No Internet | 70 | 4.0% |
| Total | 1,761 | 100.0% |
Medical Lake Summary
History
Medical Lake is a city located in Spokane County, Washington, United States. The population was 4,814 at the 2010 census. The city is located on the eastern shore of Medical Lake, a natural lake that was named for the medicinal properties of its waters. The lake was used by Native Americans for centuries before the arrival of European settlers.
The first European settlers arrived in the area in the late 1850s. The town was officially incorporated in 1891. The city was named for the lake, which was named for its medicinal properties. The lake was used by Native Americans for centuries before the arrival of European settlers.
The city was originally a farming community, but in the early 1900s, it became a popular resort destination. The city was home to several resorts, including the Medical Lake Hotel, which was built in 1906. The hotel was a popular destination for visitors from Spokane and other nearby cities.
The city was also home to a military base, Fairchild Air Force Base, which was established in 1942. The base was a major employer in the area and provided a significant boost to the local economy. The base was closed in 1994, but the city has since seen a resurgence in economic activity.
Geography
Medical Lake is located in Spokane County, Washington, United States. The city is located on the eastern shore of Medical Lake, a natural lake that was named for the medicinal properties of its waters. The lake is approximately 3.5 miles long and 1.5 miles wide. The city is located approximately 10 miles west of Spokane and is part of the Spokane Metropolitan Statistical Area.
The city has a total area of 4.2 square miles, of which 4.1 square miles is land and 0.1 square miles is water. The city is located at an elevation of 2,093 feet above sea level.
Economy
Medical Lake is a small city with a population of just over 4,800 people. The city is home to several businesses, including a variety of retail stores, restaurants, and medical facilities. The city is also home to several manufacturing companies, including a paper mill and a metal fabrication plant.
The city is also home to Fairchild Air Force Base, which was established in 1942 and closed in 1994. The base was a major employer in the area and provided a significant boost to the local economy. The base is now home to a variety of businesses, including a golf course, a hotel, and a conference center.
Demographics
As of the 2010 census, there were 4,814 people, 1,845 households, and 1,220 families residing in the city. The population density was 1,164.3 people per square mile. The racial makeup of the city was 90.2% White, 0.7% African American, 1.2% Native American, 0.7% Asian, 0.1% Pacific Islander, 4.2% from other races, and 2.9% from two or more races. Hispanic or Latino of any race were 8.2% of the population.
The median income for a household in the city was $41,944, and the median income for a family was $50,938. The per capita income for the city was $20,845. About 11.2% of families and 14.2% of the population were below the poverty line, including 19.2% of those under age 18 and 8.2% of those age 65 or over.
Common Questions
What is Per Capita Income in Medical Lake?
Per Capita income in Medical Lake is $30,284.
What is the Median Family Income in Medical Lake?
Median Family Income in Medical Lake is $100,393.
What is the Median Household income in Medical Lake?
Median Household Income in Medical Lake is $73,456.
What is Income or Wage Gap in Medical Lake?
Income or Wage Gap in Medical Lake is 26.6%.
Women in Medical Lake earn 73.4 cents for every dollar earned by a man.
What is Inequality or Gini Index in Medical Lake?
Inequality or Gini Index in Medical Lake is 0.31.
What is the Total Population of Medical Lake?
Total Population of Medical Lake is 4,909.
What is the Total Male Population of Medical Lake?
Total Male Population of Medical Lake is 2,569.
What is the Total Female Population of Medical Lake?
Total Female Population of Medical Lake is 2,340.
What is the Ratio of Males per 100 Females in Medical Lake?
There are 109.79 Males per 100 Females in Medical Lake.
What is the Ratio of Females per 100 Males in Medical Lake?
There are 91.09 Females per 100 Males in Medical Lake.
What is the Median Population Age in Medical Lake?
Median Population Age in Medical Lake is 36.1 Years.
What is the Average Family Size in Medical Lake
Average Family Size in Medical Lake is 3.1 People.
What is the Average Household Size in Medical Lake
Average Household Size in Medical Lake is 2.5 People.
How Large is the Labor Force in Medical Lake?
There are 2,123 People in the Labor Forcein in Medical Lake.
What is the Percentage of People in the Labor Force in Medical Lake?
53.0% of People are in the Labor Force in Medical Lake.
What is the Unemployment Rate in Medical Lake?
Unemployment Rate in Medical Lake is 4.5%.