Mount Vista, WA Map & Demographics
Mount Vista Map
Mount Vista Overview
$48,750
PER CAPITA INCOME
$123,177
AVG FAMILY INCOME
$103,264
AVG HOUSEHOLD INCOME
27.4%
WAGE / INCOME GAP [ % ]
72.6¢/ $1
WAGE / INCOME GAP [ $ ]
$10,759
FAMILY INCOME DEFICIT
0.37
INEQUALITY / GINI INDEX
10,399
TOTAL POPULATION
5,346
MALE POPULATION
5,053
FEMALE POPULATION
105.80
MALES / 100 FEMALES
94.52
FEMALES / 100 MALES
40.4
MEDIAN AGE
3.0
AVG FAMILY SIZE
2.6
AVG HOUSEHOLD SIZE
5,123
LABOR FORCE [ PEOPLE ]
62.7%
PERCENT IN LABOR FORCE
2.9%
UNEMPLOYMENT RATE
Income in Mount Vista
Income Overview in Mount Vista
Per Capita Income in Mount Vista is $48,750, while median incomes of families and households are $123,177 and $103,264 respectively.
| Characteristic | Number | Measure |
| Per Capita Income | 10,399 | $48,750 |
| Median Family Income | 2,835 | $123,177 |
| Mean Family Income | 2,835 | $140,758 |
| Median Household Income | 4,014 | $103,264 |
| Mean Household Income | 4,014 | $124,857 |
| Income Deficit | 2,835 | $10,759 |
| Wage / Income Gap (%) | 10,399 | 27.39% |
| Wage / Income Gap ($) | 10,399 | 72.61¢ per $1 |
| Gini / Inequality Index | 10,399 | 0.37 |
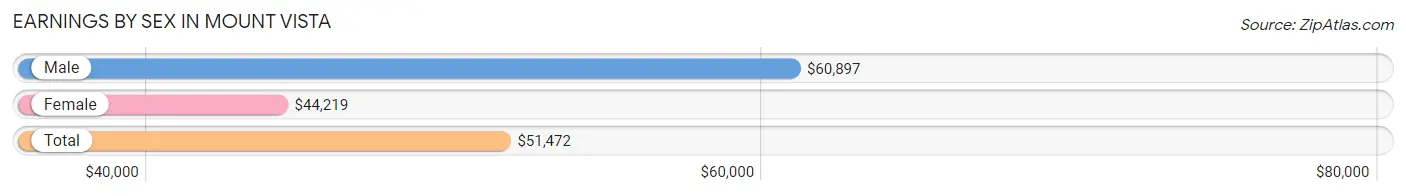
Earnings by Sex in Mount Vista
Average Earnings in Mount Vista are $51,472, $60,897 for men and $44,219 for women, a difference of 27.4%.
| Sex | Number | Average Earnings |
| Male | 3,135 (56.4%) | $60,897 |
| Female | 2,428 (43.6%) | $44,219 |
| Total | 5,563 (100.0%) | $51,472 |
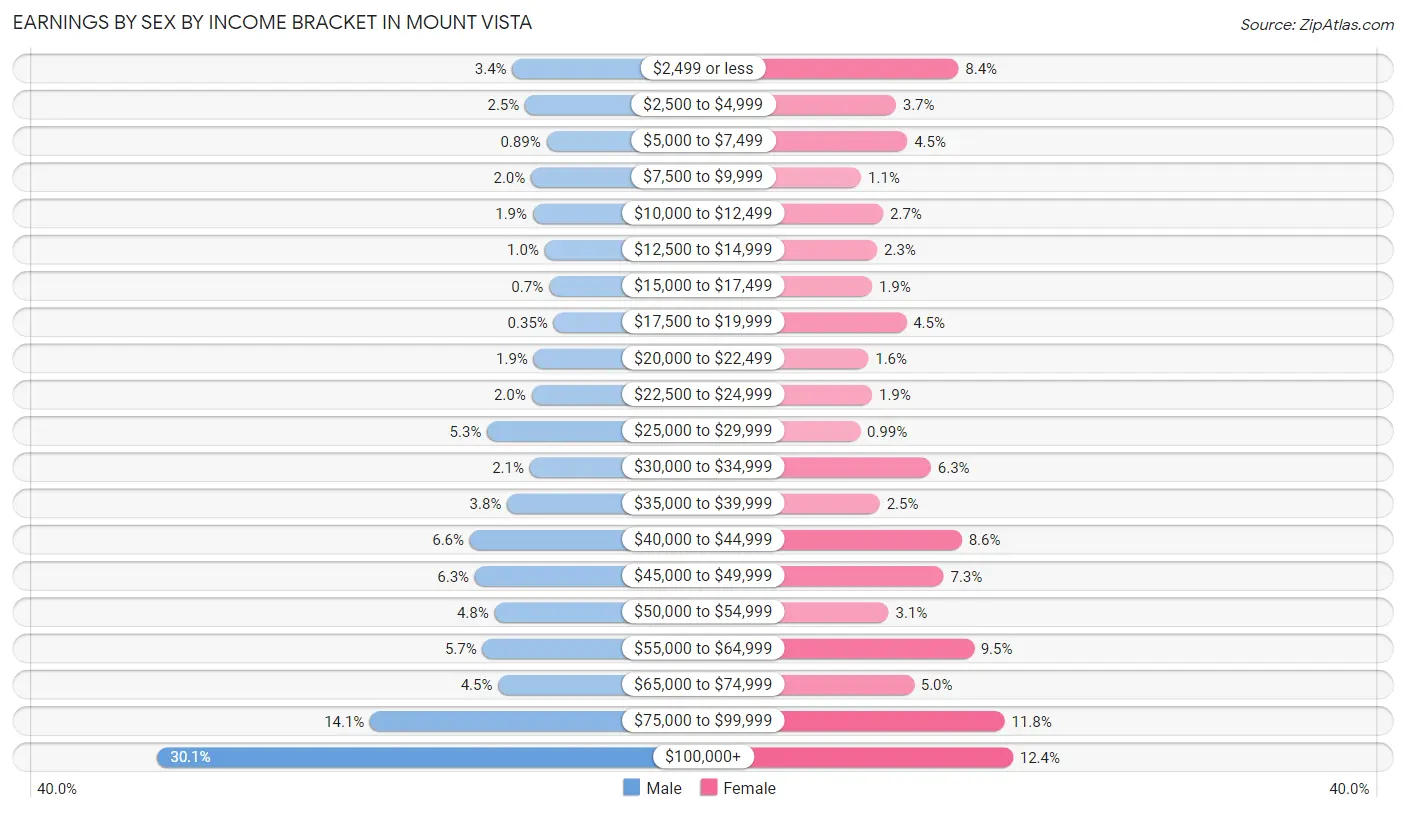
Earnings by Sex by Income Bracket in Mount Vista
The most common earnings brackets in Mount Vista are $100,000+ for men (942 | 30.0%) and $100,000+ for women (302 | 12.4%).
| Income | Male | Female |
| $2,499 or less | 108 (3.4%) | 203 (8.4%) |
| $2,500 to $4,999 | 78 (2.5%) | 89 (3.7%) |
| $5,000 to $7,499 | 28 (0.9%) | 110 (4.5%) |
| $7,500 to $9,999 | 64 (2.0%) | 26 (1.1%) |
| $10,000 to $12,499 | 60 (1.9%) | 66 (2.7%) |
| $12,500 to $14,999 | 32 (1.0%) | 55 (2.3%) |
| $15,000 to $17,499 | 22 (0.7%) | 46 (1.9%) |
| $17,500 to $19,999 | 11 (0.4%) | 108 (4.4%) |
| $20,000 to $22,499 | 58 (1.8%) | 39 (1.6%) |
| $22,500 to $24,999 | 63 (2.0%) | 46 (1.9%) |
| $25,000 to $29,999 | 167 (5.3%) | 24 (1.0%) |
| $30,000 to $34,999 | 67 (2.1%) | 153 (6.3%) |
| $35,000 to $39,999 | 120 (3.8%) | 60 (2.5%) |
| $40,000 to $44,999 | 208 (6.6%) | 209 (8.6%) |
| $45,000 to $49,999 | 196 (6.2%) | 176 (7.2%) |
| $50,000 to $54,999 | 150 (4.8%) | 76 (3.1%) |
| $55,000 to $64,999 | 178 (5.7%) | 231 (9.5%) |
| $65,000 to $74,999 | 141 (4.5%) | 122 (5.0%) |
| $75,000 to $99,999 | 442 (14.1%) | 287 (11.8%) |
| $100,000+ | 942 (30.0%) | 302 (12.4%) |
| Total | 3,135 (100.0%) | 2,428 (100.0%) |
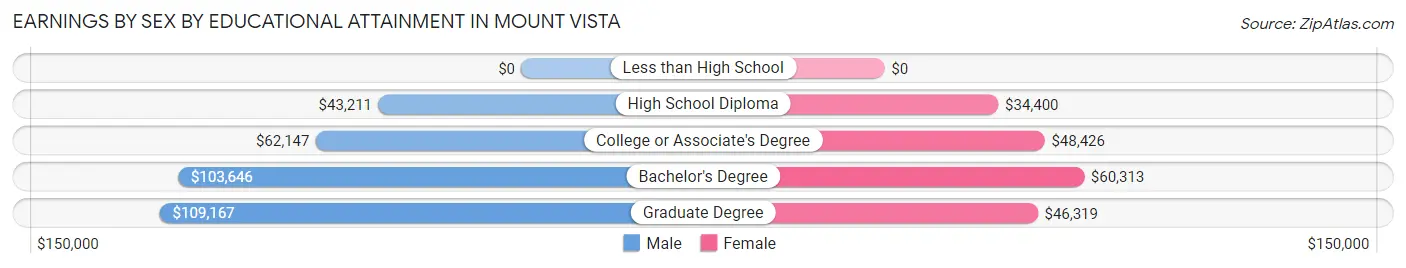
Earnings by Sex by Educational Attainment in Mount Vista
Average earnings in Mount Vista are $77,304 for men and $48,117 for women, a difference of 37.8%. Men with an educational attainment of graduate degree enjoy the highest average annual earnings of $109,167, while those with high school diploma education earn the least with $43,211. Women with an educational attainment of bachelor's degree earn the most with the average annual earnings of $60,313, while those with high school diploma education have the smallest earnings of $34,400.
| Educational Attainment | Male Income | Female Income |
| Less than High School | - | - |
| High School Diploma | $43,211 | $34,400 |
| College or Associate's Degree | $62,147 | $48,426 |
| Bachelor's Degree | $103,646 | $60,313 |
| Graduate Degree | $109,167 | $46,319 |
| Total | $77,304 | $48,117 |
Family Income in Mount Vista
Family Income Brackets in Mount Vista
According to the Mount Vista family income data, there are 706 families falling into the $200,000+ income range, which is the most common income bracket and makes up 24.9% of all families. Conversely, the $10,000 to $14,999 income bracket is the least frequent group with only 11 families (0.4%) belonging to this category.
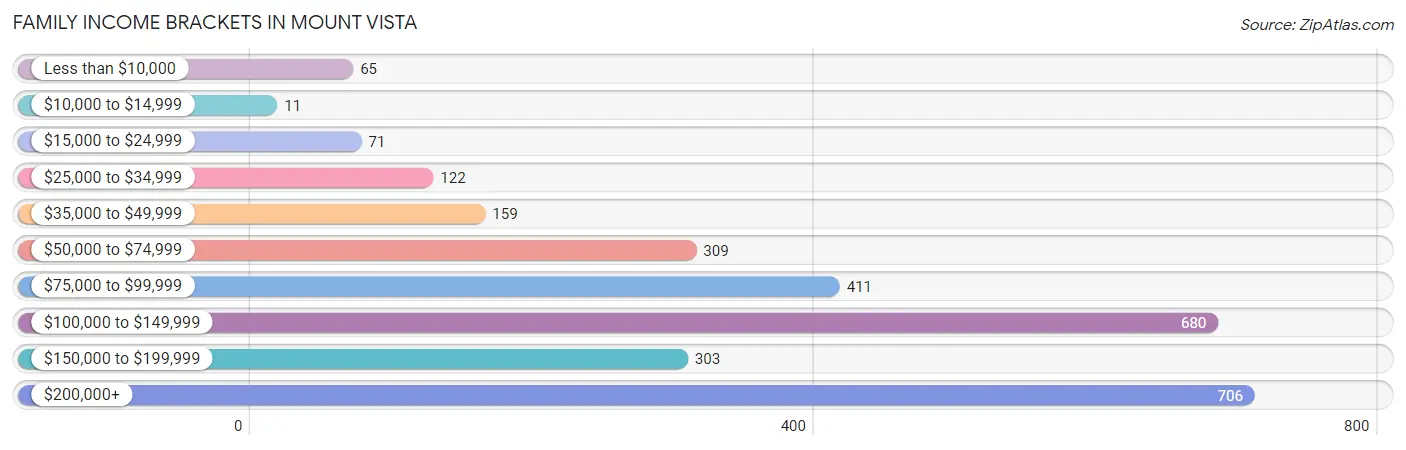
| Income Bracket | # Families | % Families |
| Less than $10,000 | 65 | 2.3% |
| $10,000 to $14,999 | 11 | 0.4% |
| $15,000 to $24,999 | 71 | 2.5% |
| $25,000 to $34,999 | 122 | 4.3% |
| $35,000 to $49,999 | 159 | 5.6% |
| $50,000 to $74,999 | 309 | 10.9% |
| $75,000 to $99,999 | 411 | 14.5% |
| $100,000 to $149,999 | 680 | 24.0% |
| $150,000 to $199,999 | 303 | 10.7% |
| $200,000+ | 706 | 24.9% |
Family Income by Famaliy Size in Mount Vista
4-person families (547 | 19.3%) account for the highest median family income in Mount Vista with $156,553 per family, while 2-person families (1,407 | 49.6%) have the highest median income of $54,078 per family member.
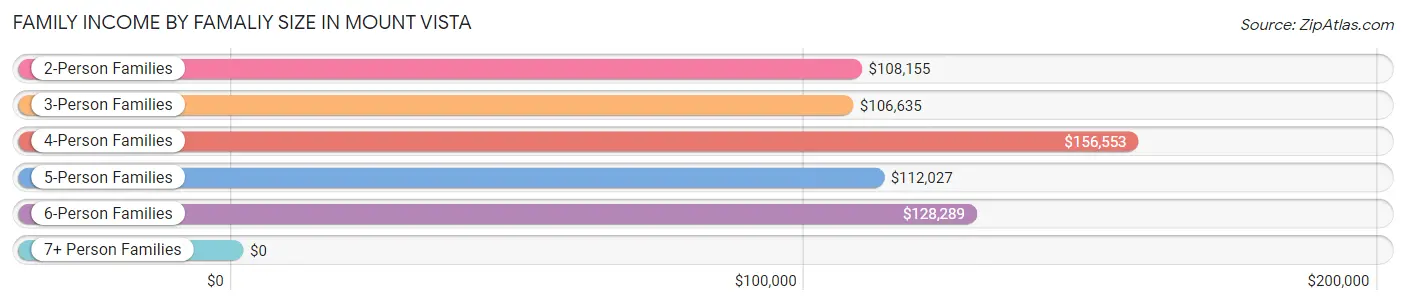
| Income Bracket | # Families | Median Income |
| 2-Person Families | 1,407 (49.6%) | $108,155 |
| 3-Person Families | 585 (20.6%) | $106,635 |
| 4-Person Families | 547 (19.3%) | $156,553 |
| 5-Person Families | 174 (6.1%) | $112,027 |
| 6-Person Families | 110 (3.9%) | $128,289 |
| 7+ Person Families | 12 (0.4%) | $0 |
| Total | 2,835 (100.0%) | $123,177 |
Family Income by Number of Earners in Mount Vista
The median family income in Mount Vista is $123,177, with families comprising 2 earners (1,255) having the highest median family income of $162,330, while families with no earners (472) have the lowest median family income of $77,381, accounting for 44.3% and 16.7% of families, respectively.
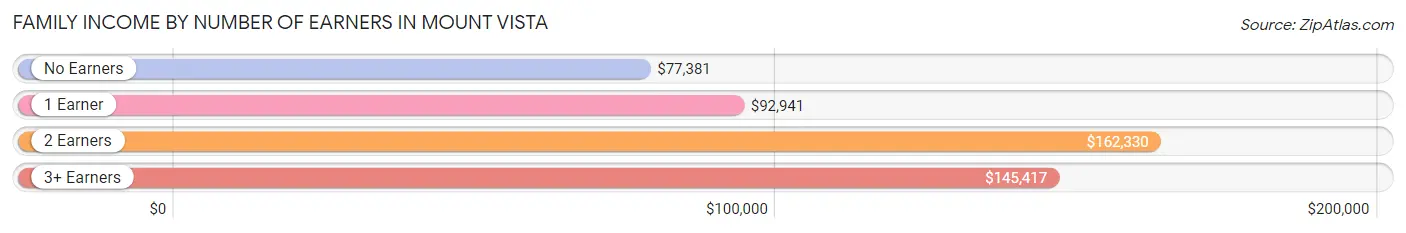
| Number of Earners | # Families | Median Income |
| No Earners | 472 (16.7%) | $77,381 |
| 1 Earner | 876 (30.9%) | $92,941 |
| 2 Earners | 1,255 (44.3%) | $162,330 |
| 3+ Earners | 232 (8.2%) | $145,417 |
| Total | 2,835 (100.0%) | $123,177 |
Household Income in Mount Vista
Household Income Brackets in Mount Vista
With 967 households falling in the category, the $100,000 to $149,999 income range is the most frequent in Mount Vista, accounting for 24.1% of all households. In contrast, only 12 households (0.3%) fall into the $10,000 to $14,999 income bracket, making it the least populous group.
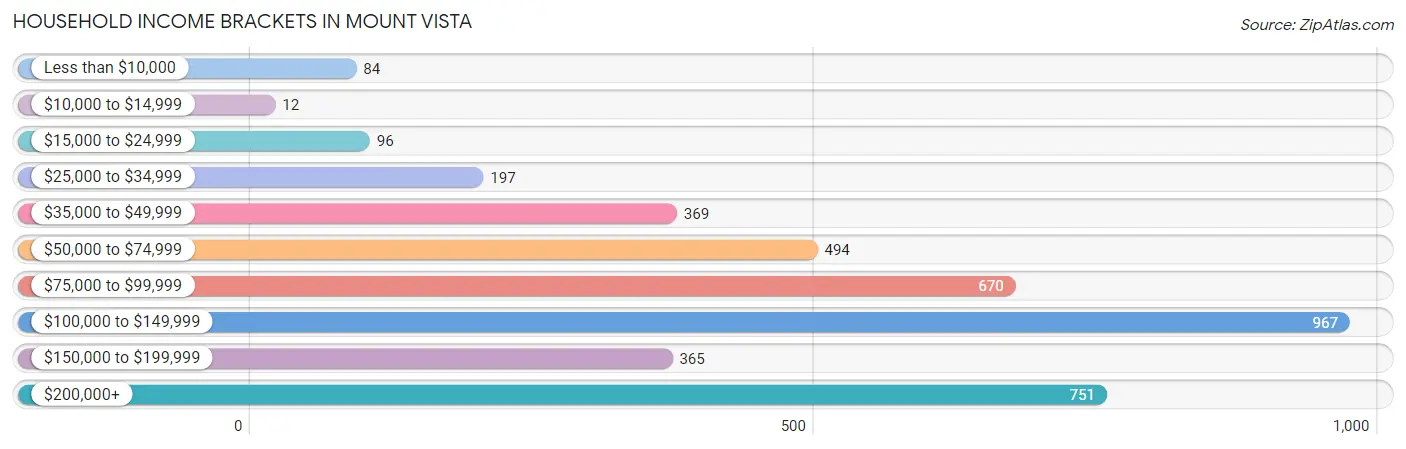
| Income Bracket | # Households | % Households |
| Less than $10,000 | 84 | 2.1% |
| $10,000 to $14,999 | 12 | 0.3% |
| $15,000 to $24,999 | 96 | 2.4% |
| $25,000 to $34,999 | 197 | 4.9% |
| $35,000 to $49,999 | 369 | 9.2% |
| $50,000 to $74,999 | 494 | 12.3% |
| $75,000 to $99,999 | 670 | 16.7% |
| $100,000 to $149,999 | 967 | 24.1% |
| $150,000 to $199,999 | 365 | 9.1% |
| $200,000+ | 751 | 18.7% |
Household Income by Householder Age in Mount Vista
The median household income in Mount Vista is $103,264, with the highest median household income of $135,143 found in the 45 to 64 years age bracket for the primary householder. A total of 1,689 households (42.1%) fall into this category. Meanwhile, the 65+ years age bracket for the primary householder has the lowest median household income of $74,679, with 1,084 households (27.0%) in this group.
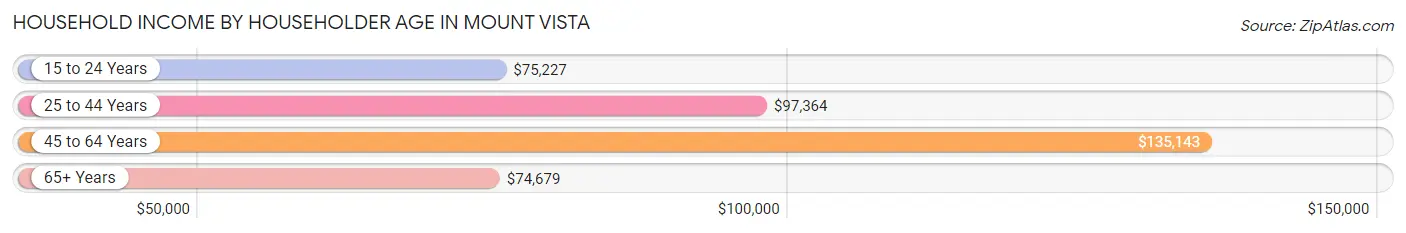
| Income Bracket | # Households | Median Income |
| 15 to 24 Years | 94 (2.3%) | $75,227 |
| 25 to 44 Years | 1,147 (28.6%) | $97,364 |
| 45 to 64 Years | 1,689 (42.1%) | $135,143 |
| 65+ Years | 1,084 (27.0%) | $74,679 |
| Total | 4,014 (100.0%) | $103,264 |
Poverty in Mount Vista
Income Below Poverty by Sex and Age in Mount Vista
With 3.2% poverty level for males and 6.0% for females among the residents of Mount Vista, 18 to 24 year old males and 5 year old females are the most vulnerable to poverty, with 52 males (10.5%) and 36 females (46.8%) in their respective age groups living below the poverty level.
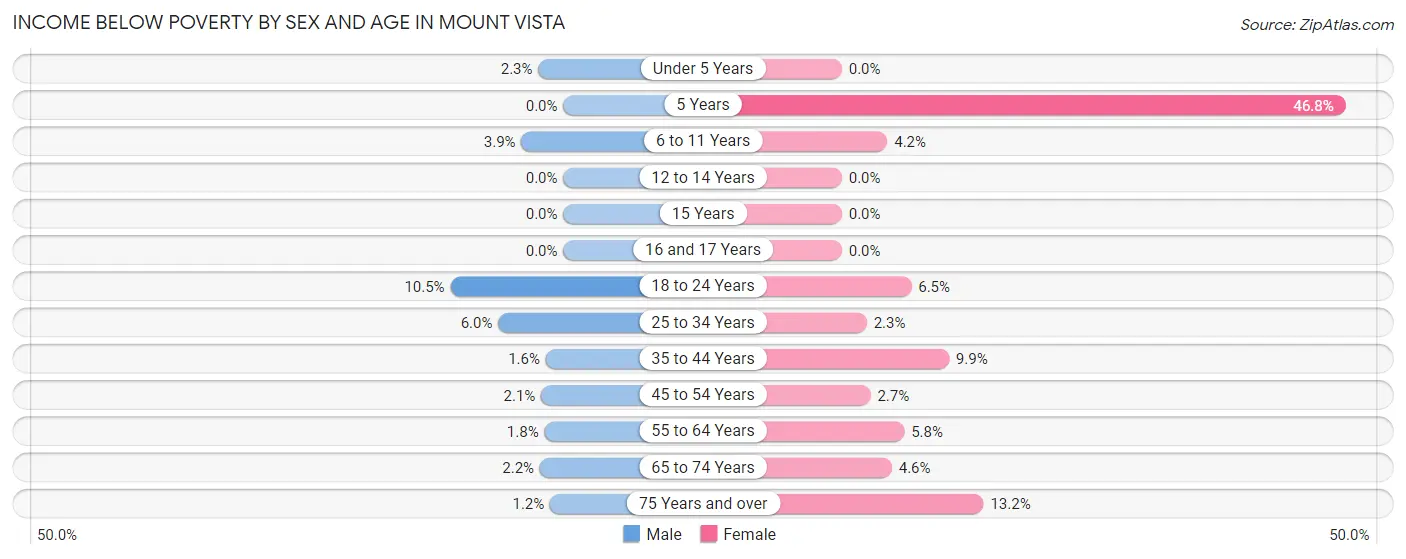
| Age Bracket | Male | Female |
| Under 5 Years | 11 (2.3%) | 0 (0.0%) |
| 5 Years | 0 (0.0%) | 36 (46.8%) |
| 6 to 11 Years | 13 (3.9%) | 18 (4.2%) |
| 12 to 14 Years | 0 (0.0%) | 0 (0.0%) |
| 15 Years | 0 (0.0%) | 0 (0.0%) |
| 16 and 17 Years | 0 (0.0%) | 0 (0.0%) |
| 18 to 24 Years | 52 (10.5%) | 18 (6.5%) |
| 25 to 34 Years | 42 (6.0%) | 12 (2.3%) |
| 35 to 44 Years | 9 (1.6%) | 69 (9.9%) |
| 45 to 54 Years | 20 (2.1%) | 19 (2.7%) |
| 55 to 64 Years | 8 (1.8%) | 35 (5.8%) |
| 65 to 74 Years | 9 (2.2%) | 27 (4.6%) |
| 75 Years and over | 5 (1.2%) | 66 (13.2%) |
| Total | 169 (3.2%) | 300 (6.0%) |
Income Above Poverty by Sex and Age in Mount Vista
According to the poverty statistics in Mount Vista, males aged 5 years and females aged under 5 years are the age groups that are most secure financially, with 100.0% of males and 100.0% of females in these age groups living above the poverty line.
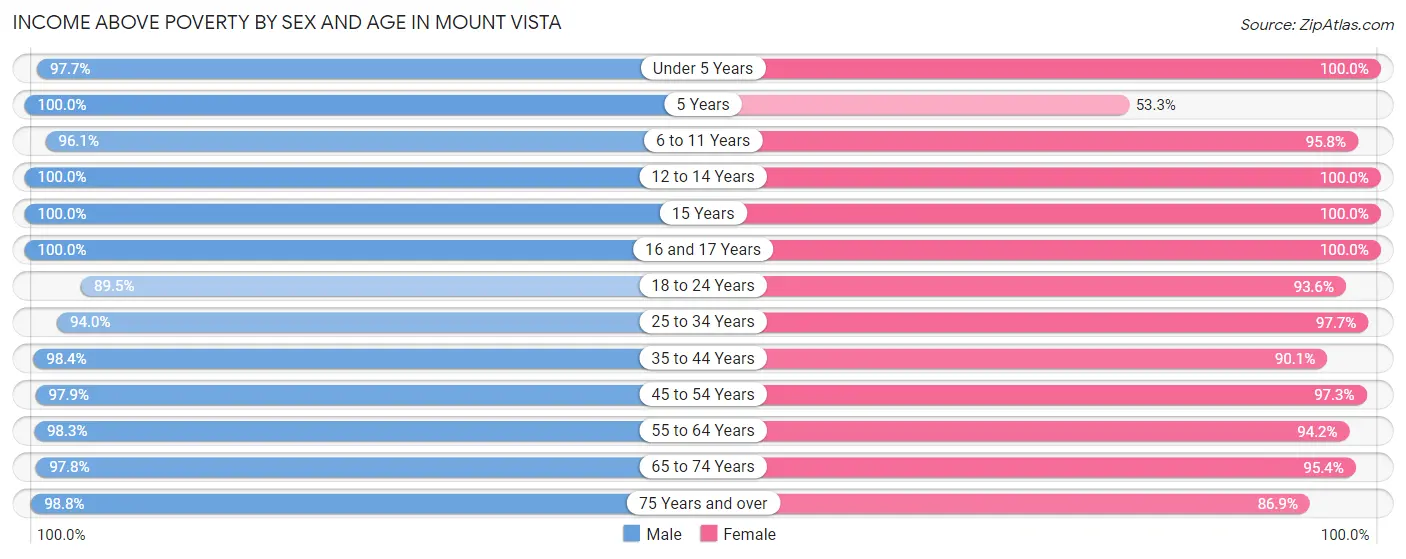
| Age Bracket | Male | Female |
| Under 5 Years | 463 (97.7%) | 224 (100.0%) |
| 5 Years | 121 (100.0%) | 41 (53.2%) |
| 6 to 11 Years | 321 (96.1%) | 409 (95.8%) |
| 12 to 14 Years | 161 (100.0%) | 185 (100.0%) |
| 15 Years | 56 (100.0%) | 100 (100.0%) |
| 16 and 17 Years | 126 (100.0%) | 123 (100.0%) |
| 18 to 24 Years | 444 (89.5%) | 261 (93.5%) |
| 25 to 34 Years | 653 (94.0%) | 507 (97.7%) |
| 35 to 44 Years | 544 (98.4%) | 625 (90.1%) |
| 45 to 54 Years | 951 (97.9%) | 696 (97.3%) |
| 55 to 64 Years | 449 (98.3%) | 569 (94.2%) |
| 65 to 74 Years | 406 (97.8%) | 555 (95.4%) |
| 75 Years and over | 403 (98.8%) | 436 (86.9%) |
| Total | 5,098 (96.8%) | 4,731 (94.0%) |
Income Below Poverty Among Married-Couple Families in Mount Vista
The poverty statistics for married-couple families in Mount Vista show that 1.7% or 36 of the total 2,124 families live below the poverty line. Families with 3 or 4 children have the highest poverty rate of 5.8%, comprising of 9 families. On the other hand, families with 1 or 2 children have the lowest poverty rate of 0.5%, which includes 3 families.
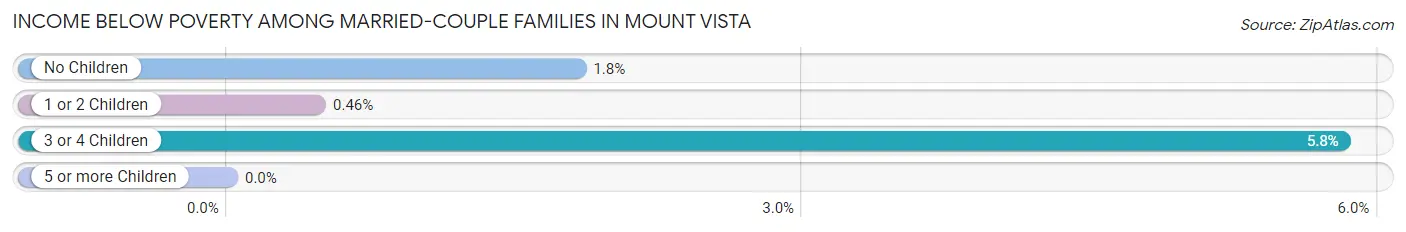
| Children | Above Poverty | Below Poverty |
| No Children | 1,293 (98.2%) | 24 (1.8%) |
| 1 or 2 Children | 649 (99.5%) | 3 (0.5%) |
| 3 or 4 Children | 146 (94.2%) | 9 (5.8%) |
| 5 or more Children | 0 (0.0%) | 0 (0.0%) |
| Total | 2,088 (98.3%) | 36 (1.7%) |
Income Below Poverty Among Single-Parent Households in Mount Vista
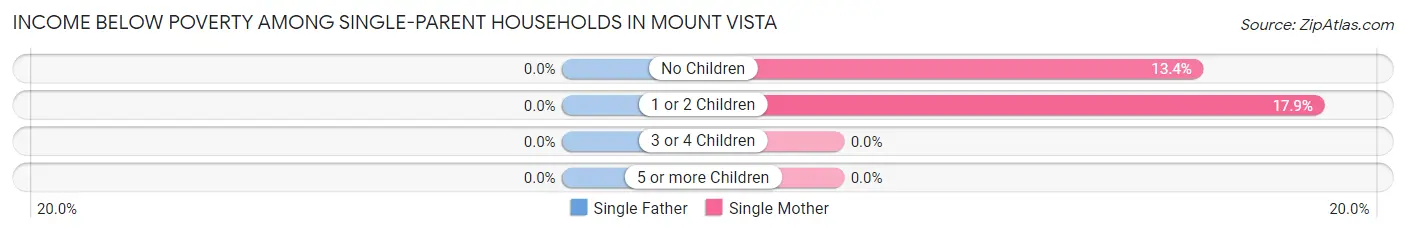
| Children | Single Father | Single Mother |
| No Children | 0 (0.0%) | 22 (13.4%) |
| 1 or 2 Children | 0 (0.0%) | 43 (17.9%) |
| 3 or 4 Children | 0 (0.0%) | 0 (0.0%) |
| 5 or more Children | 0 (0.0%) | 0 (0.0%) |
| Total | 0 (0.0%) | 65 (14.8%) |
Income Below Poverty Among Married-Couple vs Single-Parent Households in Mount Vista
The poverty data for Mount Vista shows that 36 of the married-couple family households (1.7%) and 65 of the single-parent households (9.1%) are living below the poverty level. Within the married-couple family households, those with 3 or 4 children have the highest poverty rate, with 9 households (5.8%) falling below the poverty line. Among the single-parent households, those with 1 or 2 children have the highest poverty rate, with 43 household (10.6%) living below poverty.
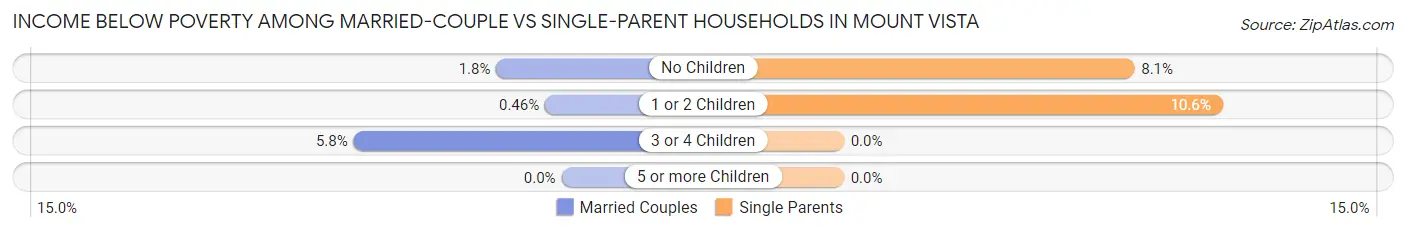
| Children | Married-Couple Families | Single-Parent Households |
| No Children | 24 (1.8%) | 22 (8.1%) |
| 1 or 2 Children | 3 (0.5%) | 43 (10.6%) |
| 3 or 4 Children | 9 (5.8%) | 0 (0.0%) |
| 5 or more Children | 0 (0.0%) | 0 (0.0%) |
| Total | 36 (1.7%) | 65 (9.1%) |
Race in Mount Vista
The most populous races in Mount Vista are White / Caucasian (8,230 | 79.1%), Two or more Races (1,058 | 10.2%), and Hispanic or Latino (815 | 7.8%).
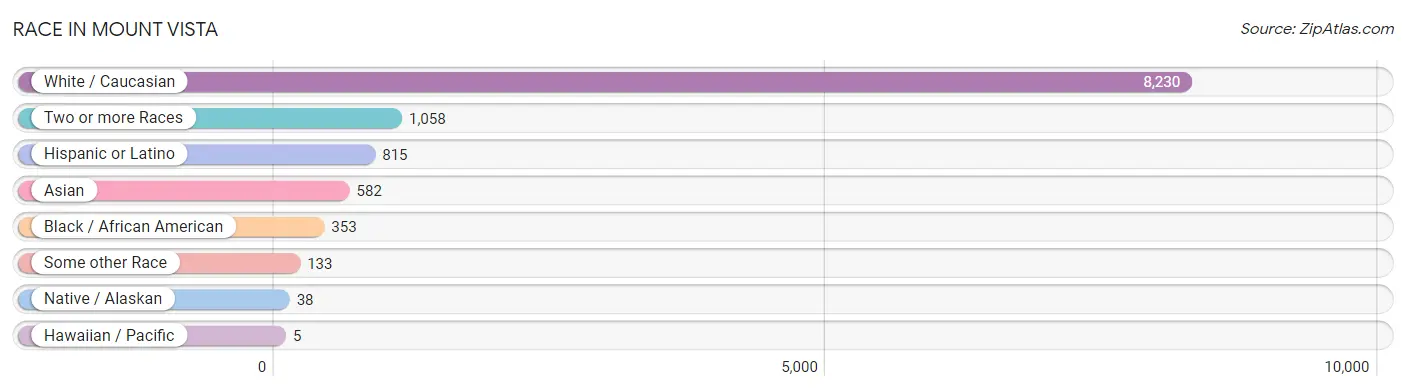
| Race | # Population | % Population |
| Asian | 582 | 5.6% |
| Black / African American | 353 | 3.4% |
| Hawaiian / Pacific | 5 | 0.1% |
| Hispanic or Latino | 815 | 7.8% |
| Native / Alaskan | 38 | 0.4% |
| White / Caucasian | 8,230 | 79.1% |
| Two or more Races | 1,058 | 10.2% |
| Some other Race | 133 | 1.3% |
| Total | 10,399 | 100.0% |
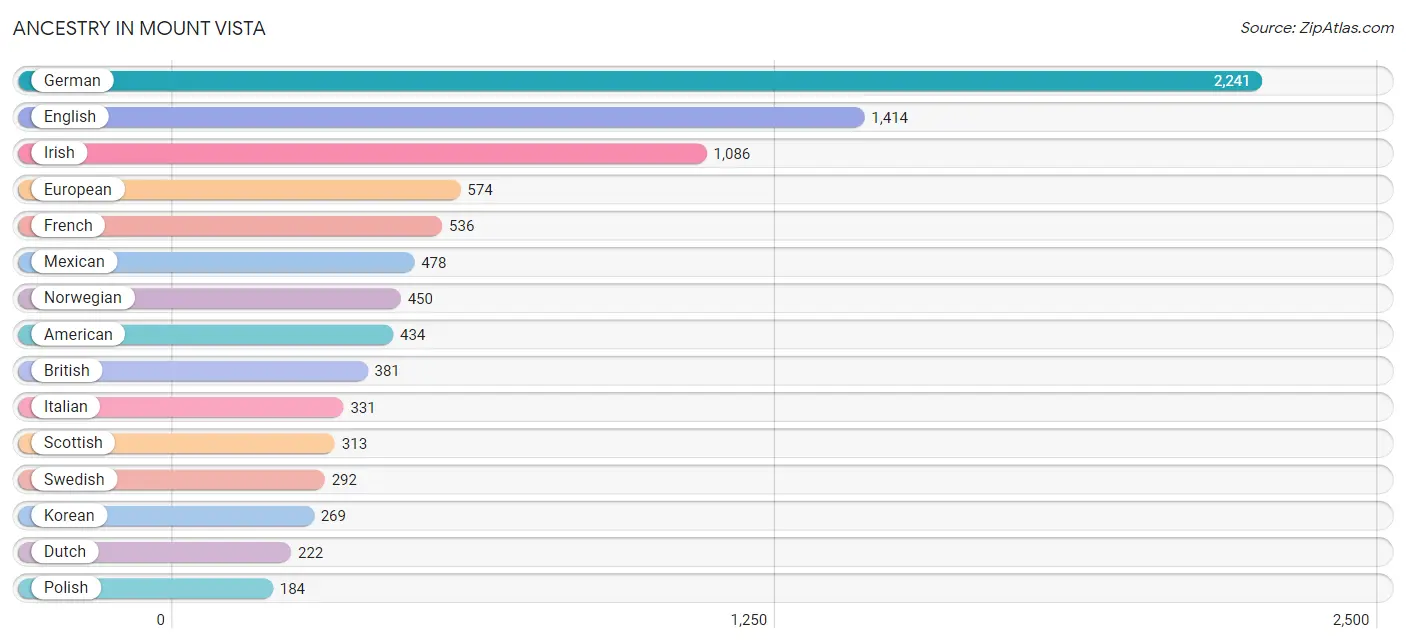
Ancestry in Mount Vista
The most populous ancestries reported in Mount Vista are German (2,241 | 21.5%), English (1,414 | 13.6%), Irish (1,086 | 10.4%), European (574 | 5.5%), and French (536 | 5.1%), together accounting for 56.3% of all Mount Vista residents.
| Ancestry | # Population | % Population |
| African | 111 | 1.1% |
| Alsatian | 15 | 0.1% |
| American | 434 | 4.2% |
| Arab | 21 | 0.2% |
| Argentinean | 42 | 0.4% |
| Austrian | 28 | 0.3% |
| Bhutanese | 98 | 0.9% |
| Blackfeet | 5 | 0.1% |
| British | 381 | 3.7% |
| Burmese | 93 | 0.9% |
| Cajun | 9 | 0.1% |
| Canadian | 83 | 0.8% |
| Central American | 12 | 0.1% |
| Cherokee | 99 | 0.9% |
| Cheyenne | 1 | 0.0% |
| Chippewa | 15 | 0.1% |
| Croatian | 36 | 0.4% |
| Cuban | 148 | 1.4% |
| Czech | 11 | 0.1% |
| Danish | 68 | 0.6% |
| Dutch | 222 | 2.1% |
| Eastern European | 12 | 0.1% |
| Ecuadorian | 13 | 0.1% |
| English | 1,414 | 13.6% |
| Estonian | 5 | 0.1% |
| European | 574 | 5.5% |
| Finnish | 55 | 0.5% |
| French | 536 | 5.1% |
| French Canadian | 49 | 0.5% |
| German | 2,241 | 21.5% |
| Greek | 17 | 0.2% |
| Hungarian | 14 | 0.1% |
| Icelander | 33 | 0.3% |
| Indian (Asian) | 129 | 1.2% |
| Irish | 1,086 | 10.4% |
| Italian | 331 | 3.2% |
| Korean | 269 | 2.6% |
| Latvian | 21 | 0.2% |
| Lebanese | 8 | 0.1% |
| Lithuanian | 8 | 0.1% |
| Malaysian | 92 | 0.9% |
| Mexican | 478 | 4.6% |
| Native Hawaiian | 96 | 0.9% |
| Nigerian | 19 | 0.2% |
| Northern European | 177 | 1.7% |
| Norwegian | 450 | 4.3% |
| Pennsylvania German | 4 | 0.0% |
| Polish | 184 | 1.8% |
| Portuguese | 101 | 1.0% |
| Russian | 35 | 0.3% |
| Salvadoran | 12 | 0.1% |
| Samoan | 14 | 0.1% |
| Scandinavian | 177 | 1.7% |
| Scotch-Irish | 68 | 0.6% |
| Scottish | 313 | 3.0% |
| Serbian | 24 | 0.2% |
| Slovene | 5 | 0.1% |
| South American | 55 | 0.5% |
| Spanish | 80 | 0.8% |
| Sri Lankan | 133 | 1.3% |
| Subsaharan African | 130 | 1.3% |
| Swedish | 292 | 2.8% |
| Swiss | 35 | 0.3% |
| Syrian | 4 | 0.0% |
| Thai | 165 | 1.6% |
| Ukrainian | 41 | 0.4% |
| Welsh | 52 | 0.5% |
| Yugoslavian | 15 | 0.1% | View All 68 Rows |
Immigrants in Mount Vista
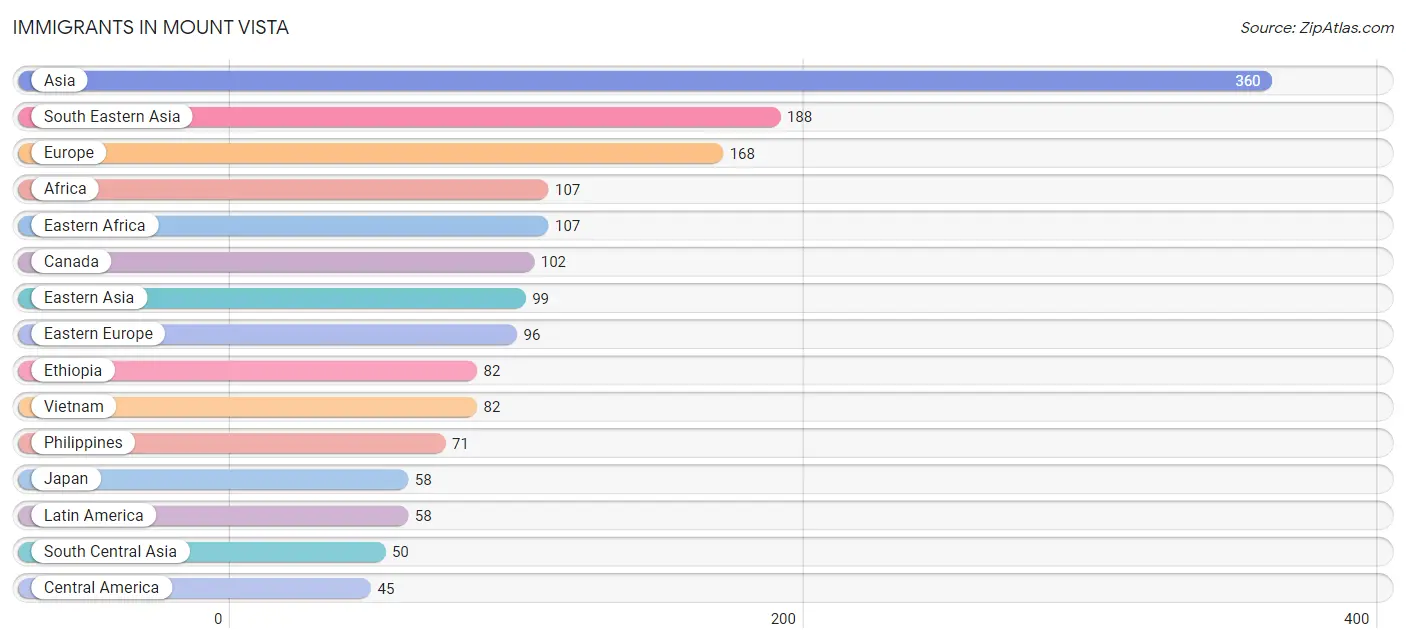
The most numerous immigrant groups reported in Mount Vista came from Asia (360 | 3.5%), South Eastern Asia (188 | 1.8%), Europe (168 | 1.6%), Africa (107 | 1.0%), and Eastern Africa (107 | 1.0%), together accounting for 8.9% of all Mount Vista residents.
| Immigration Origin | # Population | % Population |
| Africa | 107 | 1.0% |
| Asia | 360 | 3.5% |
| Bangladesh | 15 | 0.1% |
| Belarus | 7 | 0.1% |
| Cambodia | 10 | 0.1% |
| Canada | 102 | 1.0% |
| Central America | 45 | 0.4% |
| China | 28 | 0.3% |
| Eastern Africa | 107 | 1.0% |
| Eastern Asia | 99 | 0.9% |
| Eastern Europe | 96 | 0.9% |
| Ecuador | 13 | 0.1% |
| England | 18 | 0.2% |
| Ethiopia | 82 | 0.8% |
| Europe | 168 | 1.6% |
| Germany | 44 | 0.4% |
| India | 26 | 0.3% |
| Ireland | 10 | 0.1% |
| Japan | 58 | 0.6% |
| Kazakhstan | 9 | 0.1% |
| Kenya | 7 | 0.1% |
| Korea | 13 | 0.1% |
| Laos | 25 | 0.2% |
| Latin America | 58 | 0.6% |
| Mexico | 45 | 0.4% |
| Northern Europe | 28 | 0.3% |
| Philippines | 71 | 0.7% |
| Russia | 36 | 0.4% |
| Serbia | 24 | 0.2% |
| South America | 13 | 0.1% |
| South Central Asia | 50 | 0.5% |
| South Eastern Asia | 188 | 1.8% |
| Syria | 23 | 0.2% |
| Ukraine | 29 | 0.3% |
| Vietnam | 82 | 0.8% |
| Western Asia | 23 | 0.2% |
| Western Europe | 44 | 0.4% | View All 37 Rows |
Sex and Age in Mount Vista
Sex and Age in Mount Vista
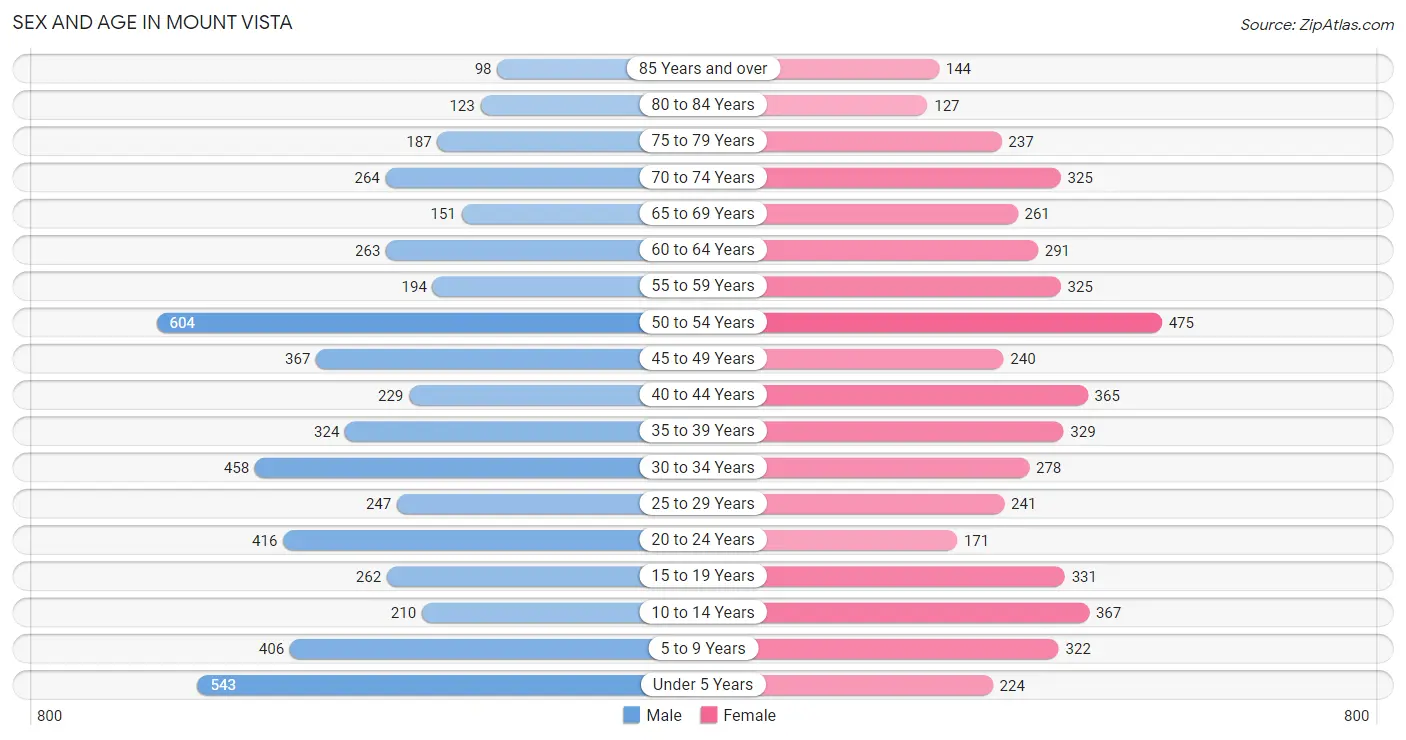
The most populous age groups in Mount Vista are 50 to 54 Years (604 | 11.3%) for men and 50 to 54 Years (475 | 9.4%) for women.
| Age Bracket | Male | Female |
| Under 5 Years | 543 (10.2%) | 224 (4.4%) |
| 5 to 9 Years | 406 (7.6%) | 322 (6.4%) |
| 10 to 14 Years | 210 (3.9%) | 367 (7.3%) |
| 15 to 19 Years | 262 (4.9%) | 331 (6.6%) |
| 20 to 24 Years | 416 (7.8%) | 171 (3.4%) |
| 25 to 29 Years | 247 (4.6%) | 241 (4.8%) |
| 30 to 34 Years | 458 (8.6%) | 278 (5.5%) |
| 35 to 39 Years | 324 (6.1%) | 329 (6.5%) |
| 40 to 44 Years | 229 (4.3%) | 365 (7.2%) |
| 45 to 49 Years | 367 (6.9%) | 240 (4.8%) |
| 50 to 54 Years | 604 (11.3%) | 475 (9.4%) |
| 55 to 59 Years | 194 (3.6%) | 325 (6.4%) |
| 60 to 64 Years | 263 (4.9%) | 291 (5.8%) |
| 65 to 69 Years | 151 (2.8%) | 261 (5.2%) |
| 70 to 74 Years | 264 (4.9%) | 325 (6.4%) |
| 75 to 79 Years | 187 (3.5%) | 237 (4.7%) |
| 80 to 84 Years | 123 (2.3%) | 127 (2.5%) |
| 85 Years and over | 98 (1.8%) | 144 (2.9%) |
| Total | 5,346 (100.0%) | 5,053 (100.0%) |
Families and Households in Mount Vista
Median Family Size in Mount Vista
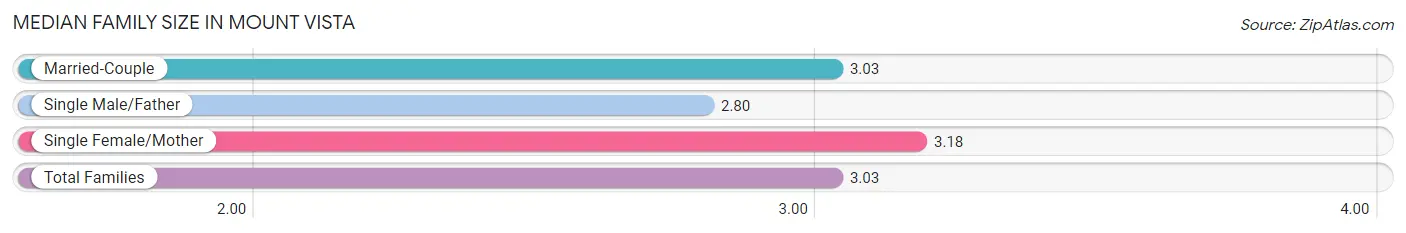
The median family size in Mount Vista is 3.03 persons per family, with single female/mother families (438 | 15.4%) accounting for the largest median family size of 3.18 persons per family. On the other hand, single male/father families (273 | 9.6%) represent the smallest median family size with 2.80 persons per family.
| Family Type | # Families | Family Size |
| Married-Couple | 2,124 (74.9%) | 3.03 |
| Single Male/Father | 273 (9.6%) | 2.80 |
| Single Female/Mother | 438 (15.4%) | 3.18 |
| Total Families | 2,835 (100.0%) | 3.03 |
Median Household Size in Mount Vista
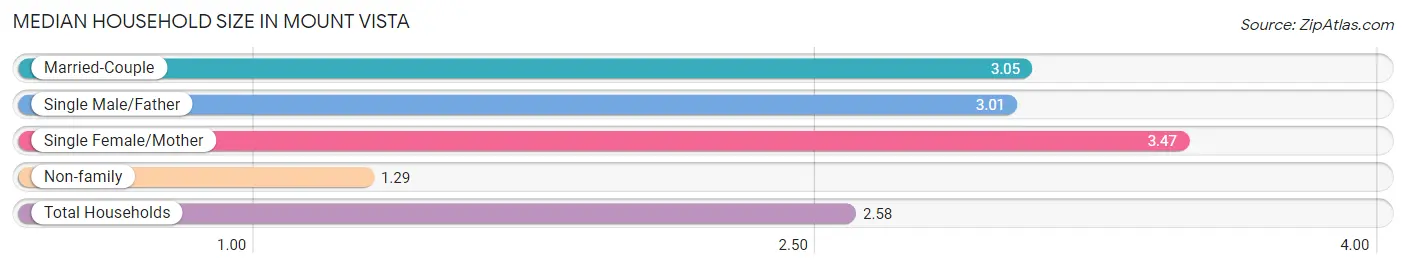
The median household size in Mount Vista is 2.58 persons per household, with single female/mother households (438 | 10.9%) accounting for the largest median household size of 3.47 persons per household. non-family households (1,179 | 29.4%) represent the smallest median household size with 1.29 persons per household.
| Household Type | # Households | Household Size |
| Married-Couple | 2,124 (52.9%) | 3.05 |
| Single Male/Father | 273 (6.8%) | 3.01 |
| Single Female/Mother | 438 (10.9%) | 3.47 |
| Non-family | 1,179 (29.4%) | 1.29 |
| Total Households | 4,014 (100.0%) | 2.58 |
Household Size by Marriage Status in Mount Vista
Out of a total of 4,014 households in Mount Vista, 2,835 (70.6%) are family households, while 1,179 (29.4%) are nonfamily households. The most numerous type of family households are 2-person households, comprising 1,311, and the most common type of nonfamily households are 1-person households, comprising 935.
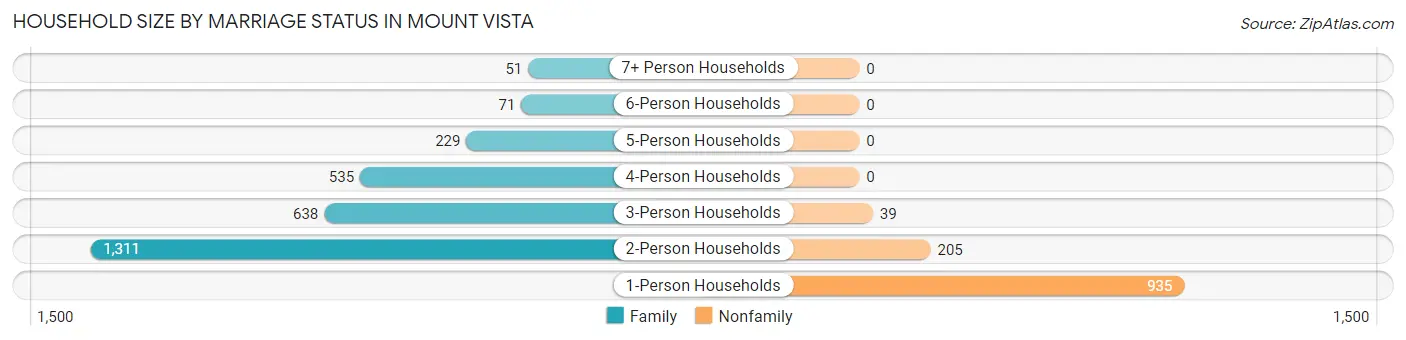
| Household Size | Family Households | Nonfamily Households |
| 1-Person Households | - | 935 (23.3%) |
| 2-Person Households | 1,311 (32.7%) | 205 (5.1%) |
| 3-Person Households | 638 (15.9%) | 39 (1.0%) |
| 4-Person Households | 535 (13.3%) | 0 (0.0%) |
| 5-Person Households | 229 (5.7%) | 0 (0.0%) |
| 6-Person Households | 71 (1.8%) | 0 (0.0%) |
| 7+ Person Households | 51 (1.3%) | 0 (0.0%) |
| Total | 2,835 (70.6%) | 1,179 (29.4%) |
Female Fertility in Mount Vista
Fertility by Age in Mount Vista
Average fertility rate in Mount Vista is 29.0 births per 1,000 women. Women in the age bracket of 35 to 50 years have the highest fertility rate with 37.0 births per 1,000 women. Women in the age bracket of 35 to 50 years acount for 64.4% of all women with births.
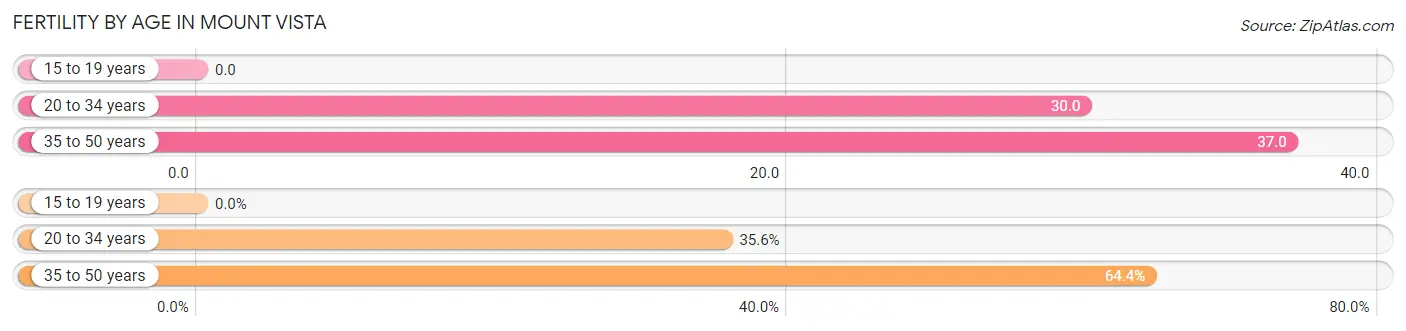
| Age Bracket | Women with Births | Births / 1,000 Women |
| 15 to 19 years | 0 (0.0%) | 0.0 |
| 20 to 34 years | 21 (35.6%) | 30.0 |
| 35 to 50 years | 38 (64.4%) | 37.0 |
| Total | 59 (100.0%) | 29.0 |
Fertility by Age by Marriage Status in Mount Vista
74.6% of women with births (59) in Mount Vista are married. The highest percentage of unmarried women with births falls into 20 to 34 years age bracket with 28.6% of them unmarried at the time of birth, while the lowest percentage of unmarried women with births belong to 35 to 50 years age bracket with 23.7% of them unmarried.
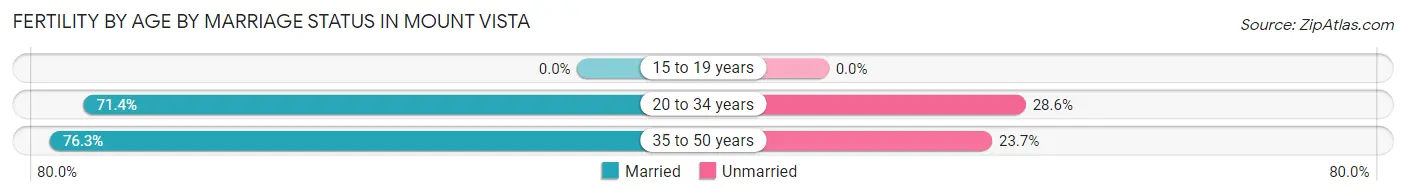
| Age Bracket | Married | Unmarried |
| 15 to 19 years | 0 (0.0%) | 0 (0.0%) |
| 20 to 34 years | 15 (71.4%) | 6 (28.6%) |
| 35 to 50 years | 29 (76.3%) | 9 (23.7%) |
| Total | 44 (74.6%) | 15 (25.4%) |
Fertility by Education in Mount Vista
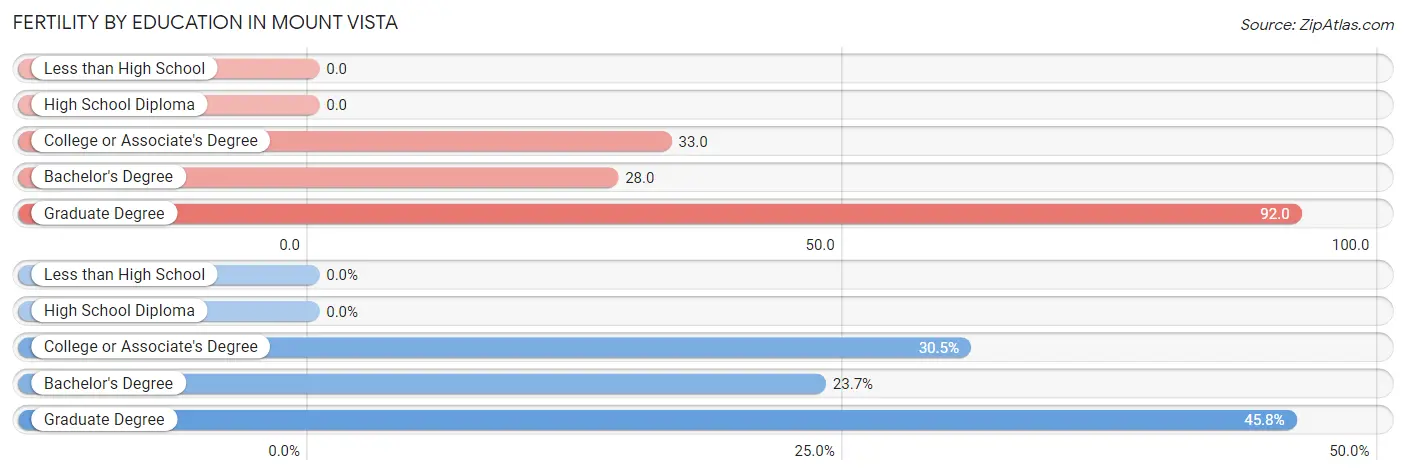
| Educational Attainment | Women with Births | Births / 1,000 Women |
| Less than High School | 0 (0.0%) | 0.0 |
| High School Diploma | 0 (0.0%) | 0.0 |
| College or Associate's Degree | 18 (30.5%) | 33.0 |
| Bachelor's Degree | 14 (23.7%) | 28.0 |
| Graduate Degree | 27 (45.8%) | 92.0 |
| Total | 59 (100.0%) | 29.0 |
Fertility by Education by Marriage Status in Mount Vista
25.4% of women with births in Mount Vista are unmarried. Women with the educational attainment of graduate degree are most likely to be married with 100.0% of them married at childbirth, while women with the educational attainment of bachelor's degree are least likely to be married with 64.3% of them unmarried at childbirth.
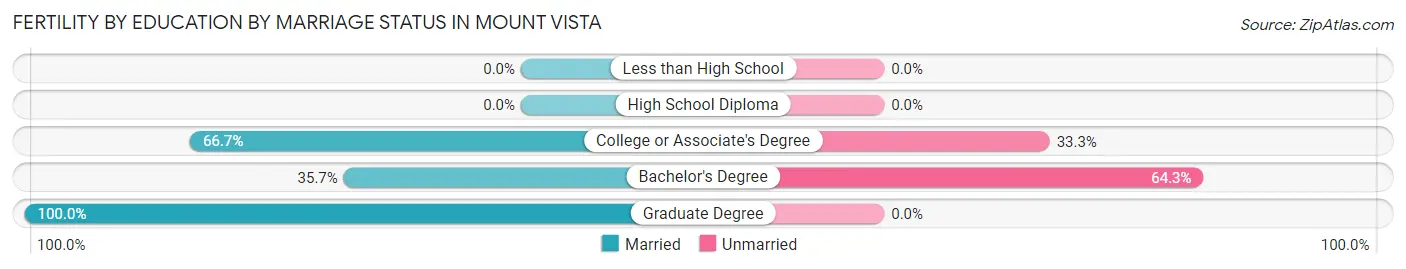
| Educational Attainment | Married | Unmarried |
| Less than High School | 0 (0.0%) | 0 (0.0%) |
| High School Diploma | 0 (0.0%) | 0 (0.0%) |
| College or Associate's Degree | 12 (66.7%) | 6 (33.3%) |
| Bachelor's Degree | 5 (35.7%) | 9 (64.3%) |
| Graduate Degree | 27 (100.0%) | 0 (0.0%) |
| Total | 44 (74.6%) | 15 (25.4%) |
Employment Characteristics in Mount Vista
Employment by Class of Employer in Mount Vista
Among the 4,864 employed individuals in Mount Vista, private company employees (3,088 | 63.5%), local government employees (366 | 7.5%), and not-for-profit organizations (344 | 7.1%) make up the most common classes of employment.
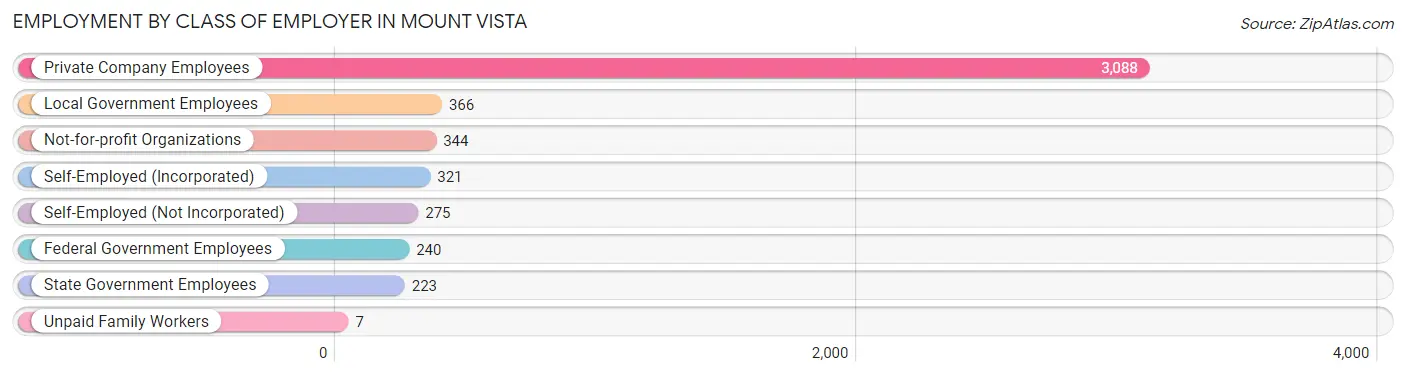
| Employer Class | # Employees | % Employees |
| Private Company Employees | 3,088 | 63.5% |
| Self-Employed (Incorporated) | 321 | 6.6% |
| Self-Employed (Not Incorporated) | 275 | 5.7% |
| Not-for-profit Organizations | 344 | 7.1% |
| Local Government Employees | 366 | 7.5% |
| State Government Employees | 223 | 4.6% |
| Federal Government Employees | 240 | 4.9% |
| Unpaid Family Workers | 7 | 0.1% |
| Total | 4,864 | 100.0% |
Employment Status by Age in Mount Vista
According to the labor force statistics for Mount Vista, out of the total population over 16 years of age (8,171), 62.7% or 5,123 individuals are in the labor force, with 2.9% or 149 of them unemployed. The age group with the highest labor force participation rate is 25 to 29 years, with 90.8% or 443 individuals in the labor force. Within the labor force, the 75 years and over age range has the highest percentage of unemployed individuals, with 19.5% or 8 of them being unemployed.
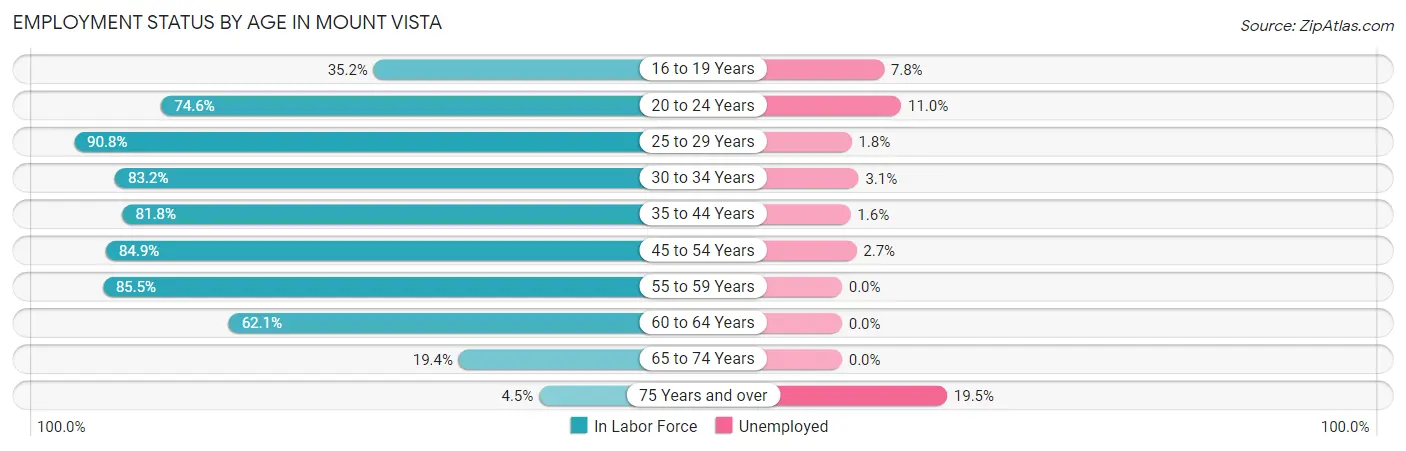
| Age Bracket | In Labor Force | Unemployed |
| 16 to 19 Years | 154 (35.2%) | 12 (7.8%) |
| 20 to 24 Years | 438 (74.6%) | 48 (11.0%) |
| 25 to 29 Years | 443 (90.8%) | 8 (1.8%) |
| 30 to 34 Years | 612 (83.2%) | 19 (3.1%) |
| 35 to 44 Years | 1,020 (81.8%) | 16 (1.6%) |
| 45 to 54 Years | 1,431 (84.9%) | 39 (2.7%) |
| 55 to 59 Years | 444 (85.5%) | 0 (0.0%) |
| 60 to 64 Years | 344 (62.1%) | 0 (0.0%) |
| 65 to 74 Years | 194 (19.4%) | 0 (0.0%) |
| 75 Years and over | 41 (4.5%) | 8 (19.5%) |
| Total | 5,123 (62.7%) | 149 (2.9%) |
Employment Status by Educational Attainment in Mount Vista
According to labor force statistics for Mount Vista, 82.1% of individuals (4,294) out of the total population between 25 and 64 years of age (5,230) are in the labor force, with 1.9% or 82 of them being unemployed. The group with the highest labor force participation rate are those with the educational attainment of bachelor's degree or higher, with 85.3% or 1,976 individuals in the labor force. Within the labor force, individuals with high school diploma education have the highest percentage of unemployment, with 4.0% or 27 of them being unemployed.
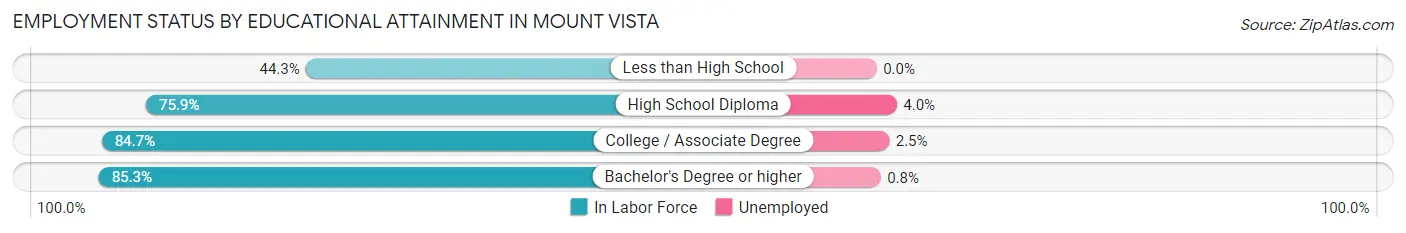
| Educational Attainment | In Labor Force | Unemployed |
| Less than High School | 77 (44.3%) | 0 (0.0%) |
| High School Diploma | 676 (75.9%) | 36 (4.0%) |
| College / Associate Degree | 1,566 (84.7%) | 46 (2.5%) |
| Bachelor's Degree or higher | 1,976 (85.3%) | 19 (0.8%) |
| Total | 4,294 (82.1%) | 99 (1.9%) |
Employment Occupations by Sex in Mount Vista
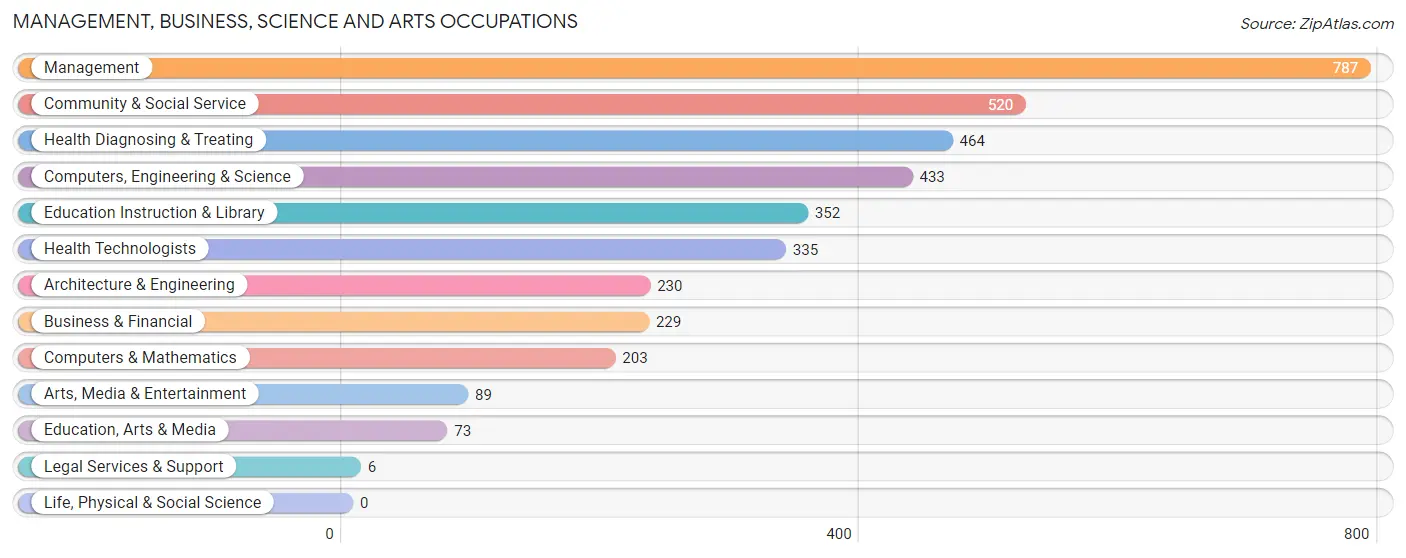
Management, Business, Science and Arts Occupations
The most common Management, Business, Science and Arts occupations in Mount Vista are Management (787 | 15.8%), Community & Social Service (520 | 10.5%), Health Diagnosing & Treating (464 | 9.3%), Computers, Engineering & Science (433 | 8.7%), and Education Instruction & Library (352 | 7.1%).
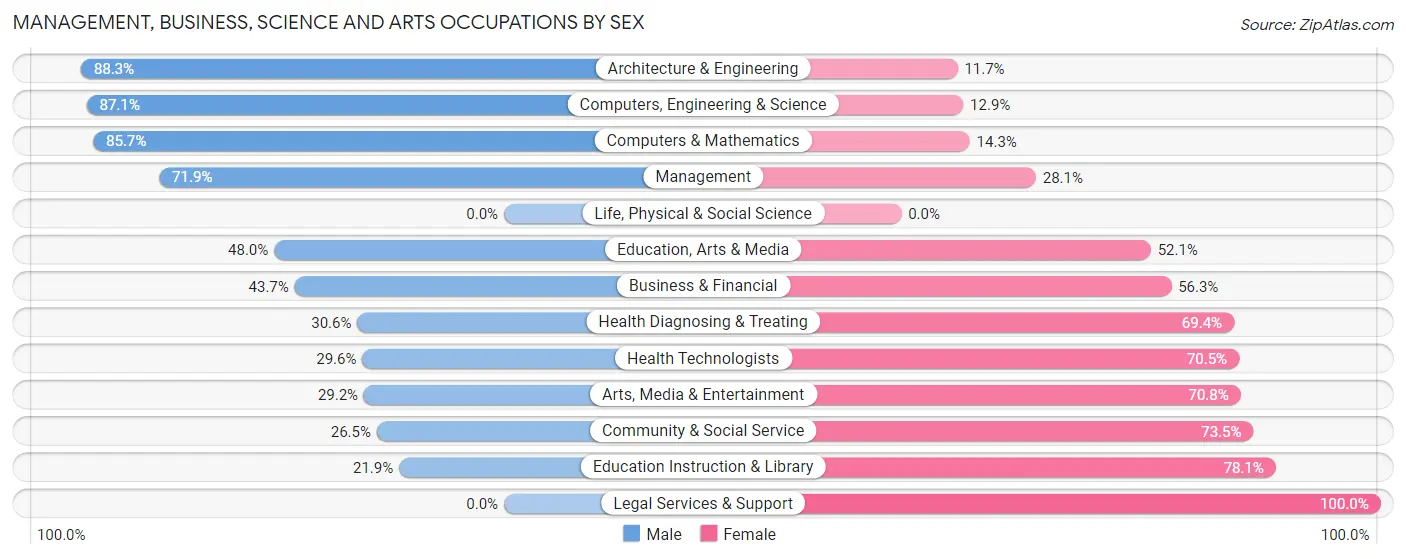
Management, Business, Science and Arts Occupations by Sex
Within the Management, Business, Science and Arts occupations in Mount Vista, the most male-oriented occupations are Architecture & Engineering (88.3%), Computers, Engineering & Science (87.1%), and Computers & Mathematics (85.7%), while the most female-oriented occupations are Legal Services & Support (100.0%), Education Instruction & Library (78.1%), and Community & Social Service (73.5%).
| Occupation | Male | Female |
| Management | 566 (71.9%) | 221 (28.1%) |
| Business & Financial | 100 (43.7%) | 129 (56.3%) |
| Computers, Engineering & Science | 377 (87.1%) | 56 (12.9%) |
| Computers & Mathematics | 174 (85.7%) | 29 (14.3%) |
| Architecture & Engineering | 203 (88.3%) | 27 (11.7%) |
| Life, Physical & Social Science | 0 (0.0%) | 0 (0.0%) |
| Community & Social Service | 138 (26.5%) | 382 (73.5%) |
| Education, Arts & Media | 35 (47.9%) | 38 (52.0%) |
| Legal Services & Support | 0 (0.0%) | 6 (100.0%) |
| Education Instruction & Library | 77 (21.9%) | 275 (78.1%) |
| Arts, Media & Entertainment | 26 (29.2%) | 63 (70.8%) |
| Health Diagnosing & Treating | 142 (30.6%) | 322 (69.4%) |
| Health Technologists | 99 (29.5%) | 236 (70.5%) |
| Total (Category) | 1,323 (54.4%) | 1,110 (45.6%) |
| Total (Overall) | 2,853 (57.4%) | 2,120 (42.6%) |
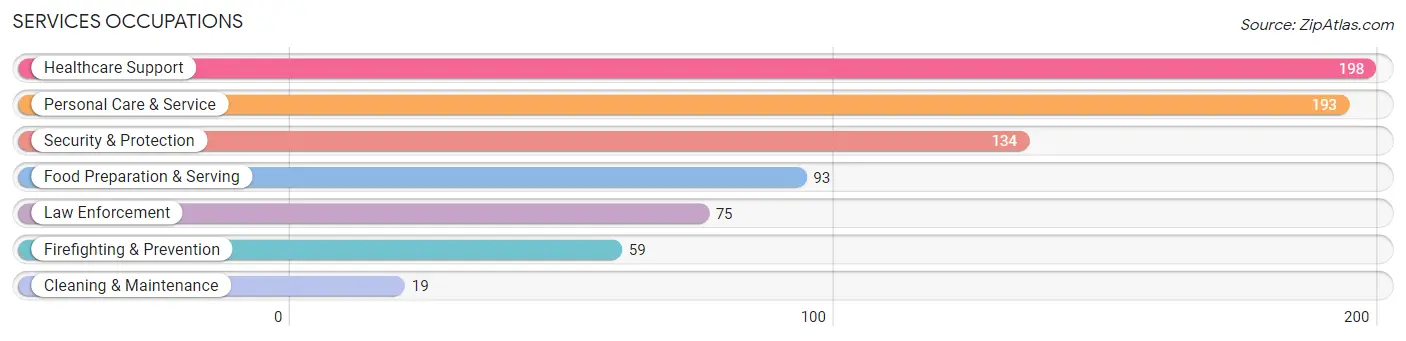
Services Occupations
The most common Services occupations in Mount Vista are Healthcare Support (198 | 4.0%), Personal Care & Service (193 | 3.9%), Security & Protection (134 | 2.7%), Food Preparation & Serving (93 | 1.9%), and Law Enforcement (75 | 1.5%).
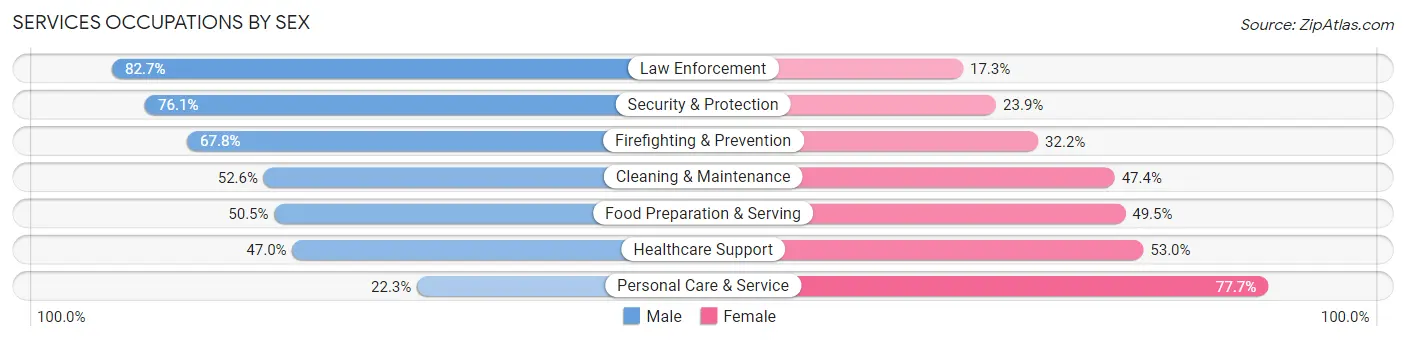
Services Occupations by Sex
Within the Services occupations in Mount Vista, the most male-oriented occupations are Law Enforcement (82.7%), Security & Protection (76.1%), and Firefighting & Prevention (67.8%), while the most female-oriented occupations are Personal Care & Service (77.7%), Healthcare Support (53.0%), and Food Preparation & Serving (49.5%).
| Occupation | Male | Female |
| Healthcare Support | 93 (47.0%) | 105 (53.0%) |
| Security & Protection | 102 (76.1%) | 32 (23.9%) |
| Firefighting & Prevention | 40 (67.8%) | 19 (32.2%) |
| Law Enforcement | 62 (82.7%) | 13 (17.3%) |
| Food Preparation & Serving | 47 (50.5%) | 46 (49.5%) |
| Cleaning & Maintenance | 10 (52.6%) | 9 (47.4%) |
| Personal Care & Service | 43 (22.3%) | 150 (77.7%) |
| Total (Category) | 295 (46.3%) | 342 (53.7%) |
| Total (Overall) | 2,853 (57.4%) | 2,120 (42.6%) |
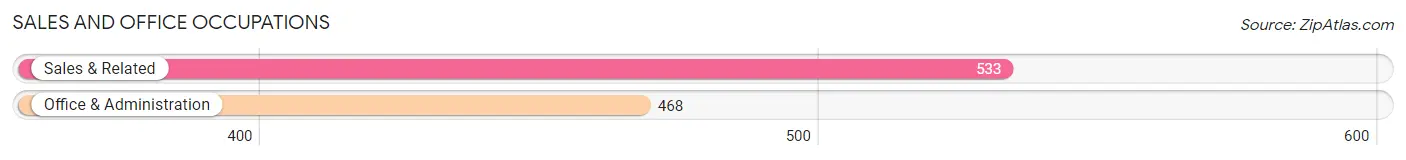
Sales and Office Occupations
The most common Sales and Office occupations in Mount Vista are Sales & Related (533 | 10.7%), and Office & Administration (468 | 9.4%).
Sales and Office Occupations by Sex
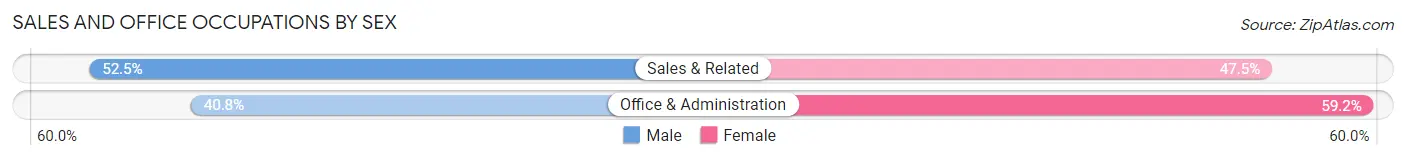
| Occupation | Male | Female |
| Sales & Related | 280 (52.5%) | 253 (47.5%) |
| Office & Administration | 191 (40.8%) | 277 (59.2%) |
| Total (Category) | 471 (47.0%) | 530 (52.9%) |
| Total (Overall) | 2,853 (57.4%) | 2,120 (42.6%) |
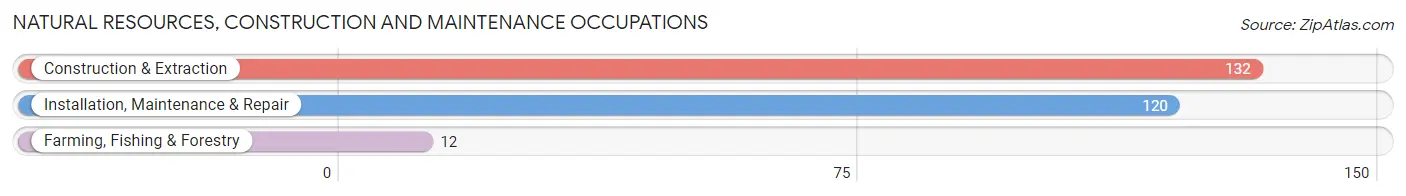
Natural Resources, Construction and Maintenance Occupations
The most common Natural Resources, Construction and Maintenance occupations in Mount Vista are Construction & Extraction (132 | 2.6%), Installation, Maintenance & Repair (120 | 2.4%), and Farming, Fishing & Forestry (12 | 0.2%).
Natural Resources, Construction and Maintenance Occupations by Sex
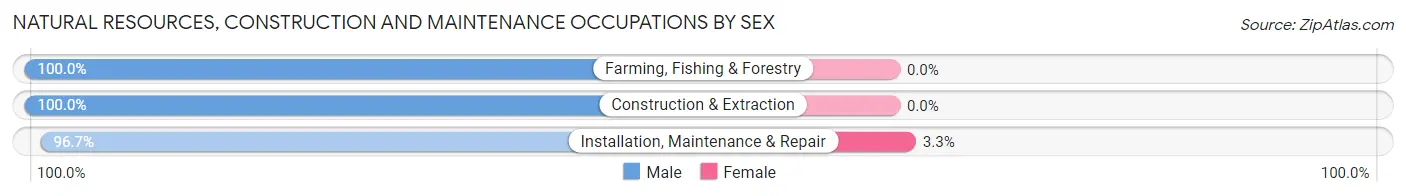
| Occupation | Male | Female |
| Farming, Fishing & Forestry | 12 (100.0%) | 0 (0.0%) |
| Construction & Extraction | 132 (100.0%) | 0 (0.0%) |
| Installation, Maintenance & Repair | 116 (96.7%) | 4 (3.3%) |
| Total (Category) | 260 (98.5%) | 4 (1.5%) |
| Total (Overall) | 2,853 (57.4%) | 2,120 (42.6%) |
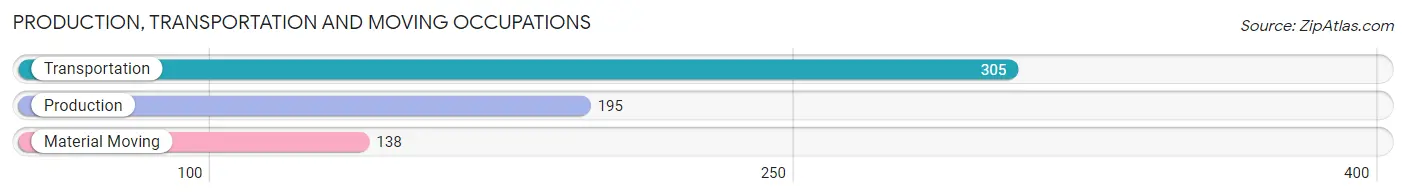
Production, Transportation and Moving Occupations
The most common Production, Transportation and Moving occupations in Mount Vista are Transportation (305 | 6.1%), Production (195 | 3.9%), and Material Moving (138 | 2.8%).
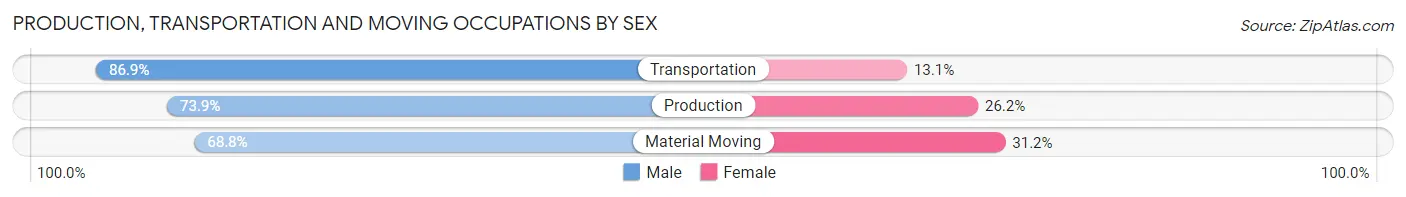
Production, Transportation and Moving Occupations by Sex
| Occupation | Male | Female |
| Production | 144 (73.9%) | 51 (26.2%) |
| Transportation | 265 (86.9%) | 40 (13.1%) |
| Material Moving | 95 (68.8%) | 43 (31.2%) |
| Total (Category) | 504 (79.0%) | 134 (21.0%) |
| Total (Overall) | 2,853 (57.4%) | 2,120 (42.6%) |
Employment Industries by Sex in Mount Vista
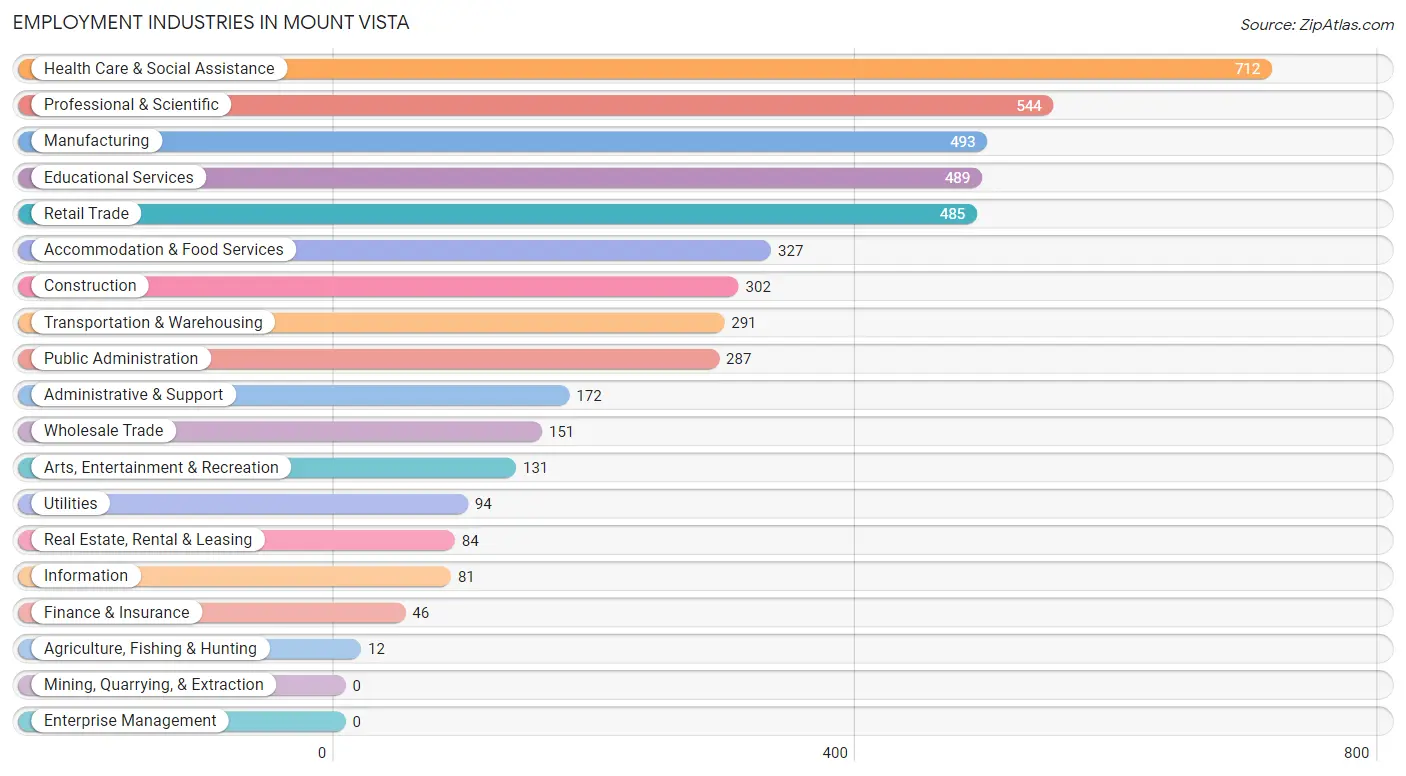
Employment Industries in Mount Vista
The major employment industries in Mount Vista include Health Care & Social Assistance (712 | 14.3%), Professional & Scientific (544 | 10.9%), Manufacturing (493 | 9.9%), Educational Services (489 | 9.8%), and Retail Trade (485 | 9.8%).
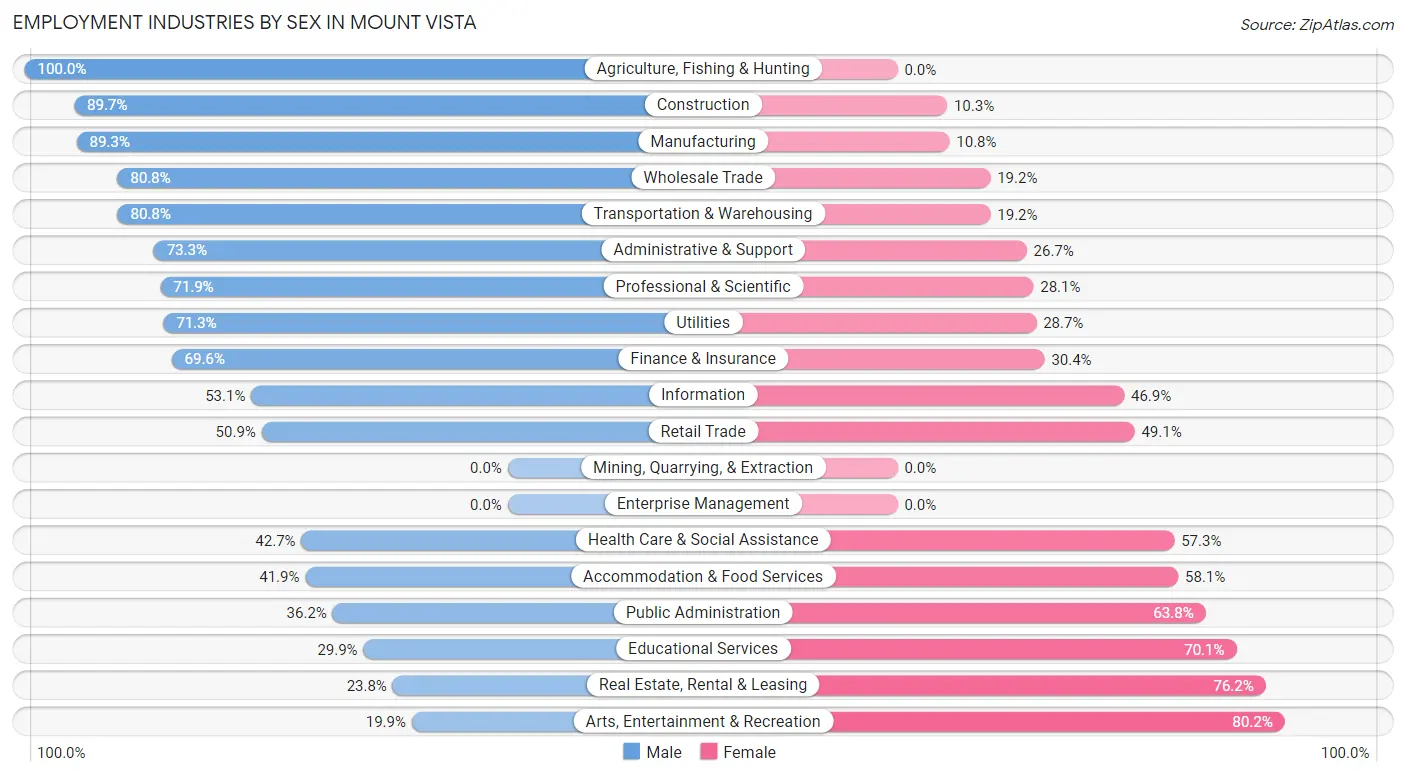
Employment Industries by Sex in Mount Vista
The Mount Vista industries that see more men than women are Agriculture, Fishing & Hunting (100.0%), Construction (89.7%), and Manufacturing (89.2%), whereas the industries that tend to have a higher number of women are Arts, Entertainment & Recreation (80.1%), Real Estate, Rental & Leasing (76.2%), and Educational Services (70.1%).
| Industry | Male | Female |
| Agriculture, Fishing & Hunting | 12 (100.0%) | 0 (0.0%) |
| Mining, Quarrying, & Extraction | 0 (0.0%) | 0 (0.0%) |
| Construction | 271 (89.7%) | 31 (10.3%) |
| Manufacturing | 440 (89.2%) | 53 (10.7%) |
| Wholesale Trade | 122 (80.8%) | 29 (19.2%) |
| Retail Trade | 247 (50.9%) | 238 (49.1%) |
| Transportation & Warehousing | 235 (80.8%) | 56 (19.2%) |
| Utilities | 67 (71.3%) | 27 (28.7%) |
| Information | 43 (53.1%) | 38 (46.9%) |
| Finance & Insurance | 32 (69.6%) | 14 (30.4%) |
| Real Estate, Rental & Leasing | 20 (23.8%) | 64 (76.2%) |
| Professional & Scientific | 391 (71.9%) | 153 (28.1%) |
| Enterprise Management | 0 (0.0%) | 0 (0.0%) |
| Administrative & Support | 126 (73.3%) | 46 (26.7%) |
| Educational Services | 146 (29.9%) | 343 (70.1%) |
| Health Care & Social Assistance | 304 (42.7%) | 408 (57.3%) |
| Arts, Entertainment & Recreation | 26 (19.9%) | 105 (80.1%) |
| Accommodation & Food Services | 137 (41.9%) | 190 (58.1%) |
| Public Administration | 104 (36.2%) | 183 (63.8%) |
| Total | 2,853 (57.4%) | 2,120 (42.6%) |
Education in Mount Vista
School Enrollment in Mount Vista
The most common levels of schooling among the 2,206 students in Mount Vista are high school (521 | 23.6%), middle school (479 | 21.7%), and elementary school (447 | 20.3%).
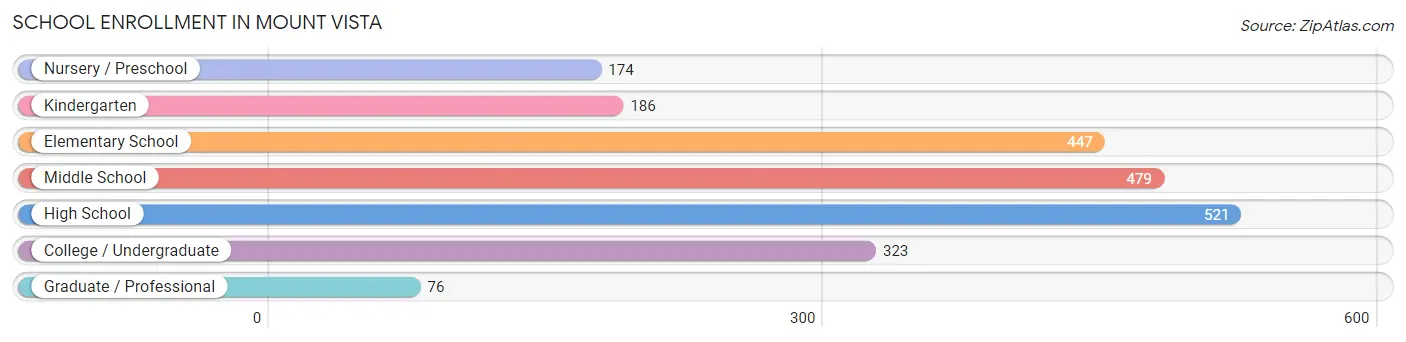
| School Level | # Students | % Students |
| Nursery / Preschool | 174 | 7.9% |
| Kindergarten | 186 | 8.4% |
| Elementary School | 447 | 20.3% |
| Middle School | 479 | 21.7% |
| High School | 521 | 23.6% |
| College / Undergraduate | 323 | 14.6% |
| Graduate / Professional | 76 | 3.5% |
| Total | 2,206 | 100.0% |
School Enrollment by Age by Funding Source in Mount Vista
Out of a total of 2,206 students who are enrolled in schools in Mount Vista, 408 (18.5%) attend a private institution, while the remaining 1,798 (81.5%) are enrolled in public schools. The age group of 3 to 4 year olds has the highest likelihood of being enrolled in private schools, with 114 (79.2% in the age bracket) enrolled. Conversely, the age group of 18 to 19 year olds has the lowest likelihood of being enrolled in a private school, with 155 (95.1% in the age bracket) attending a public institution.
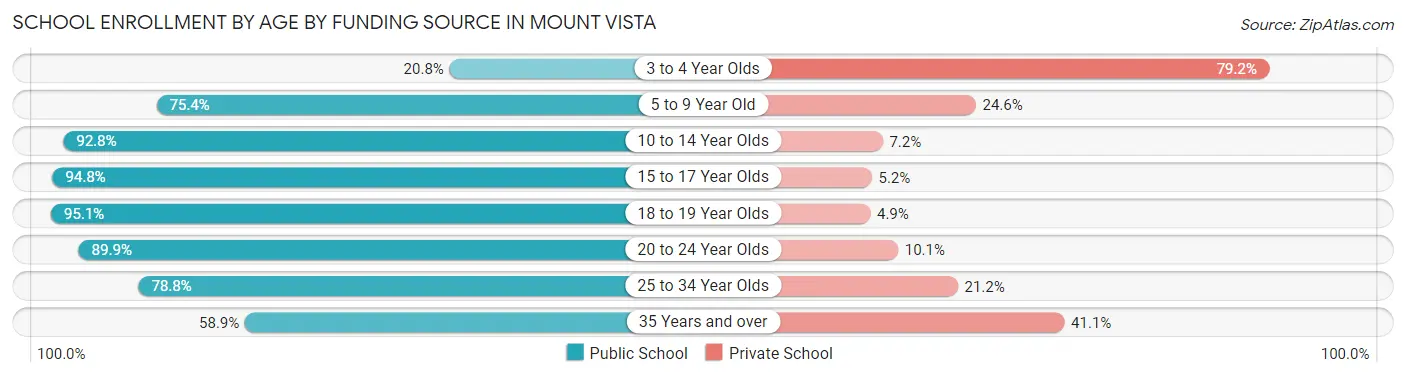
| Age Bracket | Public School | Private School |
| 3 to 4 Year Olds | 30 (20.8%) | 114 (79.2%) |
| 5 to 9 Year Old | 467 (75.4%) | 152 (24.6%) |
| 10 to 14 Year Olds | 527 (92.8%) | 41 (7.2%) |
| 15 to 17 Year Olds | 384 (94.8%) | 21 (5.2%) |
| 18 to 19 Year Olds | 155 (95.1%) | 8 (4.9%) |
| 20 to 24 Year Olds | 116 (89.9%) | 13 (10.1%) |
| 25 to 34 Year Olds | 52 (78.8%) | 14 (21.2%) |
| 35 Years and over | 66 (58.9%) | 46 (41.1%) |
| Total | 1,798 (81.5%) | 408 (18.5%) |
Educational Attainment by Field of Study in Mount Vista
Business (481 | 14.4%), education (437 | 13.1%), engineering (341 | 10.2%), social sciences (323 | 9.7%), and science & technology (304 | 9.1%) are the most common fields of study among 3,332 individuals in Mount Vista who have obtained a bachelor's degree or higher.
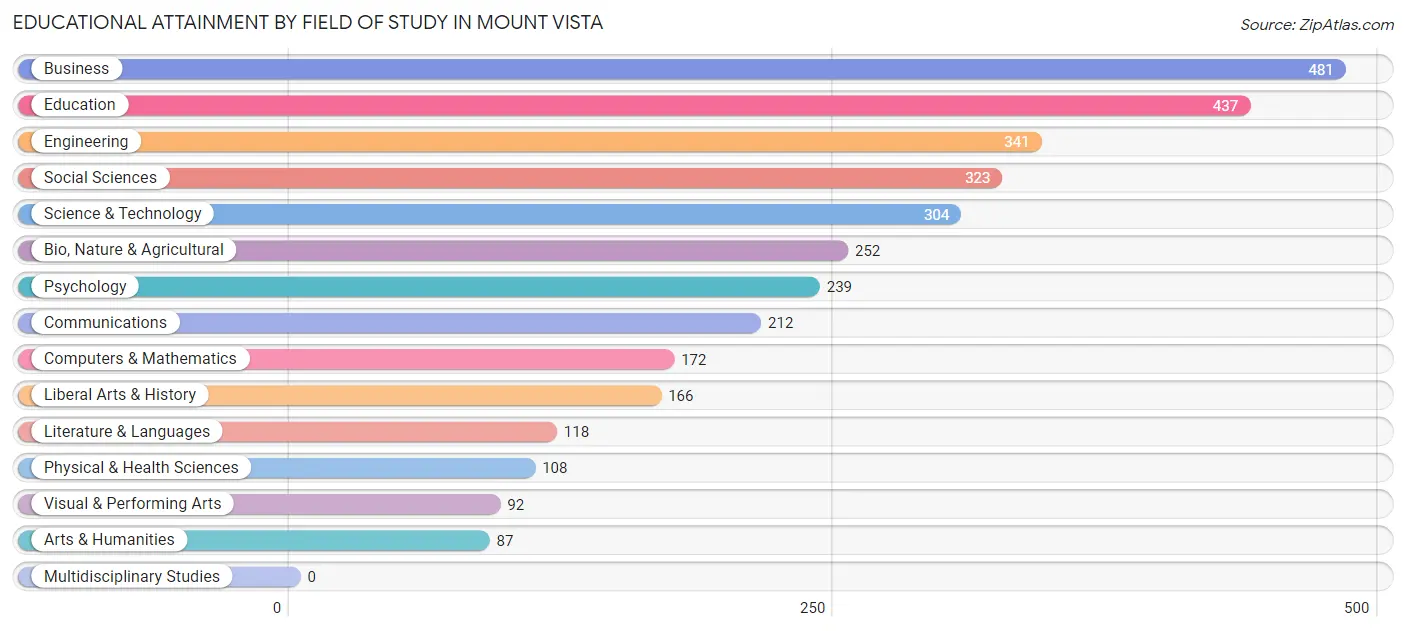
| Field of Study | # Graduates | % Graduates |
| Computers & Mathematics | 172 | 5.2% |
| Bio, Nature & Agricultural | 252 | 7.6% |
| Physical & Health Sciences | 108 | 3.2% |
| Psychology | 239 | 7.2% |
| Social Sciences | 323 | 9.7% |
| Engineering | 341 | 10.2% |
| Multidisciplinary Studies | 0 | 0.0% |
| Science & Technology | 304 | 9.1% |
| Business | 481 | 14.4% |
| Education | 437 | 13.1% |
| Literature & Languages | 118 | 3.5% |
| Liberal Arts & History | 166 | 5.0% |
| Visual & Performing Arts | 92 | 2.8% |
| Communications | 212 | 6.4% |
| Arts & Humanities | 87 | 2.6% |
| Total | 3,332 | 100.0% |
Transportation & Commute in Mount Vista
Vehicle Availability by Sex in Mount Vista
The most prevalent vehicle ownership categories in Mount Vista are males with 2 vehicles (1,299, accounting for 46.6%) and females with 2 vehicles (1,053, making up 62.5%).
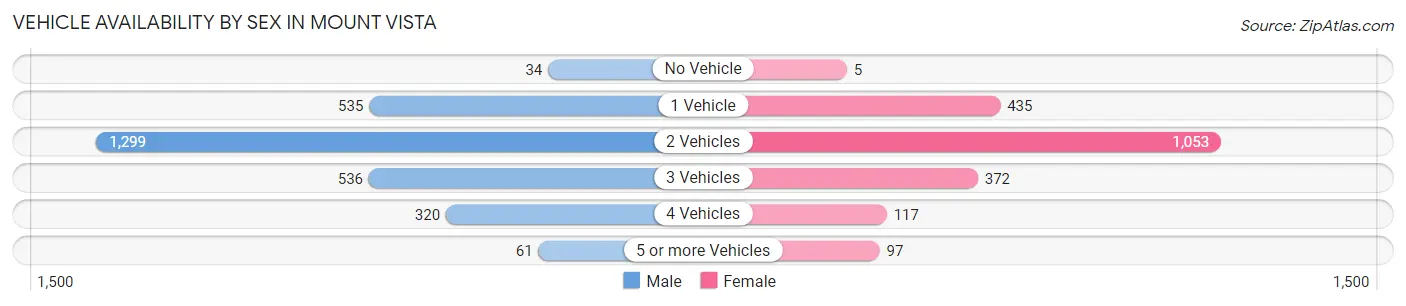
| Vehicles Available | Male | Female |
| No Vehicle | 34 (1.2%) | 5 (0.2%) |
| 1 Vehicle | 535 (19.2%) | 435 (20.9%) |
| 2 Vehicles | 1,299 (46.6%) | 1,053 (50.6%) |
| 3 Vehicles | 536 (19.3%) | 372 (17.9%) |
| 4 Vehicles | 320 (11.5%) | 117 (5.6%) |
| 5 or more Vehicles | 61 (2.2%) | 97 (4.7%) |
| Total | 2,785 (100.0%) | 2,079 (100.0%) |
Commute Time in Mount Vista
The most frequently occuring commute durations in Mount Vista are 15 to 19 minutes (955 commuters, 23.9%), 20 to 24 minutes (858 commuters, 21.5%), and 10 to 14 minutes (566 commuters, 14.2%).
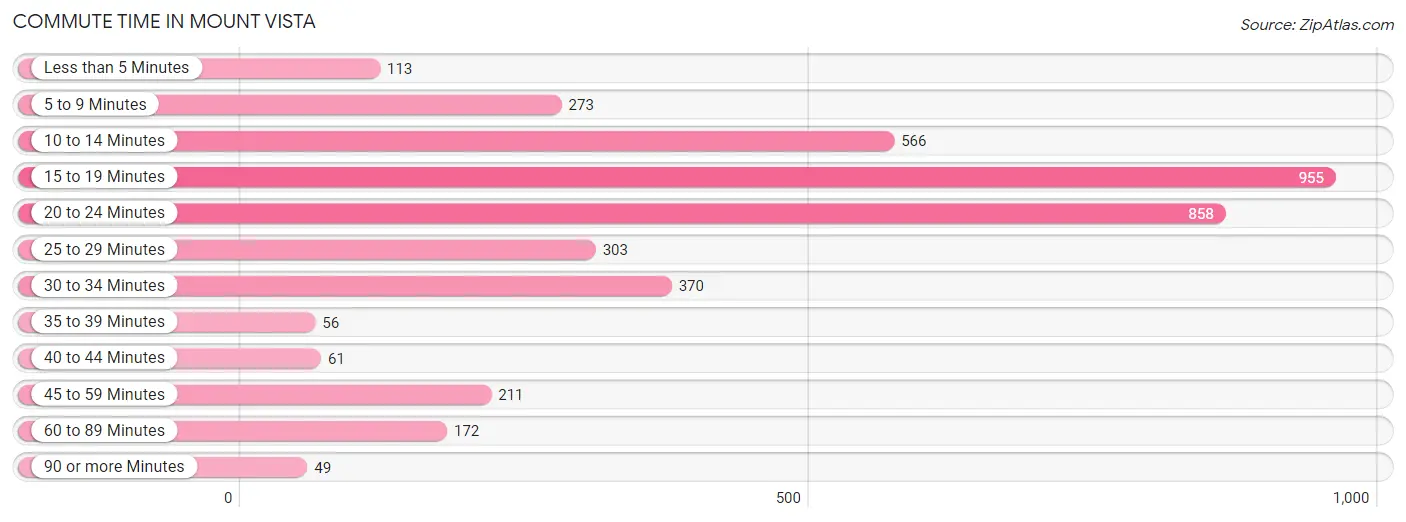
| Commute Time | # Commuters | % Commuters |
| Less than 5 Minutes | 113 | 2.8% |
| 5 to 9 Minutes | 273 | 6.9% |
| 10 to 14 Minutes | 566 | 14.2% |
| 15 to 19 Minutes | 955 | 23.9% |
| 20 to 24 Minutes | 858 | 21.5% |
| 25 to 29 Minutes | 303 | 7.6% |
| 30 to 34 Minutes | 370 | 9.3% |
| 35 to 39 Minutes | 56 | 1.4% |
| 40 to 44 Minutes | 61 | 1.5% |
| 45 to 59 Minutes | 211 | 5.3% |
| 60 to 89 Minutes | 172 | 4.3% |
| 90 or more Minutes | 49 | 1.2% |
Commute Time by Sex in Mount Vista
The most common commute times in Mount Vista are 15 to 19 minutes (567 commuters, 25.1%) for males and 15 to 19 minutes (388 commuters, 22.5%) for females.
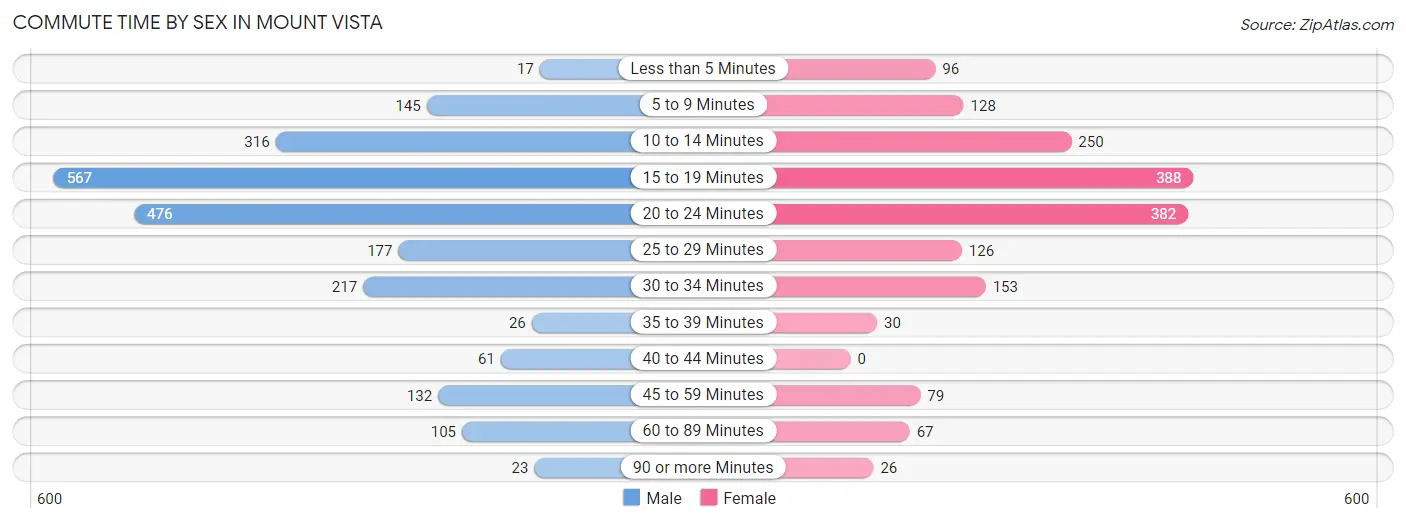
| Commute Time | Male | Female |
| Less than 5 Minutes | 17 (0.7%) | 96 (5.6%) |
| 5 to 9 Minutes | 145 (6.4%) | 128 (7.4%) |
| 10 to 14 Minutes | 316 (14.0%) | 250 (14.5%) |
| 15 to 19 Minutes | 567 (25.1%) | 388 (22.5%) |
| 20 to 24 Minutes | 476 (21.0%) | 382 (22.1%) |
| 25 to 29 Minutes | 177 (7.8%) | 126 (7.3%) |
| 30 to 34 Minutes | 217 (9.6%) | 153 (8.9%) |
| 35 to 39 Minutes | 26 (1.1%) | 30 (1.7%) |
| 40 to 44 Minutes | 61 (2.7%) | 0 (0.0%) |
| 45 to 59 Minutes | 132 (5.8%) | 79 (4.6%) |
| 60 to 89 Minutes | 105 (4.6%) | 67 (3.9%) |
| 90 or more Minutes | 23 (1.0%) | 26 (1.5%) |
Time of Departure to Work by Sex in Mount Vista
The most frequent times of departure to work in Mount Vista are 8:00 AM to 8:29 AM (467, 20.6%) for males and 7:30 AM to 7:59 AM (274, 15.9%) for females.
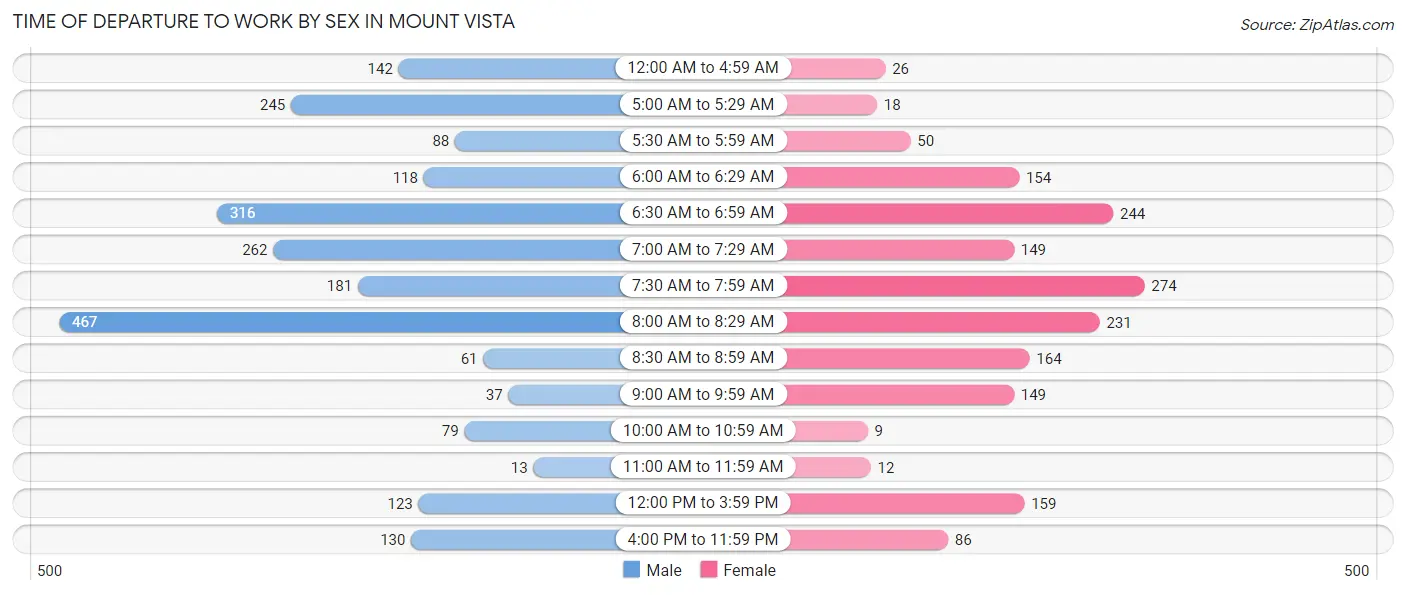
| Time of Departure | Male | Female |
| 12:00 AM to 4:59 AM | 142 (6.3%) | 26 (1.5%) |
| 5:00 AM to 5:29 AM | 245 (10.8%) | 18 (1.0%) |
| 5:30 AM to 5:59 AM | 88 (3.9%) | 50 (2.9%) |
| 6:00 AM to 6:29 AM | 118 (5.2%) | 154 (8.9%) |
| 6:30 AM to 6:59 AM | 316 (14.0%) | 244 (14.1%) |
| 7:00 AM to 7:29 AM | 262 (11.6%) | 149 (8.6%) |
| 7:30 AM to 7:59 AM | 181 (8.0%) | 274 (15.9%) |
| 8:00 AM to 8:29 AM | 467 (20.6%) | 231 (13.4%) |
| 8:30 AM to 8:59 AM | 61 (2.7%) | 164 (9.5%) |
| 9:00 AM to 9:59 AM | 37 (1.6%) | 149 (8.6%) |
| 10:00 AM to 10:59 AM | 79 (3.5%) | 9 (0.5%) |
| 11:00 AM to 11:59 AM | 13 (0.6%) | 12 (0.7%) |
| 12:00 PM to 3:59 PM | 123 (5.4%) | 159 (9.2%) |
| 4:00 PM to 11:59 PM | 130 (5.8%) | 86 (5.0%) |
| Total | 2,262 (100.0%) | 1,725 (100.0%) |
Housing Occupancy in Mount Vista
Occupancy by Ownership in Mount Vista
Of the total 4,014 dwellings in Mount Vista, owner-occupied units account for 2,990 (74.5%), while renter-occupied units make up 1,024 (25.5%).
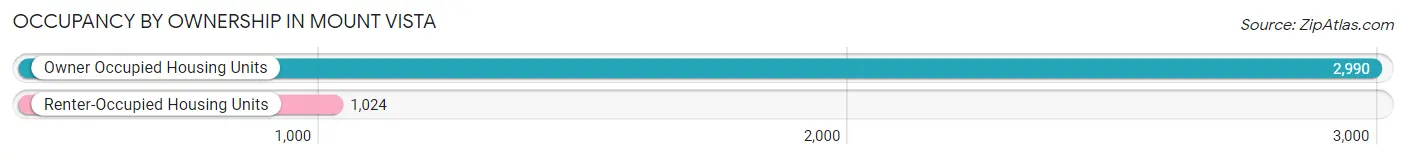
| Occupancy | # Housing Units | % Housing Units |
| Owner Occupied Housing Units | 2,990 | 74.5% |
| Renter-Occupied Housing Units | 1,024 | 25.5% |
| Total Occupied Housing Units | 4,014 | 100.0% |
Occupancy by Household Size in Mount Vista
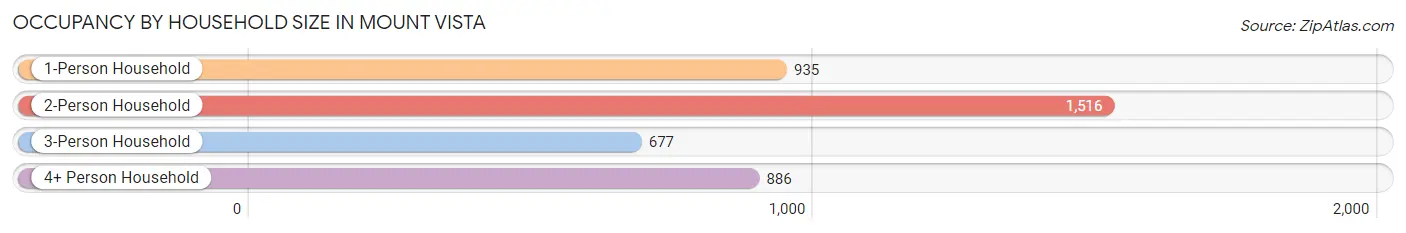
| Household Size | # Housing Units | % Housing Units |
| 1-Person Household | 935 | 23.3% |
| 2-Person Household | 1,516 | 37.8% |
| 3-Person Household | 677 | 16.9% |
| 4+ Person Household | 886 | 22.1% |
| Total Housing Units | 4,014 | 100.0% |
Occupancy by Ownership by Household Size in Mount Vista
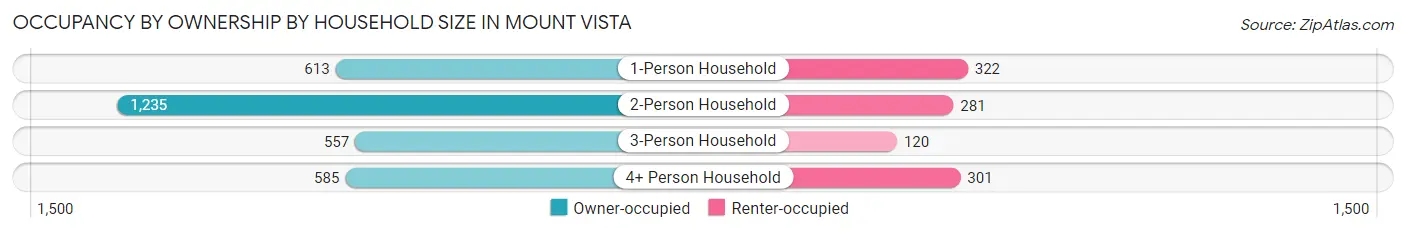
| Household Size | Owner-occupied | Renter-occupied |
| 1-Person Household | 613 (65.6%) | 322 (34.4%) |
| 2-Person Household | 1,235 (81.5%) | 281 (18.5%) |
| 3-Person Household | 557 (82.3%) | 120 (17.7%) |
| 4+ Person Household | 585 (66.0%) | 301 (34.0%) |
| Total Housing Units | 2,990 (74.5%) | 1,024 (25.5%) |
Occupancy by Educational Attainment in Mount Vista
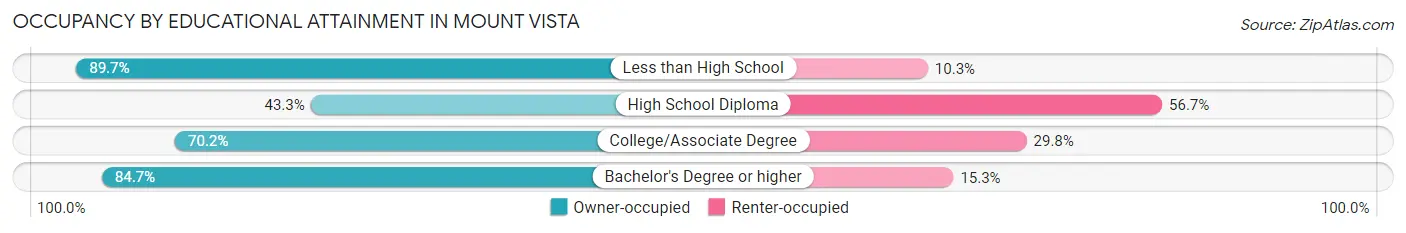
| Household Size | Owner-occupied | Renter-occupied |
| Less than High School | 70 (89.7%) | 8 (10.3%) |
| High School Diploma | 191 (43.3%) | 250 (56.7%) |
| College/Associate Degree | 1,115 (70.2%) | 474 (29.8%) |
| Bachelor's Degree or higher | 1,614 (84.7%) | 292 (15.3%) |
Occupancy by Age of Householder in Mount Vista
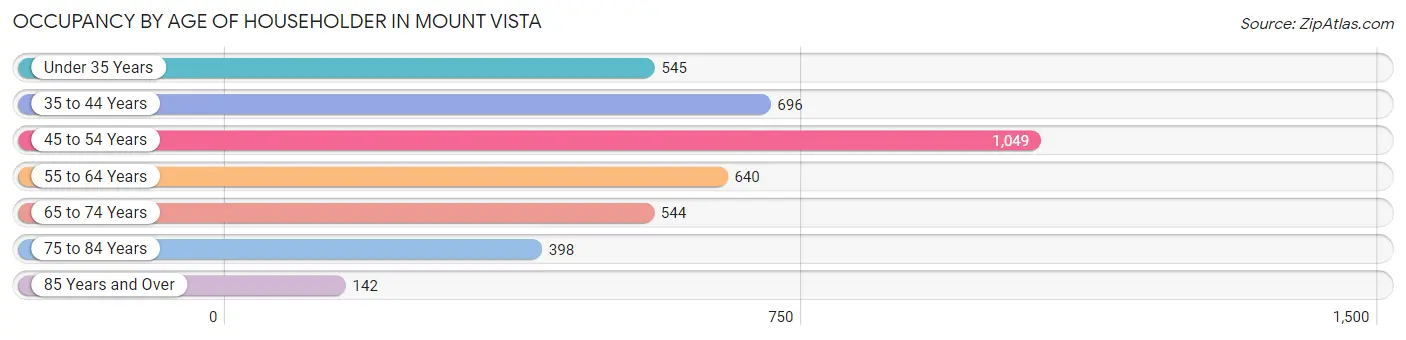
| Age Bracket | # Households | % Households |
| Under 35 Years | 545 | 13.6% |
| 35 to 44 Years | 696 | 17.3% |
| 45 to 54 Years | 1,049 | 26.1% |
| 55 to 64 Years | 640 | 15.9% |
| 65 to 74 Years | 544 | 13.6% |
| 75 to 84 Years | 398 | 9.9% |
| 85 Years and Over | 142 | 3.5% |
| Total | 4,014 | 100.0% |
Housing Finances in Mount Vista
Median Income by Occupancy in Mount Vista
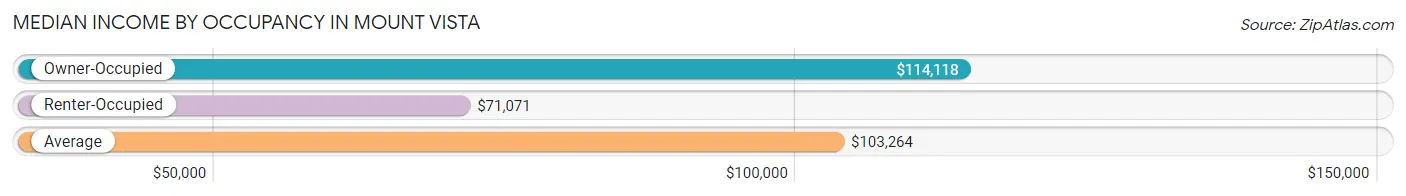
| Occupancy Type | # Households | Median Income |
| Owner-Occupied | 2,990 (74.5%) | $114,118 |
| Renter-Occupied | 1,024 (25.5%) | $71,071 |
| Average | 4,014 (100.0%) | $103,264 |
Occupancy by Householder Income Bracket in Mount Vista
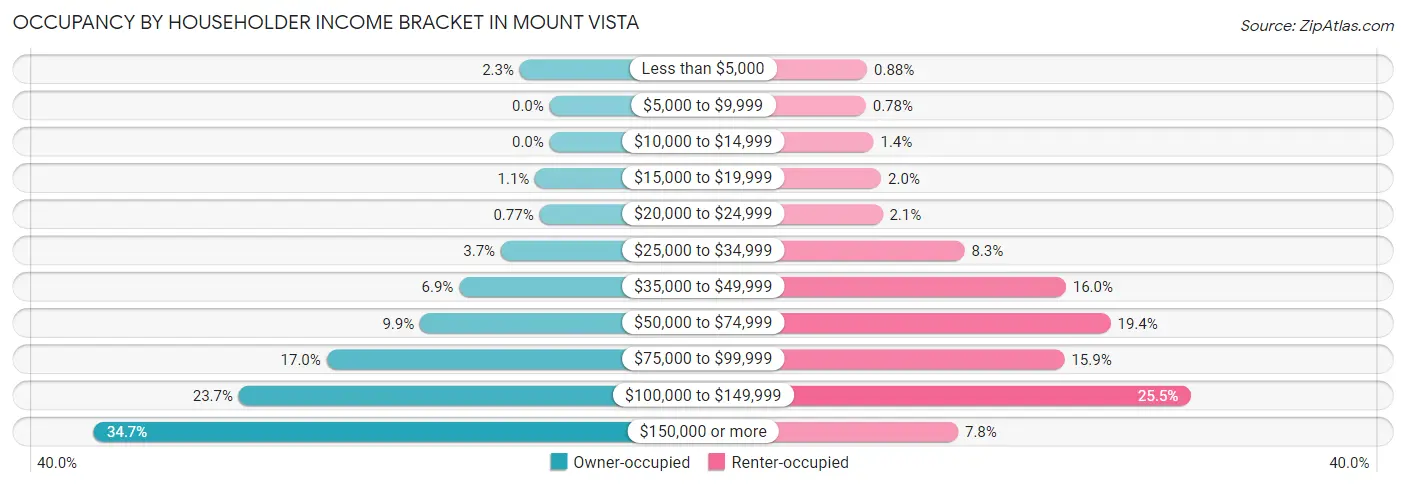
| Income Bracket | Owner-occupied | Renter-occupied |
| Less than $5,000 | 68 (2.3%) | 9 (0.9%) |
| $5,000 to $9,999 | 0 (0.0%) | 8 (0.8%) |
| $10,000 to $14,999 | 0 (0.0%) | 14 (1.4%) |
| $15,000 to $19,999 | 33 (1.1%) | 20 (1.9%) |
| $20,000 to $24,999 | 23 (0.8%) | 21 (2.1%) |
| $25,000 to $34,999 | 111 (3.7%) | 85 (8.3%) |
| $35,000 to $49,999 | 206 (6.9%) | 164 (16.0%) |
| $50,000 to $74,999 | 295 (9.9%) | 199 (19.4%) |
| $75,000 to $99,999 | 508 (17.0%) | 163 (15.9%) |
| $100,000 to $149,999 | 708 (23.7%) | 261 (25.5%) |
| $150,000 or more | 1,038 (34.7%) | 80 (7.8%) |
| Total | 2,990 (100.0%) | 1,024 (100.0%) |
Monthly Housing Cost Tiers in Mount Vista
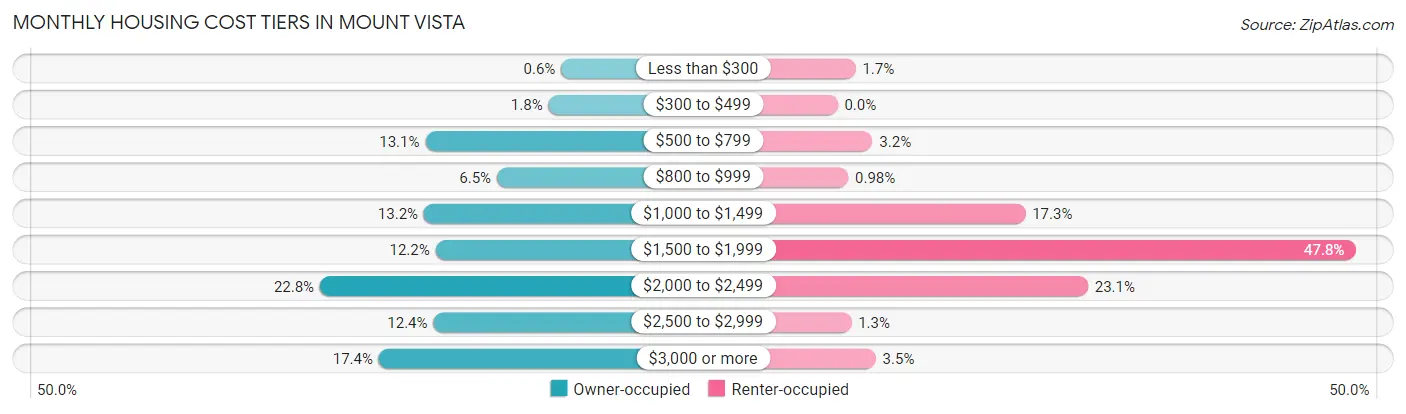
| Monthly Cost | Owner-occupied | Renter-occupied |
| Less than $300 | 18 (0.6%) | 17 (1.7%) |
| $300 to $499 | 53 (1.8%) | 0 (0.0%) |
| $500 to $799 | 392 (13.1%) | 33 (3.2%) |
| $800 to $999 | 195 (6.5%) | 10 (1.0%) |
| $1,000 to $1,499 | 396 (13.2%) | 177 (17.3%) |
| $1,500 to $1,999 | 364 (12.2%) | 489 (47.7%) |
| $2,000 to $2,499 | 682 (22.8%) | 236 (23.1%) |
| $2,500 to $2,999 | 370 (12.4%) | 13 (1.3%) |
| $3,000 or more | 520 (17.4%) | 36 (3.5%) |
| Total | 2,990 (100.0%) | 1,024 (100.0%) |
Physical Housing Characteristics in Mount Vista
Housing Structures in Mount Vista
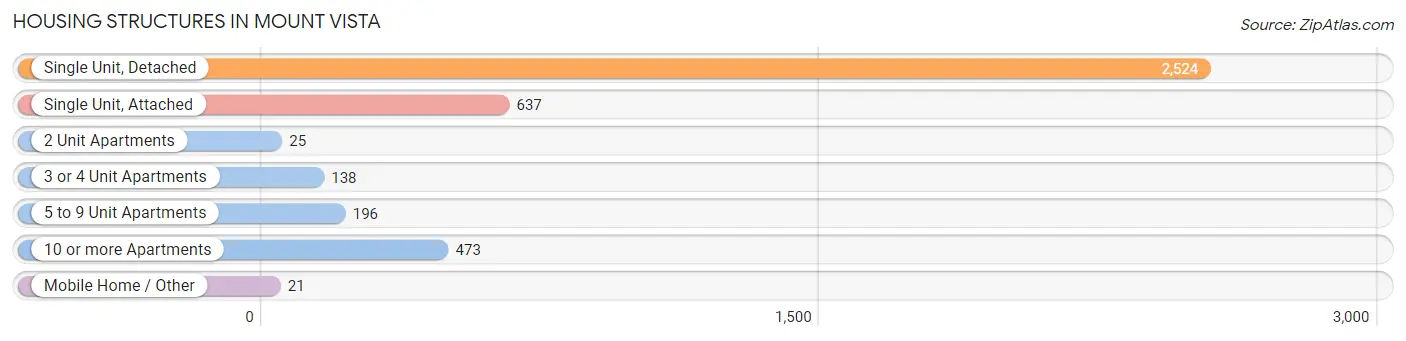
| Structure Type | # Housing Units | % Housing Units |
| Single Unit, Detached | 2,524 | 62.9% |
| Single Unit, Attached | 637 | 15.9% |
| 2 Unit Apartments | 25 | 0.6% |
| 3 or 4 Unit Apartments | 138 | 3.4% |
| 5 to 9 Unit Apartments | 196 | 4.9% |
| 10 or more Apartments | 473 | 11.8% |
| Mobile Home / Other | 21 | 0.5% |
| Total | 4,014 | 100.0% |
Housing Structures by Occupancy in Mount Vista
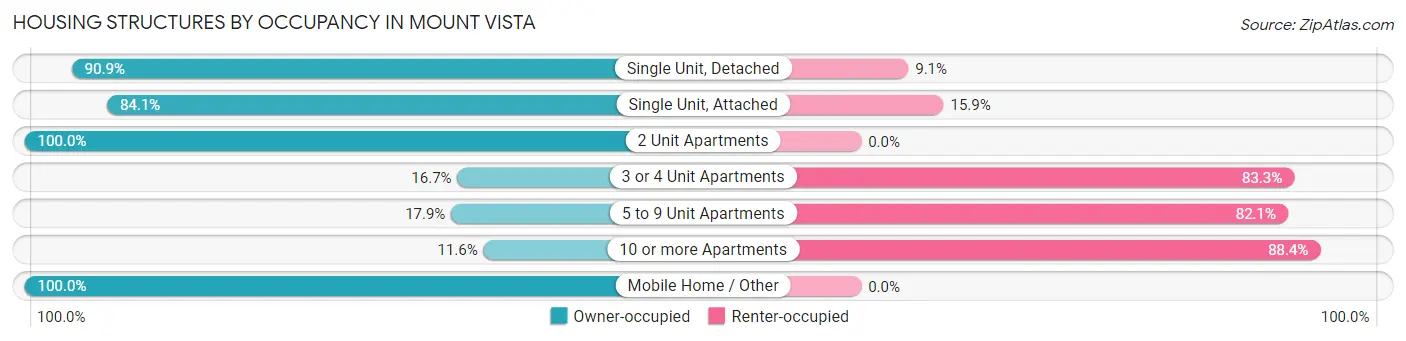
| Structure Type | Owner-occupied | Renter-occupied |
| Single Unit, Detached | 2,295 (90.9%) | 229 (9.1%) |
| Single Unit, Attached | 536 (84.1%) | 101 (15.9%) |
| 2 Unit Apartments | 25 (100.0%) | 0 (0.0%) |
| 3 or 4 Unit Apartments | 23 (16.7%) | 115 (83.3%) |
| 5 to 9 Unit Apartments | 35 (17.9%) | 161 (82.1%) |
| 10 or more Apartments | 55 (11.6%) | 418 (88.4%) |
| Mobile Home / Other | 21 (100.0%) | 0 (0.0%) |
| Total | 2,990 (74.5%) | 1,024 (25.5%) |
Housing Structures by Number of Rooms in Mount Vista
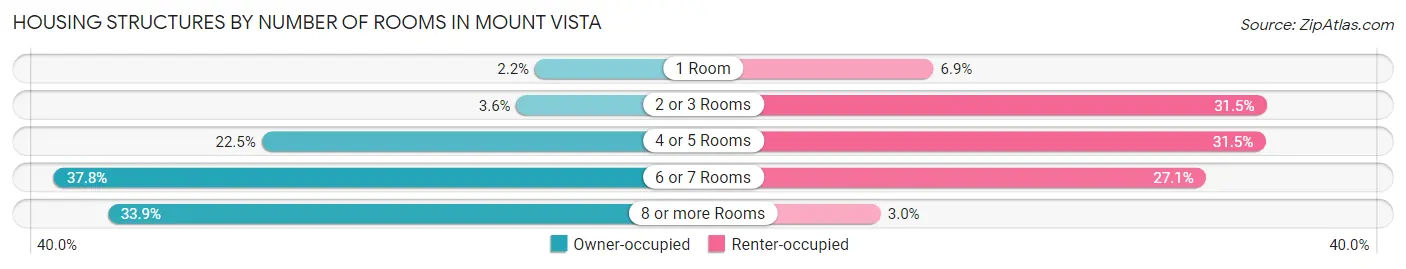
| Number of Rooms | Owner-occupied | Renter-occupied |
| 1 Room | 67 (2.2%) | 71 (6.9%) |
| 2 or 3 Rooms | 108 (3.6%) | 323 (31.5%) |
| 4 or 5 Rooms | 672 (22.5%) | 322 (31.5%) |
| 6 or 7 Rooms | 1,131 (37.8%) | 277 (27.1%) |
| 8 or more Rooms | 1,012 (33.9%) | 31 (3.0%) |
| Total | 2,990 (100.0%) | 1,024 (100.0%) |
Housing Structure by Heating Type in Mount Vista
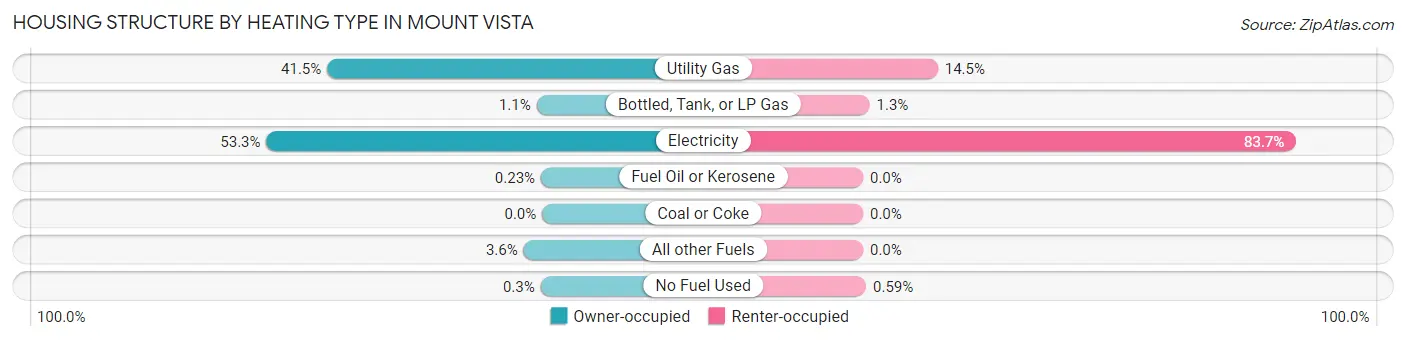
| Heating Type | Owner-occupied | Renter-occupied |
| Utility Gas | 1,242 (41.5%) | 148 (14.4%) |
| Bottled, Tank, or LP Gas | 32 (1.1%) | 13 (1.3%) |
| Electricity | 1,593 (53.3%) | 857 (83.7%) |
| Fuel Oil or Kerosene | 7 (0.2%) | 0 (0.0%) |
| Coal or Coke | 0 (0.0%) | 0 (0.0%) |
| All other Fuels | 107 (3.6%) | 0 (0.0%) |
| No Fuel Used | 9 (0.3%) | 6 (0.6%) |
| Total | 2,990 (100.0%) | 1,024 (100.0%) |
Household Vehicle Usage in Mount Vista
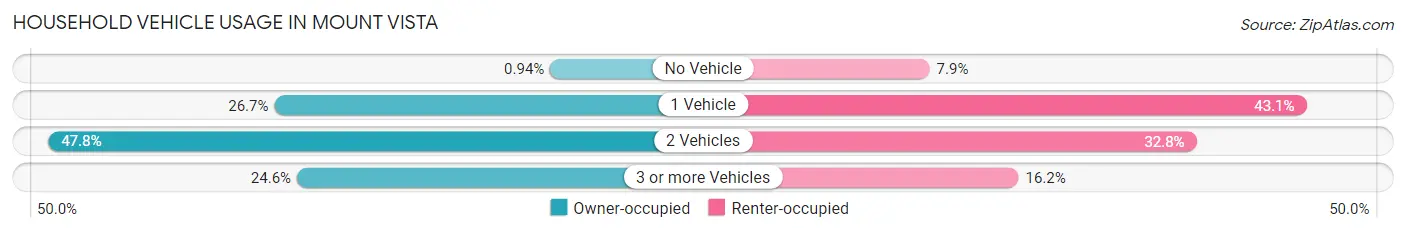
| Vehicles per Household | Owner-occupied | Renter-occupied |
| No Vehicle | 28 (0.9%) | 81 (7.9%) |
| 1 Vehicle | 798 (26.7%) | 441 (43.1%) |
| 2 Vehicles | 1,429 (47.8%) | 336 (32.8%) |
| 3 or more Vehicles | 735 (24.6%) | 166 (16.2%) |
| Total | 2,990 (100.0%) | 1,024 (100.0%) |
Real Estate & Mortgages in Mount Vista
Real Estate and Mortgage Overview in Mount Vista
| Characteristic | Without Mortgage | With Mortgage |
| Housing Units | 777 | 2,213 |
| Median Property Value | $471,800 | $496,000 |
| Median Household Income | $87,060 | $838 |
| Monthly Housing Costs | $755 | $520 |
| Real Estate Taxes | $4,653 | $59 |
Property Value by Mortgage Status in Mount Vista
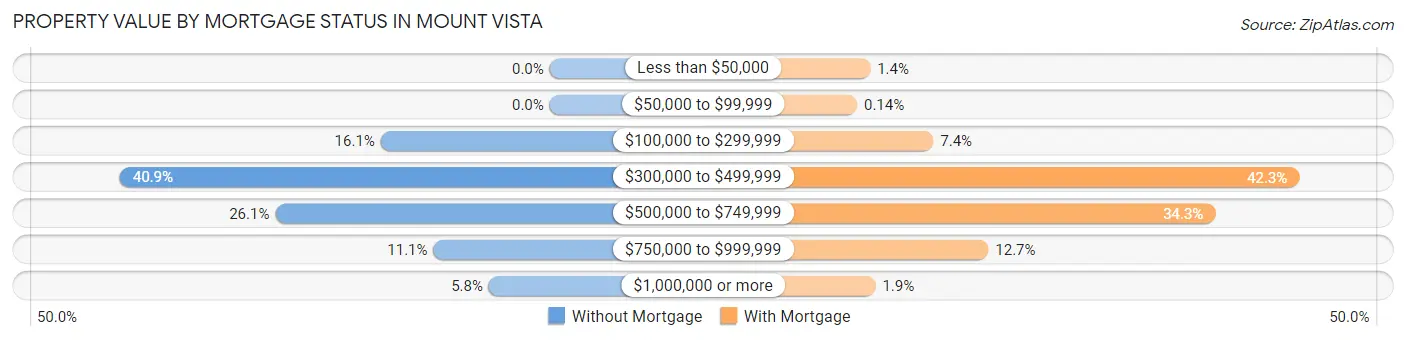
| Property Value | Without Mortgage | With Mortgage |
| Less than $50,000 | 0 (0.0%) | 31 (1.4%) |
| $50,000 to $99,999 | 0 (0.0%) | 3 (0.1%) |
| $100,000 to $299,999 | 125 (16.1%) | 164 (7.4%) |
| $300,000 to $499,999 | 318 (40.9%) | 935 (42.2%) |
| $500,000 to $749,999 | 203 (26.1%) | 758 (34.3%) |
| $750,000 to $999,999 | 86 (11.1%) | 280 (12.7%) |
| $1,000,000 or more | 45 (5.8%) | 42 (1.9%) |
| Total | 777 (100.0%) | 2,213 (100.0%) |
Household Income by Mortgage Status in Mount Vista
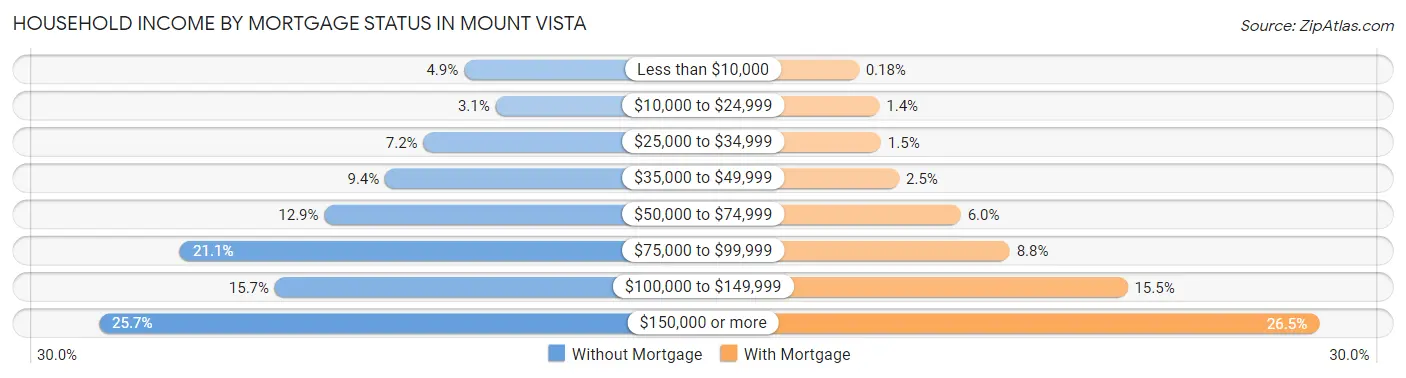
| Household Income | Without Mortgage | With Mortgage |
| Less than $10,000 | 38 (4.9%) | 4 (0.2%) |
| $10,000 to $24,999 | 24 (3.1%) | 30 (1.4%) |
| $25,000 to $34,999 | 56 (7.2%) | 32 (1.5%) |
| $35,000 to $49,999 | 73 (9.4%) | 55 (2.5%) |
| $50,000 to $74,999 | 100 (12.9%) | 133 (6.0%) |
| $75,000 to $99,999 | 164 (21.1%) | 195 (8.8%) |
| $100,000 to $149,999 | 122 (15.7%) | 344 (15.5%) |
| $150,000 or more | 200 (25.7%) | 586 (26.5%) |
| Total | 777 (100.0%) | 2,213 (100.0%) |
Property Value to Household Income Ratio in Mount Vista
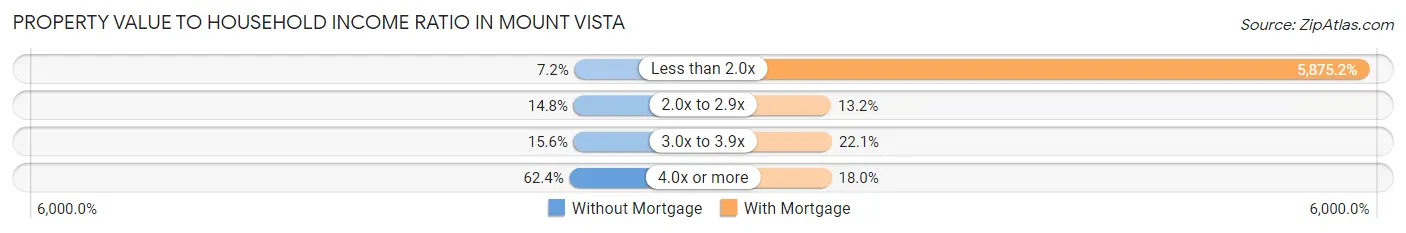
| Value-to-Income Ratio | Without Mortgage | With Mortgage |
| Less than 2.0x | 56 (7.2%) | 130,018 (5,875.2%) |
| 2.0x to 2.9x | 115 (14.8%) | 292 (13.2%) |
| 3.0x to 3.9x | 121 (15.6%) | 489 (22.1%) |
| 4.0x or more | 485 (62.4%) | 398 (18.0%) |
| Total | 777 (100.0%) | 2,213 (100.0%) |
Real Estate Taxes by Mortgage Status in Mount Vista
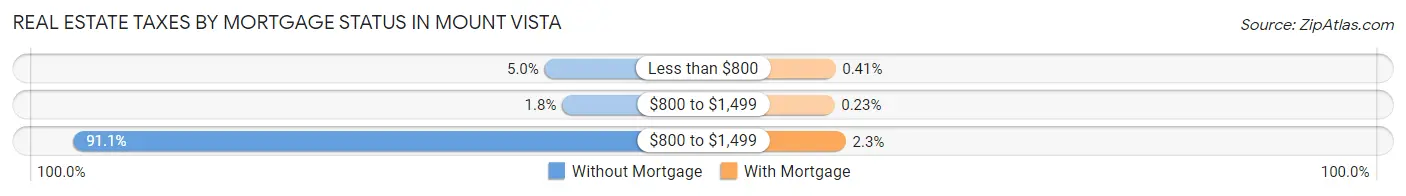
| Property Taxes | Without Mortgage | With Mortgage |
| Less than $800 | 39 (5.0%) | 9 (0.4%) |
| $800 to $1,499 | 14 (1.8%) | 5 (0.2%) |
| $800 to $1,499 | 708 (91.1%) | 51 (2.3%) |
| Total | 777 (100.0%) | 2,213 (100.0%) |
Health & Disability in Mount Vista
Health Insurance Coverage by Age in Mount Vista
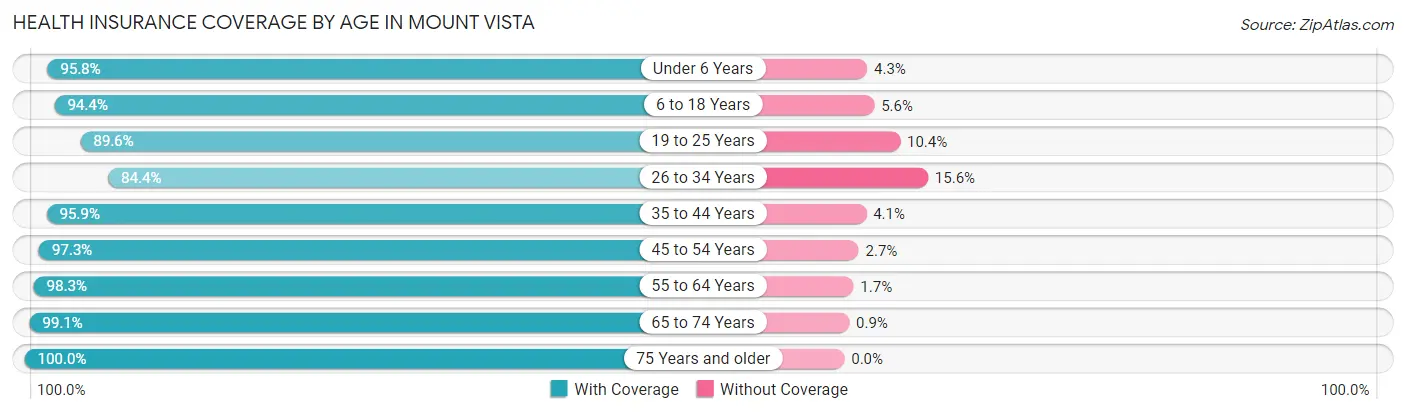
| Age Bracket | With Coverage | Without Coverage |
| Under 6 Years | 924 (95.8%) | 41 (4.3%) |
| 6 to 18 Years | 1,556 (94.4%) | 92 (5.6%) |
| 19 to 25 Years | 620 (89.6%) | 72 (10.4%) |
| 26 to 34 Years | 980 (84.4%) | 181 (15.6%) |
| 35 to 44 Years | 1,196 (95.9%) | 51 (4.1%) |
| 45 to 54 Years | 1,641 (97.3%) | 45 (2.7%) |
| 55 to 64 Years | 1,043 (98.3%) | 18 (1.7%) |
| 65 to 74 Years | 988 (99.1%) | 9 (0.9%) |
| 75 Years and older | 910 (100.0%) | 0 (0.0%) |
| Total | 9,858 (95.1%) | 509 (4.9%) |
Health Insurance Coverage by Citizenship Status in Mount Vista
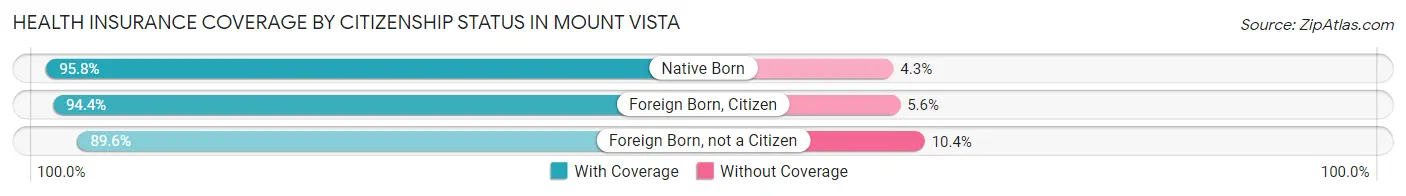
| Citizenship Status | With Coverage | Without Coverage |
| Native Born | 924 (95.8%) | 41 (4.3%) |
| Foreign Born, Citizen | 1,556 (94.4%) | 92 (5.6%) |
| Foreign Born, not a Citizen | 620 (89.6%) | 72 (10.4%) |
Health Insurance Coverage by Household Income in Mount Vista
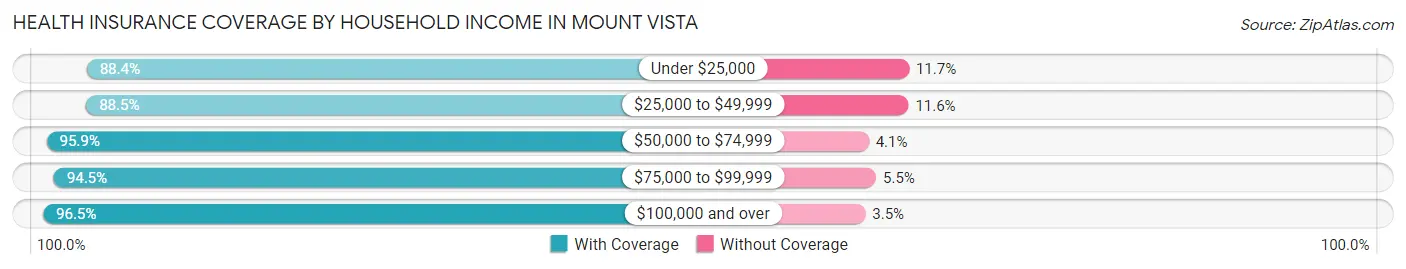
| Household Income | With Coverage | Without Coverage |
| Under $25,000 | 273 (88.3%) | 36 (11.7%) |
| $25,000 to $49,999 | 942 (88.4%) | 123 (11.6%) |
| $50,000 to $74,999 | 1,144 (95.9%) | 49 (4.1%) |
| $75,000 to $99,999 | 1,447 (94.5%) | 84 (5.5%) |
| $100,000 and over | 6,036 (96.5%) | 217 (3.5%) |
Public vs Private Health Insurance Coverage by Age in Mount Vista
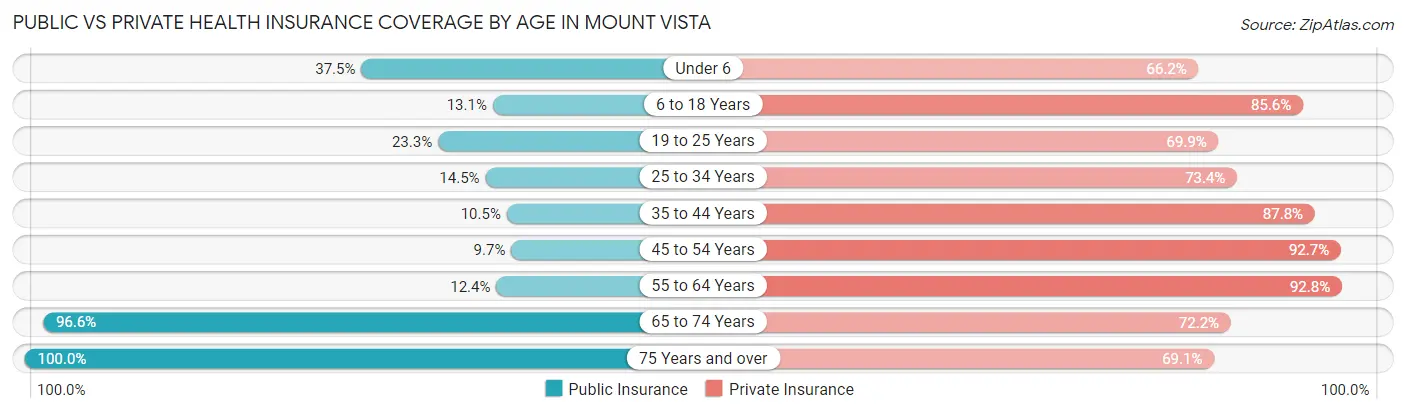
| Age Bracket | Public Insurance | Private Insurance |
| Under 6 | 362 (37.5%) | 639 (66.2%) |
| 6 to 18 Years | 216 (13.1%) | 1,411 (85.6%) |
| 19 to 25 Years | 161 (23.3%) | 484 (69.9%) |
| 25 to 34 Years | 168 (14.5%) | 852 (73.4%) |
| 35 to 44 Years | 131 (10.5%) | 1,095 (87.8%) |
| 45 to 54 Years | 163 (9.7%) | 1,562 (92.6%) |
| 55 to 64 Years | 132 (12.4%) | 985 (92.8%) |
| 65 to 74 Years | 963 (96.6%) | 720 (72.2%) |
| 75 Years and over | 910 (100.0%) | 629 (69.1%) |
| Total | 3,206 (30.9%) | 8,377 (80.8%) |
Disability Status by Sex by Age in Mount Vista
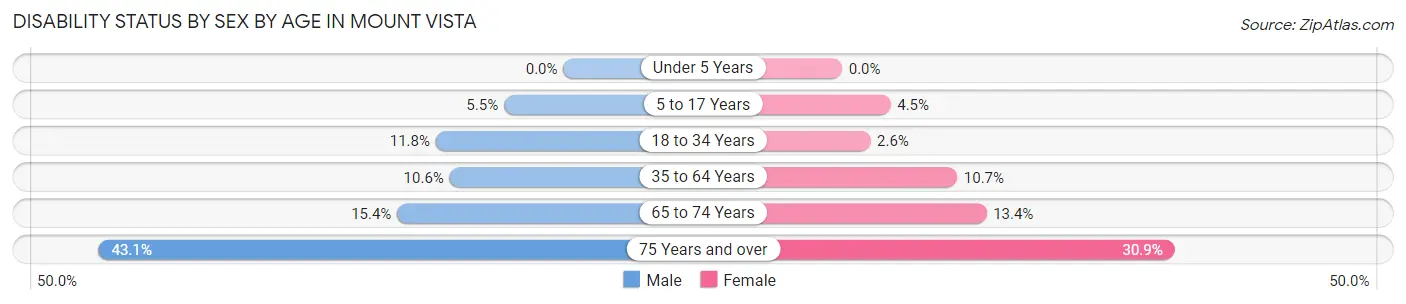
| Age Bracket | Male | Female |
| Under 5 Years | 0 (0.0%) | 0 (0.0%) |
| 5 to 17 Years | 44 (5.5%) | 41 (4.5%) |
| 18 to 34 Years | 141 (11.8%) | 21 (2.6%) |
| 35 to 64 Years | 209 (10.5%) | 215 (10.7%) |
| 65 to 74 Years | 64 (15.4%) | 78 (13.4%) |
| 75 Years and over | 176 (43.1%) | 155 (30.9%) |
Disability Class by Sex by Age in Mount Vista
Disability Class: Hearing Difficulty
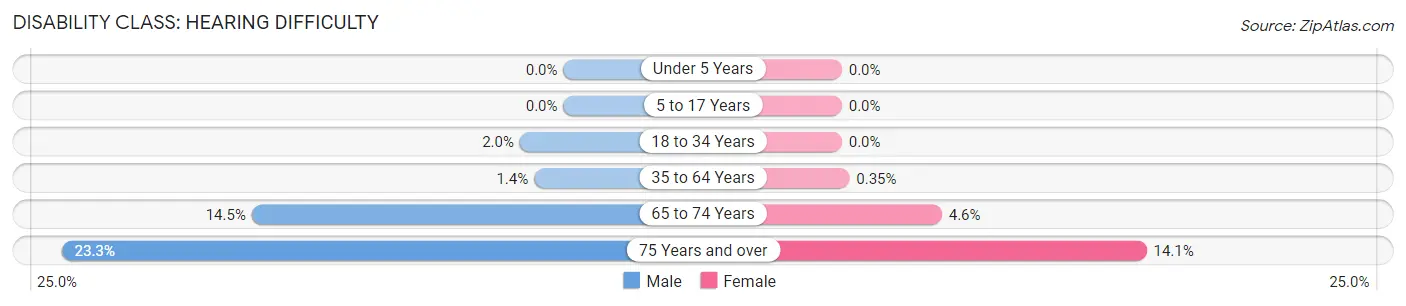
| Age Bracket | Male | Female |
| Under 5 Years | 0 (0.0%) | 0 (0.0%) |
| 5 to 17 Years | 0 (0.0%) | 0 (0.0%) |
| 18 to 34 Years | 24 (2.0%) | 0 (0.0%) |
| 35 to 64 Years | 27 (1.4%) | 7 (0.4%) |
| 65 to 74 Years | 60 (14.5%) | 27 (4.6%) |
| 75 Years and over | 95 (23.3%) | 71 (14.1%) |
Disability Class: Vision Difficulty
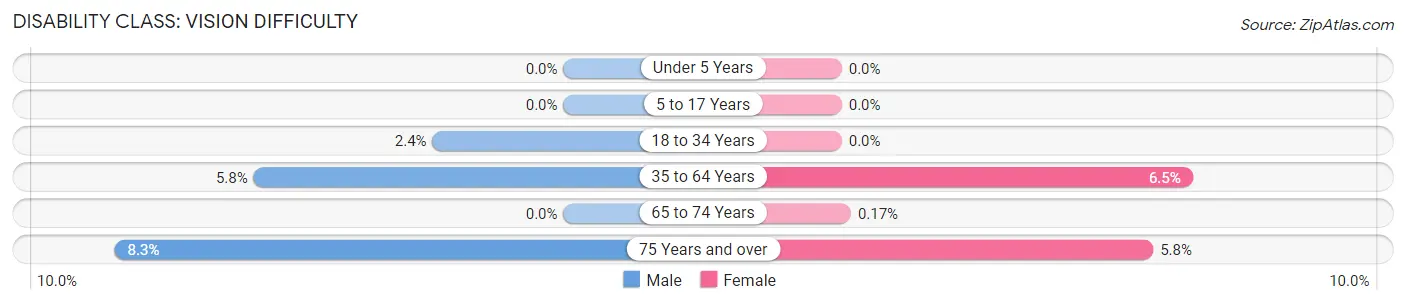
| Age Bracket | Male | Female |
| Under 5 Years | 0 (0.0%) | 0 (0.0%) |
| 5 to 17 Years | 0 (0.0%) | 0 (0.0%) |
| 18 to 34 Years | 29 (2.4%) | 0 (0.0%) |
| 35 to 64 Years | 114 (5.8%) | 131 (6.5%) |
| 65 to 74 Years | 0 (0.0%) | 1 (0.2%) |
| 75 Years and over | 34 (8.3%) | 29 (5.8%) |
Disability Class: Cognitive Difficulty
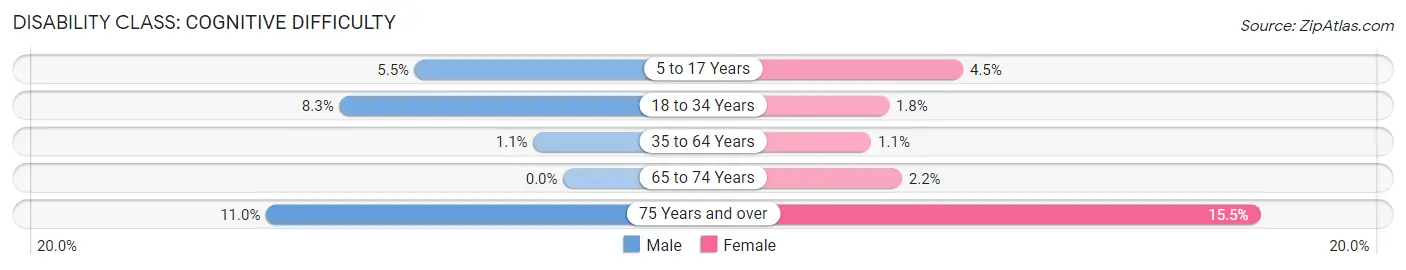
| Age Bracket | Male | Female |
| 5 to 17 Years | 44 (5.5%) | 41 (4.5%) |
| 18 to 34 Years | 99 (8.3%) | 14 (1.8%) |
| 35 to 64 Years | 22 (1.1%) | 22 (1.1%) |
| 65 to 74 Years | 0 (0.0%) | 13 (2.2%) |
| 75 Years and over | 45 (11.0%) | 78 (15.5%) |
Disability Class: Ambulatory Difficulty
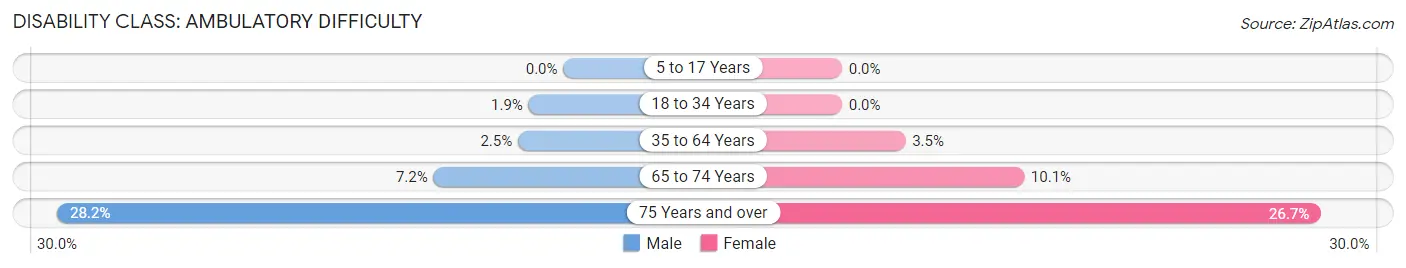
| Age Bracket | Male | Female |
| 5 to 17 Years | 0 (0.0%) | 0 (0.0%) |
| 18 to 34 Years | 23 (1.9%) | 0 (0.0%) |
| 35 to 64 Years | 50 (2.5%) | 71 (3.5%) |
| 65 to 74 Years | 30 (7.2%) | 59 (10.1%) |
| 75 Years and over | 115 (28.2%) | 134 (26.7%) |
Disability Class: Self-Care Difficulty
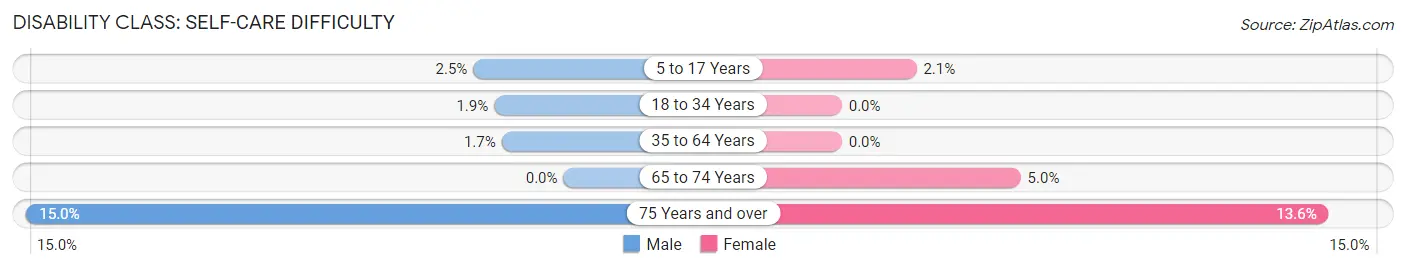
| Age Bracket | Male | Female |
| 5 to 17 Years | 20 (2.5%) | 19 (2.1%) |
| 18 to 34 Years | 23 (1.9%) | 0 (0.0%) |
| 35 to 64 Years | 34 (1.7%) | 0 (0.0%) |
| 65 to 74 Years | 0 (0.0%) | 29 (5.0%) |
| 75 Years and over | 61 (14.9%) | 68 (13.6%) |
Technology Access in Mount Vista
Computing Device Access in Mount Vista

| Device Type | # Households | % Households |
| Desktop or Laptop | 3,656 | 91.1% |
| Smartphone | 3,751 | 93.4% |
| Tablet | 2,966 | 73.9% |
| No Computing Device | 61 | 1.5% |
| Total | 4,014 | 100.0% |
Internet Access in Mount Vista
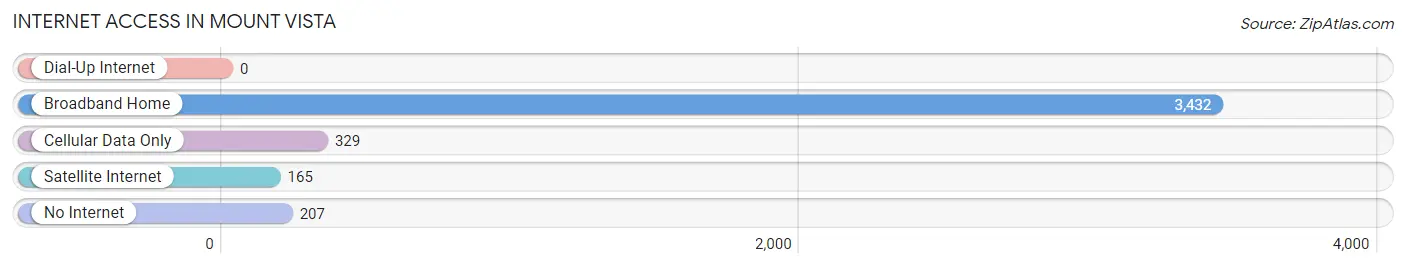
| Internet Type | # Households | % Households |
| Dial-Up Internet | 0 | 0.0% |
| Broadband Home | 3,432 | 85.5% |
| Cellular Data Only | 329 | 8.2% |
| Satellite Internet | 165 | 4.1% |
| No Internet | 207 | 5.2% |
| Total | 4,014 | 100.0% |
Mount Vista Summary
History
Mount Vista is a small unincorporated community located in Pierce County, Washington. It is situated in the foothills of the Cascade Mountains, approximately 20 miles east of Tacoma. The area was first settled in the late 1800s by homesteaders and loggers. The community was named after the nearby Mount Vista, which is the highest peak in the area.
The first post office in Mount Vista was established in 1891. The community was primarily a logging and farming community until the 1950s, when the area began to experience rapid growth due to the expansion of the nearby city of Tacoma. The population of Mount Vista increased from just over 200 in 1950 to over 1,000 by the year 2000.
Geography
Mount Vista is located in Pierce County, Washington, approximately 20 miles east of Tacoma. The community is situated in the foothills of the Cascade Mountains, with Mount Vista being the highest peak in the area. The area is characterized by rolling hills, dense forests, and numerous creeks and streams. The climate is mild, with temperatures ranging from the mid-30s in the winter to the mid-70s in the summer.
The area is home to a variety of wildlife, including deer, elk, bear, cougar, and numerous species of birds. The nearby Mount Rainier National Park is a popular destination for hikers and outdoor enthusiasts.
Economy
The economy of Mount Vista is largely based on the nearby city of Tacoma. The area is home to a variety of businesses, including retail stores, restaurants, and professional services. The nearby Joint Base Lewis-McChord is a major employer in the area, providing jobs for many of the residents.
The area is also home to a number of small farms and ranches, which produce a variety of crops and livestock. The nearby forests provide timber for the local lumber industry.
Demographics
As of the 2010 census, the population of Mount Vista was 1,093. The racial makeup of the community was 91.3% White, 2.2% African American, 0.7% Native American, 1.2% Asian, 0.2% Pacific Islander, and 4.4% from other races. The median household income was $50,938, and the median family income was $60,938.
The population of Mount Vista is largely composed of families, with nearly half of the population under the age of 18. The area is served by the Bethel School District, which includes two elementary schools, one middle school, and one high school. The area is also home to a number of churches, including the Mount Vista Community Church.
Common Questions
What is Per Capita Income in Mount Vista?
Per Capita income in Mount Vista is $48,750.
What is the Median Family Income in Mount Vista?
Median Family Income in Mount Vista is $123,177.
What is the Median Household income in Mount Vista?
Median Household Income in Mount Vista is $103,264.
What is Income or Wage Gap in Mount Vista?
Income or Wage Gap in Mount Vista is 27.4%.
Women in Mount Vista earn 72.6 cents for every dollar earned by a man.
What is Family Income Deficit in Mount Vista?
Family Income Deficit in Mount Vista is $10,759.
Families that are below poverty line in Mount Vista earn $10,759 less on average than the poverty threshold level.
What is Inequality or Gini Index in Mount Vista?
Inequality or Gini Index in Mount Vista is 0.37.
What is the Total Population of Mount Vista?
Total Population of Mount Vista is 10,399.
What is the Total Male Population of Mount Vista?
Total Male Population of Mount Vista is 5,346.
What is the Total Female Population of Mount Vista?
Total Female Population of Mount Vista is 5,053.
What is the Ratio of Males per 100 Females in Mount Vista?
There are 105.80 Males per 100 Females in Mount Vista.
What is the Ratio of Females per 100 Males in Mount Vista?
There are 94.52 Females per 100 Males in Mount Vista.
What is the Median Population Age in Mount Vista?
Median Population Age in Mount Vista is 40.4 Years.
What is the Average Family Size in Mount Vista
Average Family Size in Mount Vista is 3.0 People.
What is the Average Household Size in Mount Vista
Average Household Size in Mount Vista is 2.6 People.
How Large is the Labor Force in Mount Vista?
There are 5,123 People in the Labor Forcein in Mount Vista.
What is the Percentage of People in the Labor Force in Mount Vista?
62.7% of People are in the Labor Force in Mount Vista.
What is the Unemployment Rate in Mount Vista?
Unemployment Rate in Mount Vista is 2.9%.