White Salmon, WA Map & Demographics
White Salmon Map
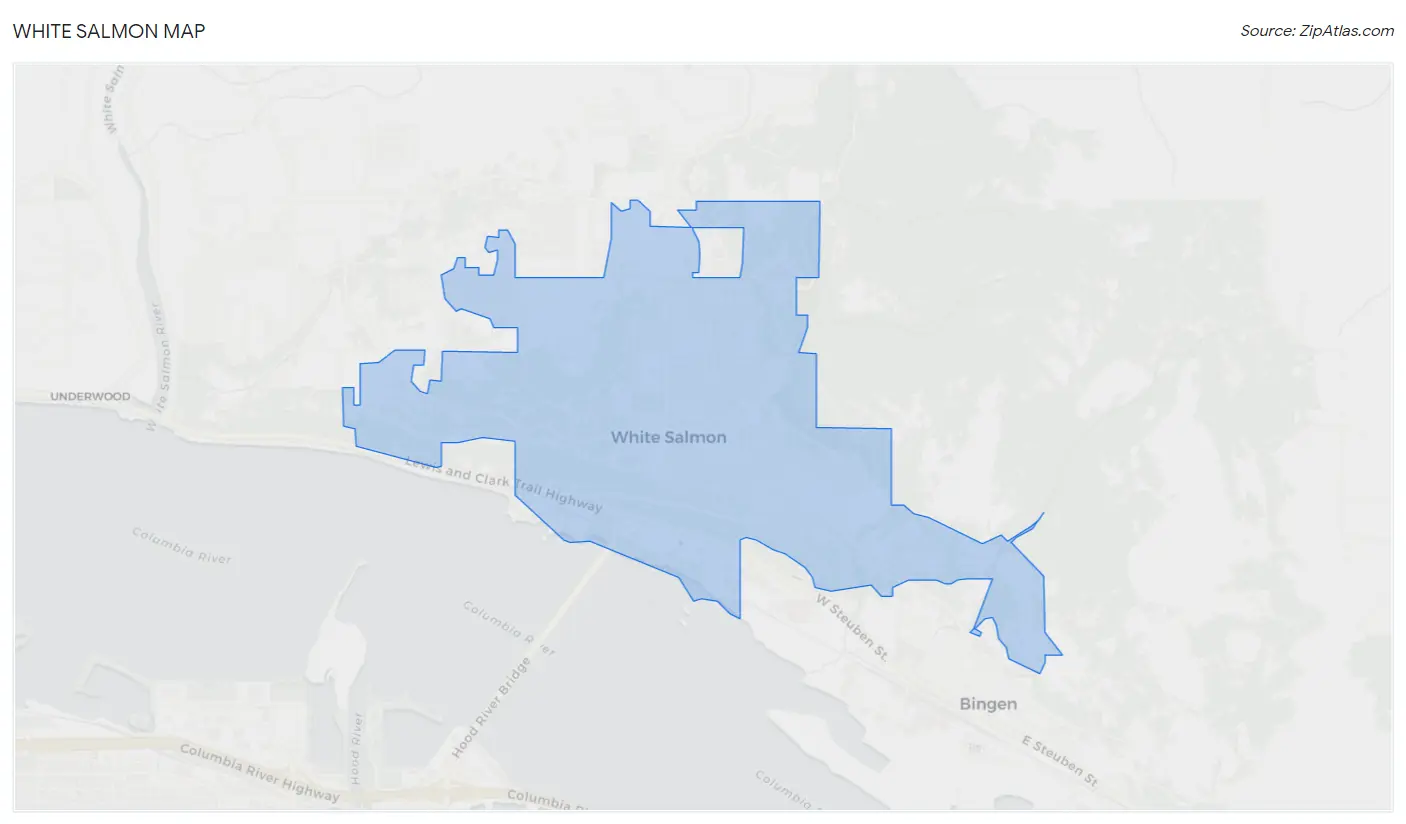
White Salmon Overview
$42,926
PER CAPITA INCOME
$100,833
AVG FAMILY INCOME
$72,692
AVG HOUSEHOLD INCOME
38.4%
WAGE / INCOME GAP [ % ]
61.6¢/ $1
WAGE / INCOME GAP [ $ ]
0.39
INEQUALITY / GINI INDEX
2,505
TOTAL POPULATION
1,270
MALE POPULATION
1,235
FEMALE POPULATION
102.83
MALES / 100 FEMALES
97.24
FEMALES / 100 MALES
51.2
MEDIAN AGE
2.9
AVG FAMILY SIZE
2.2
AVG HOUSEHOLD SIZE
1,303
LABOR FORCE [ PEOPLE ]
58.9%
PERCENT IN LABOR FORCE
1.1%
UNEMPLOYMENT RATE
White Salmon Zip Codes
White Salmon Area Codes
Income in White Salmon
Income Overview in White Salmon
Per Capita Income in White Salmon is $42,926, while median incomes of families and households are $100,833 and $72,692 respectively.
| Characteristic | Number | Measure |
| Per Capita Income | 2,505 | $42,926 |
| Median Family Income | 624 | $100,833 |
| Mean Family Income | 624 | $116,778 |
| Median Household Income | 1,142 | $72,692 |
| Mean Household Income | 1,142 | $91,987 |
| Income Deficit | 624 | $0 |
| Wage / Income Gap (%) | 2,505 | 38.44% |
| Wage / Income Gap ($) | 2,505 | 61.56¢ per $1 |
| Gini / Inequality Index | 2,505 | 0.39 |
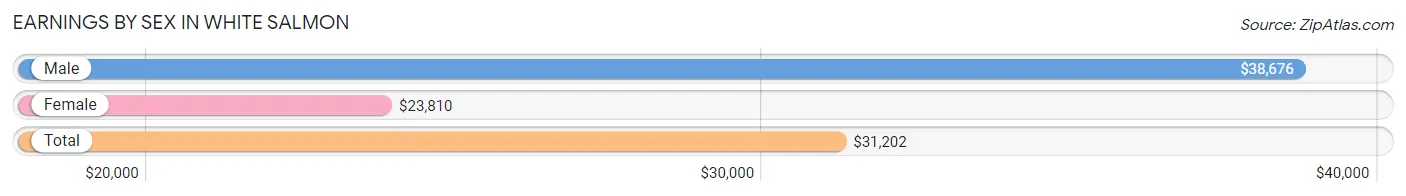
Earnings by Sex in White Salmon
Average Earnings in White Salmon are $31,202, $38,676 for men and $23,810 for women, a difference of 38.4%.
| Sex | Number | Average Earnings |
| Male | 772 (52.8%) | $38,676 |
| Female | 690 (47.2%) | $23,810 |
| Total | 1,462 (100.0%) | $31,202 |
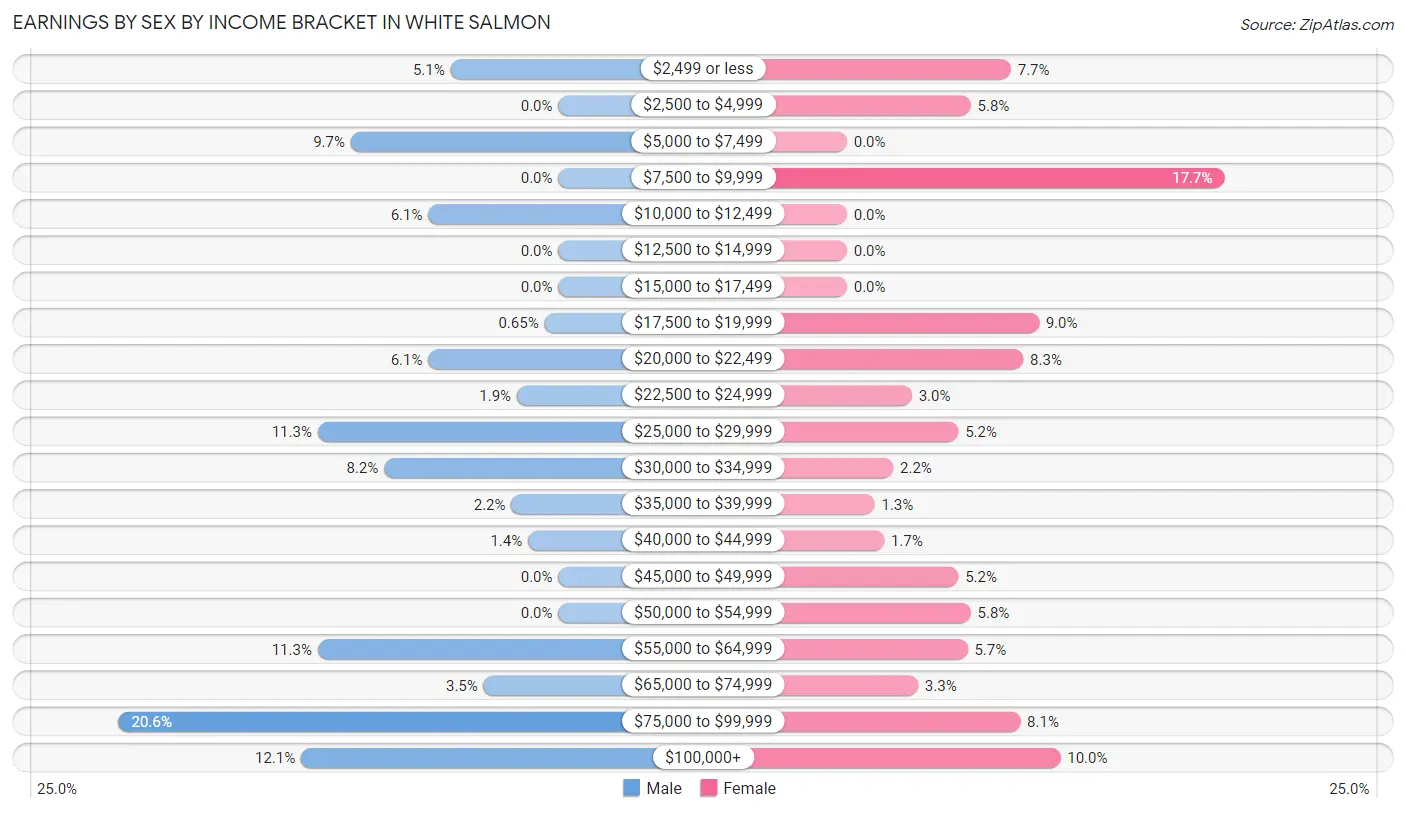
Earnings by Sex by Income Bracket in White Salmon
The most common earnings brackets in White Salmon are $75,000 to $99,999 for men (159 | 20.6%) and $7,500 to $9,999 for women (122 | 17.7%).
| Income | Male | Female |
| $2,499 or less | 39 (5.1%) | 53 (7.7%) |
| $2,500 to $4,999 | 0 (0.0%) | 40 (5.8%) |
| $5,000 to $7,499 | 75 (9.7%) | 0 (0.0%) |
| $7,500 to $9,999 | 0 (0.0%) | 122 (17.7%) |
| $10,000 to $12,499 | 47 (6.1%) | 0 (0.0%) |
| $12,500 to $14,999 | 0 (0.0%) | 0 (0.0%) |
| $15,000 to $17,499 | 0 (0.0%) | 0 (0.0%) |
| $17,500 to $19,999 | 5 (0.6%) | 62 (9.0%) |
| $20,000 to $22,499 | 47 (6.1%) | 57 (8.3%) |
| $22,500 to $24,999 | 15 (1.9%) | 21 (3.0%) |
| $25,000 to $29,999 | 87 (11.3%) | 36 (5.2%) |
| $30,000 to $34,999 | 63 (8.2%) | 15 (2.2%) |
| $35,000 to $39,999 | 17 (2.2%) | 9 (1.3%) |
| $40,000 to $44,999 | 11 (1.4%) | 12 (1.7%) |
| $45,000 to $49,999 | 0 (0.0%) | 36 (5.2%) |
| $50,000 to $54,999 | 0 (0.0%) | 40 (5.8%) |
| $55,000 to $64,999 | 87 (11.3%) | 39 (5.7%) |
| $65,000 to $74,999 | 27 (3.5%) | 23 (3.3%) |
| $75,000 to $99,999 | 159 (20.6%) | 56 (8.1%) |
| $100,000+ | 93 (12.0%) | 69 (10.0%) |
| Total | 772 (100.0%) | 690 (100.0%) |
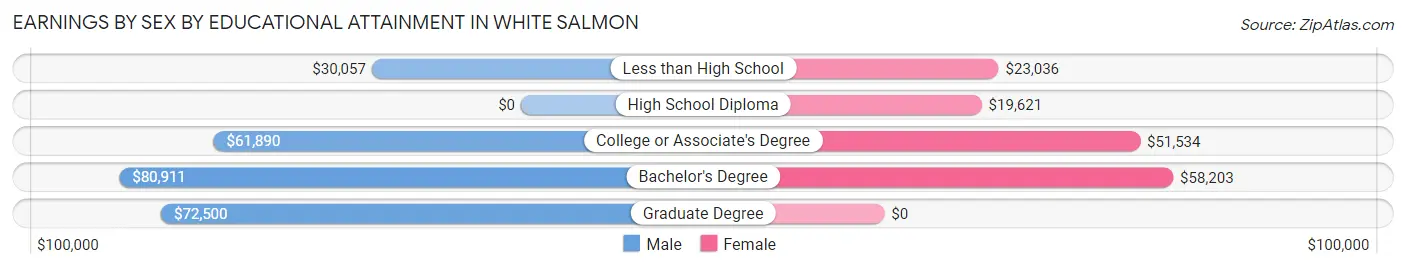
Earnings by Sex by Educational Attainment in White Salmon
Average earnings in White Salmon are $57,593 for men and $46,597 for women, a difference of 19.1%. Men with an educational attainment of bachelor's degree enjoy the highest average annual earnings of $80,911, while those with less than high school education earn the least with $30,057. Women with an educational attainment of bachelor's degree earn the most with the average annual earnings of $58,203, while those with high school diploma education have the smallest earnings of $19,621.
| Educational Attainment | Male Income | Female Income |
| Less than High School | $30,057 | $23,036 |
| High School Diploma | - | - |
| College or Associate's Degree | $61,890 | $51,534 |
| Bachelor's Degree | $80,911 | $58,203 |
| Graduate Degree | $72,500 | $0 |
| Total | $57,593 | $46,597 |
Family Income in White Salmon
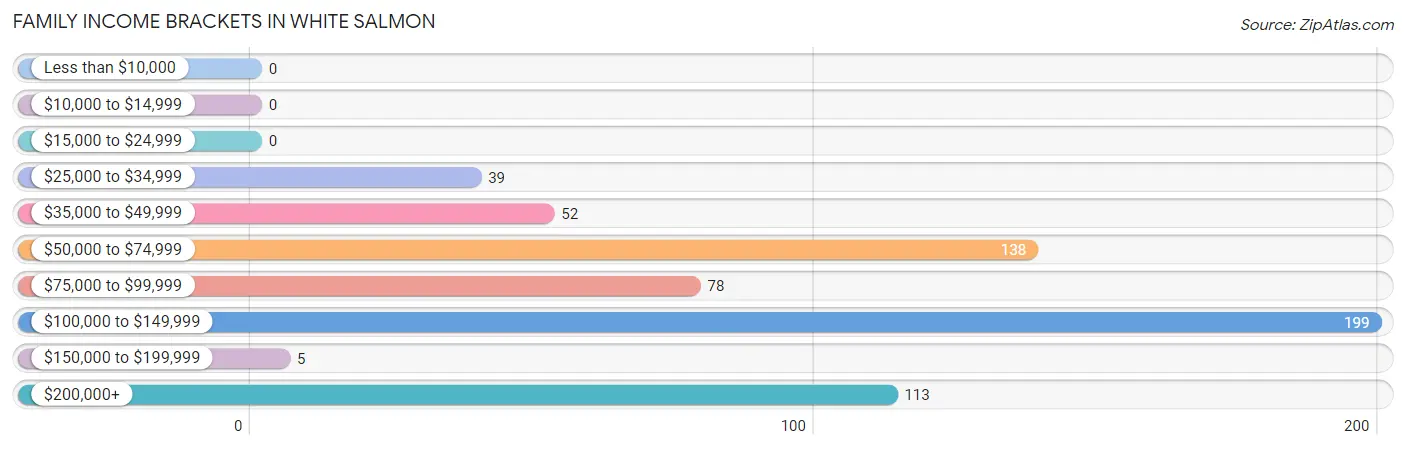
Family Income Brackets in White Salmon
According to the White Salmon family income data, there are 199 families falling into the $100,000 to $149,999 income range, which is the most common income bracket and makes up 31.9% of all families.
| Income Bracket | # Families | % Families |
| Less than $10,000 | 0 | 0.0% |
| $10,000 to $14,999 | 0 | 0.0% |
| $15,000 to $24,999 | 0 | 0.0% |
| $25,000 to $34,999 | 39 | 6.3% |
| $35,000 to $49,999 | 52 | 8.3% |
| $50,000 to $74,999 | 138 | 22.1% |
| $75,000 to $99,999 | 78 | 12.5% |
| $100,000 to $149,999 | 199 | 31.9% |
| $150,000 to $199,999 | 5 | 0.8% |
| $200,000+ | 113 | 18.1% |
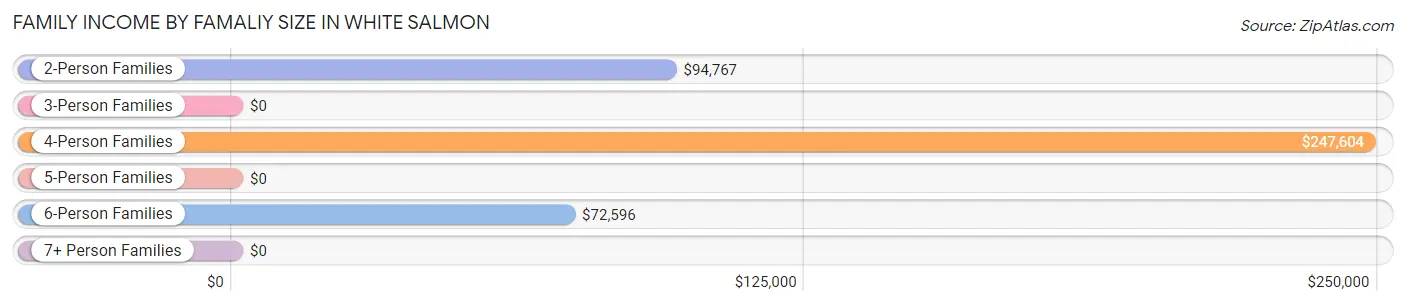
Family Income by Famaliy Size in White Salmon
4-person families (92 | 14.7%) account for the highest median family income in White Salmon with $247,604 per family, while 4-person families (92 | 14.7%) have the highest median income of $61,901 per family member.
| Income Bracket | # Families | Median Income |
| 2-Person Families | 346 (55.4%) | $94,767 |
| 3-Person Families | 127 (20.3%) | $0 |
| 4-Person Families | 92 (14.7%) | $247,604 |
| 5-Person Families | 12 (1.9%) | $0 |
| 6-Person Families | 47 (7.5%) | $72,596 |
| 7+ Person Families | 0 (0.0%) | $0 |
| Total | 624 (100.0%) | $100,833 |
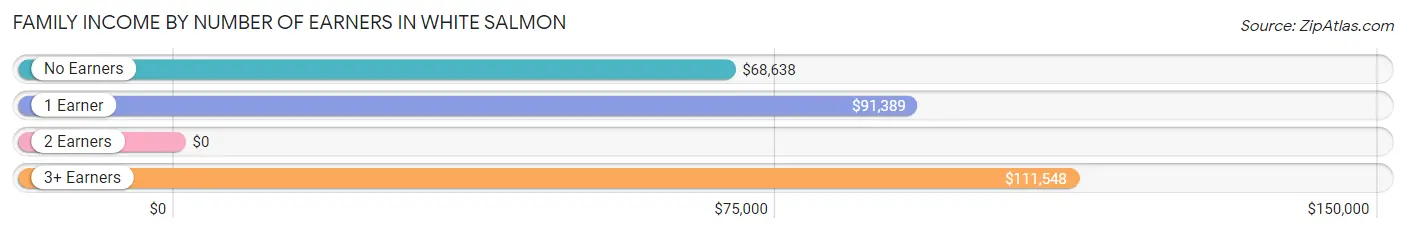
Family Income by Number of Earners in White Salmon
| Number of Earners | # Families | Median Income |
| No Earners | 131 (21.0%) | $68,638 |
| 1 Earner | 202 (32.4%) | $91,389 |
| 2 Earners | 221 (35.4%) | $0 |
| 3+ Earners | 70 (11.2%) | $111,548 |
| Total | 624 (100.0%) | $100,833 |
Household Income in White Salmon
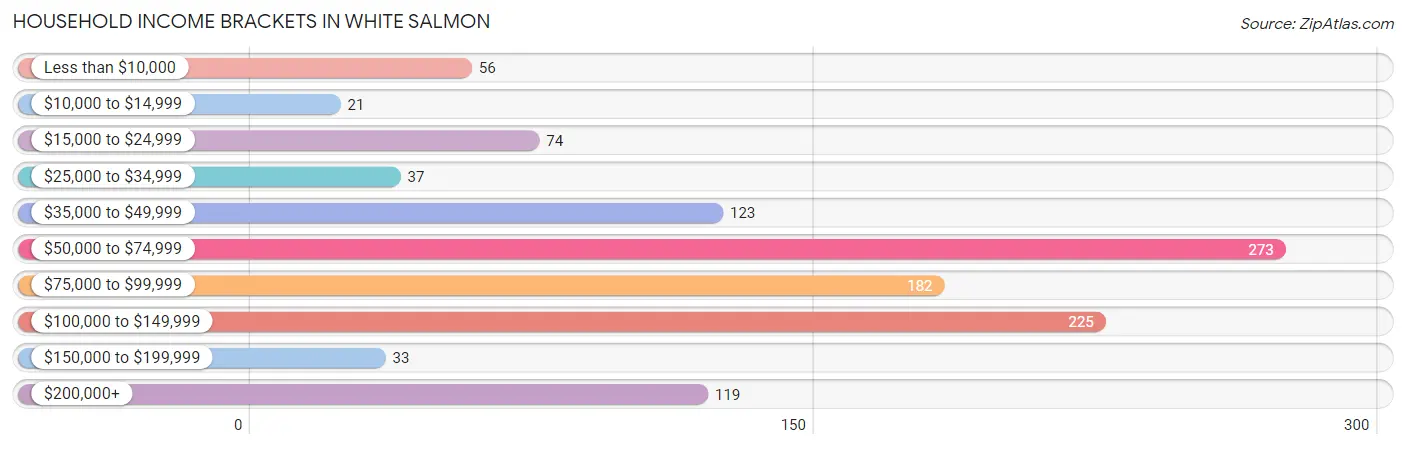
Household Income Brackets in White Salmon
With 273 households falling in the category, the $50,000 to $74,999 income range is the most frequent in White Salmon, accounting for 23.9% of all households. In contrast, only 21 households (1.8%) fall into the $10,000 to $14,999 income bracket, making it the least populous group.
| Income Bracket | # Households | % Households |
| Less than $10,000 | 56 | 4.9% |
| $10,000 to $14,999 | 21 | 1.8% |
| $15,000 to $24,999 | 74 | 6.5% |
| $25,000 to $34,999 | 37 | 3.2% |
| $35,000 to $49,999 | 123 | 10.8% |
| $50,000 to $74,999 | 273 | 23.9% |
| $75,000 to $99,999 | 182 | 15.9% |
| $100,000 to $149,999 | 225 | 19.7% |
| $150,000 to $199,999 | 33 | 2.9% |
| $200,000+ | 119 | 10.4% |
Household Income by Householder Age in White Salmon
The median household income in White Salmon is $72,692, with the highest median household income of $94,318 found in the 45 to 64 years age bracket for the primary householder. A total of 496 households (43.4%) fall into this category. Meanwhile, the 15 to 24 years age bracket for the primary householder has the lowest median household income of $0, with 11 households (1.0%) in this group.
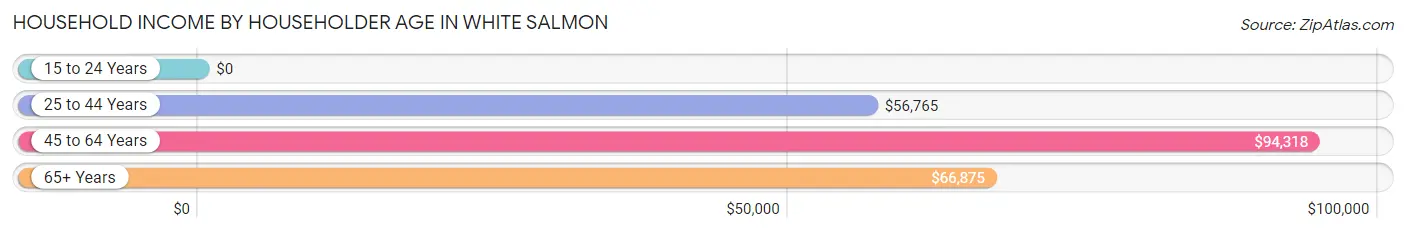
| Income Bracket | # Households | Median Income |
| 15 to 24 Years | 11 (1.0%) | $0 |
| 25 to 44 Years | 144 (12.6%) | $56,765 |
| 45 to 64 Years | 496 (43.4%) | $94,318 |
| 65+ Years | 491 (43.0%) | $66,875 |
| Total | 1,142 (100.0%) | $72,692 |
Poverty in White Salmon
Income Below Poverty by Sex and Age in White Salmon
With 1.3% poverty level for males and 5.8% for females among the residents of White Salmon, 55 to 64 year old males and 75 year old and over females are the most vulnerable to poverty, with 16 males (6.7%) and 24 females (31.6%) in their respective age groups living below the poverty level.
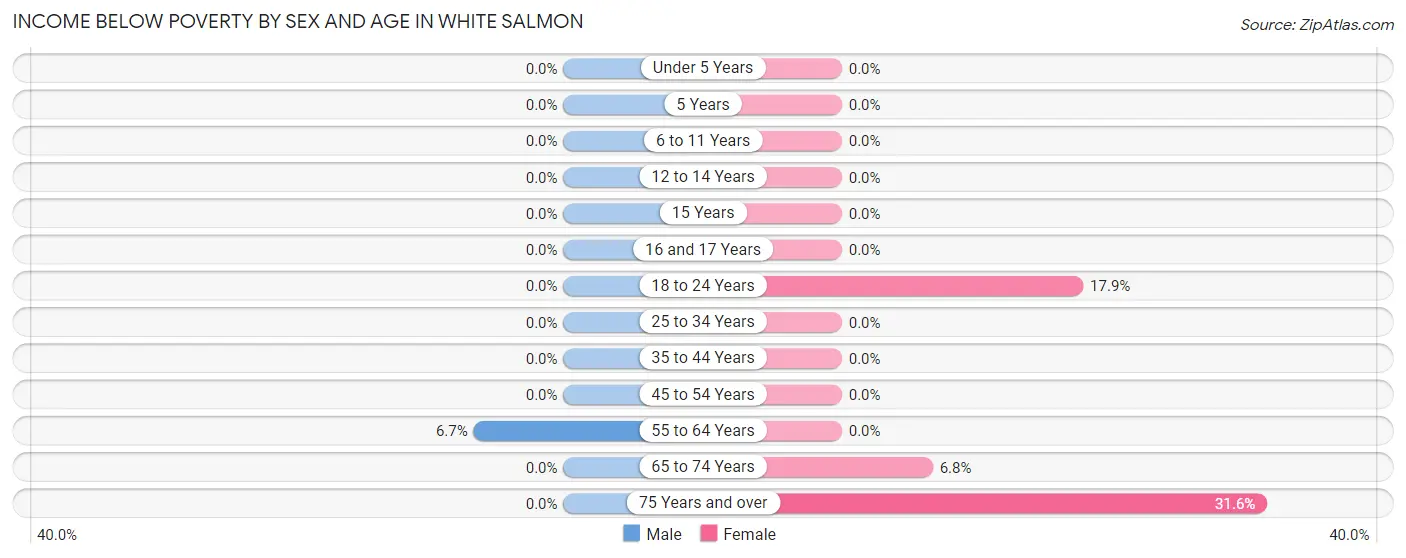
| Age Bracket | Male | Female |
| Under 5 Years | 0 (0.0%) | 0 (0.0%) |
| 5 Years | 0 (0.0%) | 0 (0.0%) |
| 6 to 11 Years | 0 (0.0%) | 0 (0.0%) |
| 12 to 14 Years | 0 (0.0%) | 0 (0.0%) |
| 15 Years | 0 (0.0%) | 0 (0.0%) |
| 16 and 17 Years | 0 (0.0%) | 0 (0.0%) |
| 18 to 24 Years | 0 (0.0%) | 31 (17.9%) |
| 25 to 34 Years | 0 (0.0%) | 0 (0.0%) |
| 35 to 44 Years | 0 (0.0%) | 0 (0.0%) |
| 45 to 54 Years | 0 (0.0%) | 0 (0.0%) |
| 55 to 64 Years | 16 (6.7%) | 0 (0.0%) |
| 65 to 74 Years | 0 (0.0%) | 16 (6.8%) |
| 75 Years and over | 0 (0.0%) | 24 (31.6%) |
| Total | 16 (1.3%) | 71 (5.8%) |
Income Above Poverty by Sex and Age in White Salmon
According to the poverty statistics in White Salmon, males aged under 5 years and females aged under 5 years are the age groups that are most secure financially, with 100.0% of males and 100.0% of females in these age groups living above the poverty line.
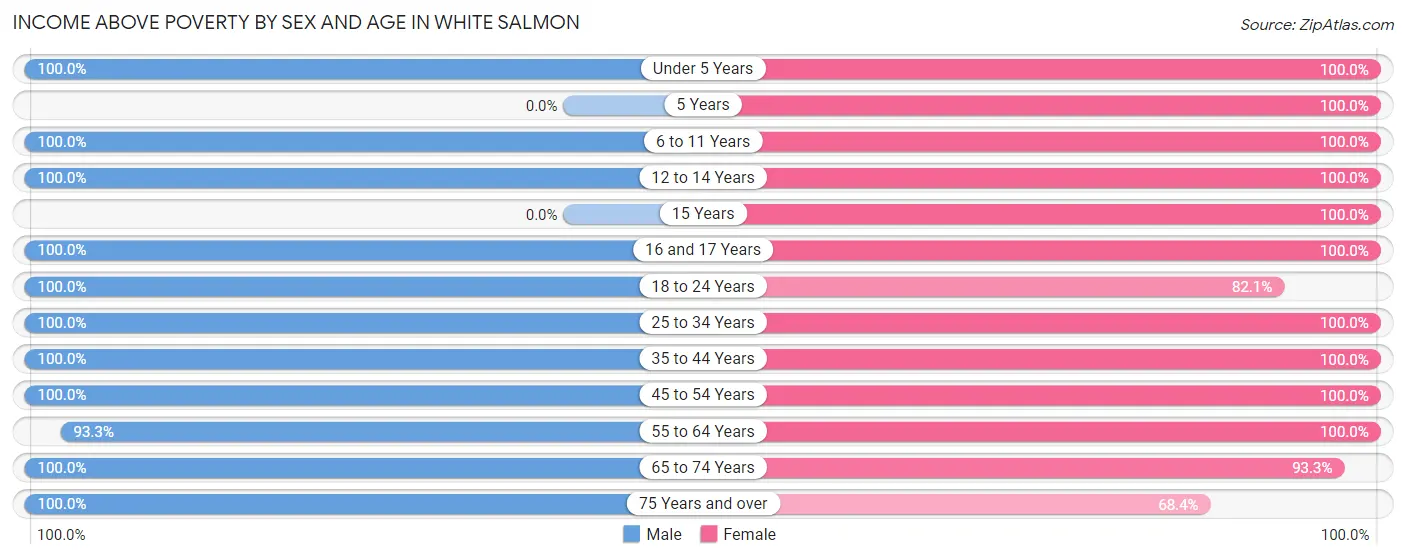
| Age Bracket | Male | Female |
| Under 5 Years | 47 (100.0%) | 44 (100.0%) |
| 5 Years | 0 (0.0%) | 19 (100.0%) |
| 6 to 11 Years | 38 (100.0%) | 55 (100.0%) |
| 12 to 14 Years | 46 (100.0%) | 12 (100.0%) |
| 15 Years | 0 (0.0%) | 32 (100.0%) |
| 16 and 17 Years | 45 (100.0%) | 48 (100.0%) |
| 18 to 24 Years | 73 (100.0%) | 142 (82.1%) |
| 25 to 34 Years | 89 (100.0%) | 94 (100.0%) |
| 35 to 44 Years | 59 (100.0%) | 98 (100.0%) |
| 45 to 54 Years | 274 (100.0%) | 119 (100.0%) |
| 55 to 64 Years | 224 (93.3%) | 228 (100.0%) |
| 65 to 74 Years | 286 (100.0%) | 221 (93.2%) |
| 75 Years and over | 73 (100.0%) | 52 (68.4%) |
| Total | 1,254 (98.7%) | 1,164 (94.3%) |
Income Below Poverty Among Married-Couple Families in White Salmon
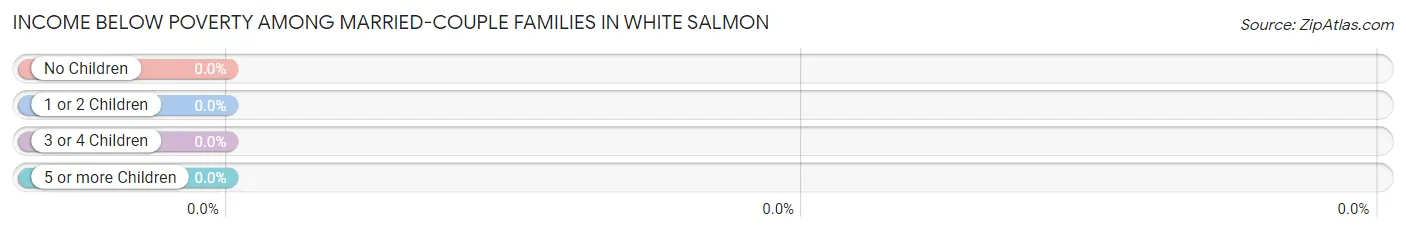
| Children | Above Poverty | Below Poverty |
| No Children | 375 (100.0%) | 0 (0.0%) |
| 1 or 2 Children | 119 (100.0%) | 0 (0.0%) |
| 3 or 4 Children | 48 (100.0%) | 0 (0.0%) |
| 5 or more Children | 0 (0.0%) | 0 (0.0%) |
| Total | 542 (100.0%) | 0 (0.0%) |
Income Below Poverty Among Single-Parent Households in White Salmon
| Children | Single Father | Single Mother |
| No Children | 0 (0.0%) | 0 (0.0%) |
| 1 or 2 Children | 0 (0.0%) | 0 (0.0%) |
| 3 or 4 Children | 0 (0.0%) | 0 (0.0%) |
| 5 or more Children | 0 (0.0%) | 0 (0.0%) |
| Total | 0 (0.0%) | 0 (0.0%) |
Income Below Poverty Among Married-Couple vs Single-Parent Households in White Salmon
| Children | Married-Couple Families | Single-Parent Households |
| No Children | 0 (0.0%) | 0 (0.0%) |
| 1 or 2 Children | 0 (0.0%) | 0 (0.0%) |
| 3 or 4 Children | 0 (0.0%) | 0 (0.0%) |
| 5 or more Children | 0 (0.0%) | 0 (0.0%) |
| Total | 0 (0.0%) | 0 (0.0%) |
Race in White Salmon
The most populous races in White Salmon are White / Caucasian (2,116 | 84.5%), Hispanic or Latino (532 | 21.2%), and Two or more Races (240 | 9.6%).
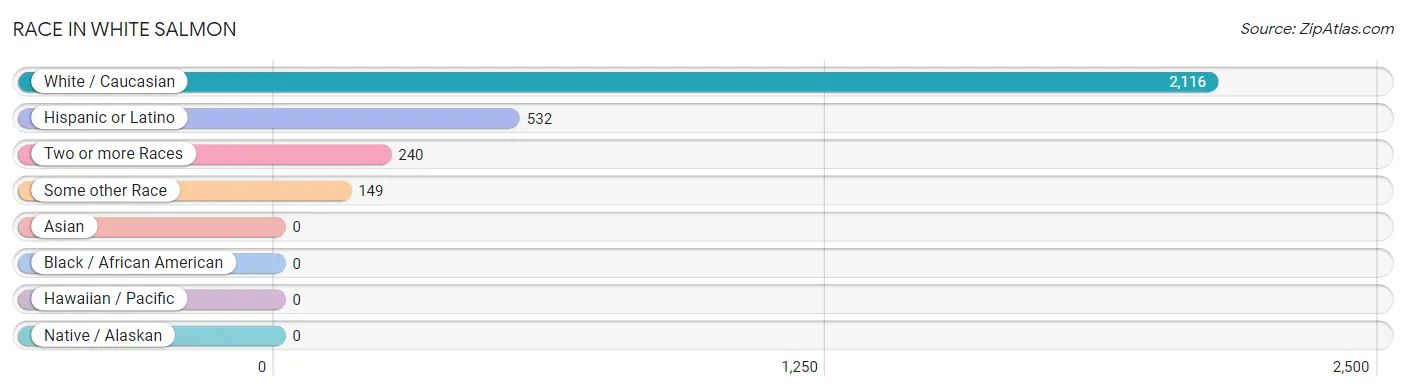
| Race | # Population | % Population |
| Asian | 0 | 0.0% |
| Black / African American | 0 | 0.0% |
| Hawaiian / Pacific | 0 | 0.0% |
| Hispanic or Latino | 532 | 21.2% |
| Native / Alaskan | 0 | 0.0% |
| White / Caucasian | 2,116 | 84.5% |
| Two or more Races | 240 | 9.6% |
| Some other Race | 149 | 5.9% |
| Total | 2,505 | 100.0% |
Ancestry in White Salmon
The most populous ancestries reported in White Salmon are German (590 | 23.5%), English (546 | 21.8%), Mexican (489 | 19.5%), Irish (472 | 18.8%), and Welsh (161 | 6.4%), together accounting for 90.1% of all White Salmon residents.
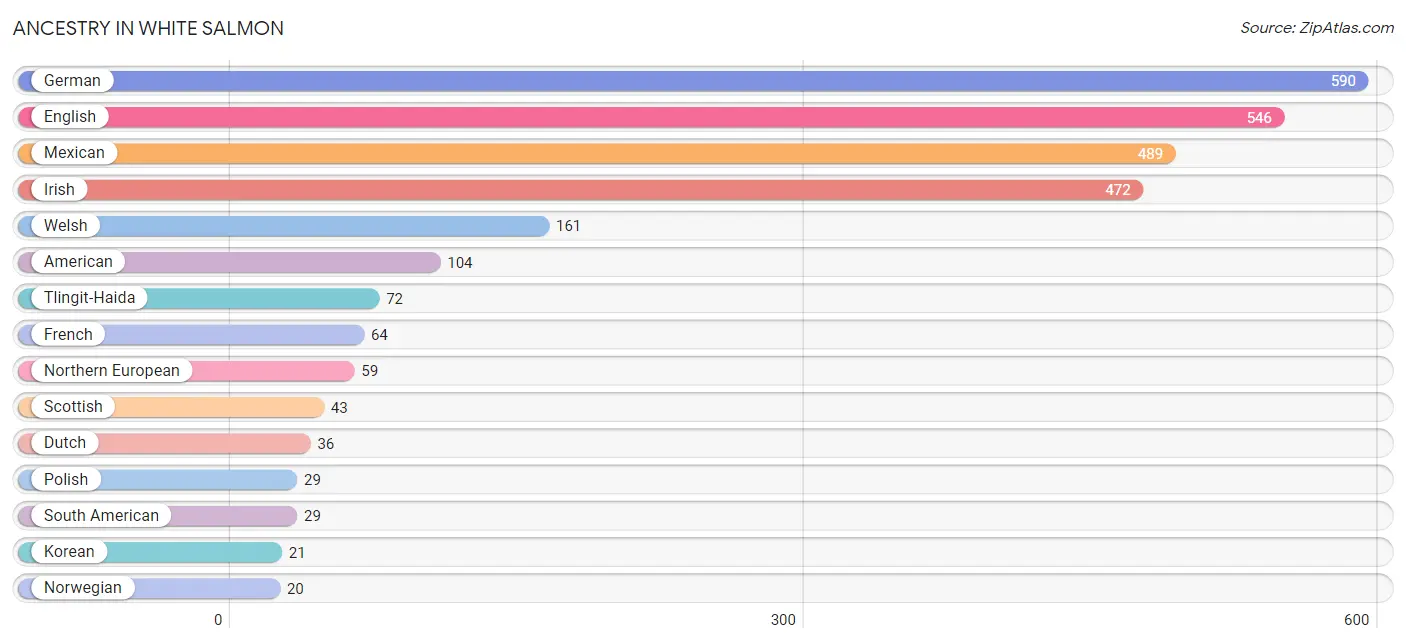
| Ancestry | # Population | % Population |
| American | 104 | 4.2% |
| Argentinean | 19 | 0.8% |
| Canadian | 12 | 0.5% |
| Chilean | 5 | 0.2% |
| Colombian | 5 | 0.2% |
| Danish | 8 | 0.3% |
| Dutch | 36 | 1.4% |
| Eastern European | 17 | 0.7% |
| English | 546 | 21.8% |
| European | 18 | 0.7% |
| French | 64 | 2.5% |
| German | 590 | 23.5% |
| Irish | 472 | 18.8% |
| Italian | 12 | 0.5% |
| Korean | 21 | 0.8% |
| Mexican | 489 | 19.5% |
| Northern European | 59 | 2.4% |
| Norwegian | 20 | 0.8% |
| Pakistani | 17 | 0.7% |
| Polish | 29 | 1.2% |
| Scandinavian | 9 | 0.4% |
| Scottish | 43 | 1.7% |
| South American | 29 | 1.2% |
| Spanish | 14 | 0.6% |
| Swedish | 5 | 0.2% |
| Swiss | 14 | 0.6% |
| Tlingit-Haida | 72 | 2.9% |
| Welsh | 161 | 6.4% | View All 28 Rows |
Immigrants in White Salmon
The most numerous immigrant groups reported in White Salmon came from Latin America (332 | 13.3%), Central America (308 | 12.3%), Mexico (308 | 12.3%), Europe (35 | 1.4%), and Germany (24 | 1.0%), together accounting for 40.2% of all White Salmon residents.
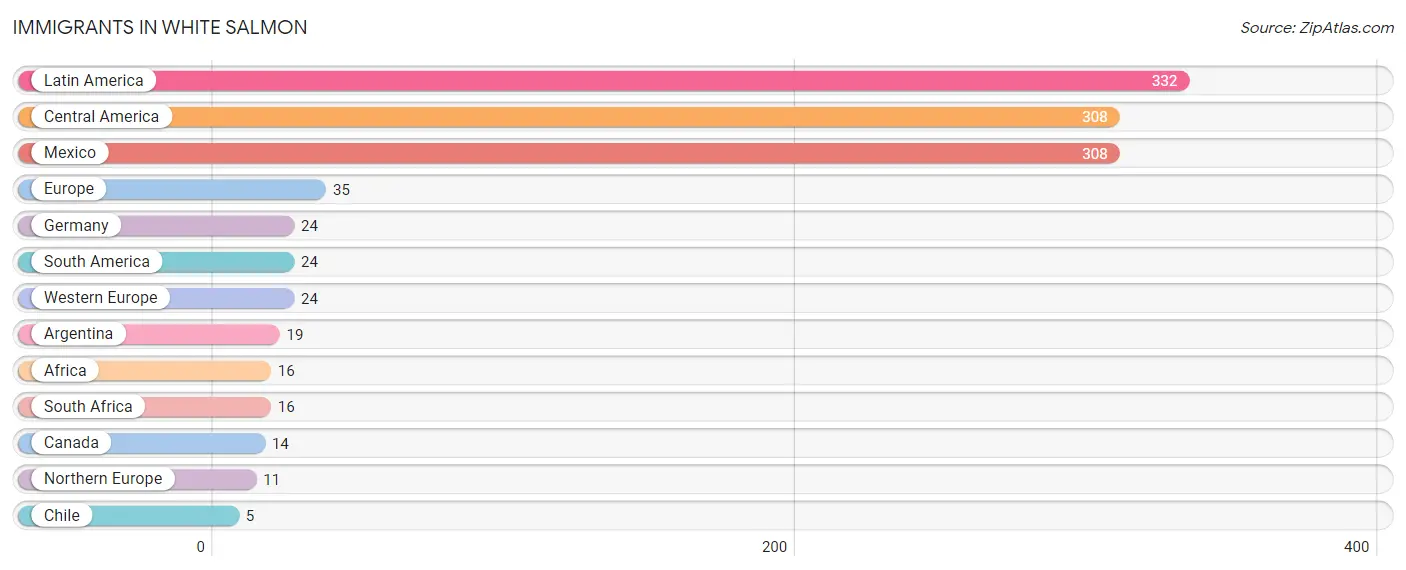
| Immigration Origin | # Population | % Population |
| Africa | 16 | 0.6% |
| Argentina | 19 | 0.8% |
| Canada | 14 | 0.6% |
| Central America | 308 | 12.3% |
| Chile | 5 | 0.2% |
| Europe | 35 | 1.4% |
| Germany | 24 | 1.0% |
| Latin America | 332 | 13.3% |
| Mexico | 308 | 12.3% |
| Northern Europe | 11 | 0.4% |
| South Africa | 16 | 0.6% |
| South America | 24 | 1.0% |
| Western Europe | 24 | 1.0% | View All 13 Rows |
Sex and Age in White Salmon
Sex and Age in White Salmon
The most populous age groups in White Salmon are 65 to 69 Years (150 | 11.8%) for men and 20 to 24 Years (173 | 14.0%) for women.
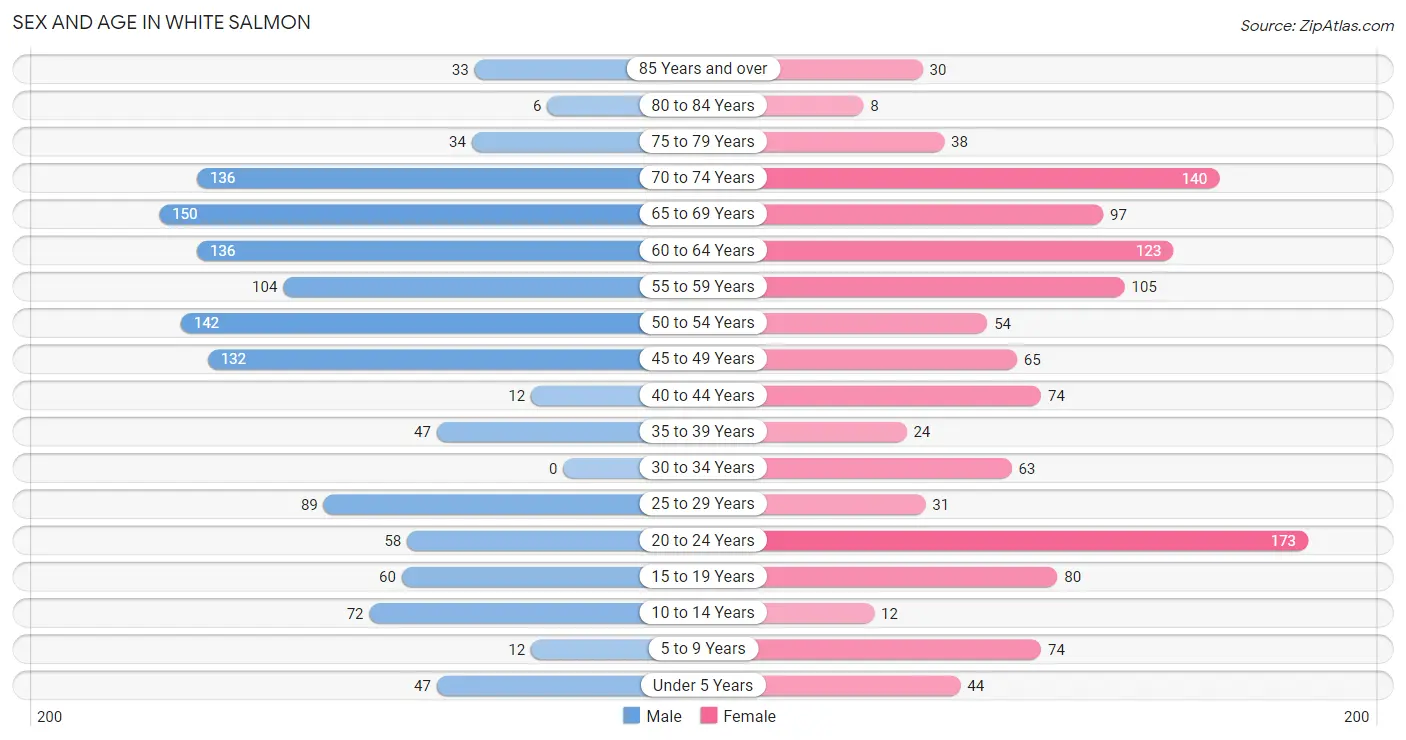
| Age Bracket | Male | Female |
| Under 5 Years | 47 (3.7%) | 44 (3.6%) |
| 5 to 9 Years | 12 (0.9%) | 74 (6.0%) |
| 10 to 14 Years | 72 (5.7%) | 12 (1.0%) |
| 15 to 19 Years | 60 (4.7%) | 80 (6.5%) |
| 20 to 24 Years | 58 (4.6%) | 173 (14.0%) |
| 25 to 29 Years | 89 (7.0%) | 31 (2.5%) |
| 30 to 34 Years | 0 (0.0%) | 63 (5.1%) |
| 35 to 39 Years | 47 (3.7%) | 24 (1.9%) |
| 40 to 44 Years | 12 (0.9%) | 74 (6.0%) |
| 45 to 49 Years | 132 (10.4%) | 65 (5.3%) |
| 50 to 54 Years | 142 (11.2%) | 54 (4.4%) |
| 55 to 59 Years | 104 (8.2%) | 105 (8.5%) |
| 60 to 64 Years | 136 (10.7%) | 123 (10.0%) |
| 65 to 69 Years | 150 (11.8%) | 97 (7.9%) |
| 70 to 74 Years | 136 (10.7%) | 140 (11.3%) |
| 75 to 79 Years | 34 (2.7%) | 38 (3.1%) |
| 80 to 84 Years | 6 (0.5%) | 8 (0.6%) |
| 85 Years and over | 33 (2.6%) | 30 (2.4%) |
| Total | 1,270 (100.0%) | 1,235 (100.0%) |
Families and Households in White Salmon
Median Family Size in White Salmon
The median family size in White Salmon is 2.89 persons per family, with single male/father families (25 | 4.0%) accounting for the largest median family size of 4.92 persons per family. On the other hand, married-couple families (542 | 86.9%) represent the smallest median family size with 2.74 persons per family.
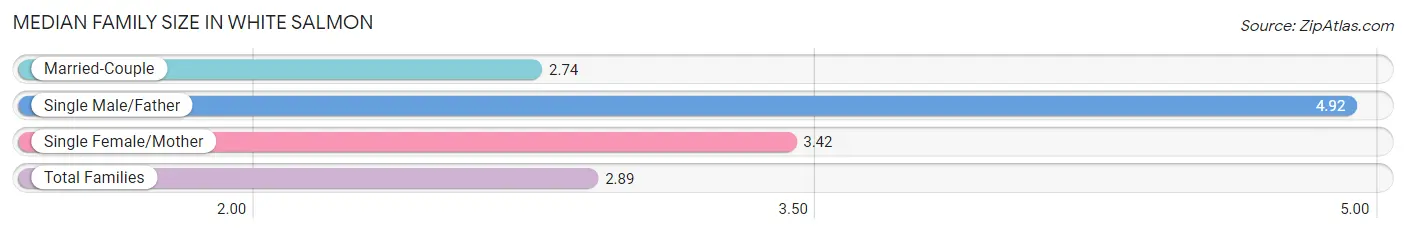
| Family Type | # Families | Family Size |
| Married-Couple | 542 (86.9%) | 2.74 |
| Single Male/Father | 25 (4.0%) | 4.92 |
| Single Female/Mother | 57 (9.1%) | 3.42 |
| Total Families | 624 (100.0%) | 2.89 |
Median Household Size in White Salmon
The median household size in White Salmon is 2.19 persons per household, with single female/mother households (57 | 5.0%) accounting for the largest median household size of 5.58 persons per household. non-family households (518 | 45.4%) represent the smallest median household size with 1.09 persons per household.
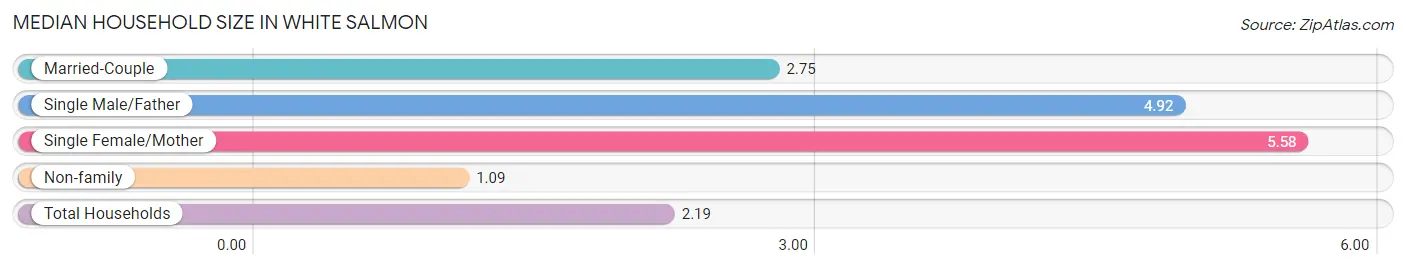
| Household Type | # Households | Household Size |
| Married-Couple | 542 (47.5%) | 2.75 |
| Single Male/Father | 25 (2.2%) | 4.92 |
| Single Female/Mother | 57 (5.0%) | 5.58 |
| Non-family | 518 (45.4%) | 1.09 |
| Total Households | 1,142 (100.0%) | 2.19 |
Household Size by Marriage Status in White Salmon
Out of a total of 1,142 households in White Salmon, 624 (54.6%) are family households, while 518 (45.4%) are nonfamily households. The most numerous type of family households are 2-person households, comprising 328, and the most common type of nonfamily households are 1-person households, comprising 458.
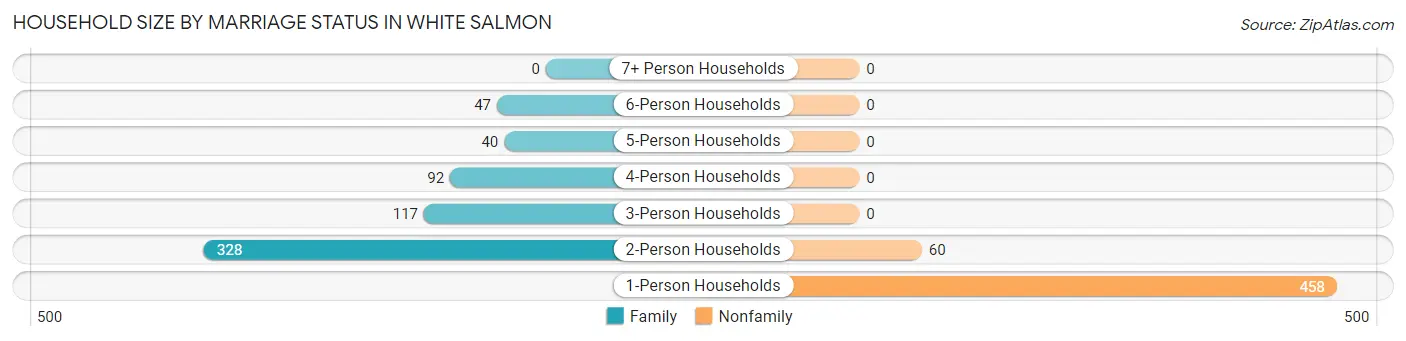
| Household Size | Family Households | Nonfamily Households |
| 1-Person Households | - | 458 (40.1%) |
| 2-Person Households | 328 (28.7%) | 60 (5.2%) |
| 3-Person Households | 117 (10.2%) | 0 (0.0%) |
| 4-Person Households | 92 (8.1%) | 0 (0.0%) |
| 5-Person Households | 40 (3.5%) | 0 (0.0%) |
| 6-Person Households | 47 (4.1%) | 0 (0.0%) |
| 7+ Person Households | 0 (0.0%) | 0 (0.0%) |
| Total | 624 (54.6%) | 518 (45.4%) |
Female Fertility in White Salmon
Fertility by Age in White Salmon
| Age Bracket | Women with Births | Births / 1,000 Women |
| 15 to 19 years | 0 (0.0%) | 0.0 |
| 20 to 34 years | 0 (0.0%) | 0.0 |
| 35 to 50 years | 0 (0.0%) | 0.0 |
| Total | 0 (0.0%) | 0.0 |
Fertility by Age by Marriage Status in White Salmon
| Age Bracket | Married | Unmarried |
| 15 to 19 years | 0 (0.0%) | 0 (0.0%) |
| 20 to 34 years | 0 (0.0%) | 0 (0.0%) |
| 35 to 50 years | 0 (0.0%) | 0 (0.0%) |
| Total | 0 (0.0%) | 0 (0.0%) |
Fertility by Education in White Salmon
| Educational Attainment | Women with Births | Births / 1,000 Women |
| Less than High School | 0 (0.0%) | 0.0 |
| High School Diploma | 0 (0.0%) | 0.0 |
| College or Associate's Degree | 0 (0.0%) | 0.0 |
| Bachelor's Degree | 0 (0.0%) | 0.0 |
| Graduate Degree | 0 (0.0%) | 0.0 |
| Total | 0 (0.0%) | 0.0 |
Fertility by Education by Marriage Status in White Salmon
| Educational Attainment | Married | Unmarried |
| Less than High School | 0 (0.0%) | 0 (0.0%) |
| High School Diploma | 0 (0.0%) | 0 (0.0%) |
| College or Associate's Degree | 0 (0.0%) | 0 (0.0%) |
| Bachelor's Degree | 0 (0.0%) | 0 (0.0%) |
| Graduate Degree | 0 (0.0%) | 0 (0.0%) |
| Total | 0 (0.0%) | 0 (0.0%) |
Employment Characteristics in White Salmon
Employment by Class of Employer in White Salmon
Among the 1,220 employed individuals in White Salmon, private company employees (671 | 55.0%), self-employed (incorporated) (147 | 12.0%), and self-employed (not incorporated) (136 | 11.2%) make up the most common classes of employment.
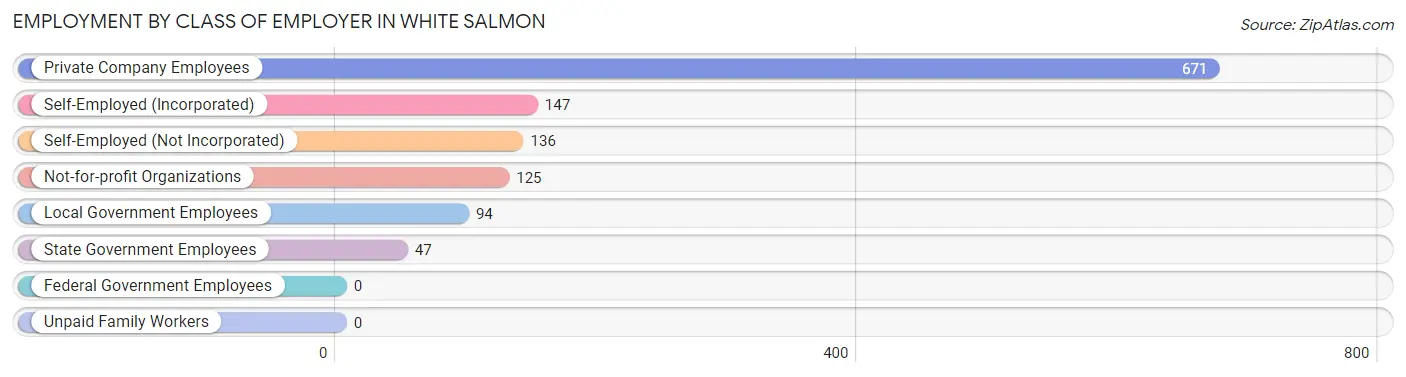
| Employer Class | # Employees | % Employees |
| Private Company Employees | 671 | 55.0% |
| Self-Employed (Incorporated) | 147 | 12.0% |
| Self-Employed (Not Incorporated) | 136 | 11.2% |
| Not-for-profit Organizations | 125 | 10.2% |
| Local Government Employees | 94 | 7.7% |
| State Government Employees | 47 | 3.8% |
| Federal Government Employees | 0 | 0.0% |
| Unpaid Family Workers | 0 | 0.0% |
| Total | 1,220 | 100.0% |
Employment Status by Age in White Salmon
According to the labor force statistics for White Salmon, out of the total population over 16 years of age (2,212), 58.9% or 1,303 individuals are in the labor force, with 1.1% or 14 of them unemployed. The age group with the highest labor force participation rate is 25 to 29 years, with 85.8% or 103 individuals in the labor force. Within the labor force, the 35 to 44 years age range has the highest percentage of unemployed individuals, with 10.5% or 14 of them being unemployed.
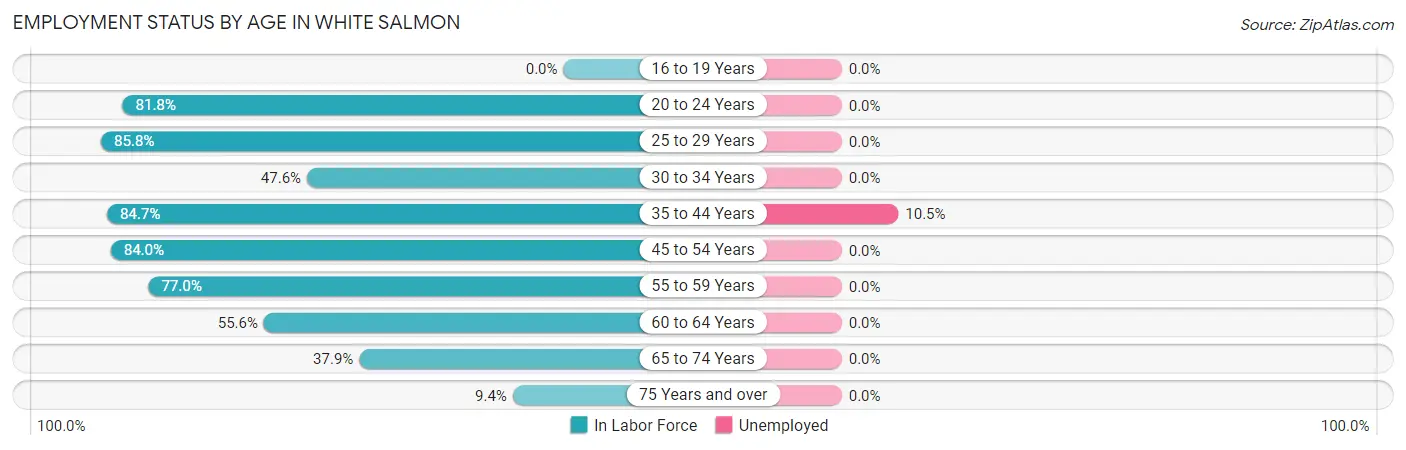
| Age Bracket | In Labor Force | Unemployed |
| 16 to 19 Years | 0 (0.0%) | 0 (0.0%) |
| 20 to 24 Years | 189 (81.8%) | 0 (0.0%) |
| 25 to 29 Years | 103 (85.8%) | 0 (0.0%) |
| 30 to 34 Years | 30 (47.6%) | 0 (0.0%) |
| 35 to 44 Years | 133 (84.7%) | 14 (10.5%) |
| 45 to 54 Years | 330 (84.0%) | 0 (0.0%) |
| 55 to 59 Years | 161 (77.0%) | 0 (0.0%) |
| 60 to 64 Years | 144 (55.6%) | 0 (0.0%) |
| 65 to 74 Years | 198 (37.9%) | 0 (0.0%) |
| 75 Years and over | 14 (9.4%) | 0 (0.0%) |
| Total | 1,303 (58.9%) | 14 (1.1%) |
Employment Status by Educational Attainment in White Salmon
According to labor force statistics for White Salmon, 75.0% of individuals (901) out of the total population between 25 and 64 years of age (1,201) are in the labor force, with 1.6% or 14 of them being unemployed. The group with the highest labor force participation rate are those with the educational attainment of bachelor's degree or higher, with 78.9% or 464 individuals in the labor force. Within the labor force, individuals with high school diploma education have the highest percentage of unemployment, with 9.4% or 14 of them being unemployed.
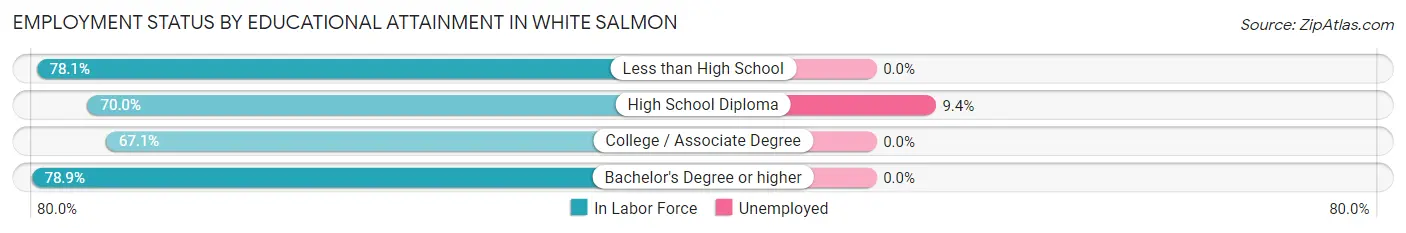
| Educational Attainment | In Labor Force | Unemployed |
| Less than High School | 139 (78.1%) | 0 (0.0%) |
| High School Diploma | 149 (70.0%) | 20 (9.4%) |
| College / Associate Degree | 149 (67.1%) | 0 (0.0%) |
| Bachelor's Degree or higher | 464 (78.9%) | 0 (0.0%) |
| Total | 901 (75.0%) | 19 (1.6%) |
Employment Occupations by Sex in White Salmon
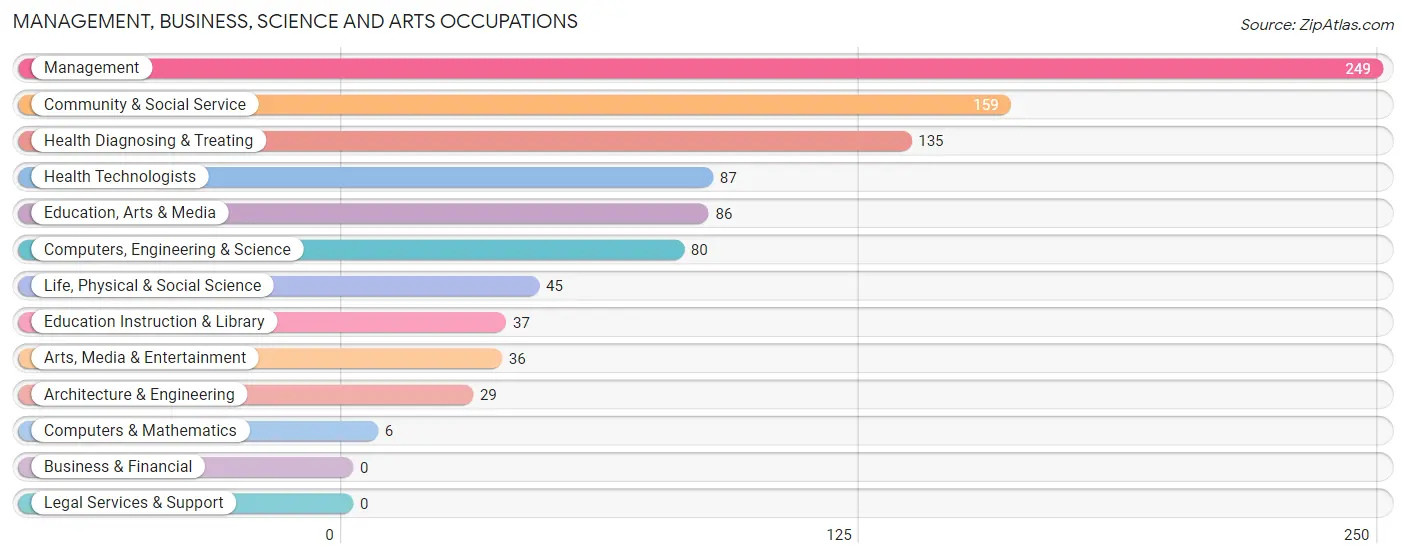
Management, Business, Science and Arts Occupations
The most common Management, Business, Science and Arts occupations in White Salmon are Management (249 | 19.3%), Community & Social Service (159 | 12.3%), Health Diagnosing & Treating (135 | 10.5%), Health Technologists (87 | 6.8%), and Education, Arts & Media (86 | 6.7%).
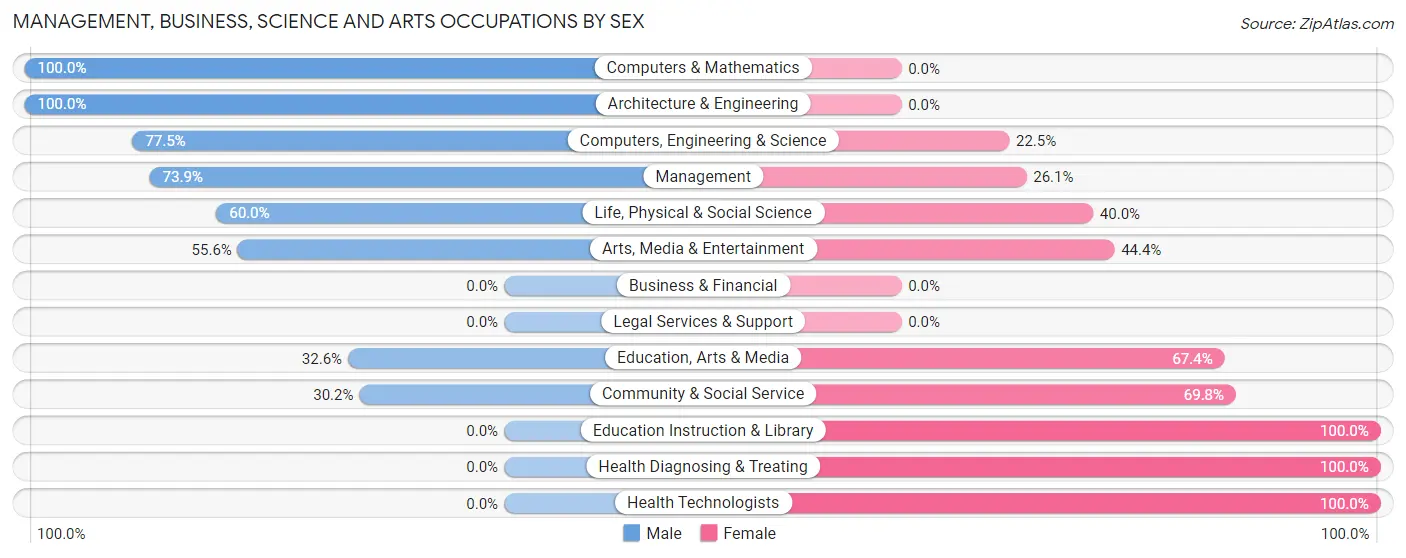
Management, Business, Science and Arts Occupations by Sex
Within the Management, Business, Science and Arts occupations in White Salmon, the most male-oriented occupations are Computers & Mathematics (100.0%), Architecture & Engineering (100.0%), and Computers, Engineering & Science (77.5%), while the most female-oriented occupations are Education Instruction & Library (100.0%), Health Diagnosing & Treating (100.0%), and Health Technologists (100.0%).
| Occupation | Male | Female |
| Management | 184 (73.9%) | 65 (26.1%) |
| Business & Financial | 0 (0.0%) | 0 (0.0%) |
| Computers, Engineering & Science | 62 (77.5%) | 18 (22.5%) |
| Computers & Mathematics | 6 (100.0%) | 0 (0.0%) |
| Architecture & Engineering | 29 (100.0%) | 0 (0.0%) |
| Life, Physical & Social Science | 27 (60.0%) | 18 (40.0%) |
| Community & Social Service | 48 (30.2%) | 111 (69.8%) |
| Education, Arts & Media | 28 (32.6%) | 58 (67.4%) |
| Legal Services & Support | 0 (0.0%) | 0 (0.0%) |
| Education Instruction & Library | 0 (0.0%) | 37 (100.0%) |
| Arts, Media & Entertainment | 20 (55.6%) | 16 (44.4%) |
| Health Diagnosing & Treating | 0 (0.0%) | 135 (100.0%) |
| Health Technologists | 0 (0.0%) | 87 (100.0%) |
| Total (Category) | 294 (47.2%) | 329 (52.8%) |
| Total (Overall) | 650 (50.5%) | 638 (49.5%) |
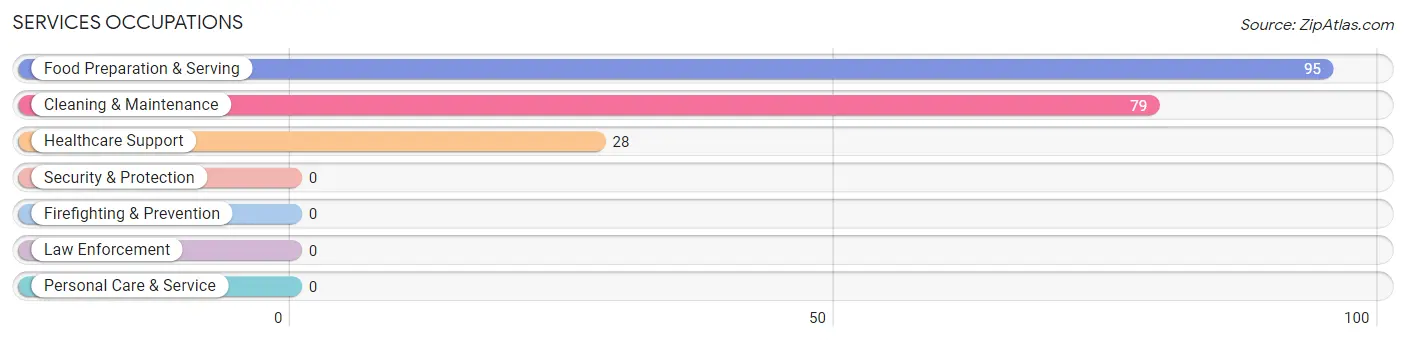
Services Occupations
The most common Services occupations in White Salmon are Food Preparation & Serving (95 | 7.4%), Cleaning & Maintenance (79 | 6.1%), and Healthcare Support (28 | 2.2%).
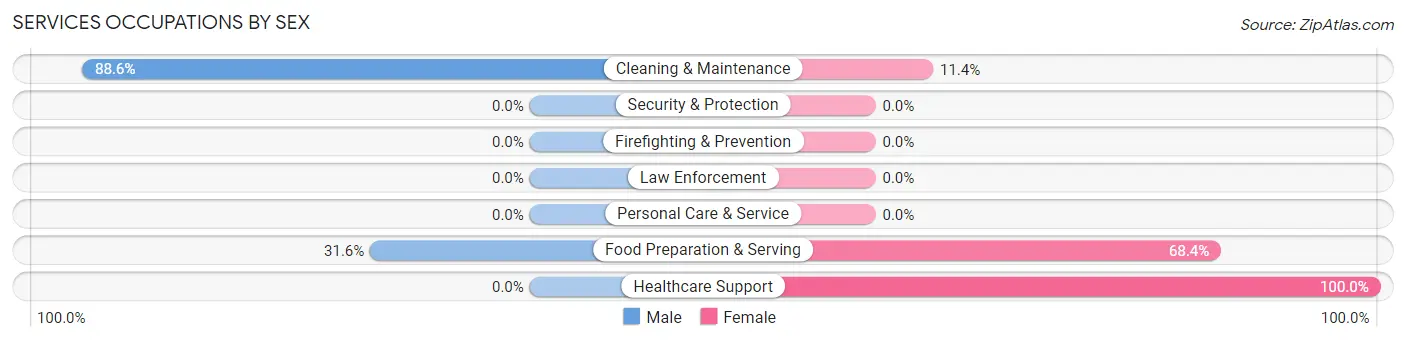
Services Occupations by Sex
Within the Services occupations in White Salmon, the most male-oriented occupations are Cleaning & Maintenance (88.6%), and Food Preparation & Serving (31.6%), while the most female-oriented occupations are Healthcare Support (100.0%), Food Preparation & Serving (68.4%), and Cleaning & Maintenance (11.4%).
| Occupation | Male | Female |
| Healthcare Support | 0 (0.0%) | 28 (100.0%) |
| Security & Protection | 0 (0.0%) | 0 (0.0%) |
| Firefighting & Prevention | 0 (0.0%) | 0 (0.0%) |
| Law Enforcement | 0 (0.0%) | 0 (0.0%) |
| Food Preparation & Serving | 30 (31.6%) | 65 (68.4%) |
| Cleaning & Maintenance | 70 (88.6%) | 9 (11.4%) |
| Personal Care & Service | 0 (0.0%) | 0 (0.0%) |
| Total (Category) | 100 (49.5%) | 102 (50.5%) |
| Total (Overall) | 650 (50.5%) | 638 (49.5%) |
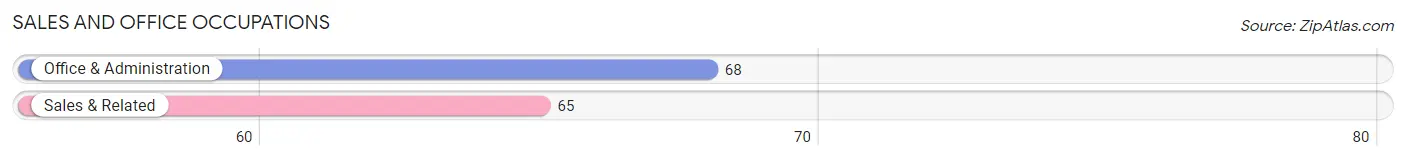
Sales and Office Occupations
The most common Sales and Office occupations in White Salmon are Office & Administration (68 | 5.3%), and Sales & Related (65 | 5.1%).
Sales and Office Occupations by Sex
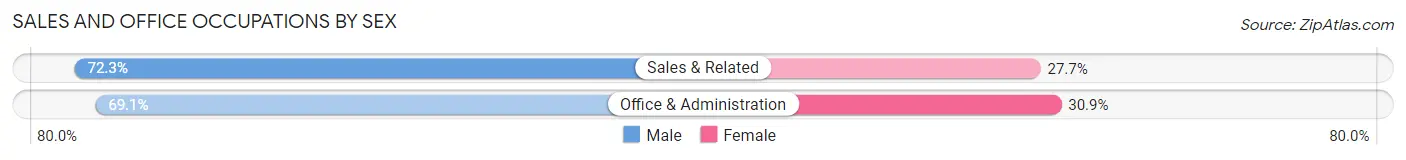
| Occupation | Male | Female |
| Sales & Related | 47 (72.3%) | 18 (27.7%) |
| Office & Administration | 47 (69.1%) | 21 (30.9%) |
| Total (Category) | 94 (70.7%) | 39 (29.3%) |
| Total (Overall) | 650 (50.5%) | 638 (49.5%) |
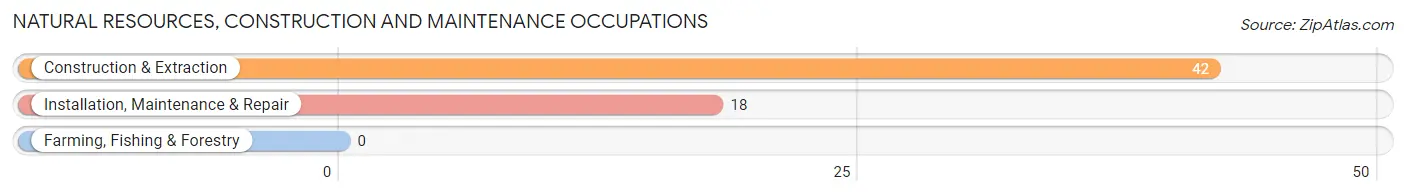
Natural Resources, Construction and Maintenance Occupations
The most common Natural Resources, Construction and Maintenance occupations in White Salmon are Construction & Extraction (42 | 3.3%), and Installation, Maintenance & Repair (18 | 1.4%).
Natural Resources, Construction and Maintenance Occupations by Sex
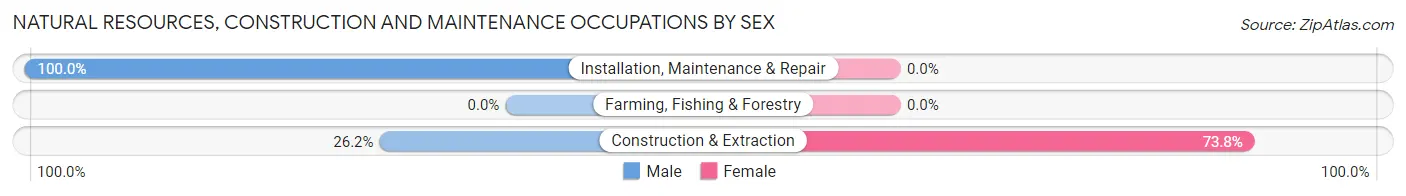
| Occupation | Male | Female |
| Farming, Fishing & Forestry | 0 (0.0%) | 0 (0.0%) |
| Construction & Extraction | 11 (26.2%) | 31 (73.8%) |
| Installation, Maintenance & Repair | 18 (100.0%) | 0 (0.0%) |
| Total (Category) | 29 (48.3%) | 31 (51.7%) |
| Total (Overall) | 650 (50.5%) | 638 (49.5%) |
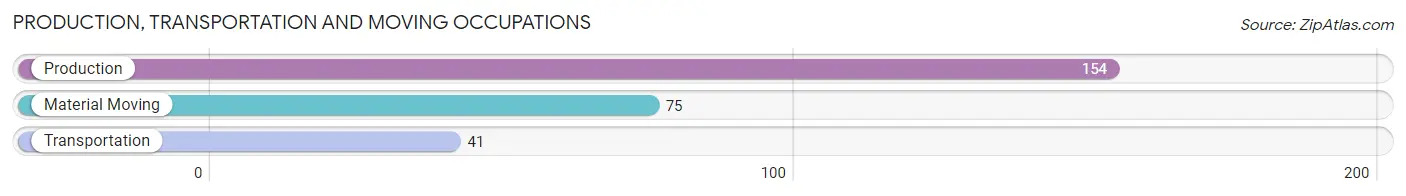
Production, Transportation and Moving Occupations
The most common Production, Transportation and Moving occupations in White Salmon are Production (154 | 12.0%), Material Moving (75 | 5.8%), and Transportation (41 | 3.2%).
Production, Transportation and Moving Occupations by Sex
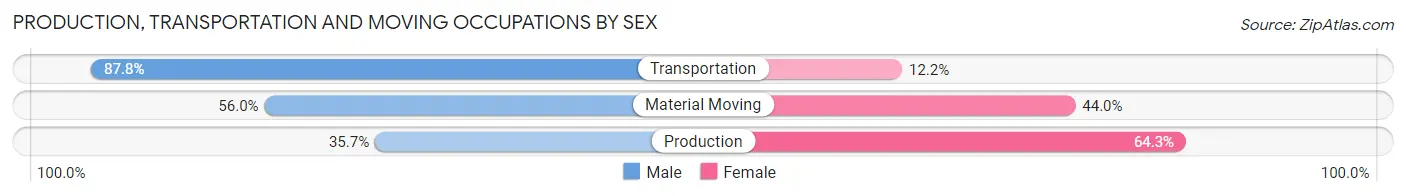
| Occupation | Male | Female |
| Production | 55 (35.7%) | 99 (64.3%) |
| Transportation | 36 (87.8%) | 5 (12.2%) |
| Material Moving | 42 (56.0%) | 33 (44.0%) |
| Total (Category) | 133 (49.3%) | 137 (50.7%) |
| Total (Overall) | 650 (50.5%) | 638 (49.5%) |
Employment Industries by Sex in White Salmon
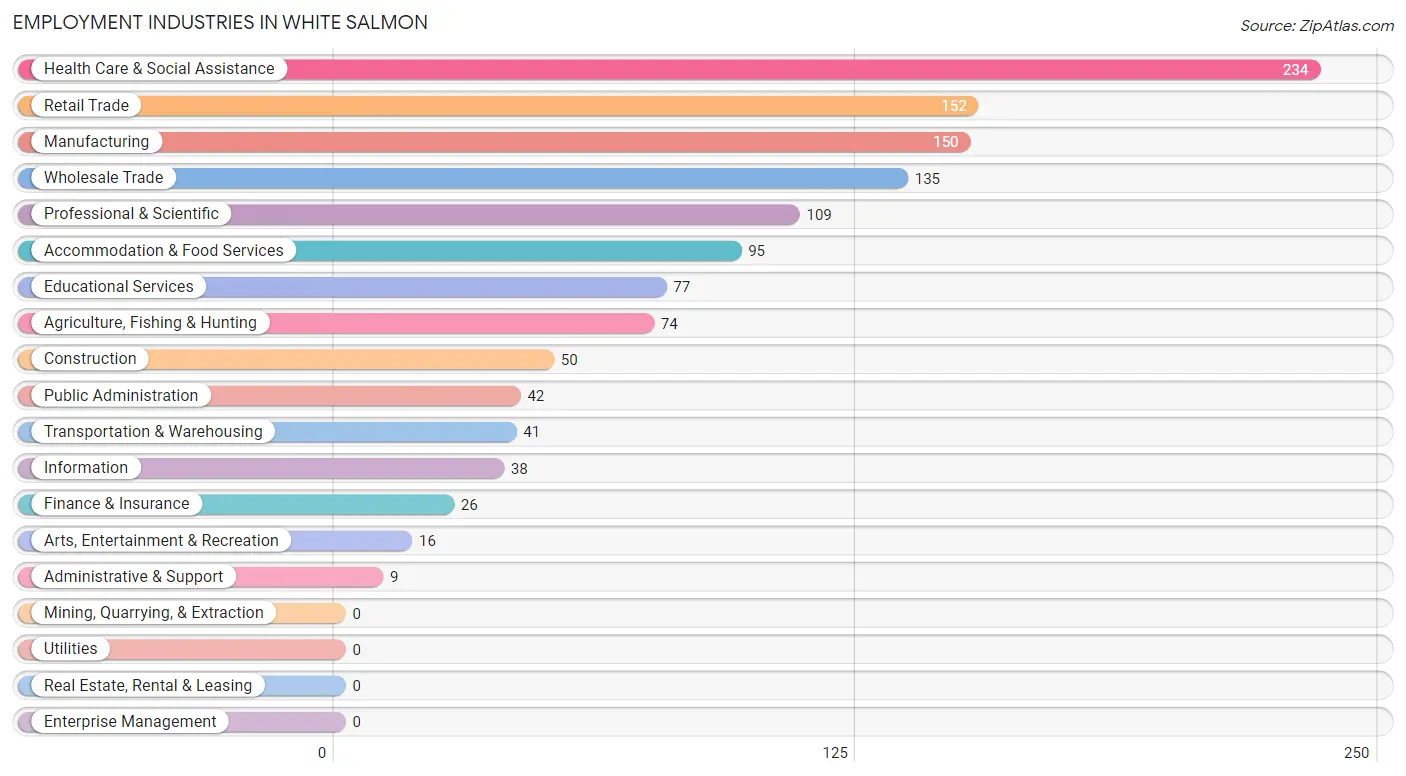
Employment Industries in White Salmon
The major employment industries in White Salmon include Health Care & Social Assistance (234 | 18.2%), Retail Trade (152 | 11.8%), Manufacturing (150 | 11.7%), Wholesale Trade (135 | 10.5%), and Professional & Scientific (109 | 8.5%).
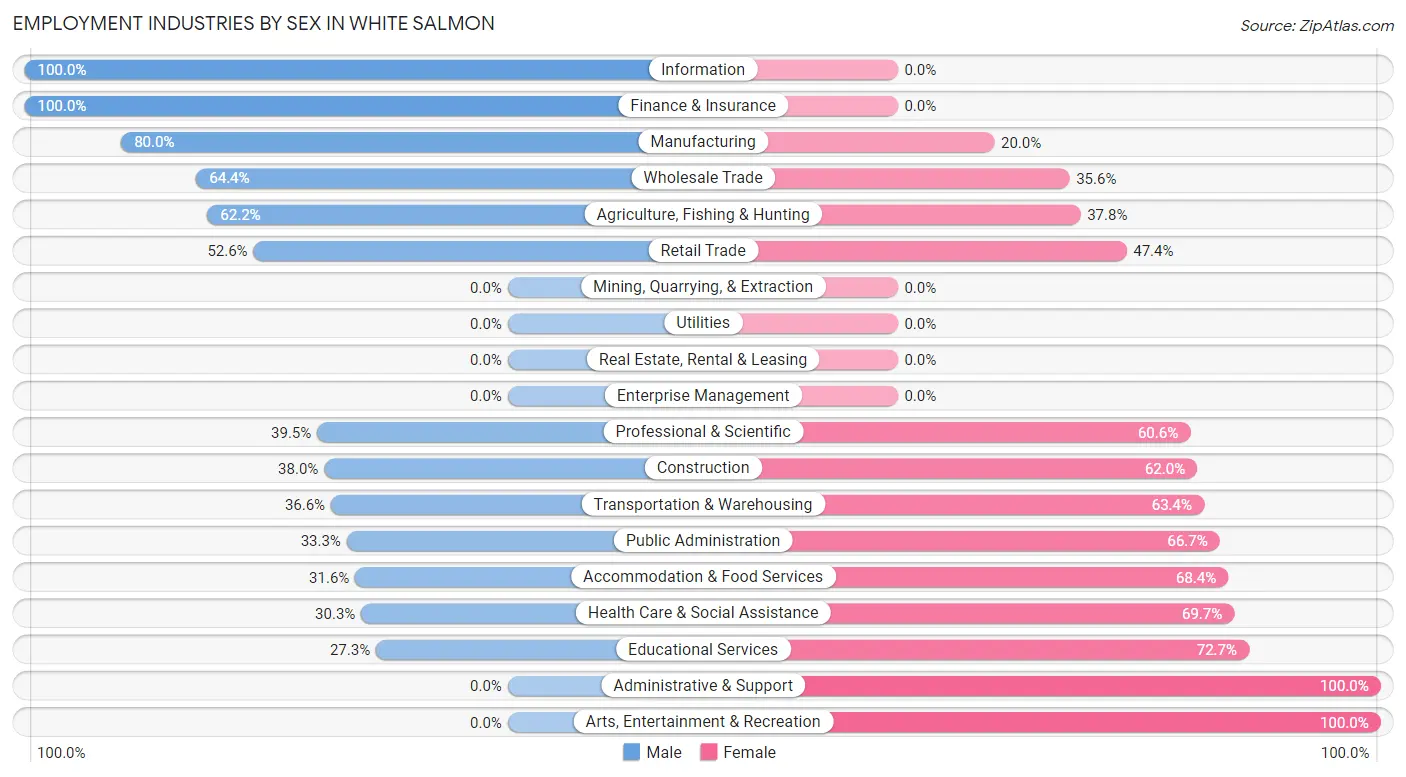
Employment Industries by Sex in White Salmon
The White Salmon industries that see more men than women are Information (100.0%), Finance & Insurance (100.0%), and Manufacturing (80.0%), whereas the industries that tend to have a higher number of women are Administrative & Support (100.0%), Arts, Entertainment & Recreation (100.0%), and Educational Services (72.7%).
| Industry | Male | Female |
| Agriculture, Fishing & Hunting | 46 (62.2%) | 28 (37.8%) |
| Mining, Quarrying, & Extraction | 0 (0.0%) | 0 (0.0%) |
| Construction | 19 (38.0%) | 31 (62.0%) |
| Manufacturing | 120 (80.0%) | 30 (20.0%) |
| Wholesale Trade | 87 (64.4%) | 48 (35.6%) |
| Retail Trade | 80 (52.6%) | 72 (47.4%) |
| Transportation & Warehousing | 15 (36.6%) | 26 (63.4%) |
| Utilities | 0 (0.0%) | 0 (0.0%) |
| Information | 38 (100.0%) | 0 (0.0%) |
| Finance & Insurance | 26 (100.0%) | 0 (0.0%) |
| Real Estate, Rental & Leasing | 0 (0.0%) | 0 (0.0%) |
| Professional & Scientific | 43 (39.5%) | 66 (60.6%) |
| Enterprise Management | 0 (0.0%) | 0 (0.0%) |
| Administrative & Support | 0 (0.0%) | 9 (100.0%) |
| Educational Services | 21 (27.3%) | 56 (72.7%) |
| Health Care & Social Assistance | 71 (30.3%) | 163 (69.7%) |
| Arts, Entertainment & Recreation | 0 (0.0%) | 16 (100.0%) |
| Accommodation & Food Services | 30 (31.6%) | 65 (68.4%) |
| Public Administration | 14 (33.3%) | 28 (66.7%) |
| Total | 650 (50.5%) | 638 (49.5%) |
Education in White Salmon
School Enrollment in White Salmon
The most common levels of schooling among the 334 students in White Salmon are high school (136 | 40.7%), middle school (73 | 21.9%), and elementary school (48 | 14.4%).
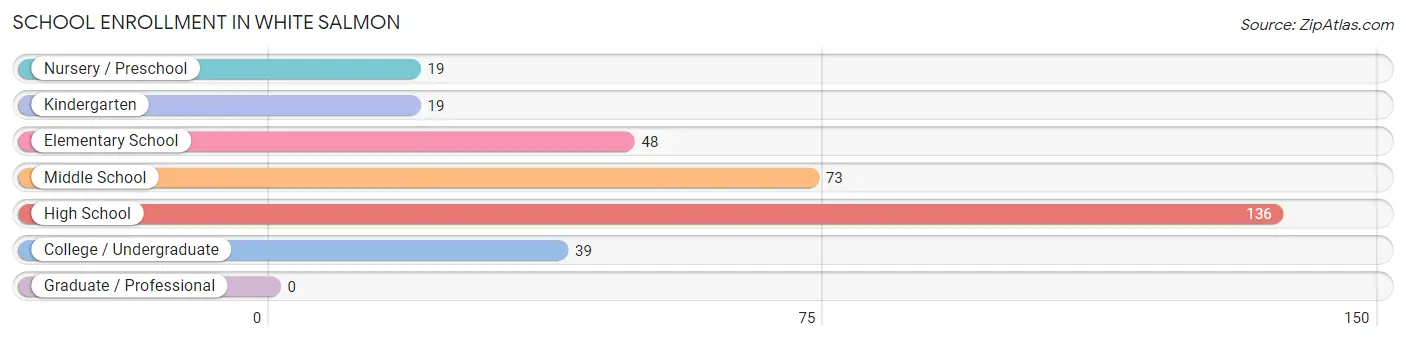
| School Level | # Students | % Students |
| Nursery / Preschool | 19 | 5.7% |
| Kindergarten | 19 | 5.7% |
| Elementary School | 48 | 14.4% |
| Middle School | 73 | 21.9% |
| High School | 136 | 40.7% |
| College / Undergraduate | 39 | 11.7% |
| Graduate / Professional | 0 | 0.0% |
| Total | 334 | 100.0% |
School Enrollment by Age by Funding Source in White Salmon
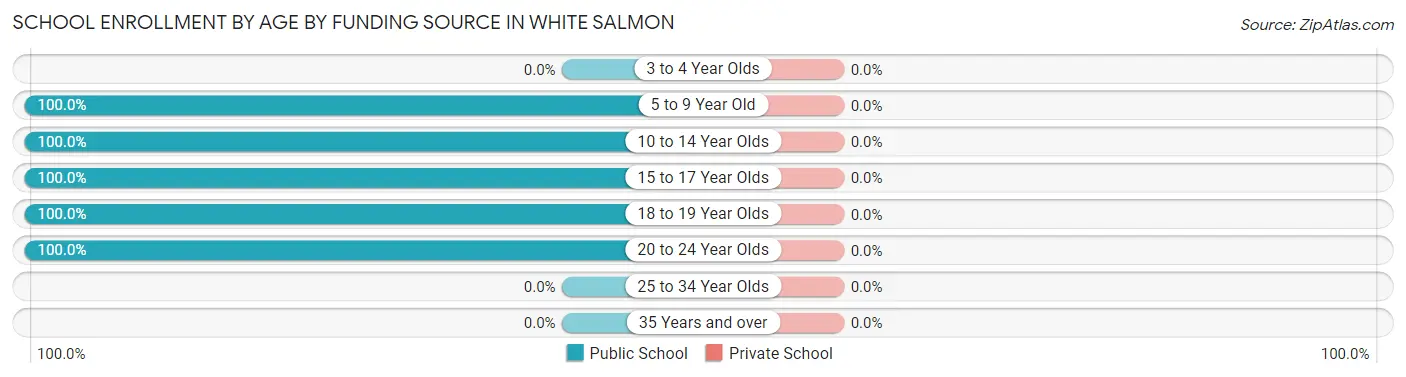
| Age Bracket | Public School | Private School |
| 3 to 4 Year Olds | 0 (0.0%) | 0 (0.0%) |
| 5 to 9 Year Old | 86 (100.0%) | 0 (0.0%) |
| 10 to 14 Year Olds | 84 (100.0%) | 0 (0.0%) |
| 15 to 17 Year Olds | 125 (100.0%) | 0 (0.0%) |
| 18 to 19 Year Olds | 8 (100.0%) | 0 (0.0%) |
| 20 to 24 Year Olds | 31 (100.0%) | 0 (0.0%) |
| 25 to 34 Year Olds | 0 (0.0%) | 0 (0.0%) |
| 35 Years and over | 0 (0.0%) | 0 (0.0%) |
| Total | 334 (100.0%) | 0 (0.0%) |
Educational Attainment by Field of Study in White Salmon
Bio, nature & agricultural (234 | 26.1%), business (156 | 17.4%), literature & languages (128 | 14.3%), communications (101 | 11.3%), and education (60 | 6.7%) are the most common fields of study among 896 individuals in White Salmon who have obtained a bachelor's degree or higher.
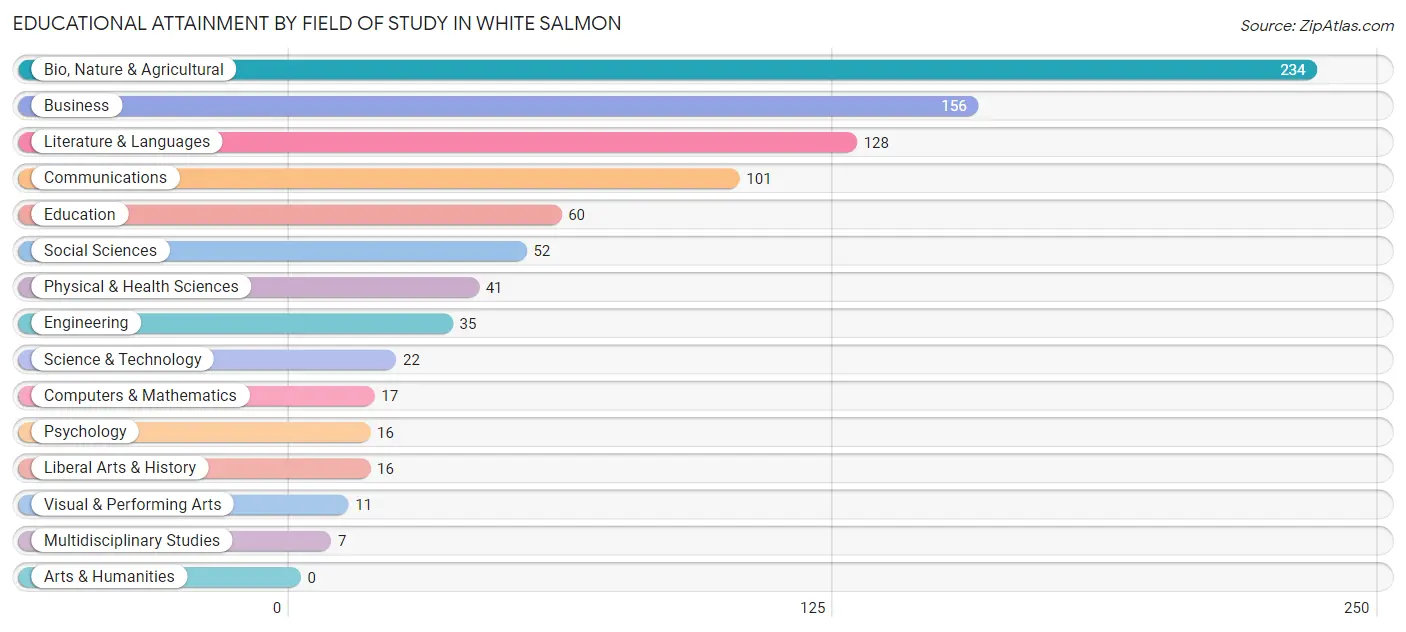
| Field of Study | # Graduates | % Graduates |
| Computers & Mathematics | 17 | 1.9% |
| Bio, Nature & Agricultural | 234 | 26.1% |
| Physical & Health Sciences | 41 | 4.6% |
| Psychology | 16 | 1.8% |
| Social Sciences | 52 | 5.8% |
| Engineering | 35 | 3.9% |
| Multidisciplinary Studies | 7 | 0.8% |
| Science & Technology | 22 | 2.5% |
| Business | 156 | 17.4% |
| Education | 60 | 6.7% |
| Literature & Languages | 128 | 14.3% |
| Liberal Arts & History | 16 | 1.8% |
| Visual & Performing Arts | 11 | 1.2% |
| Communications | 101 | 11.3% |
| Arts & Humanities | 0 | 0.0% |
| Total | 896 | 100.0% |
Transportation & Commute in White Salmon
Vehicle Availability by Sex in White Salmon
The most prevalent vehicle ownership categories in White Salmon are males with 2 vehicles (239, accounting for 38.2%) and females with 2 vehicles (191, making up 40.2%).
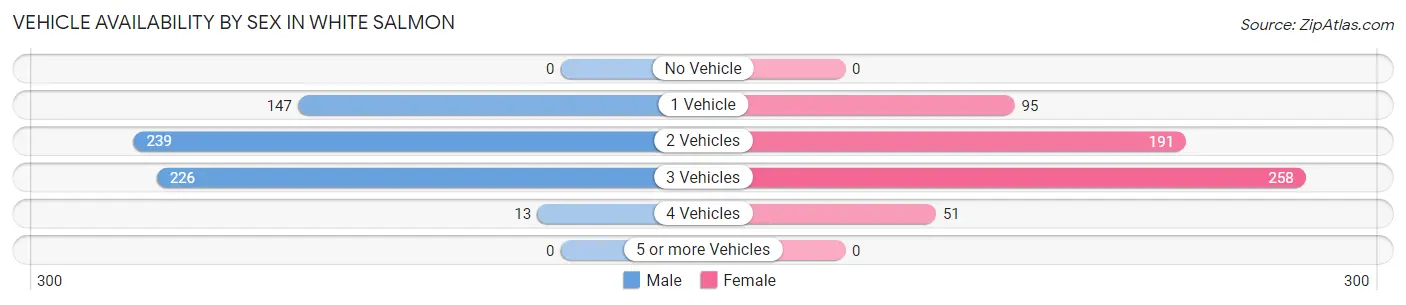
| Vehicles Available | Male | Female |
| No Vehicle | 0 (0.0%) | 0 (0.0%) |
| 1 Vehicle | 147 (23.5%) | 95 (16.0%) |
| 2 Vehicles | 239 (38.2%) | 191 (32.1%) |
| 3 Vehicles | 226 (36.2%) | 258 (43.4%) |
| 4 Vehicles | 13 (2.1%) | 51 (8.6%) |
| 5 or more Vehicles | 0 (0.0%) | 0 (0.0%) |
| Total | 625 (100.0%) | 595 (100.0%) |
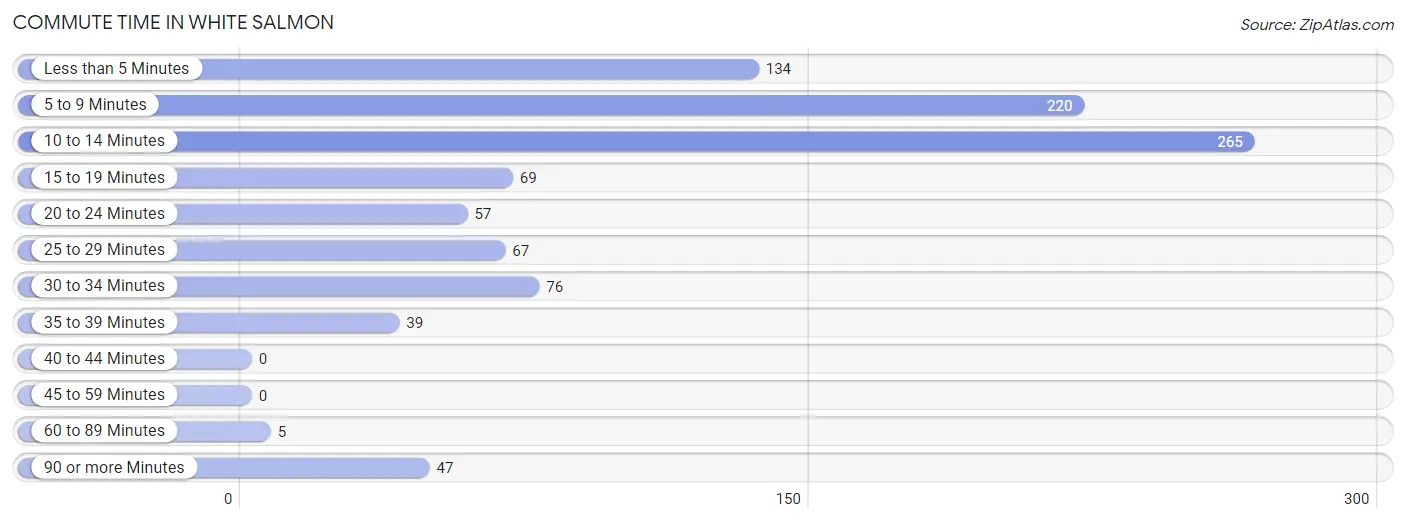
Commute Time in White Salmon
The most frequently occuring commute durations in White Salmon are 10 to 14 minutes (265 commuters, 27.1%), 5 to 9 minutes (220 commuters, 22.5%), and less than 5 minutes (134 commuters, 13.7%).
| Commute Time | # Commuters | % Commuters |
| Less than 5 Minutes | 134 | 13.7% |
| 5 to 9 Minutes | 220 | 22.5% |
| 10 to 14 Minutes | 265 | 27.1% |
| 15 to 19 Minutes | 69 | 7.0% |
| 20 to 24 Minutes | 57 | 5.8% |
| 25 to 29 Minutes | 67 | 6.8% |
| 30 to 34 Minutes | 76 | 7.8% |
| 35 to 39 Minutes | 39 | 4.0% |
| 40 to 44 Minutes | 0 | 0.0% |
| 45 to 59 Minutes | 0 | 0.0% |
| 60 to 89 Minutes | 5 | 0.5% |
| 90 or more Minutes | 47 | 4.8% |
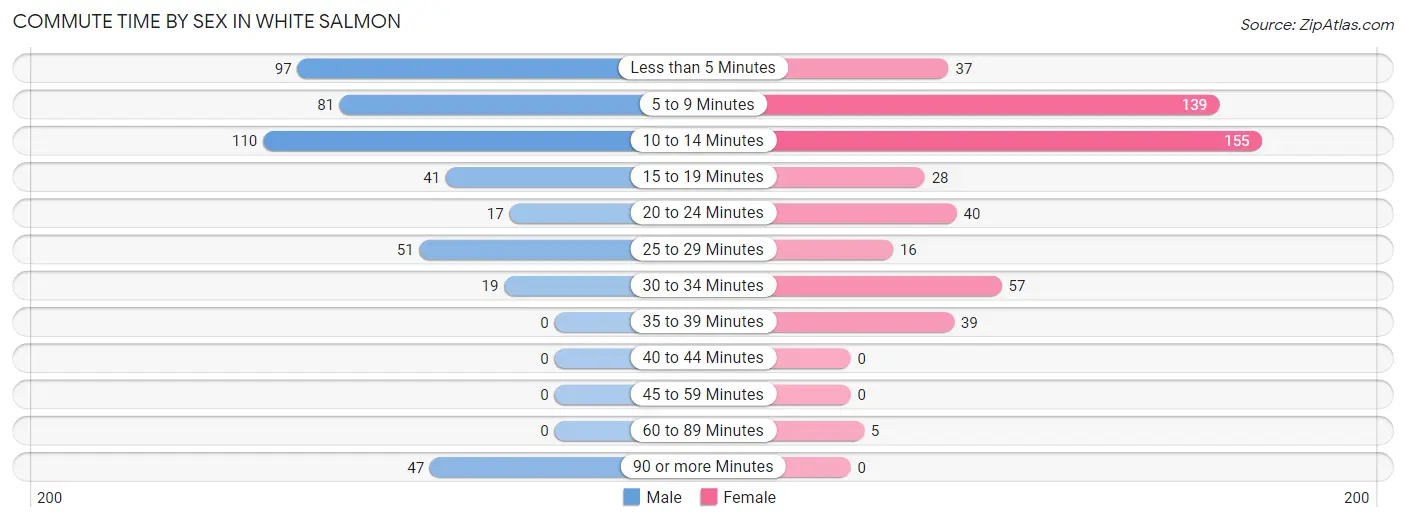
Commute Time by Sex in White Salmon
The most common commute times in White Salmon are 10 to 14 minutes (110 commuters, 23.8%) for males and 10 to 14 minutes (155 commuters, 30.0%) for females.
| Commute Time | Male | Female |
| Less than 5 Minutes | 97 (20.9%) | 37 (7.2%) |
| 5 to 9 Minutes | 81 (17.5%) | 139 (26.9%) |
| 10 to 14 Minutes | 110 (23.8%) | 155 (30.0%) |
| 15 to 19 Minutes | 41 (8.9%) | 28 (5.4%) |
| 20 to 24 Minutes | 17 (3.7%) | 40 (7.7%) |
| 25 to 29 Minutes | 51 (11.0%) | 16 (3.1%) |
| 30 to 34 Minutes | 19 (4.1%) | 57 (11.1%) |
| 35 to 39 Minutes | 0 (0.0%) | 39 (7.6%) |
| 40 to 44 Minutes | 0 (0.0%) | 0 (0.0%) |
| 45 to 59 Minutes | 0 (0.0%) | 0 (0.0%) |
| 60 to 89 Minutes | 0 (0.0%) | 5 (1.0%) |
| 90 or more Minutes | 47 (10.2%) | 0 (0.0%) |
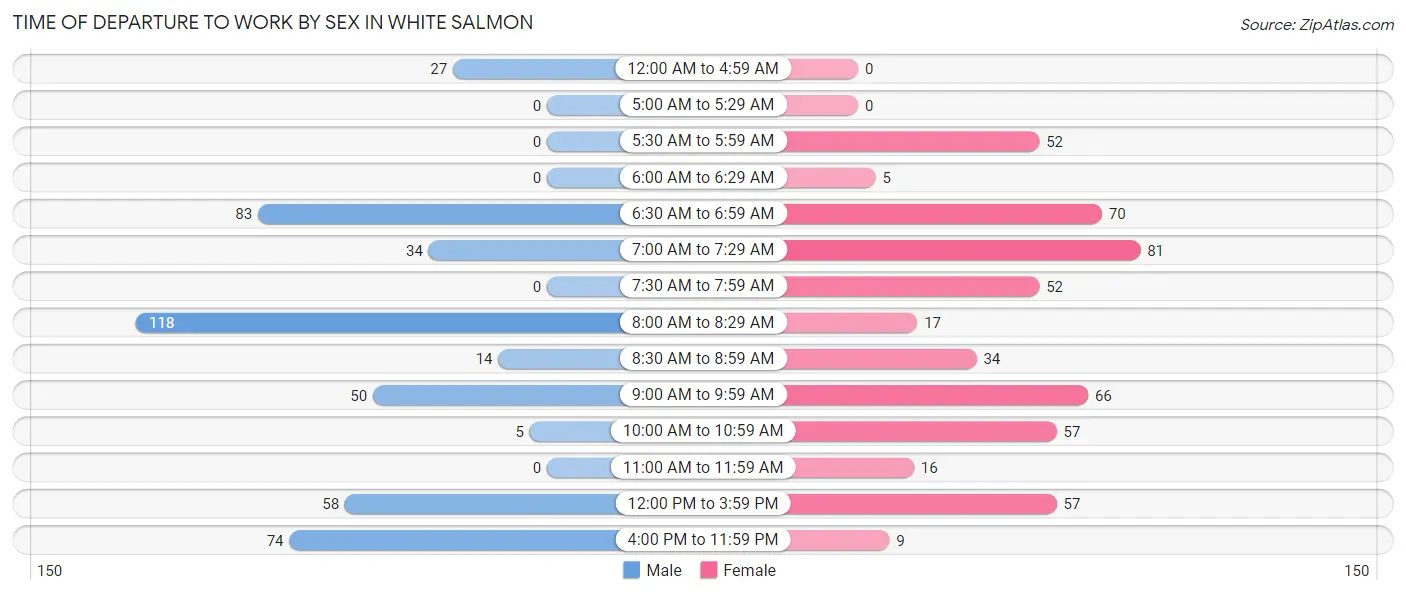
Time of Departure to Work by Sex in White Salmon
The most frequent times of departure to work in White Salmon are 8:00 AM to 8:29 AM (118, 25.5%) for males and 7:00 AM to 7:29 AM (81, 15.7%) for females.
| Time of Departure | Male | Female |
| 12:00 AM to 4:59 AM | 27 (5.8%) | 0 (0.0%) |
| 5:00 AM to 5:29 AM | 0 (0.0%) | 0 (0.0%) |
| 5:30 AM to 5:59 AM | 0 (0.0%) | 52 (10.1%) |
| 6:00 AM to 6:29 AM | 0 (0.0%) | 5 (1.0%) |
| 6:30 AM to 6:59 AM | 83 (17.9%) | 70 (13.6%) |
| 7:00 AM to 7:29 AM | 34 (7.3%) | 81 (15.7%) |
| 7:30 AM to 7:59 AM | 0 (0.0%) | 52 (10.1%) |
| 8:00 AM to 8:29 AM | 118 (25.5%) | 17 (3.3%) |
| 8:30 AM to 8:59 AM | 14 (3.0%) | 34 (6.6%) |
| 9:00 AM to 9:59 AM | 50 (10.8%) | 66 (12.8%) |
| 10:00 AM to 10:59 AM | 5 (1.1%) | 57 (11.1%) |
| 11:00 AM to 11:59 AM | 0 (0.0%) | 16 (3.1%) |
| 12:00 PM to 3:59 PM | 58 (12.5%) | 57 (11.1%) |
| 4:00 PM to 11:59 PM | 74 (16.0%) | 9 (1.7%) |
| Total | 463 (100.0%) | 516 (100.0%) |
Housing Occupancy in White Salmon
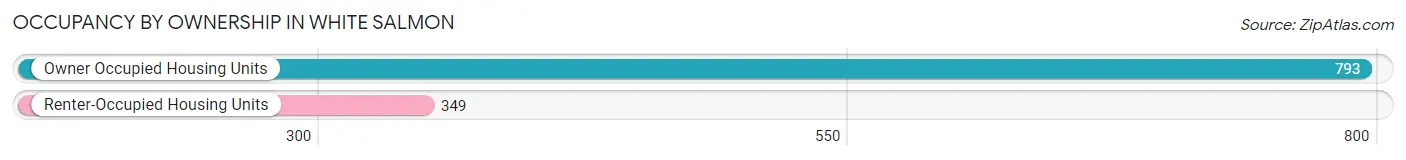
Occupancy by Ownership in White Salmon
Of the total 1,142 dwellings in White Salmon, owner-occupied units account for 793 (69.4%), while renter-occupied units make up 349 (30.6%).
| Occupancy | # Housing Units | % Housing Units |
| Owner Occupied Housing Units | 793 | 69.4% |
| Renter-Occupied Housing Units | 349 | 30.6% |
| Total Occupied Housing Units | 1,142 | 100.0% |
Occupancy by Household Size in White Salmon
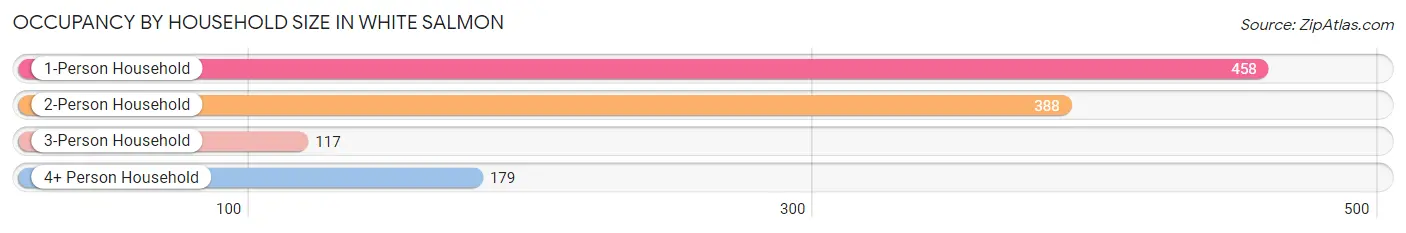
| Household Size | # Housing Units | % Housing Units |
| 1-Person Household | 458 | 40.1% |
| 2-Person Household | 388 | 34.0% |
| 3-Person Household | 117 | 10.2% |
| 4+ Person Household | 179 | 15.7% |
| Total Housing Units | 1,142 | 100.0% |
Occupancy by Ownership by Household Size in White Salmon
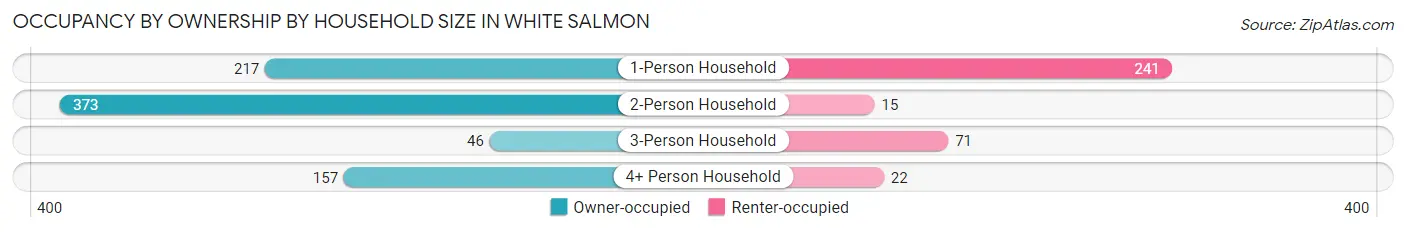
| Household Size | Owner-occupied | Renter-occupied |
| 1-Person Household | 217 (47.4%) | 241 (52.6%) |
| 2-Person Household | 373 (96.1%) | 15 (3.9%) |
| 3-Person Household | 46 (39.3%) | 71 (60.7%) |
| 4+ Person Household | 157 (87.7%) | 22 (12.3%) |
| Total Housing Units | 793 (69.4%) | 349 (30.6%) |
Occupancy by Educational Attainment in White Salmon
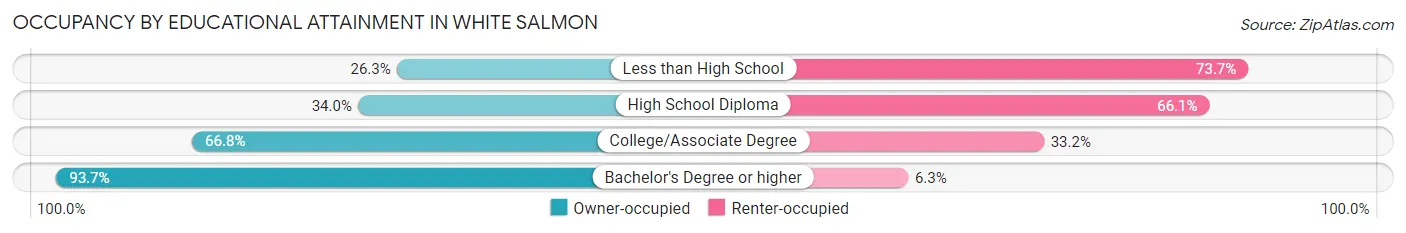
| Household Size | Owner-occupied | Renter-occupied |
| Less than High School | 26 (26.3%) | 73 (73.7%) |
| High School Diploma | 73 (34.0%) | 142 (66.0%) |
| College/Associate Degree | 203 (66.8%) | 101 (33.2%) |
| Bachelor's Degree or higher | 491 (93.7%) | 33 (6.3%) |
Occupancy by Age of Householder in White Salmon
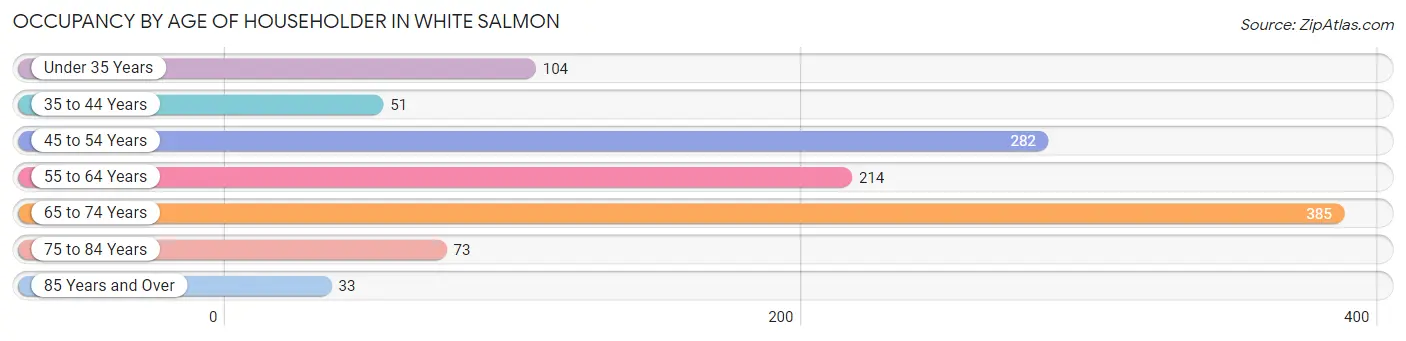
| Age Bracket | # Households | % Households |
| Under 35 Years | 104 | 9.1% |
| 35 to 44 Years | 51 | 4.5% |
| 45 to 54 Years | 282 | 24.7% |
| 55 to 64 Years | 214 | 18.7% |
| 65 to 74 Years | 385 | 33.7% |
| 75 to 84 Years | 73 | 6.4% |
| 85 Years and Over | 33 | 2.9% |
| Total | 1,142 | 100.0% |
Housing Finances in White Salmon
Median Income by Occupancy in White Salmon
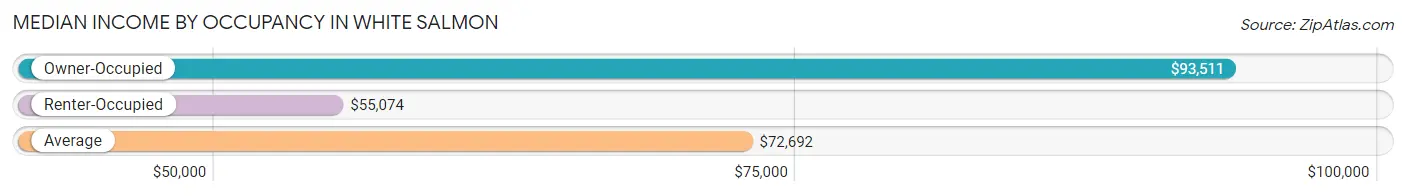
| Occupancy Type | # Households | Median Income |
| Owner-Occupied | 793 (69.4%) | $93,511 |
| Renter-Occupied | 349 (30.6%) | $55,074 |
| Average | 1,142 (100.0%) | $72,692 |
Occupancy by Householder Income Bracket in White Salmon
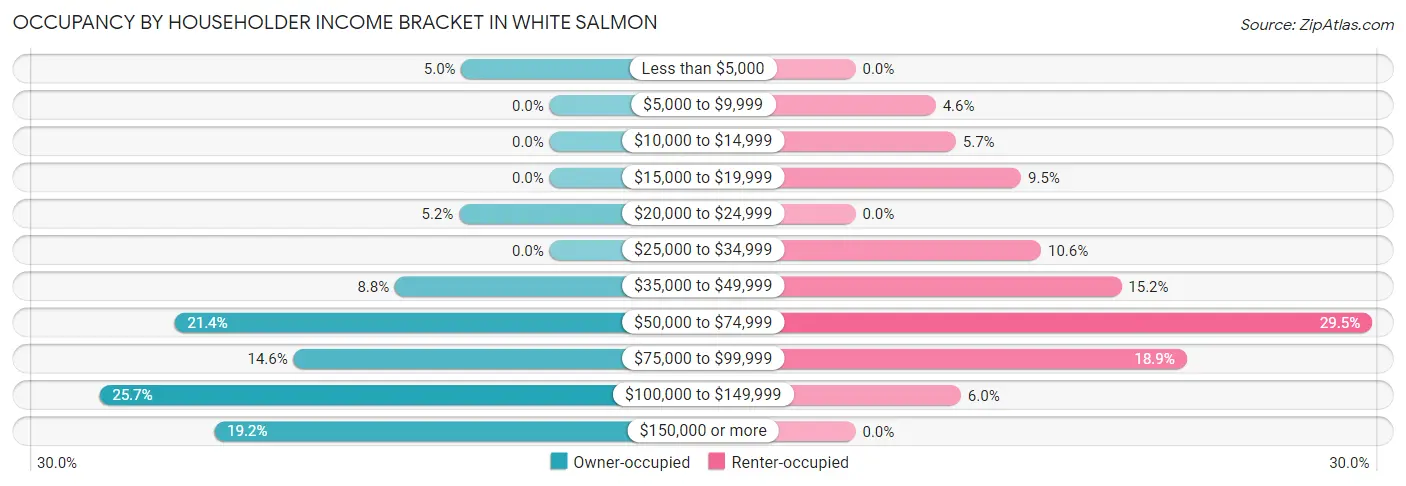
| Income Bracket | Owner-occupied | Renter-occupied |
| Less than $5,000 | 40 (5.0%) | 0 (0.0%) |
| $5,000 to $9,999 | 0 (0.0%) | 16 (4.6%) |
| $10,000 to $14,999 | 0 (0.0%) | 20 (5.7%) |
| $15,000 to $19,999 | 0 (0.0%) | 33 (9.5%) |
| $20,000 to $24,999 | 41 (5.2%) | 0 (0.0%) |
| $25,000 to $34,999 | 0 (0.0%) | 37 (10.6%) |
| $35,000 to $49,999 | 70 (8.8%) | 53 (15.2%) |
| $50,000 to $74,999 | 170 (21.4%) | 103 (29.5%) |
| $75,000 to $99,999 | 116 (14.6%) | 66 (18.9%) |
| $100,000 to $149,999 | 204 (25.7%) | 21 (6.0%) |
| $150,000 or more | 152 (19.2%) | 0 (0.0%) |
| Total | 793 (100.0%) | 349 (100.0%) |
Monthly Housing Cost Tiers in White Salmon
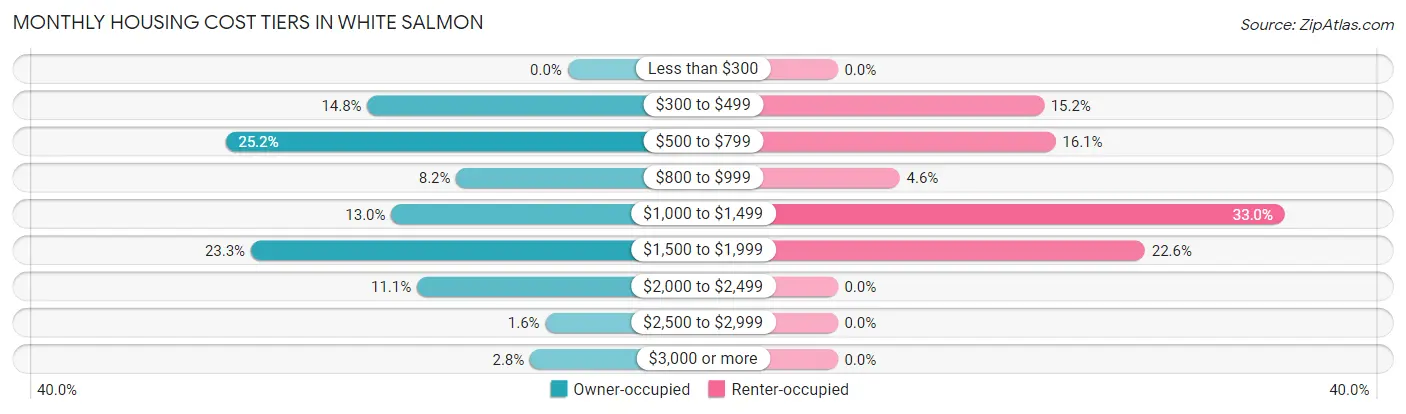
| Monthly Cost | Owner-occupied | Renter-occupied |
| Less than $300 | 0 (0.0%) | 0 (0.0%) |
| $300 to $499 | 117 (14.7%) | 53 (15.2%) |
| $500 to $799 | 200 (25.2%) | 56 (16.1%) |
| $800 to $999 | 65 (8.2%) | 16 (4.6%) |
| $1,000 to $1,499 | 103 (13.0%) | 115 (33.0%) |
| $1,500 to $1,999 | 185 (23.3%) | 79 (22.6%) |
| $2,000 to $2,499 | 88 (11.1%) | 0 (0.0%) |
| $2,500 to $2,999 | 13 (1.6%) | 0 (0.0%) |
| $3,000 or more | 22 (2.8%) | 0 (0.0%) |
| Total | 793 (100.0%) | 349 (100.0%) |
Physical Housing Characteristics in White Salmon
Housing Structures in White Salmon
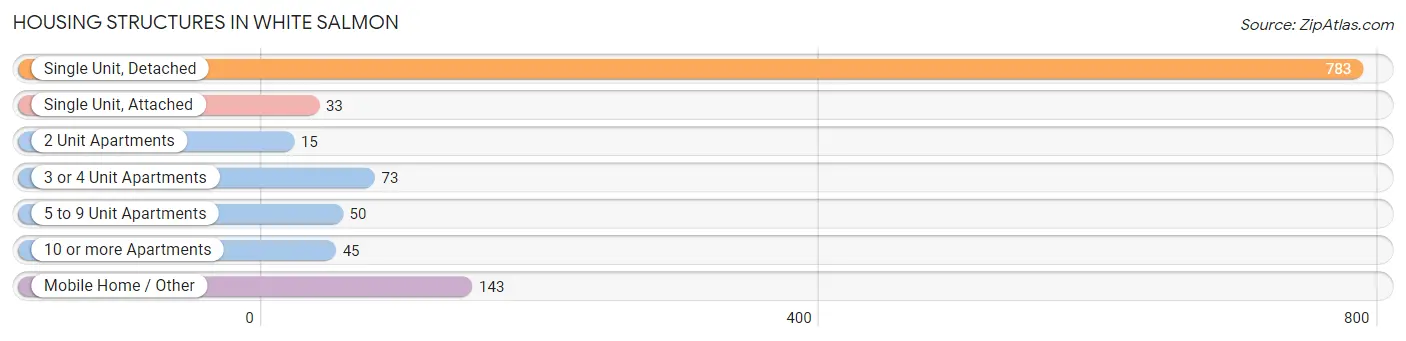
| Structure Type | # Housing Units | % Housing Units |
| Single Unit, Detached | 783 | 68.6% |
| Single Unit, Attached | 33 | 2.9% |
| 2 Unit Apartments | 15 | 1.3% |
| 3 or 4 Unit Apartments | 73 | 6.4% |
| 5 to 9 Unit Apartments | 50 | 4.4% |
| 10 or more Apartments | 45 | 3.9% |
| Mobile Home / Other | 143 | 12.5% |
| Total | 1,142 | 100.0% |
Housing Structures by Occupancy in White Salmon
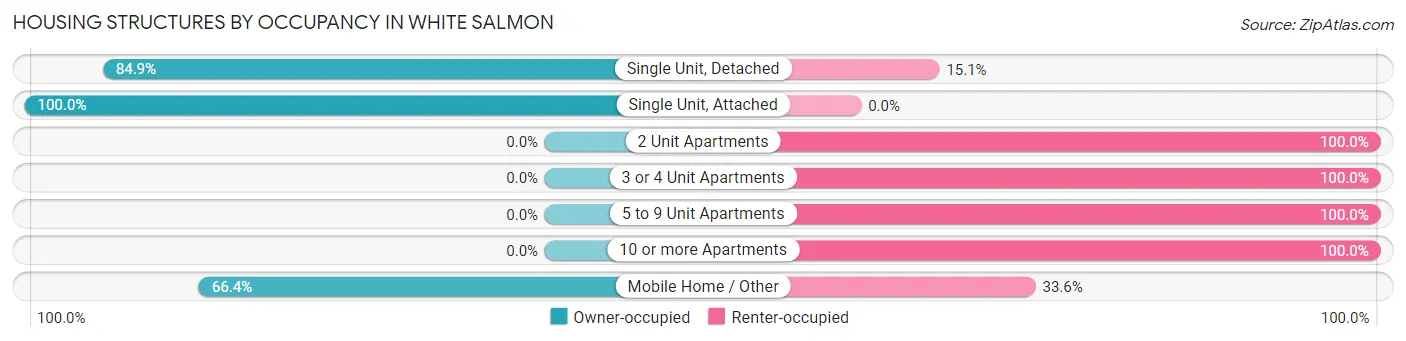
| Structure Type | Owner-occupied | Renter-occupied |
| Single Unit, Detached | 665 (84.9%) | 118 (15.1%) |
| Single Unit, Attached | 33 (100.0%) | 0 (0.0%) |
| 2 Unit Apartments | 0 (0.0%) | 15 (100.0%) |
| 3 or 4 Unit Apartments | 0 (0.0%) | 73 (100.0%) |
| 5 to 9 Unit Apartments | 0 (0.0%) | 50 (100.0%) |
| 10 or more Apartments | 0 (0.0%) | 45 (100.0%) |
| Mobile Home / Other | 95 (66.4%) | 48 (33.6%) |
| Total | 793 (69.4%) | 349 (30.6%) |
Housing Structures by Number of Rooms in White Salmon
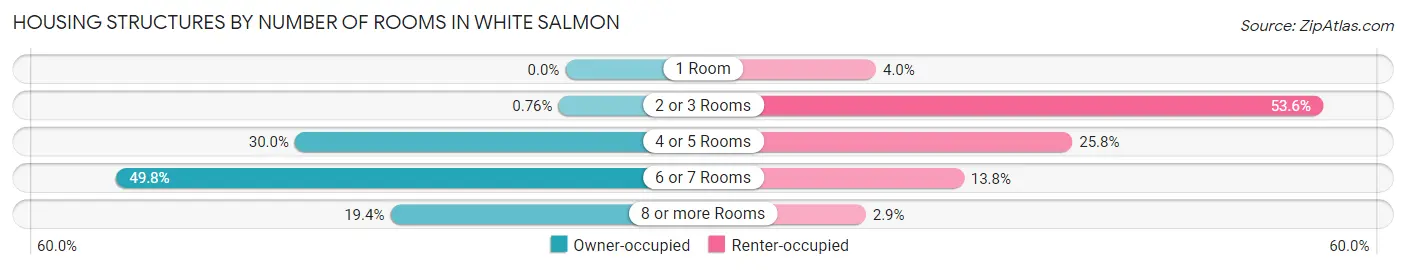
| Number of Rooms | Owner-occupied | Renter-occupied |
| 1 Room | 0 (0.0%) | 14 (4.0%) |
| 2 or 3 Rooms | 6 (0.8%) | 187 (53.6%) |
| 4 or 5 Rooms | 238 (30.0%) | 90 (25.8%) |
| 6 or 7 Rooms | 395 (49.8%) | 48 (13.8%) |
| 8 or more Rooms | 154 (19.4%) | 10 (2.9%) |
| Total | 793 (100.0%) | 349 (100.0%) |
Housing Structure by Heating Type in White Salmon
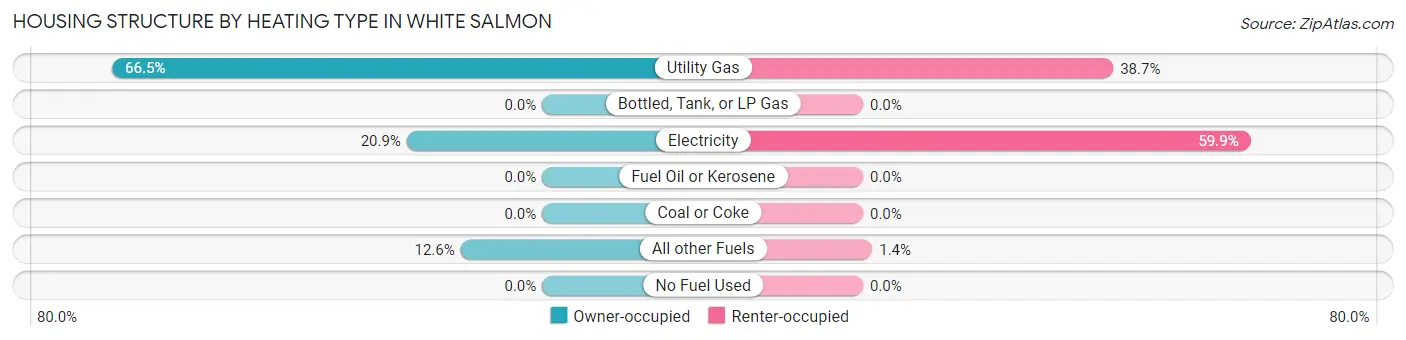
| Heating Type | Owner-occupied | Renter-occupied |
| Utility Gas | 527 (66.5%) | 135 (38.7%) |
| Bottled, Tank, or LP Gas | 0 (0.0%) | 0 (0.0%) |
| Electricity | 166 (20.9%) | 209 (59.9%) |
| Fuel Oil or Kerosene | 0 (0.0%) | 0 (0.0%) |
| Coal or Coke | 0 (0.0%) | 0 (0.0%) |
| All other Fuels | 100 (12.6%) | 5 (1.4%) |
| No Fuel Used | 0 (0.0%) | 0 (0.0%) |
| Total | 793 (100.0%) | 349 (100.0%) |
Household Vehicle Usage in White Salmon
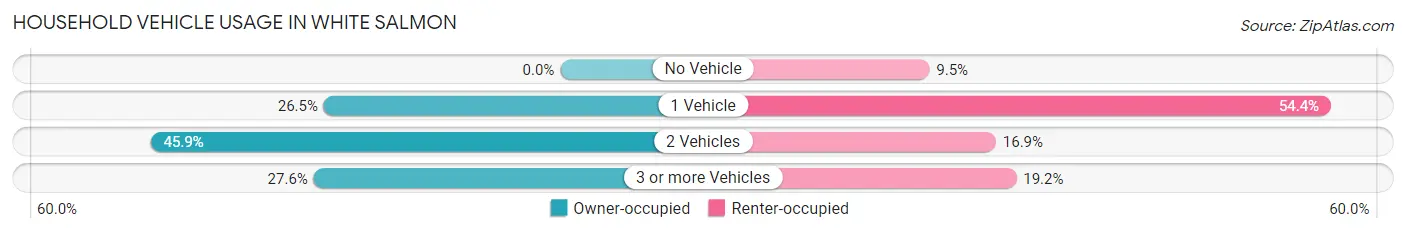
| Vehicles per Household | Owner-occupied | Renter-occupied |
| No Vehicle | 0 (0.0%) | 33 (9.5%) |
| 1 Vehicle | 210 (26.5%) | 190 (54.4%) |
| 2 Vehicles | 364 (45.9%) | 59 (16.9%) |
| 3 or more Vehicles | 219 (27.6%) | 67 (19.2%) |
| Total | 793 (100.0%) | 349 (100.0%) |
Real Estate & Mortgages in White Salmon
Real Estate and Mortgage Overview in White Salmon
| Characteristic | Without Mortgage | With Mortgage |
| Housing Units | 393 | 400 |
| Median Property Value | $388,600 | $476,500 |
| Median Household Income | $68,937 | $123 |
| Monthly Housing Costs | $610 | $22 |
| Real Estate Taxes | $2,914 | $0 |
Property Value by Mortgage Status in White Salmon
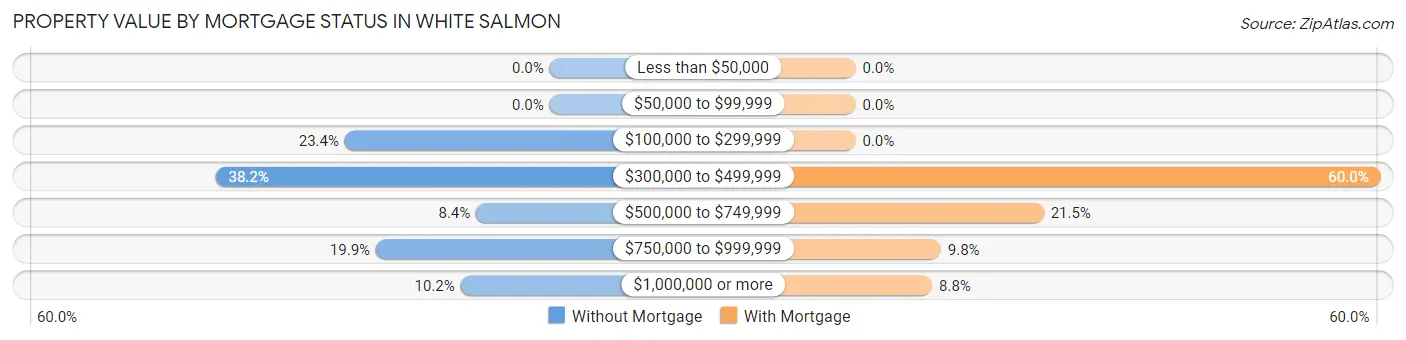
| Property Value | Without Mortgage | With Mortgage |
| Less than $50,000 | 0 (0.0%) | 0 (0.0%) |
| $50,000 to $99,999 | 0 (0.0%) | 0 (0.0%) |
| $100,000 to $299,999 | 92 (23.4%) | 0 (0.0%) |
| $300,000 to $499,999 | 150 (38.2%) | 240 (60.0%) |
| $500,000 to $749,999 | 33 (8.4%) | 86 (21.5%) |
| $750,000 to $999,999 | 78 (19.9%) | 39 (9.8%) |
| $1,000,000 or more | 40 (10.2%) | 35 (8.7%) |
| Total | 393 (100.0%) | 400 (100.0%) |
Household Income by Mortgage Status in White Salmon
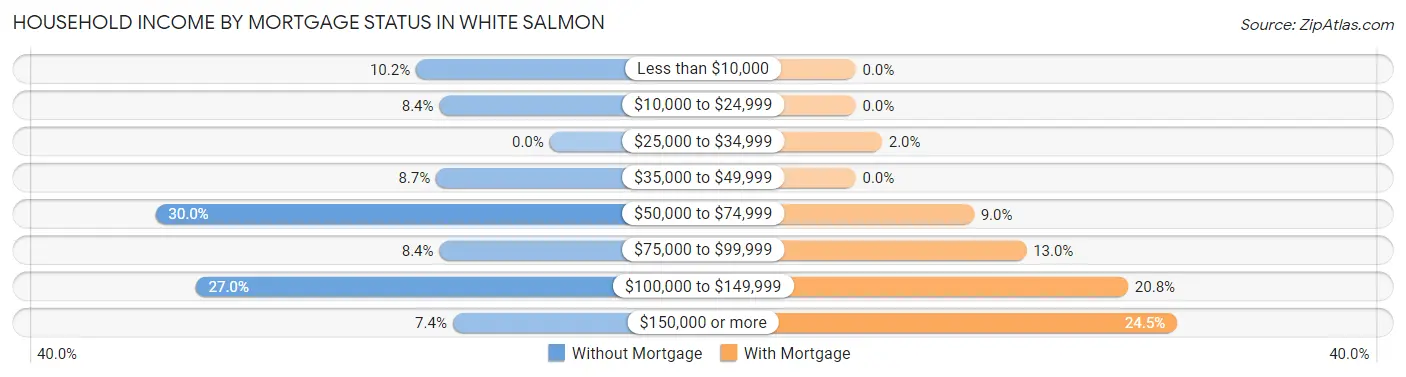
| Household Income | Without Mortgage | With Mortgage |
| Less than $10,000 | 40 (10.2%) | 0 (0.0%) |
| $10,000 to $24,999 | 33 (8.4%) | 0 (0.0%) |
| $25,000 to $34,999 | 0 (0.0%) | 8 (2.0%) |
| $35,000 to $49,999 | 34 (8.6%) | 0 (0.0%) |
| $50,000 to $74,999 | 118 (30.0%) | 36 (9.0%) |
| $75,000 to $99,999 | 33 (8.4%) | 52 (13.0%) |
| $100,000 to $149,999 | 106 (27.0%) | 83 (20.7%) |
| $150,000 or more | 29 (7.4%) | 98 (24.5%) |
| Total | 393 (100.0%) | 400 (100.0%) |
Property Value to Household Income Ratio in White Salmon
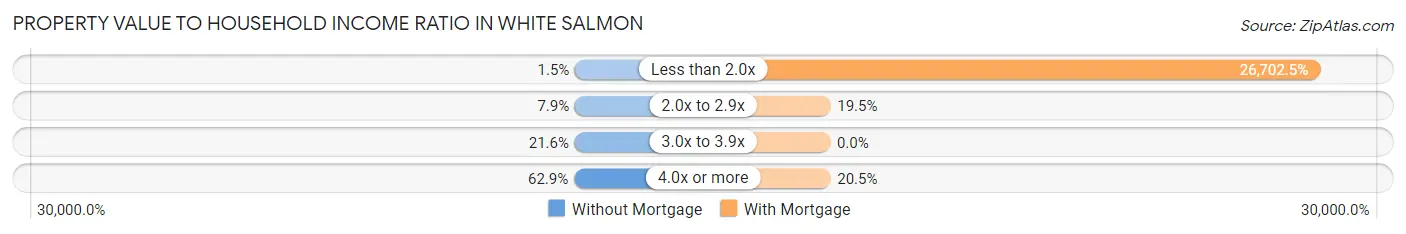
| Value-to-Income Ratio | Without Mortgage | With Mortgage |
| Less than 2.0x | 6 (1.5%) | 106,810 (26,702.5%) |
| 2.0x to 2.9x | 31 (7.9%) | 78 (19.5%) |
| 3.0x to 3.9x | 85 (21.6%) | 0 (0.0%) |
| 4.0x or more | 247 (62.8%) | 82 (20.5%) |
| Total | 393 (100.0%) | 400 (100.0%) |
Real Estate Taxes by Mortgage Status in White Salmon
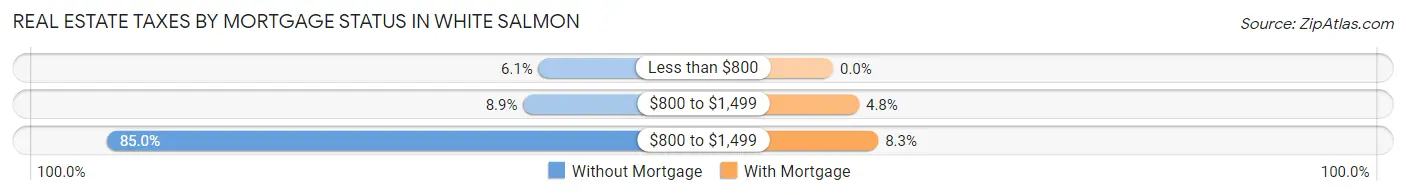
| Property Taxes | Without Mortgage | With Mortgage |
| Less than $800 | 24 (6.1%) | 0 (0.0%) |
| $800 to $1,499 | 35 (8.9%) | 19 (4.8%) |
| $800 to $1,499 | 334 (85.0%) | 33 (8.3%) |
| Total | 393 (100.0%) | 400 (100.0%) |
Health & Disability in White Salmon
Health Insurance Coverage by Age in White Salmon
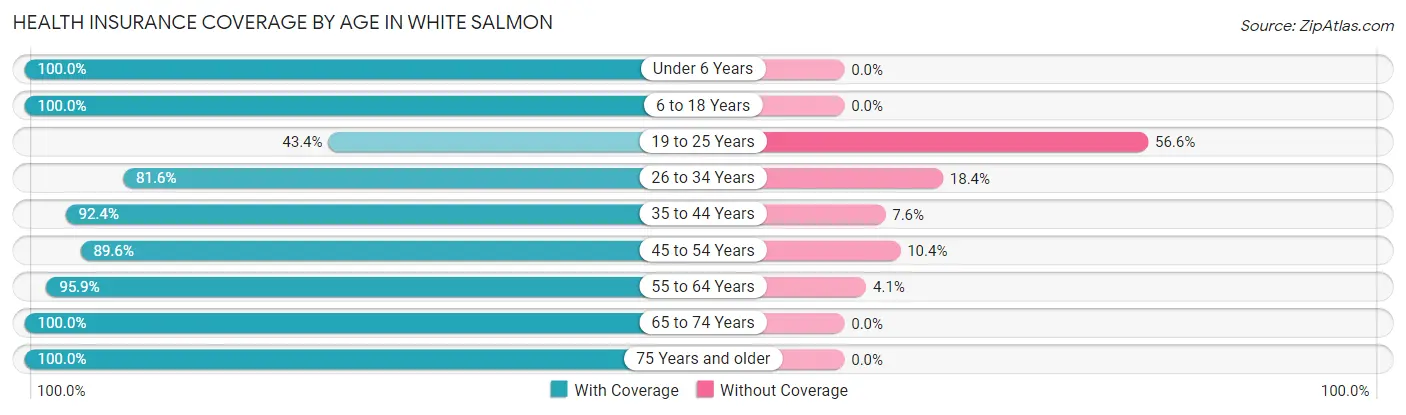
| Age Bracket | With Coverage | Without Coverage |
| Under 6 Years | 110 (100.0%) | 0 (0.0%) |
| 6 to 18 Years | 283 (100.0%) | 0 (0.0%) |
| 19 to 25 Years | 124 (43.4%) | 162 (56.6%) |
| 26 to 34 Years | 111 (81.6%) | 25 (18.4%) |
| 35 to 44 Years | 145 (92.4%) | 12 (7.6%) |
| 45 to 54 Years | 352 (89.6%) | 41 (10.4%) |
| 55 to 64 Years | 449 (95.9%) | 19 (4.1%) |
| 65 to 74 Years | 523 (100.0%) | 0 (0.0%) |
| 75 Years and older | 149 (100.0%) | 0 (0.0%) |
| Total | 2,246 (89.7%) | 259 (10.3%) |
Health Insurance Coverage by Citizenship Status in White Salmon
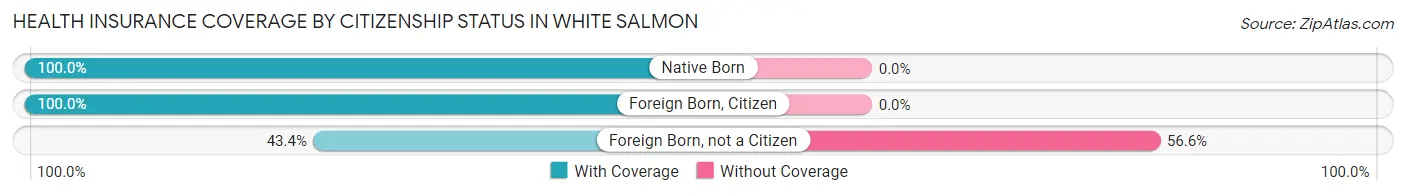
| Citizenship Status | With Coverage | Without Coverage |
| Native Born | 110 (100.0%) | 0 (0.0%) |
| Foreign Born, Citizen | 283 (100.0%) | 0 (0.0%) |
| Foreign Born, not a Citizen | 124 (43.4%) | 162 (56.6%) |
Health Insurance Coverage by Household Income in White Salmon
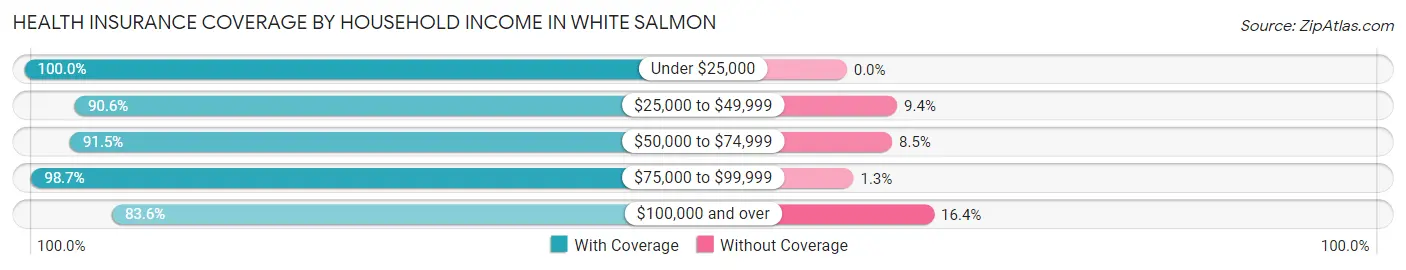
| Household Income | With Coverage | Without Coverage |
| Under $25,000 | 150 (100.0%) | 0 (0.0%) |
| $25,000 to $49,999 | 355 (90.6%) | 37 (9.4%) |
| $50,000 to $74,999 | 442 (91.5%) | 41 (8.5%) |
| $75,000 to $99,999 | 393 (98.7%) | 5 (1.3%) |
| $100,000 and over | 899 (83.6%) | 176 (16.4%) |
Public vs Private Health Insurance Coverage by Age in White Salmon
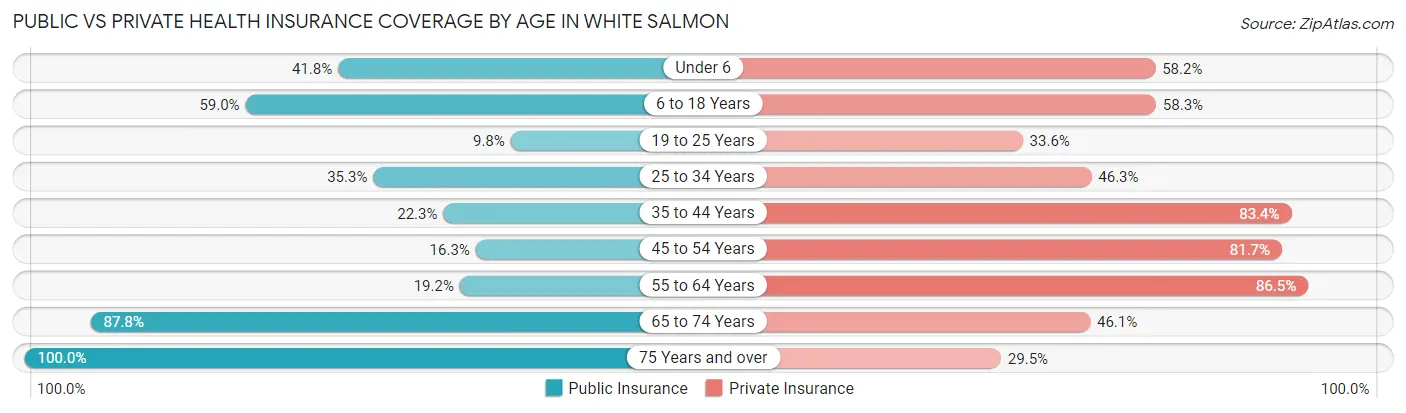
| Age Bracket | Public Insurance | Private Insurance |
| Under 6 | 46 (41.8%) | 64 (58.2%) |
| 6 to 18 Years | 167 (59.0%) | 165 (58.3%) |
| 19 to 25 Years | 28 (9.8%) | 96 (33.6%) |
| 25 to 34 Years | 48 (35.3%) | 63 (46.3%) |
| 35 to 44 Years | 35 (22.3%) | 131 (83.4%) |
| 45 to 54 Years | 64 (16.3%) | 321 (81.7%) |
| 55 to 64 Years | 90 (19.2%) | 405 (86.5%) |
| 65 to 74 Years | 459 (87.8%) | 241 (46.1%) |
| 75 Years and over | 149 (100.0%) | 44 (29.5%) |
| Total | 1,086 (43.3%) | 1,530 (61.1%) |
Disability Status by Sex by Age in White Salmon
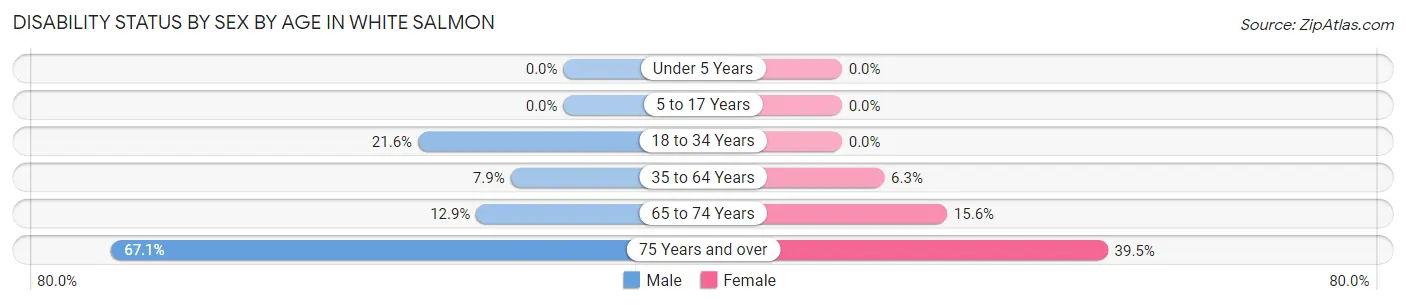
| Age Bracket | Male | Female |
| Under 5 Years | 0 (0.0%) | 0 (0.0%) |
| 5 to 17 Years | 0 (0.0%) | 0 (0.0%) |
| 18 to 34 Years | 35 (21.6%) | 0 (0.0%) |
| 35 to 64 Years | 45 (7.9%) | 28 (6.3%) |
| 65 to 74 Years | 37 (12.9%) | 37 (15.6%) |
| 75 Years and over | 49 (67.1%) | 30 (39.5%) |
Disability Class by Sex by Age in White Salmon
Disability Class: Hearing Difficulty
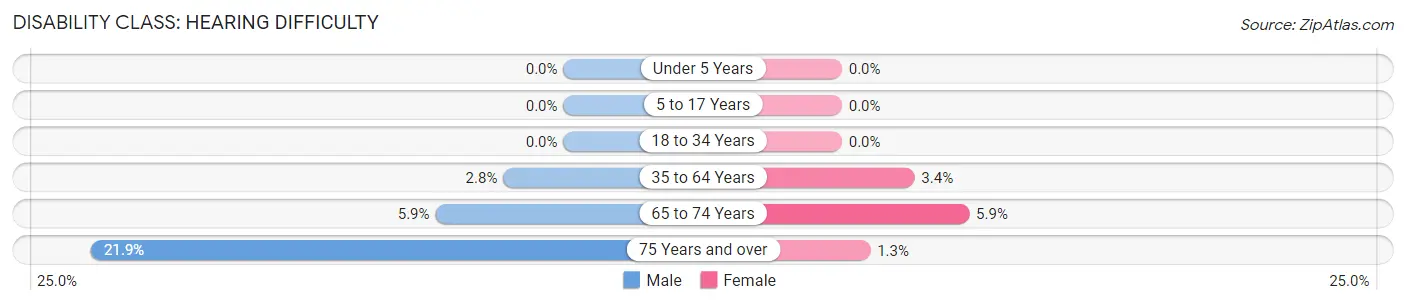
| Age Bracket | Male | Female |
| Under 5 Years | 0 (0.0%) | 0 (0.0%) |
| 5 to 17 Years | 0 (0.0%) | 0 (0.0%) |
| 18 to 34 Years | 0 (0.0%) | 0 (0.0%) |
| 35 to 64 Years | 16 (2.8%) | 15 (3.4%) |
| 65 to 74 Years | 17 (5.9%) | 14 (5.9%) |
| 75 Years and over | 16 (21.9%) | 1 (1.3%) |
Disability Class: Vision Difficulty
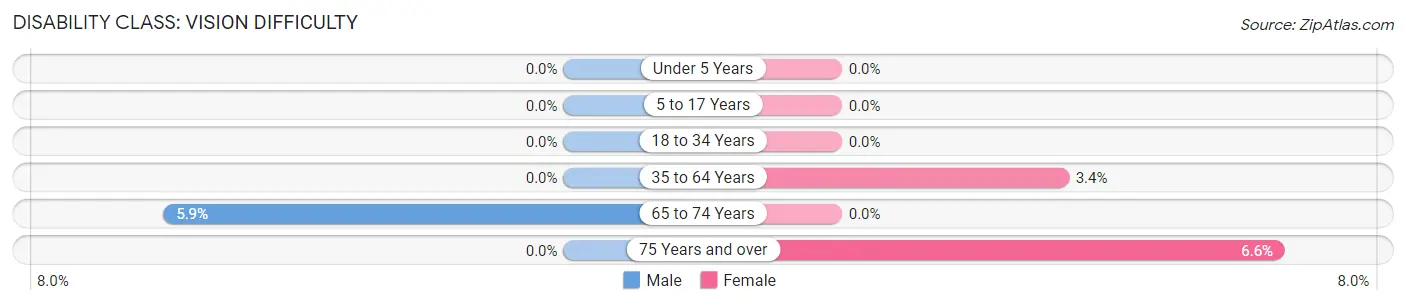
| Age Bracket | Male | Female |
| Under 5 Years | 0 (0.0%) | 0 (0.0%) |
| 5 to 17 Years | 0 (0.0%) | 0 (0.0%) |
| 18 to 34 Years | 0 (0.0%) | 0 (0.0%) |
| 35 to 64 Years | 0 (0.0%) | 15 (3.4%) |
| 65 to 74 Years | 17 (5.9%) | 0 (0.0%) |
| 75 Years and over | 0 (0.0%) | 5 (6.6%) |
Disability Class: Cognitive Difficulty
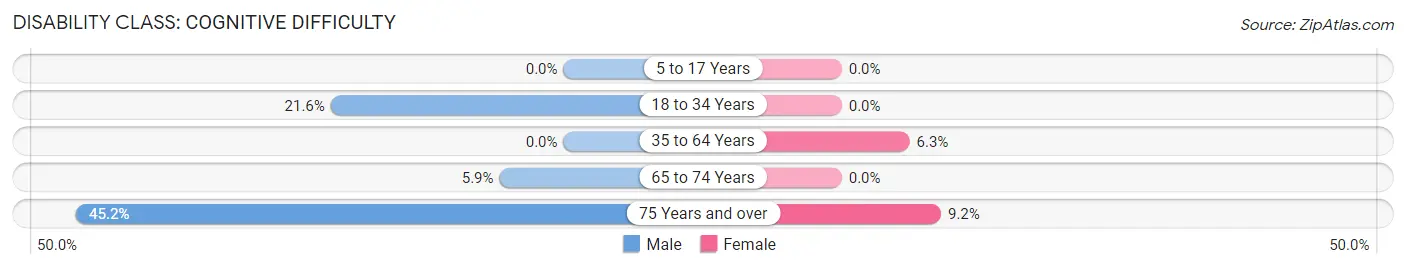
| Age Bracket | Male | Female |
| 5 to 17 Years | 0 (0.0%) | 0 (0.0%) |
| 18 to 34 Years | 35 (21.6%) | 0 (0.0%) |
| 35 to 64 Years | 0 (0.0%) | 28 (6.3%) |
| 65 to 74 Years | 17 (5.9%) | 0 (0.0%) |
| 75 Years and over | 33 (45.2%) | 7 (9.2%) |
Disability Class: Ambulatory Difficulty
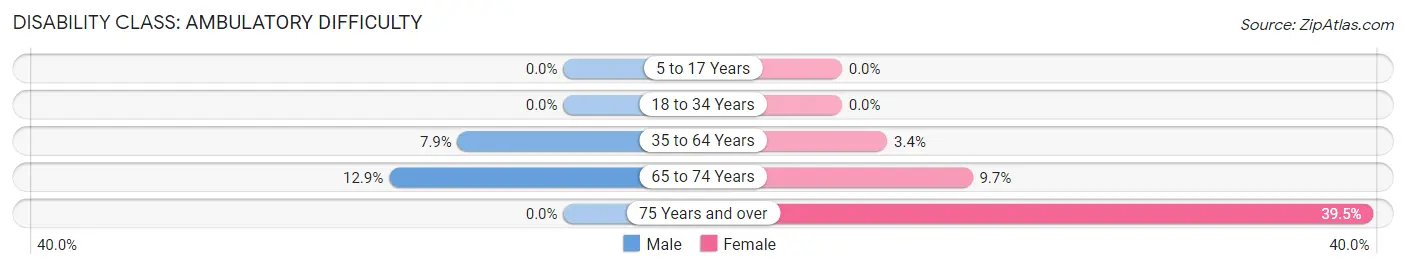
| Age Bracket | Male | Female |
| 5 to 17 Years | 0 (0.0%) | 0 (0.0%) |
| 18 to 34 Years | 0 (0.0%) | 0 (0.0%) |
| 35 to 64 Years | 45 (7.9%) | 15 (3.4%) |
| 65 to 74 Years | 37 (12.9%) | 23 (9.7%) |
| 75 Years and over | 0 (0.0%) | 30 (39.5%) |
Disability Class: Self-Care Difficulty
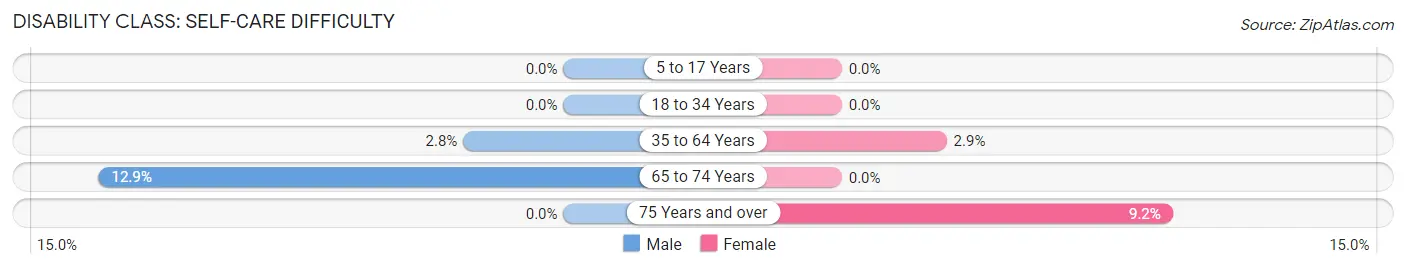
| Age Bracket | Male | Female |
| 5 to 17 Years | 0 (0.0%) | 0 (0.0%) |
| 18 to 34 Years | 0 (0.0%) | 0 (0.0%) |
| 35 to 64 Years | 16 (2.8%) | 13 (2.9%) |
| 65 to 74 Years | 37 (12.9%) | 0 (0.0%) |
| 75 Years and over | 0 (0.0%) | 7 (9.2%) |
Technology Access in White Salmon
Computing Device Access in White Salmon
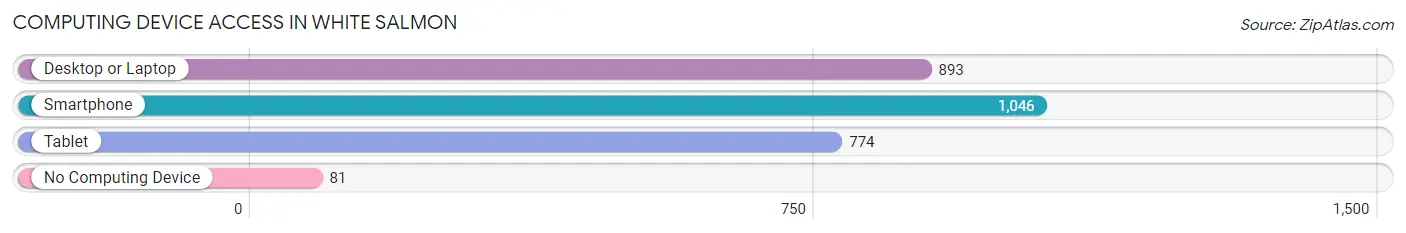
| Device Type | # Households | % Households |
| Desktop or Laptop | 893 | 78.2% |
| Smartphone | 1,046 | 91.6% |
| Tablet | 774 | 67.8% |
| No Computing Device | 81 | 7.1% |
| Total | 1,142 | 100.0% |
Internet Access in White Salmon
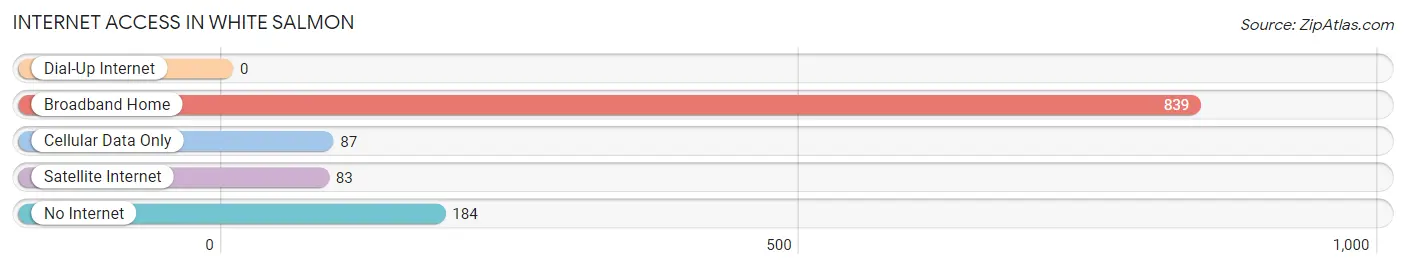
| Internet Type | # Households | % Households |
| Dial-Up Internet | 0 | 0.0% |
| Broadband Home | 839 | 73.5% |
| Cellular Data Only | 87 | 7.6% |
| Satellite Internet | 83 | 7.3% |
| No Internet | 184 | 16.1% |
| Total | 1,142 | 100.0% |
White Salmon Summary
History
White Salmon is a small city located in the Columbia River Gorge in Klickitat County, Washington. It is situated on the Washington side of the Columbia River, directly across from Hood River, Oregon. The city was founded in 1853 by settlers from the Oregon Trail, and was originally known as “White Salmon Landing”. The name was changed to White Salmon in 1891.
The area was originally inhabited by the Klickitat tribe, who were part of the Chinookan peoples. The Klickitat were a semi-nomadic people who lived in the area for thousands of years before the arrival of European settlers. The Klickitat were known for their fishing and hunting skills, and were also skilled traders.
White Salmon was an important trading post for the Klickitat, and the area was also used as a crossing point for the Oregon Trail. The first settlers in the area were mostly farmers and ranchers, and the town grew slowly over the years. In the late 1800s, the town was home to a number of businesses, including a sawmill, a flour mill, a hotel, and a general store.
In the early 1900s, the town began to grow more rapidly. The construction of the Columbia River Highway in 1915 brought more tourists to the area, and the town began to attract more businesses. The construction of the Bonneville Dam in 1938 brought even more people to the area, and the town continued to grow.
Geography
White Salmon is located in the Columbia River Gorge, a deep canyon carved by the Columbia River. The city is situated on the Washington side of the river, directly across from Hood River, Oregon. The city is surrounded by the Cascade Mountains to the east and the Columbia River to the west.
The city has a total area of 1.7 square miles, all of which is land. The city is located at an elevation of 441 feet above sea level. The climate in White Salmon is mild and temperate, with warm summers and cool winters. The average annual temperature is 52 degrees Fahrenheit.
Economy
White Salmon’s economy is largely based on tourism and recreation. The city is home to a number of outdoor recreation activities, including fishing, hiking, camping, and rafting. The city is also home to a number of wineries and breweries, as well as a number of restaurants and shops.
The city is also home to a number of businesses, including a lumber mill, a sawmill, and a number of manufacturing companies. The city is also home to a number of government agencies, including the U.S. Forest Service and the U.S. Fish and Wildlife Service.
Demographics
As of the 2010 census, White Salmon had a population of 2,193. The racial makeup of the city was 91.2% White, 0.7% African American, 0.7% Native American, 0.7% Asian, 0.2% Pacific Islander, 4.2% from other races, and 2.1% from two or more races. Hispanic or Latino of any race were 8.2% of the population.
The median income for a household in White Salmon was $41,250, and the median income for a family was $48,750. The per capita income for the city was $20,945. About 11.2% of families and 14.2% of the population were below the poverty line, including 18.2% of those under age 18 and 8.2% of those age 65 or over.
Common Questions
What is Per Capita Income in White Salmon?
Per Capita income in White Salmon is $42,926.
What is the Median Family Income in White Salmon?
Median Family Income in White Salmon is $100,833.
What is the Median Household income in White Salmon?
Median Household Income in White Salmon is $72,692.
What is Income or Wage Gap in White Salmon?
Income or Wage Gap in White Salmon is 38.4%.
Women in White Salmon earn 61.6 cents for every dollar earned by a man.
What is Inequality or Gini Index in White Salmon?
Inequality or Gini Index in White Salmon is 0.39.
What is the Total Population of White Salmon?
Total Population of White Salmon is 2,505.
What is the Total Male Population of White Salmon?
Total Male Population of White Salmon is 1,270.
What is the Total Female Population of White Salmon?
Total Female Population of White Salmon is 1,235.
What is the Ratio of Males per 100 Females in White Salmon?
There are 102.83 Males per 100 Females in White Salmon.
What is the Ratio of Females per 100 Males in White Salmon?
There are 97.24 Females per 100 Males in White Salmon.
What is the Median Population Age in White Salmon?
Median Population Age in White Salmon is 51.2 Years.
What is the Average Family Size in White Salmon
Average Family Size in White Salmon is 2.9 People.
What is the Average Household Size in White Salmon
Average Household Size in White Salmon is 2.2 People.
How Large is the Labor Force in White Salmon?
There are 1,303 People in the Labor Forcein in White Salmon.
What is the Percentage of People in the Labor Force in White Salmon?
58.9% of People are in the Labor Force in White Salmon.
What is the Unemployment Rate in White Salmon?
Unemployment Rate in White Salmon is 1.1%.