Zip Codes with the Highest Percentage of Population with a Degree in Visual and Performing Arts in Henderson, TX
RELATED REPORTS & OPTIONS
Visual and Performing Arts
Henderson
Compare Zip Codes
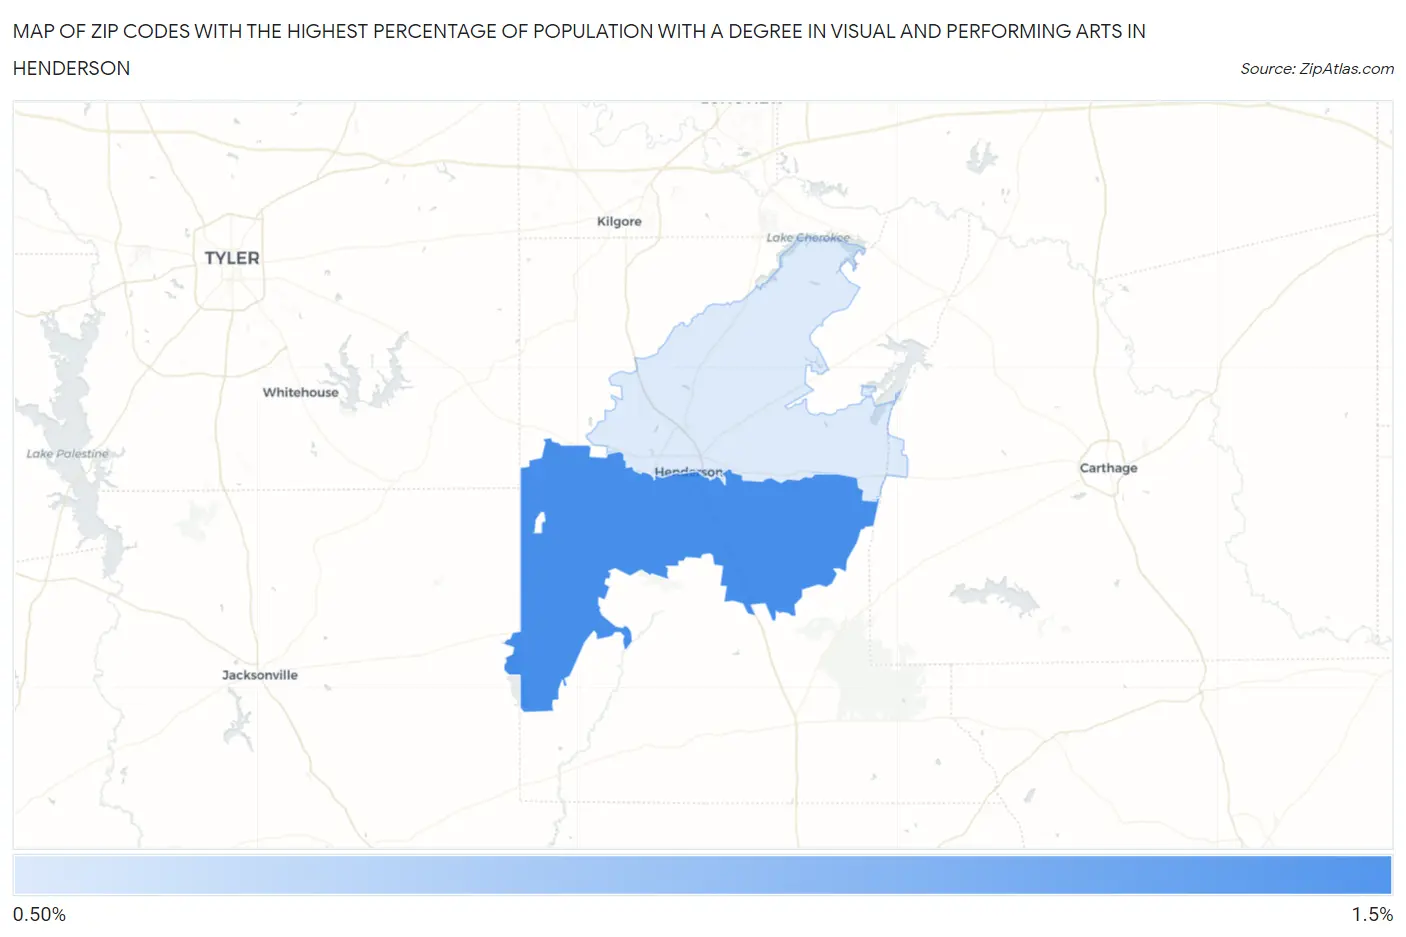
Map of Zip Codes with the Highest Percentage of Population with a Degree in Visual and Performing Arts in Henderson
0.65%
1.3%
Zip Codes with the Highest Percentage of Population with a Degree in Visual and Performing Arts in Henderson, TX
| Zip Code | % Graduates | vs State | vs National | |
| 1. | 75654 | 1.3% | 3.2%(-1.90)#1,043 | 4.3%(-2.94)#18,731 |
| 2. | 75652 | 0.65% | 3.2%(-2.56)#1,170 | 4.3%(-3.60)#20,472 |
1
Common Questions
What are the Top Zip Codes with the Highest Percentage of Population with a Degree in Visual and Performing Arts in Henderson, TX?
Top Zip Codes with the Highest Percentage of Population with a Degree in Visual and Performing Arts in Henderson, TX are:
What zip code has the Highest Percentage of Population with a Degree in Visual and Performing Arts in Henderson, TX?
75654 has the Highest Percentage of Population with a Degree in Visual and Performing Arts in Henderson, TX with 1.3%.
What is the Percentage of Population with a Degree in Visual and Performing Arts in Henderson, TX?
Percentage of Population with a Degree in Visual and Performing Arts in Henderson is 0.55%.
What is the Percentage of Population with a Degree in Visual and Performing Arts in Texas?
Percentage of Population with a Degree in Visual and Performing Arts in Texas is 3.2%.
What is the Percentage of Population with a Degree in Visual and Performing Arts in the United States?
Percentage of Population with a Degree in Visual and Performing Arts in the United States is 4.3%.