Zip Codes with the Highest Percentage of Population Employed in Administrative & Support Services in Henderson, TX
RELATED REPORTS & OPTIONS
Administrative & Support Services
Henderson
Compare Zip Codes
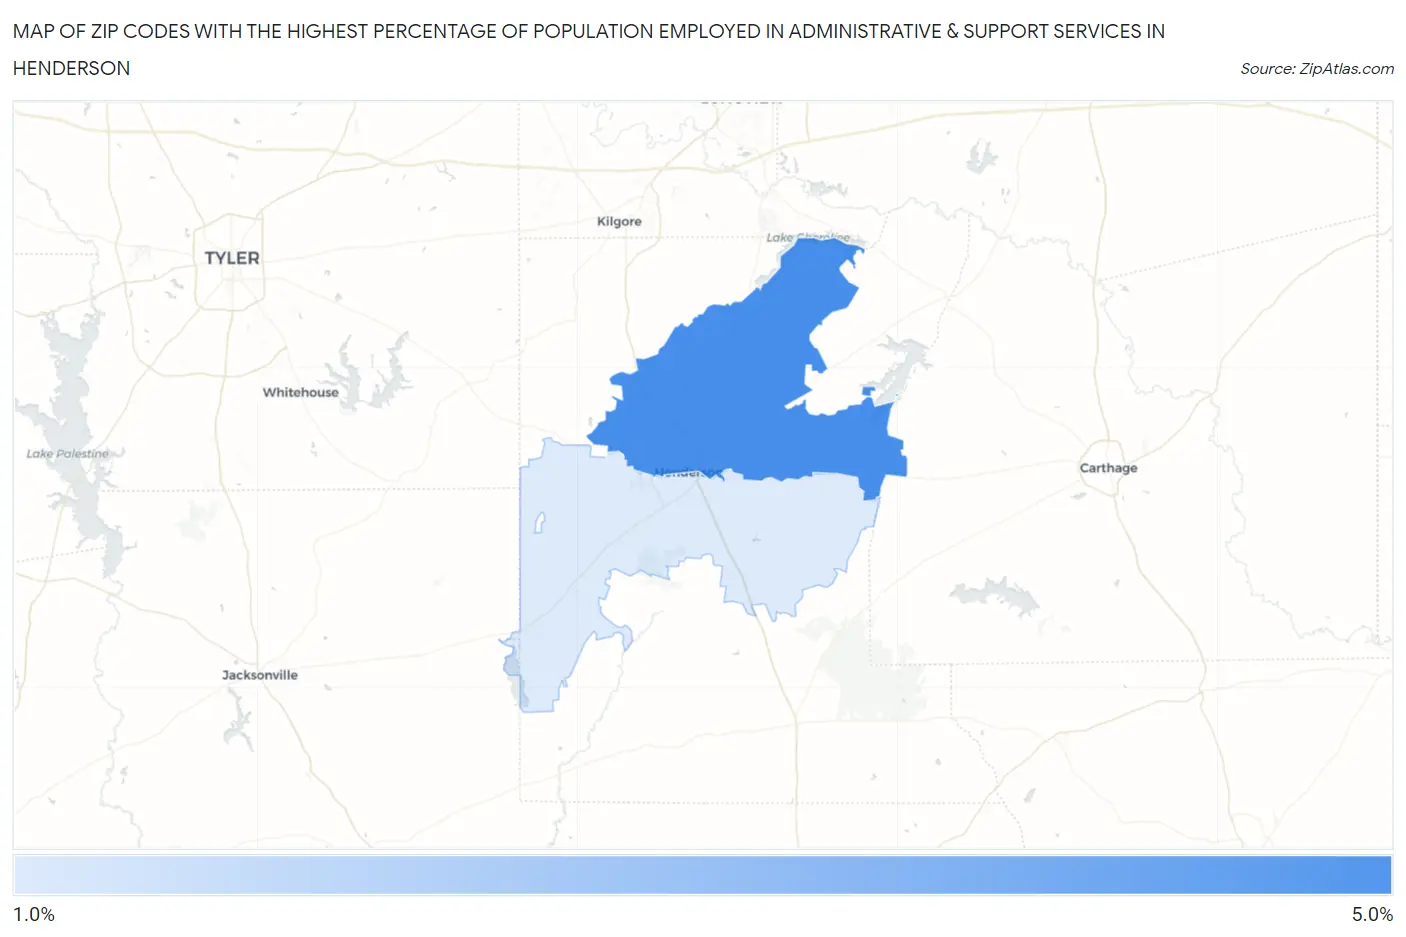
Map of Zip Codes with the Highest Percentage of Population Employed in Administrative & Support Services in Henderson
1.9%
4.1%
Zip Codes with the Highest Percentage of Population Employed in Administrative & Support Services in Henderson, TX
| Zip Code | % Employed | vs State | vs National | |
| 1. | 75652 | 4.1% | 4.4%(-0.324)#721 | 4.1%(-0.058)#10,275 |
| 2. | 75654 | 1.9% | 4.4%(-2.47)#1,300 | 4.1%(-2.21)#20,894 |
1
Common Questions
What are the Top Zip Codes with the Highest Percentage of Population Employed in Administrative & Support Services in Henderson, TX?
Top Zip Codes with the Highest Percentage of Population Employed in Administrative & Support Services in Henderson, TX are:
What zip code has the Highest Percentage of Population Employed in Administrative & Support Services in Henderson, TX?
75652 has the Highest Percentage of Population Employed in Administrative & Support Services in Henderson, TX with 4.1%.
What is the Percentage of Population Employed in Administrative & Support Services in Henderson, TX?
Percentage of Population Employed in Administrative & Support Services in Henderson is 3.5%.
What is the Percentage of Population Employed in Administrative & Support Services in Texas?
Percentage of Population Employed in Administrative & Support Services in Texas is 4.4%.
What is the Percentage of Population Employed in Administrative & Support Services in the United States?
Percentage of Population Employed in Administrative & Support Services in the United States is 4.1%.