Zip Codes with the Most Immigrants from Central America in Henderson, TX
RELATED REPORTS & OPTIONS
Central America
Henderson
Compare Zip Codes
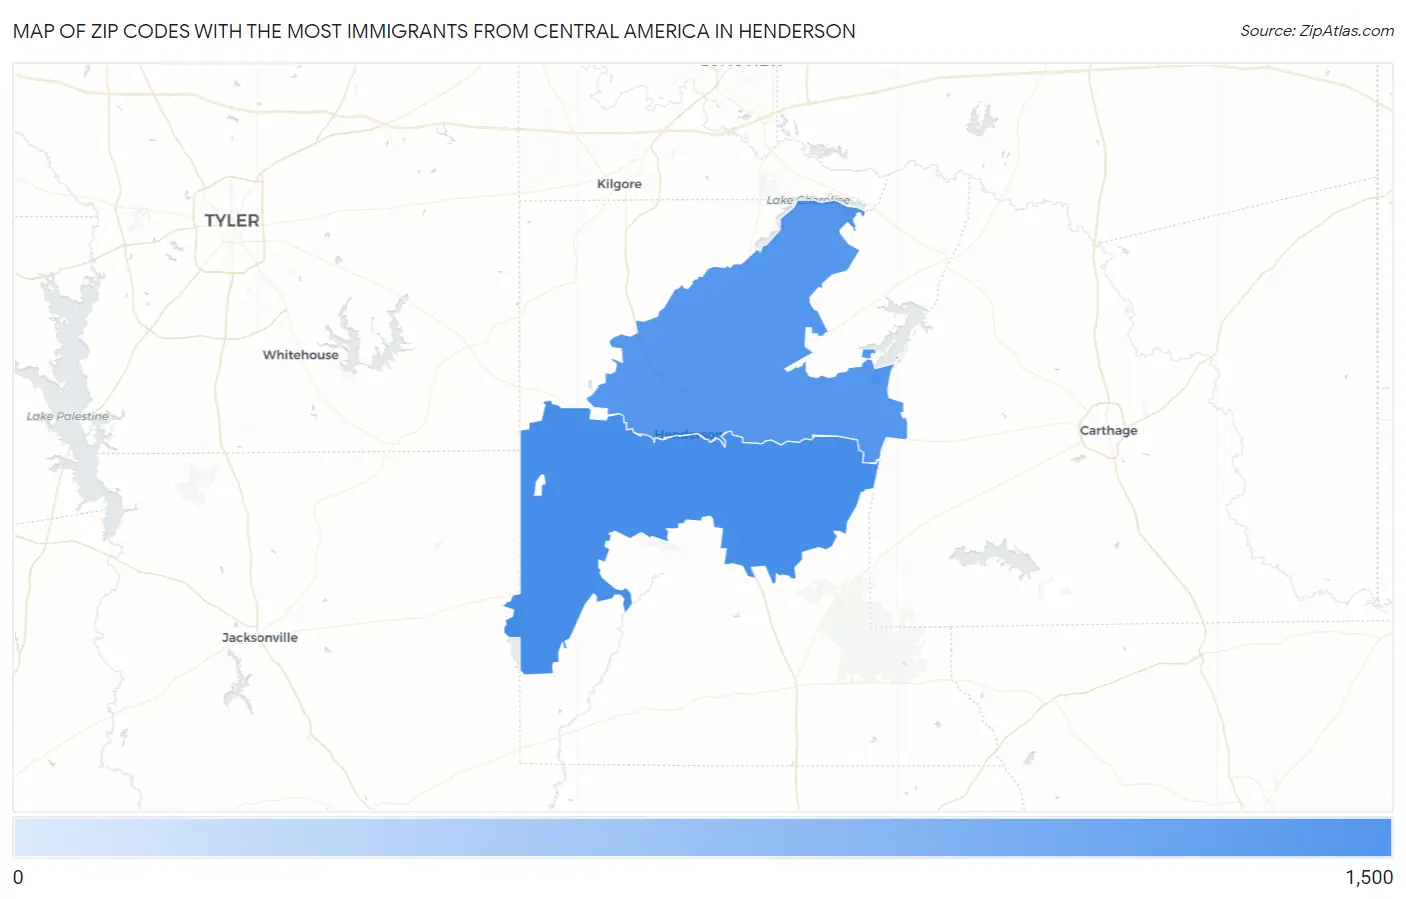
Map of Zip Codes with the Most Immigrants from Central America in Henderson
669
1,305
Zip Codes with the Most Immigrants from Central America in Henderson, TX
| Zip Code | Central America | vs State | vs National | |
| 1. | 75654 | 1,305 | 2,910,447(0.04%)#502 | 14,469,050(0.01%)#2,399 |
| 2. | 75652 | 669 | 2,910,447(0.02%)#711 | 14,469,050(0.00%)#3,835 |
1
Common Questions
What are the Top Zip Codes with the Most Immigrants from Central America in Henderson, TX?
Top Zip Codes with the Most Immigrants from Central America in Henderson, TX are:
What zip code has the Most Immigrants from Central America in Henderson, TX?
75654 has the Most Immigrants from Central America in Henderson, TX with 1,305.
What is the Total Immigrants from Central America in Henderson, TX?
Total Immigrants from Central America in Henderson is 944.
What is the Total Immigrants from Central America in Texas?
Total Immigrants from Central America in Texas is 2,910,447.
What is the Total Immigrants from Central America in the United States?
Total Immigrants from Central America in the United States is 14,469,050.