Zip Codes with the Highest Percentage of Population Employed in Installation, Maintenance & Repair in Henderson, TX
RELATED REPORTS & OPTIONS
Installation, Maintenance & Repair
Henderson
Compare Zip Codes
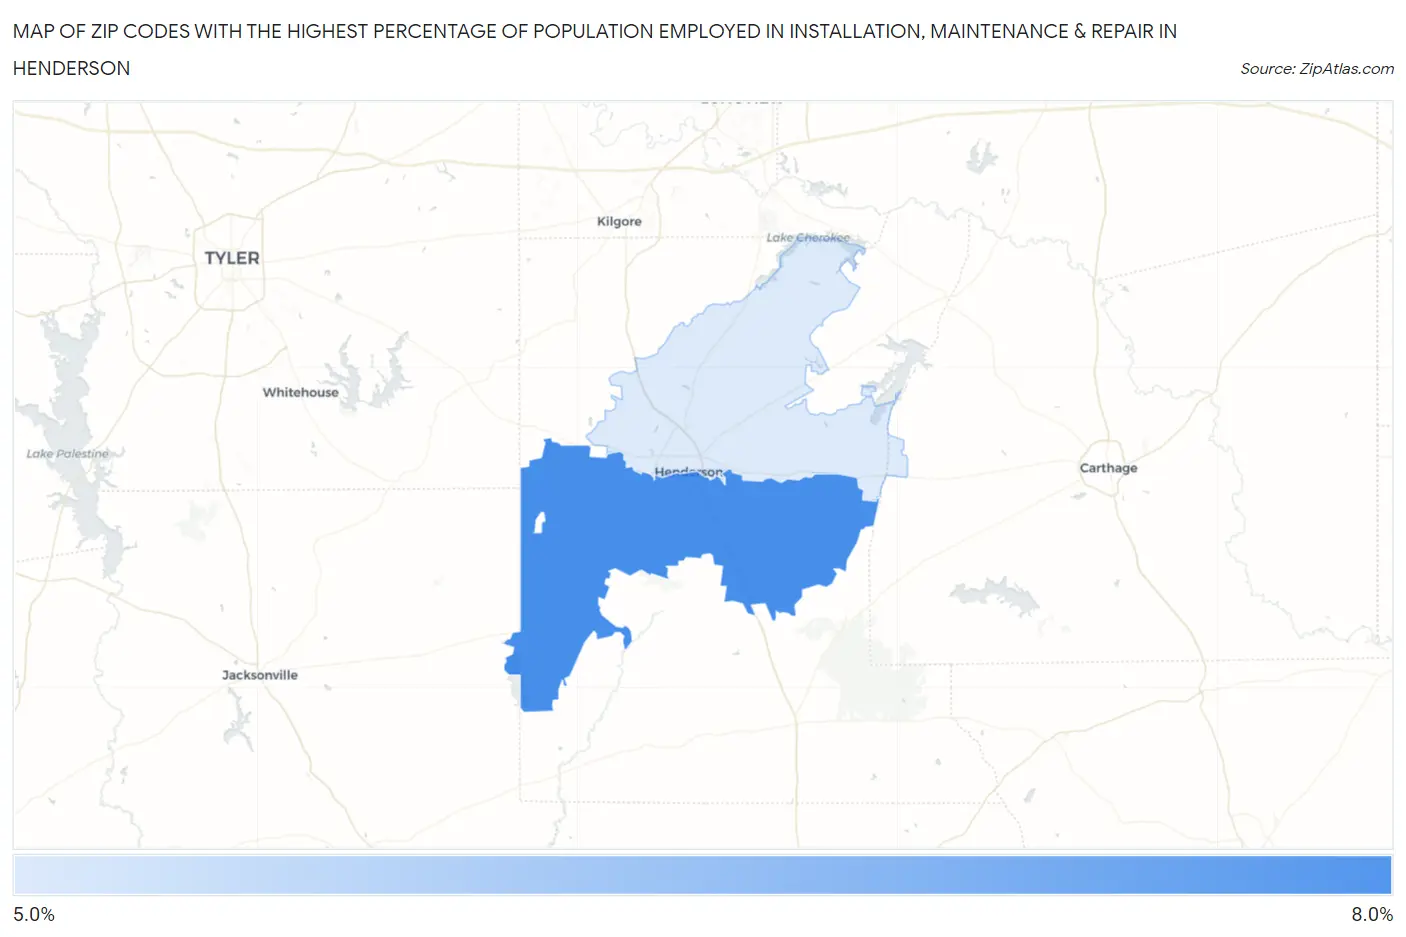
Map of Zip Codes with the Highest Percentage of Population Employed in Installation, Maintenance & Repair in Henderson
5.2%
6.3%
Zip Codes with the Highest Percentage of Population Employed in Installation, Maintenance & Repair in Henderson, TX
| Zip Code | % Employed | vs State | vs National | |
| 1. | 75654 | 6.3% | 3.4%(+2.85)#325 | 3.1%(+3.19)#5,629 |
| 2. | 75652 | 5.2% | 3.4%(+1.82)#477 | 3.1%(+2.16)#8,024 |
1
Common Questions
What are the Top Zip Codes with the Highest Percentage of Population Employed in Installation, Maintenance & Repair in Henderson, TX?
Top Zip Codes with the Highest Percentage of Population Employed in Installation, Maintenance & Repair in Henderson, TX are:
What zip code has the Highest Percentage of Population Employed in Installation, Maintenance & Repair in Henderson, TX?
75654 has the Highest Percentage of Population Employed in Installation, Maintenance & Repair in Henderson, TX with 6.3%.
What is the Percentage of Population Employed in Installation, Maintenance & Repair in Henderson, TX?
Percentage of Population Employed in Installation, Maintenance & Repair in Henderson is 6.5%.
What is the Percentage of Population Employed in Installation, Maintenance & Repair in Texas?
Percentage of Population Employed in Installation, Maintenance & Repair in Texas is 3.4%.
What is the Percentage of Population Employed in Installation, Maintenance & Repair in the United States?
Percentage of Population Employed in Installation, Maintenance & Repair in the United States is 3.1%.