Greenville, TX Map & Demographics
Greenville Map
Greenville Overview
$29,346
PER CAPITA INCOME
$65,048
AVG FAMILY INCOME
$60,510
AVG HOUSEHOLD INCOME
26.9%
WAGE / INCOME GAP [ % ]
73.1¢/ $1
WAGE / INCOME GAP [ $ ]
$8,290
FAMILY INCOME DEFICIT
0.42
INEQUALITY / GINI INDEX
28,923
TOTAL POPULATION
14,574
MALE POPULATION
14,349
FEMALE POPULATION
101.57
MALES / 100 FEMALES
98.46
FEMALES / 100 MALES
35.3
MEDIAN AGE
3.1
AVG FAMILY SIZE
2.5
AVG HOUSEHOLD SIZE
14,584
LABOR FORCE [ PEOPLE ]
64.5%
PERCENT IN LABOR FORCE
6.4%
UNEMPLOYMENT RATE
Greenville Area Codes
Income in Greenville
Income Overview in Greenville
Per Capita Income in Greenville is $29,346, while median incomes of families and households are $65,048 and $60,510 respectively.
| Characteristic | Number | Measure |
| Per Capita Income | 28,923 | $29,346 |
| Median Family Income | 6,961 | $65,048 |
| Mean Family Income | 6,961 | $83,212 |
| Median Household Income | 11,064 | $60,510 |
| Mean Household Income | 11,064 | $72,776 |
| Income Deficit | 6,961 | $8,290 |
| Wage / Income Gap (%) | 28,923 | 26.90% |
| Wage / Income Gap ($) | 28,923 | 73.10¢ per $1 |
| Gini / Inequality Index | 28,923 | 0.42 |
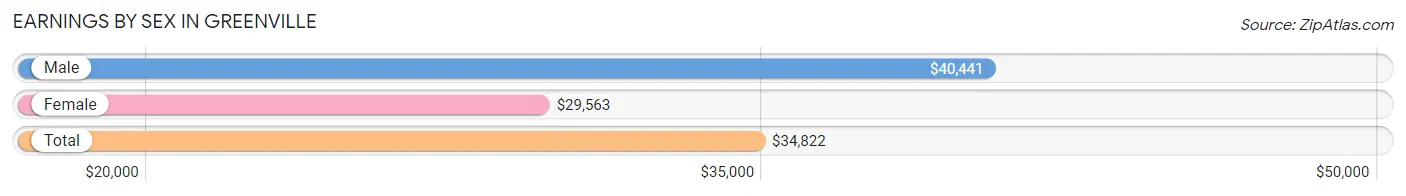
Earnings by Sex in Greenville
Average Earnings in Greenville are $34,822, $40,441 for men and $29,563 for women, a difference of 26.9%.
| Sex | Number | Average Earnings |
| Male | 8,429 (56.2%) | $40,441 |
| Female | 6,560 (43.8%) | $29,563 |
| Total | 14,989 (100.0%) | $34,822 |
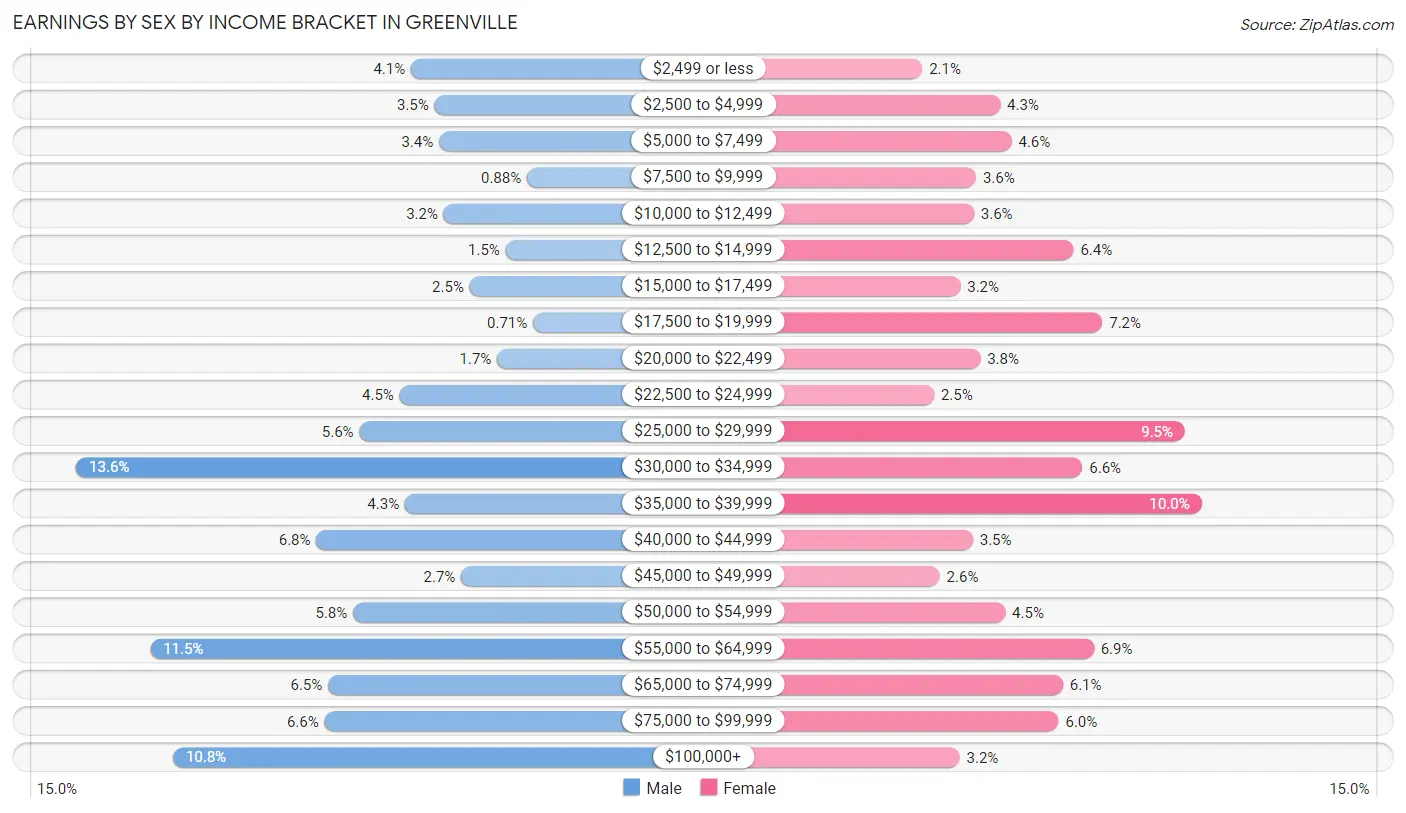
Earnings by Sex by Income Bracket in Greenville
The most common earnings brackets in Greenville are $30,000 to $34,999 for men (1,142 | 13.6%) and $35,000 to $39,999 for women (654 | 10.0%).
| Income | Male | Female |
| $2,499 or less | 349 (4.1%) | 139 (2.1%) |
| $2,500 to $4,999 | 293 (3.5%) | 283 (4.3%) |
| $5,000 to $7,499 | 282 (3.4%) | 304 (4.6%) |
| $7,500 to $9,999 | 74 (0.9%) | 238 (3.6%) |
| $10,000 to $12,499 | 271 (3.2%) | 234 (3.6%) |
| $12,500 to $14,999 | 125 (1.5%) | 418 (6.4%) |
| $15,000 to $17,499 | 210 (2.5%) | 209 (3.2%) |
| $17,500 to $19,999 | 60 (0.7%) | 471 (7.2%) |
| $20,000 to $22,499 | 145 (1.7%) | 246 (3.7%) |
| $22,500 to $24,999 | 376 (4.5%) | 161 (2.5%) |
| $25,000 to $29,999 | 471 (5.6%) | 623 (9.5%) |
| $30,000 to $34,999 | 1,142 (13.6%) | 434 (6.6%) |
| $35,000 to $39,999 | 363 (4.3%) | 654 (10.0%) |
| $40,000 to $44,999 | 573 (6.8%) | 232 (3.5%) |
| $45,000 to $49,999 | 230 (2.7%) | 171 (2.6%) |
| $50,000 to $54,999 | 486 (5.8%) | 292 (4.4%) |
| $55,000 to $64,999 | 967 (11.5%) | 455 (6.9%) |
| $65,000 to $74,999 | 545 (6.5%) | 398 (6.1%) |
| $75,000 to $99,999 | 554 (6.6%) | 390 (5.9%) |
| $100,000+ | 913 (10.8%) | 208 (3.2%) |
| Total | 8,429 (100.0%) | 6,560 (100.0%) |
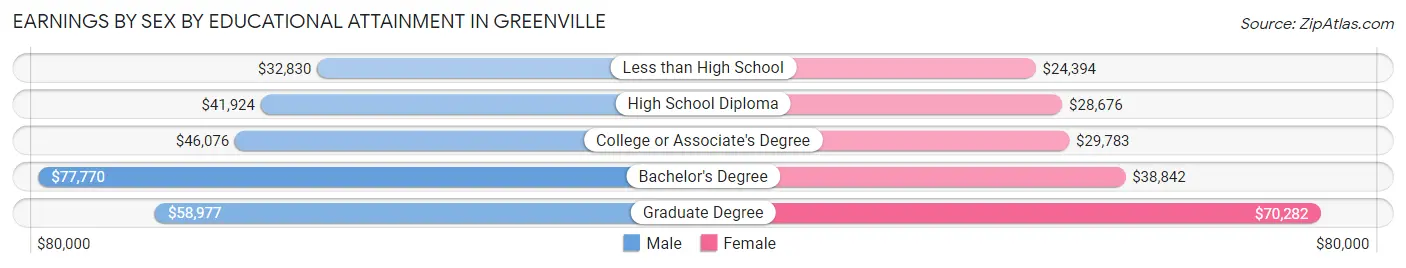
Earnings by Sex by Educational Attainment in Greenville
Average earnings in Greenville are $43,641 for men and $34,172 for women, a difference of 21.7%. Men with an educational attainment of bachelor's degree enjoy the highest average annual earnings of $77,770, while those with less than high school education earn the least with $32,830. Women with an educational attainment of graduate degree earn the most with the average annual earnings of $70,282, while those with less than high school education have the smallest earnings of $24,394.
| Educational Attainment | Male Income | Female Income |
| Less than High School | $32,830 | $24,394 |
| High School Diploma | $41,924 | $28,676 |
| College or Associate's Degree | $46,076 | $29,783 |
| Bachelor's Degree | $77,770 | $38,842 |
| Graduate Degree | $58,977 | $70,282 |
| Total | $43,641 | $34,172 |
Family Income in Greenville
Family Income Brackets in Greenville
According to the Greenville family income data, there are 1,845 families falling into the $50,000 to $74,999 income range, which is the most common income bracket and makes up 26.5% of all families. Conversely, the $10,000 to $14,999 income bracket is the least frequent group with only 84 families (1.2%) belonging to this category.
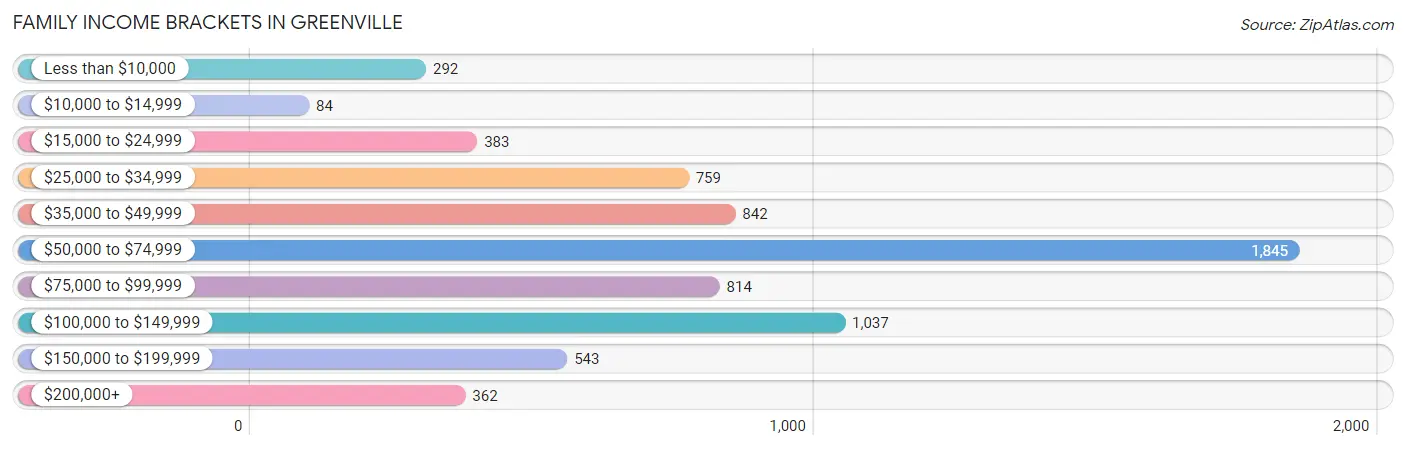
| Income Bracket | # Families | % Families |
| Less than $10,000 | 292 | 4.2% |
| $10,000 to $14,999 | 84 | 1.2% |
| $15,000 to $24,999 | 383 | 5.5% |
| $25,000 to $34,999 | 759 | 10.9% |
| $35,000 to $49,999 | 842 | 12.1% |
| $50,000 to $74,999 | 1,845 | 26.5% |
| $75,000 to $99,999 | 814 | 11.7% |
| $100,000 to $149,999 | 1,037 | 14.9% |
| $150,000 to $199,999 | 543 | 7.8% |
| $200,000+ | 362 | 5.2% |
Family Income by Famaliy Size in Greenville
5-person families (683 | 9.8%) account for the highest median family income in Greenville with $95,841 per family, while 2-person families (3,615 | 51.9%) have the highest median income of $29,890 per family member.
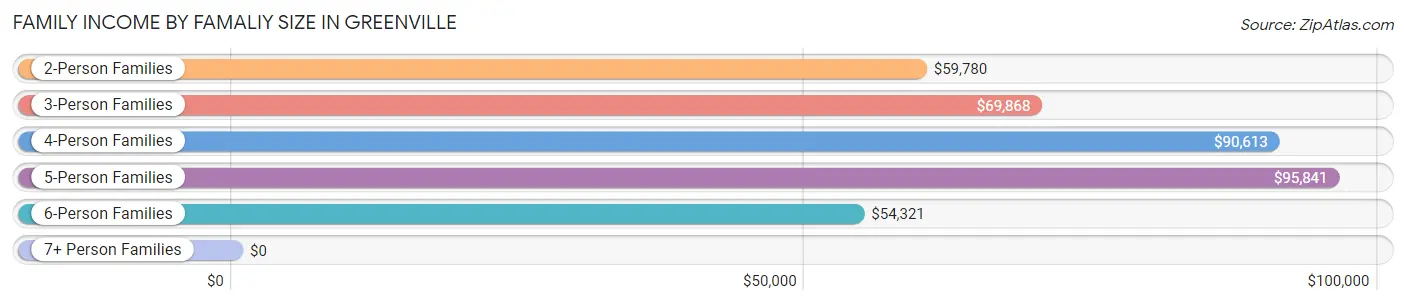
| Income Bracket | # Families | Median Income |
| 2-Person Families | 3,615 (51.9%) | $59,780 |
| 3-Person Families | 1,406 (20.2%) | $69,868 |
| 4-Person Families | 945 (13.6%) | $90,613 |
| 5-Person Families | 683 (9.8%) | $95,841 |
| 6-Person Families | 217 (3.1%) | $54,321 |
| 7+ Person Families | 95 (1.4%) | $0 |
| Total | 6,961 (100.0%) | $65,048 |
Family Income by Number of Earners in Greenville
The median family income in Greenville is $65,048, with families comprising 3+ earners (653) having the highest median family income of $139,375, while families with no earners (913) have the lowest median family income of $40,104, accounting for 9.4% and 13.1% of families, respectively.
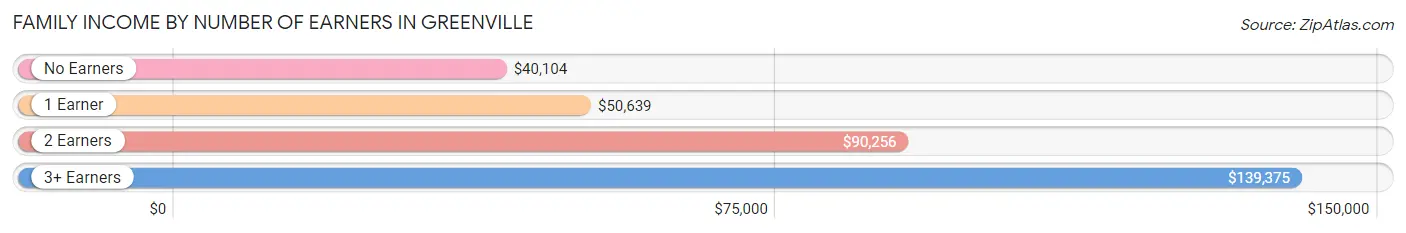
| Number of Earners | # Families | Median Income |
| No Earners | 913 (13.1%) | $40,104 |
| 1 Earner | 2,799 (40.2%) | $50,639 |
| 2 Earners | 2,596 (37.3%) | $90,256 |
| 3+ Earners | 653 (9.4%) | $139,375 |
| Total | 6,961 (100.0%) | $65,048 |
Household Income in Greenville
Household Income Brackets in Greenville
With 2,346 households falling in the category, the $50,000 to $74,999 income range is the most frequent in Greenville, accounting for 21.2% of all households. In contrast, only 365 households (3.3%) fall into the $10,000 to $14,999 income bracket, making it the least populous group.
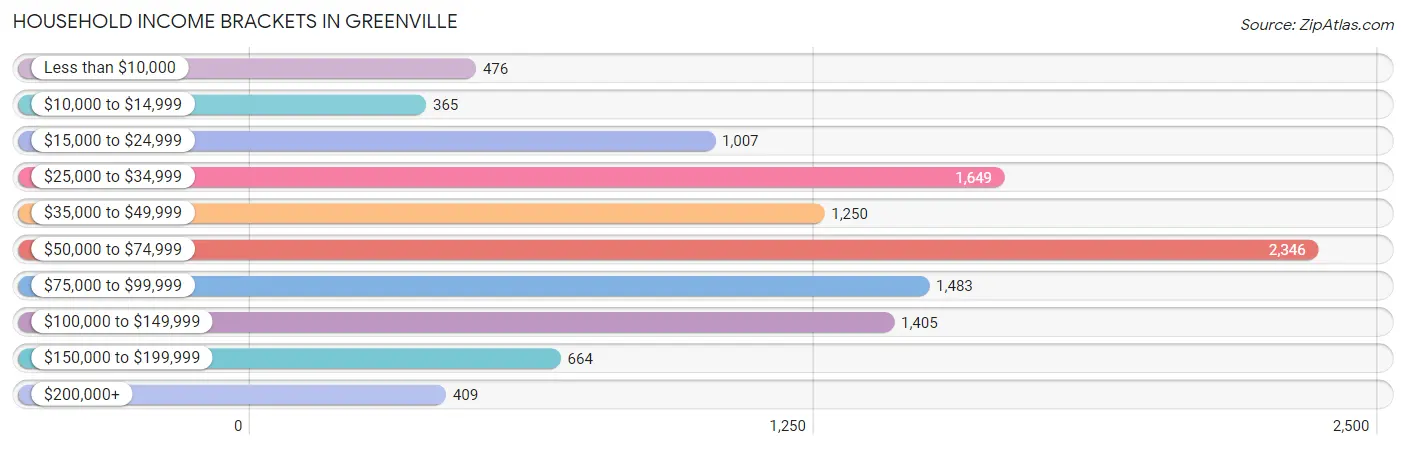
| Income Bracket | # Households | % Households |
| Less than $10,000 | 476 | 4.3% |
| $10,000 to $14,999 | 365 | 3.3% |
| $15,000 to $24,999 | 1,007 | 9.1% |
| $25,000 to $34,999 | 1,649 | 14.9% |
| $35,000 to $49,999 | 1,250 | 11.3% |
| $50,000 to $74,999 | 2,346 | 21.2% |
| $75,000 to $99,999 | 1,483 | 13.4% |
| $100,000 to $149,999 | 1,405 | 12.7% |
| $150,000 to $199,999 | 664 | 6.0% |
| $200,000+ | 409 | 3.7% |
Household Income by Householder Age in Greenville
The median household income in Greenville is $60,510, with the highest median household income of $71,492 found in the 25 to 44 years age bracket for the primary householder. A total of 4,051 households (36.6%) fall into this category. Meanwhile, the 65+ years age bracket for the primary householder has the lowest median household income of $37,052, with 2,985 households (27.0%) in this group.
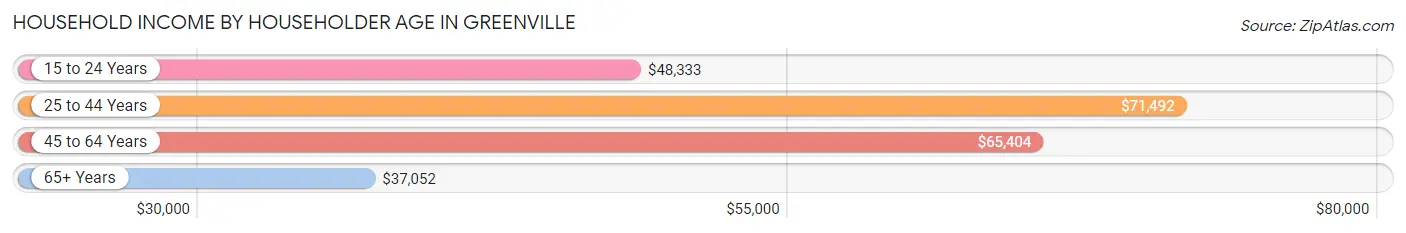
| Income Bracket | # Households | Median Income |
| 15 to 24 Years | 986 (8.9%) | $48,333 |
| 25 to 44 Years | 4,051 (36.6%) | $71,492 |
| 45 to 64 Years | 3,042 (27.5%) | $65,404 |
| 65+ Years | 2,985 (27.0%) | $37,052 |
| Total | 11,064 (100.0%) | $60,510 |
Poverty in Greenville
Income Below Poverty by Sex and Age in Greenville
With 12.1% poverty level for males and 14.3% for females among the residents of Greenville, 5 year old males and 15 year old females are the most vulnerable to poverty, with 80 males (30.9%) and 74 females (56.1%) in their respective age groups living below the poverty level.
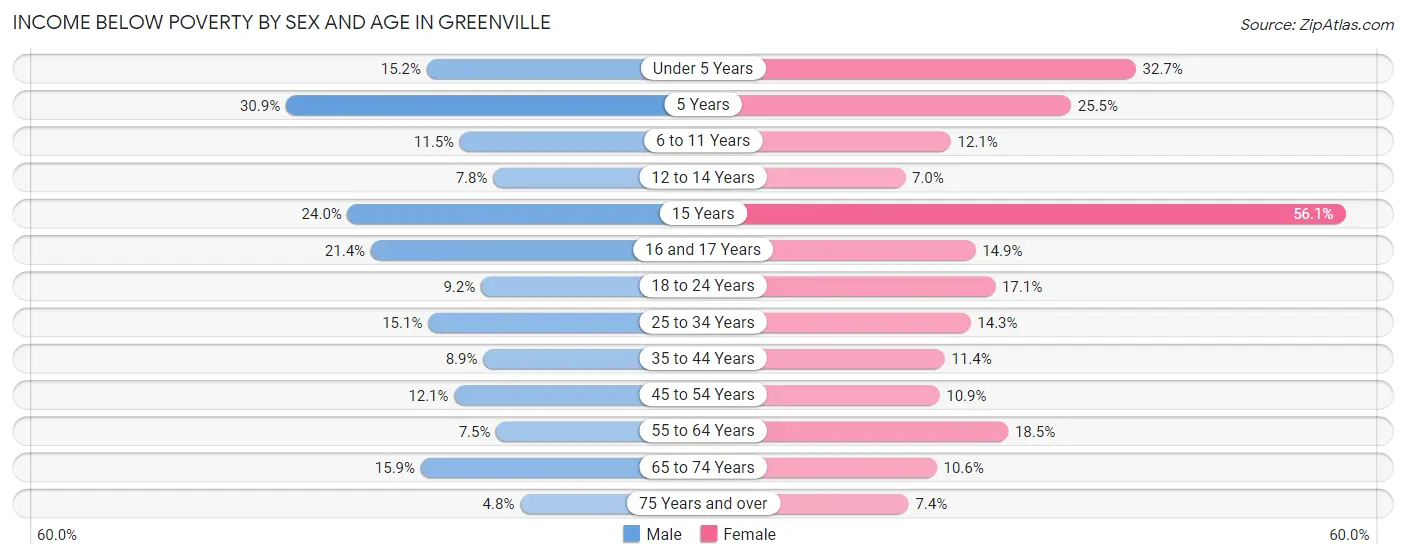
| Age Bracket | Male | Female |
| Under 5 Years | 130 (15.2%) | 233 (32.7%) |
| 5 Years | 80 (30.9%) | 62 (25.5%) |
| 6 to 11 Years | 180 (11.5%) | 112 (12.1%) |
| 12 to 14 Years | 49 (7.8%) | 50 (7.0%) |
| 15 Years | 61 (24.0%) | 74 (56.1%) |
| 16 and 17 Years | 42 (21.4%) | 55 (14.9%) |
| 18 to 24 Years | 115 (9.2%) | 193 (17.1%) |
| 25 to 34 Years | 402 (15.0%) | 332 (14.3%) |
| 35 to 44 Years | 161 (8.9%) | 185 (11.4%) |
| 45 to 54 Years | 183 (12.1%) | 175 (10.9%) |
| 55 to 64 Years | 98 (7.5%) | 308 (18.5%) |
| 65 to 74 Years | 170 (15.9%) | 148 (10.5%) |
| 75 Years and over | 35 (4.8%) | 94 (7.4%) |
| Total | 1,706 (12.1%) | 2,021 (14.3%) |
Income Above Poverty by Sex and Age in Greenville
According to the poverty statistics in Greenville, males aged 75 years and over and females aged 12 to 14 years are the age groups that are most secure financially, with 95.2% of males and 93.0% of females in these age groups living above the poverty line.
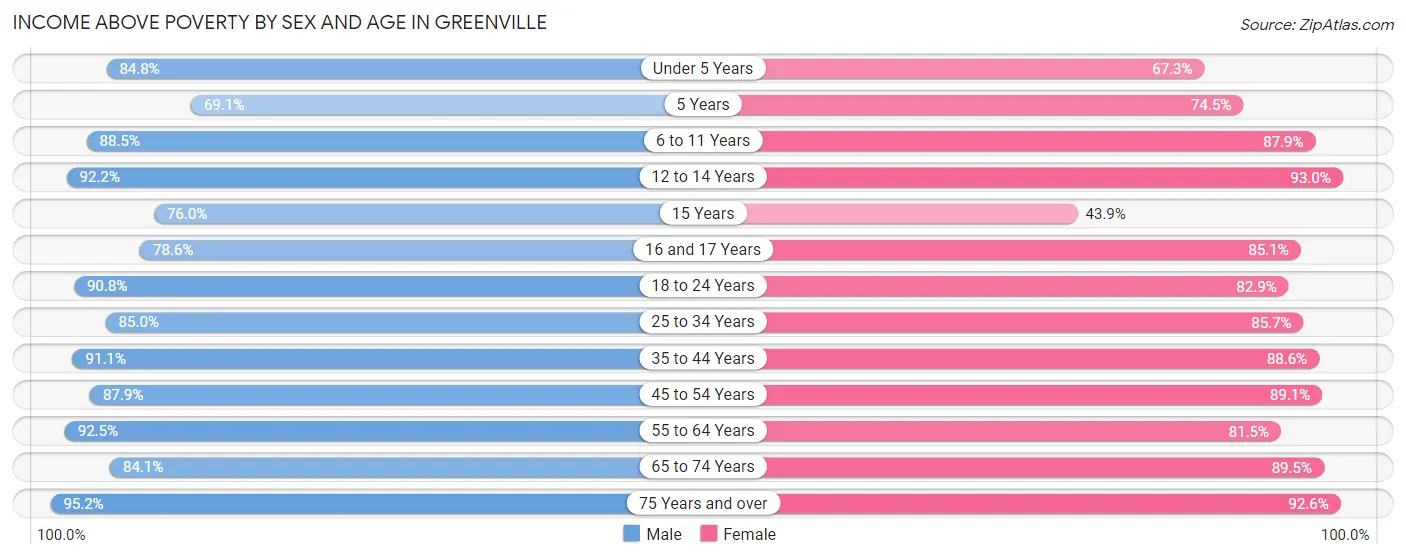
| Age Bracket | Male | Female |
| Under 5 Years | 725 (84.8%) | 479 (67.3%) |
| 5 Years | 179 (69.1%) | 181 (74.5%) |
| 6 to 11 Years | 1,383 (88.5%) | 812 (87.9%) |
| 12 to 14 Years | 579 (92.2%) | 660 (93.0%) |
| 15 Years | 193 (76.0%) | 58 (43.9%) |
| 16 and 17 Years | 154 (78.6%) | 315 (85.1%) |
| 18 to 24 Years | 1,139 (90.8%) | 938 (82.9%) |
| 25 to 34 Years | 2,269 (85.0%) | 1,986 (85.7%) |
| 35 to 44 Years | 1,643 (91.1%) | 1,432 (88.6%) |
| 45 to 54 Years | 1,324 (87.9%) | 1,437 (89.1%) |
| 55 to 64 Years | 1,214 (92.5%) | 1,356 (81.5%) |
| 65 to 74 Years | 901 (84.1%) | 1,255 (89.4%) |
| 75 Years and over | 694 (95.2%) | 1,171 (92.6%) |
| Total | 12,397 (87.9%) | 12,080 (85.7%) |
Income Below Poverty Among Married-Couple Families in Greenville
The poverty statistics for married-couple families in Greenville show that 6.3% or 275 of the total 4,343 families live below the poverty line. Families with 1 or 2 children have the highest poverty rate of 12.0%, comprising of 146 families. On the other hand, families with 5 or more children have the lowest poverty rate of 0.0%, which includes 0 families.
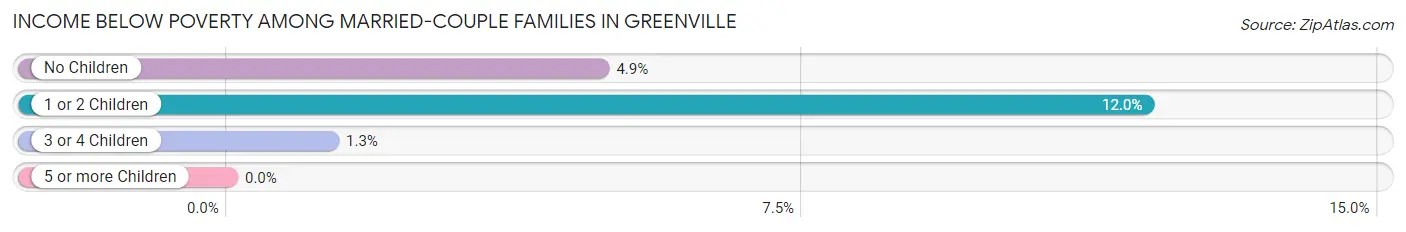
| Children | Above Poverty | Below Poverty |
| No Children | 2,391 (95.2%) | 122 (4.9%) |
| 1 or 2 Children | 1,075 (88.0%) | 146 (12.0%) |
| 3 or 4 Children | 525 (98.7%) | 7 (1.3%) |
| 5 or more Children | 77 (100.0%) | 0 (0.0%) |
| Total | 4,068 (93.7%) | 275 (6.3%) |
Income Below Poverty Among Single-Parent Households in Greenville
According to the poverty data in Greenville, 6.8% or 60 single-father households and 23.3% or 404 single-mother households are living below the poverty line. Among single-father households, those with 1 or 2 children have the highest poverty rate, with 52 households (10.8%) experiencing poverty. Likewise, among single-mother households, those with 5 or more children have the highest poverty rate, with 13 households (100.0%) falling below the poverty line.
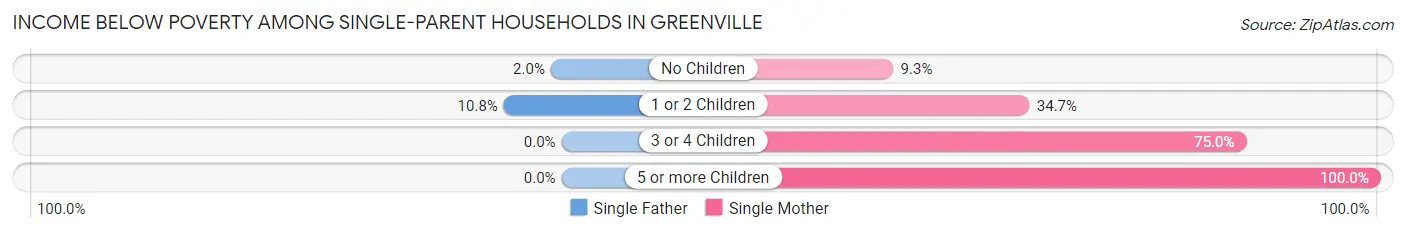
| Children | Single Father | Single Mother |
| No Children | 8 (2.0%) | 81 (9.3%) |
| 1 or 2 Children | 52 (10.8%) | 283 (34.7%) |
| 3 or 4 Children | 0 (0.0%) | 27 (75.0%) |
| 5 or more Children | 0 (0.0%) | 13 (100.0%) |
| Total | 60 (6.8%) | 404 (23.3%) |
Income Below Poverty Among Married-Couple vs Single-Parent Households in Greenville
The poverty data for Greenville shows that 275 of the married-couple family households (6.3%) and 464 of the single-parent households (17.7%) are living below the poverty level. Within the married-couple family households, those with 1 or 2 children have the highest poverty rate, with 146 households (12.0%) falling below the poverty line. Among the single-parent households, those with 5 or more children have the highest poverty rate, with 13 household (100.0%) living below poverty.
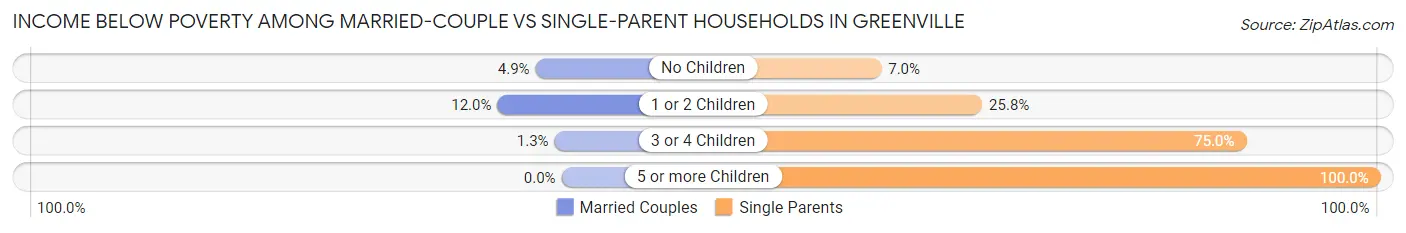
| Children | Married-Couple Families | Single-Parent Households |
| No Children | 122 (4.9%) | 89 (7.0%) |
| 1 or 2 Children | 146 (12.0%) | 335 (25.8%) |
| 3 or 4 Children | 7 (1.3%) | 27 (75.0%) |
| 5 or more Children | 0 (0.0%) | 13 (100.0%) |
| Total | 275 (6.3%) | 464 (17.7%) |
Race in Greenville
The most populous races in Greenville are White / Caucasian (19,417 | 67.1%), Hispanic or Latino (6,970 | 24.1%), and Black / African American (3,736 | 12.9%).
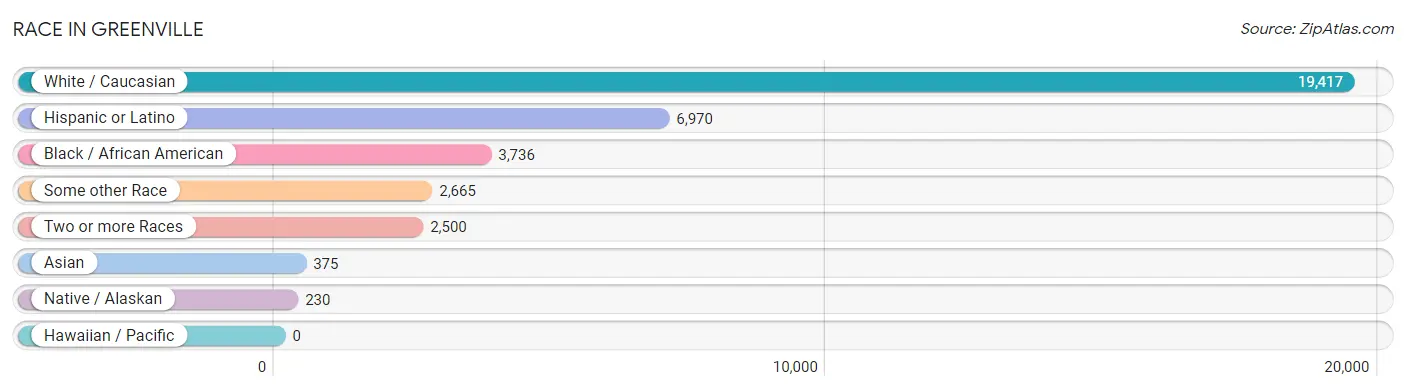
| Race | # Population | % Population |
| Asian | 375 | 1.3% |
| Black / African American | 3,736 | 12.9% |
| Hawaiian / Pacific | 0 | 0.0% |
| Hispanic or Latino | 6,970 | 24.1% |
| Native / Alaskan | 230 | 0.8% |
| White / Caucasian | 19,417 | 67.1% |
| Two or more Races | 2,500 | 8.6% |
| Some other Race | 2,665 | 9.2% |
| Total | 28,923 | 100.0% |
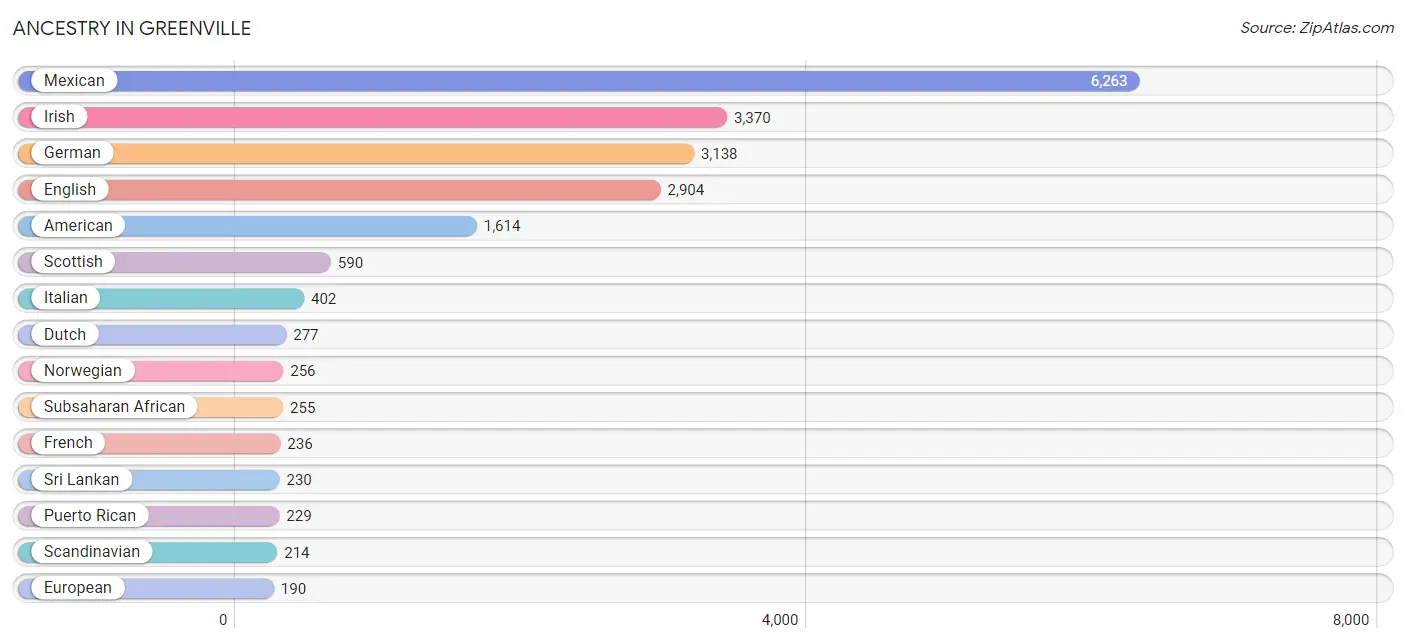
Ancestry in Greenville
The most populous ancestries reported in Greenville are Mexican (6,263 | 21.6%), Irish (3,370 | 11.7%), German (3,138 | 10.8%), English (2,904 | 10.0%), and American (1,614 | 5.6%), together accounting for 59.8% of all Greenville residents.
| Ancestry | # Population | % Population |
| African | 142 | 0.5% |
| American | 1,614 | 5.6% |
| Arab | 81 | 0.3% |
| Austrian | 32 | 0.1% |
| Basque | 23 | 0.1% |
| Belgian | 112 | 0.4% |
| Bhutanese | 14 | 0.1% |
| British | 169 | 0.6% |
| Cajun | 21 | 0.1% |
| Canadian | 4 | 0.0% |
| Central American | 157 | 0.5% |
| Cherokee | 187 | 0.6% |
| Choctaw | 30 | 0.1% |
| Colombian | 17 | 0.1% |
| Creek | 5 | 0.0% |
| Croatian | 15 | 0.1% |
| Czech | 37 | 0.1% |
| Danish | 6 | 0.0% |
| Dutch | 277 | 1.0% |
| Eastern European | 43 | 0.2% |
| Egyptian | 65 | 0.2% |
| English | 2,904 | 10.0% |
| Ethiopian | 113 | 0.4% |
| European | 190 | 0.7% |
| Filipino | 80 | 0.3% |
| French | 236 | 0.8% |
| French Canadian | 11 | 0.0% |
| German | 3,138 | 10.8% |
| Honduran | 9 | 0.0% |
| Hungarian | 3 | 0.0% |
| Indian (Asian) | 83 | 0.3% |
| Irish | 3,370 | 11.7% |
| Italian | 402 | 1.4% |
| Korean | 90 | 0.3% |
| Lithuanian | 11 | 0.0% |
| Mexican | 6,263 | 21.6% |
| Northern European | 33 | 0.1% |
| Norwegian | 256 | 0.9% |
| Pakistani | 59 | 0.2% |
| Polish | 140 | 0.5% |
| Portuguese | 95 | 0.3% |
| Puerto Rican | 229 | 0.8% |
| Russian | 70 | 0.2% |
| Salvadoran | 113 | 0.4% |
| Scandinavian | 214 | 0.7% |
| Scotch-Irish | 129 | 0.4% |
| Scottish | 590 | 2.0% |
| Seminole | 90 | 0.3% |
| Sioux | 22 | 0.1% |
| Slovak | 12 | 0.0% |
| South American | 122 | 0.4% |
| Spaniard | 97 | 0.3% |
| Spanish | 35 | 0.1% |
| Sri Lankan | 230 | 0.8% |
| Subsaharan African | 255 | 0.9% |
| Swedish | 32 | 0.1% |
| Uruguayan | 15 | 0.1% |
| Venezuelan | 90 | 0.3% |
| Welsh | 29 | 0.1% | View All 59 Rows |
Immigrants in Greenville
The most numerous immigrant groups reported in Greenville came from Latin America (2,111 | 7.3%), Central America (2,096 | 7.2%), Mexico (1,934 | 6.7%), Asia (331 | 1.1%), and South Eastern Asia (234 | 0.8%), together accounting for 23.2% of all Greenville residents.
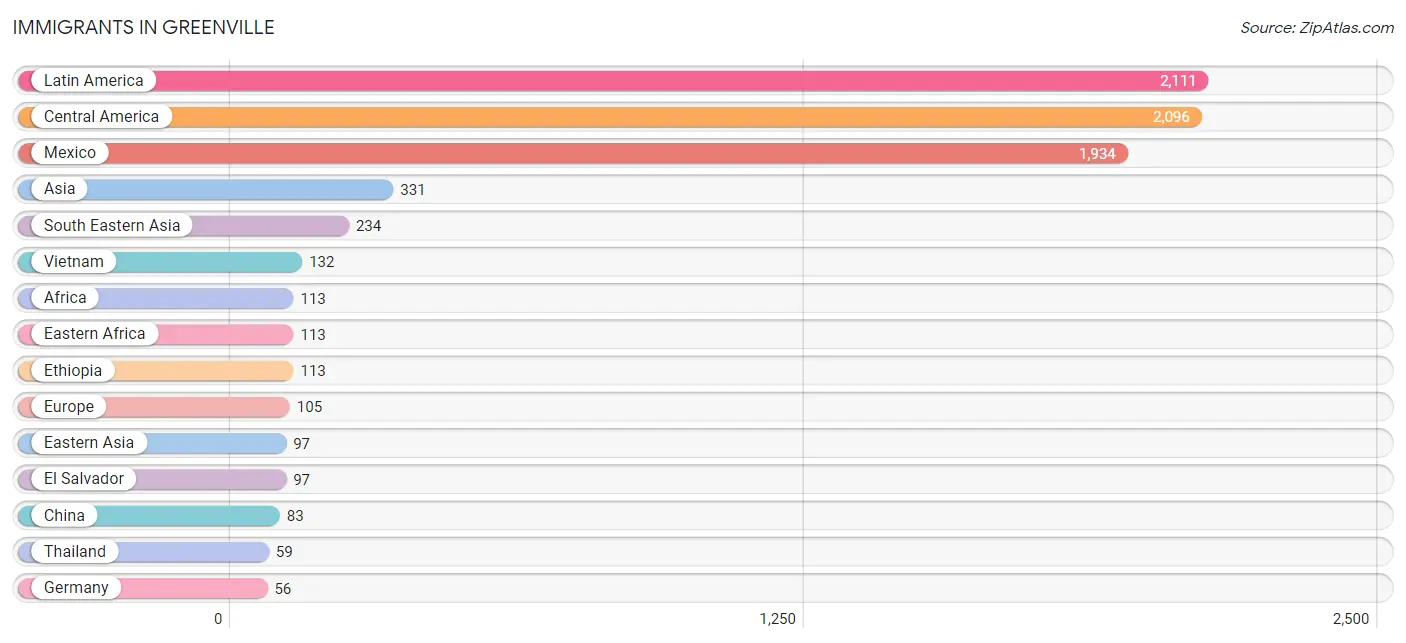
| Immigration Origin | # Population | % Population |
| Africa | 113 | 0.4% |
| Asia | 331 | 1.1% |
| Canada | 13 | 0.0% |
| Central America | 2,096 | 7.2% |
| China | 83 | 0.3% |
| Czechoslovakia | 19 | 0.1% |
| Eastern Africa | 113 | 0.4% |
| Eastern Asia | 97 | 0.3% |
| Eastern Europe | 19 | 0.1% |
| El Salvador | 97 | 0.3% |
| Ethiopia | 113 | 0.4% |
| Europe | 105 | 0.4% |
| Germany | 56 | 0.2% |
| Guatemala | 56 | 0.2% |
| Honduras | 9 | 0.0% |
| Japan | 14 | 0.1% |
| Latin America | 2,111 | 7.3% |
| Mexico | 1,934 | 6.7% |
| Philippines | 43 | 0.2% |
| Portugal | 30 | 0.1% |
| South America | 15 | 0.1% |
| South Eastern Asia | 234 | 0.8% |
| Southern Europe | 30 | 0.1% |
| Thailand | 59 | 0.2% |
| Uruguay | 15 | 0.1% |
| Vietnam | 132 | 0.5% |
| Western Europe | 56 | 0.2% | View All 27 Rows |
Sex and Age in Greenville
Sex and Age in Greenville
The most populous age groups in Greenville are 30 to 34 Years (1,568 | 10.8%) for men and 25 to 29 Years (1,258 | 8.8%) for women.
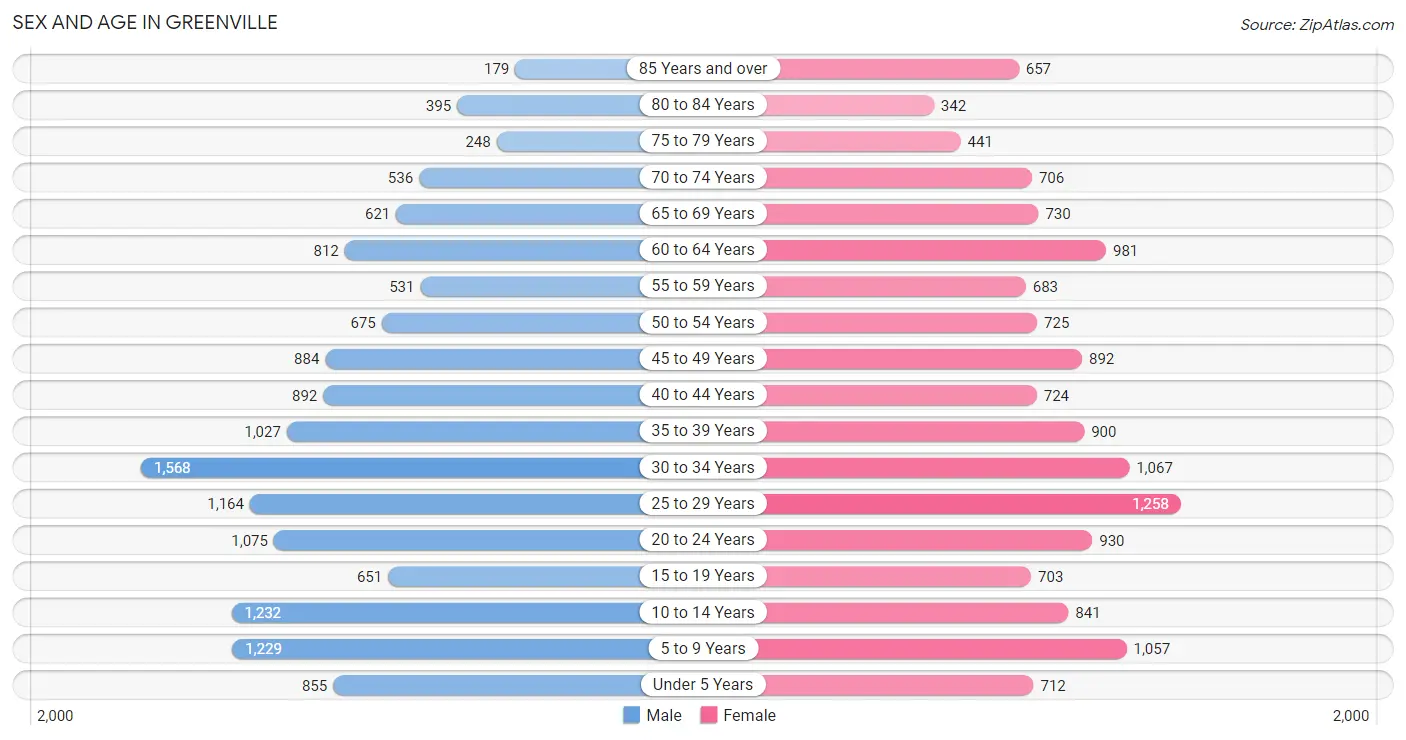
| Age Bracket | Male | Female |
| Under 5 Years | 855 (5.9%) | 712 (5.0%) |
| 5 to 9 Years | 1,229 (8.4%) | 1,057 (7.4%) |
| 10 to 14 Years | 1,232 (8.5%) | 841 (5.9%) |
| 15 to 19 Years | 651 (4.5%) | 703 (4.9%) |
| 20 to 24 Years | 1,075 (7.4%) | 930 (6.5%) |
| 25 to 29 Years | 1,164 (8.0%) | 1,258 (8.8%) |
| 30 to 34 Years | 1,568 (10.8%) | 1,067 (7.4%) |
| 35 to 39 Years | 1,027 (7.0%) | 900 (6.3%) |
| 40 to 44 Years | 892 (6.1%) | 724 (5.1%) |
| 45 to 49 Years | 884 (6.1%) | 892 (6.2%) |
| 50 to 54 Years | 675 (4.6%) | 725 (5.1%) |
| 55 to 59 Years | 531 (3.6%) | 683 (4.8%) |
| 60 to 64 Years | 812 (5.6%) | 981 (6.8%) |
| 65 to 69 Years | 621 (4.3%) | 730 (5.1%) |
| 70 to 74 Years | 536 (3.7%) | 706 (4.9%) |
| 75 to 79 Years | 248 (1.7%) | 441 (3.1%) |
| 80 to 84 Years | 395 (2.7%) | 342 (2.4%) |
| 85 Years and over | 179 (1.2%) | 657 (4.6%) |
| Total | 14,574 (100.0%) | 14,349 (100.0%) |
Families and Households in Greenville
Median Family Size in Greenville
The median family size in Greenville is 3.15 persons per family, with married-couple families (4,343 | 62.4%) accounting for the largest median family size of 3.31 persons per family. On the other hand, single male/father families (883 | 12.7%) represent the smallest median family size with 2.75 persons per family.
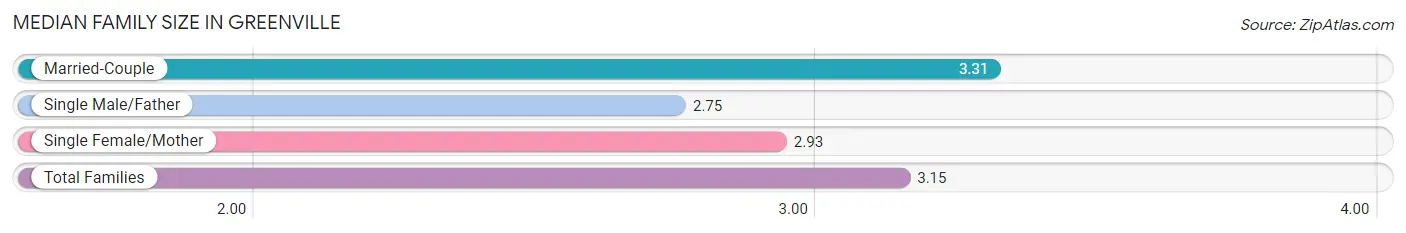
| Family Type | # Families | Family Size |
| Married-Couple | 4,343 (62.4%) | 3.31 |
| Single Male/Father | 883 (12.7%) | 2.75 |
| Single Female/Mother | 1,735 (24.9%) | 2.93 |
| Total Families | 6,961 (100.0%) | 3.15 |
Median Household Size in Greenville
The median household size in Greenville is 2.54 persons per household, with married-couple households (4,343 | 39.3%) accounting for the largest median household size of 3.4 persons per household. non-family households (4,103 | 37.1%) represent the smallest median household size with 1.23 persons per household.
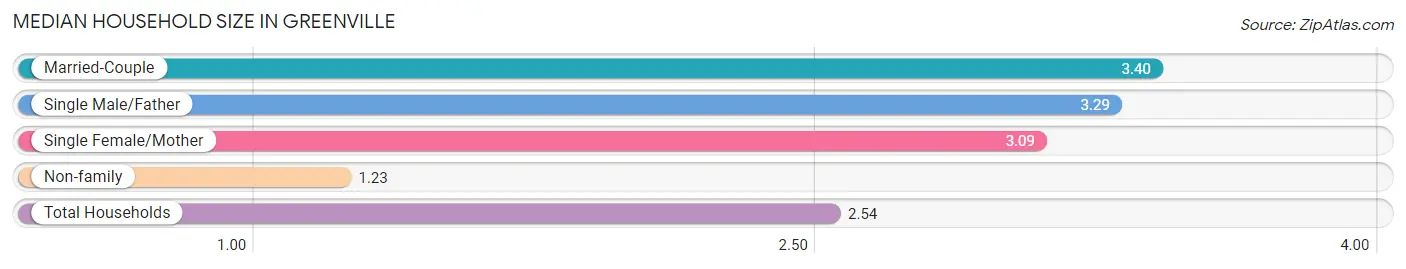
| Household Type | # Households | Household Size |
| Married-Couple | 4,343 (39.3%) | 3.40 |
| Single Male/Father | 883 (8.0%) | 3.29 |
| Single Female/Mother | 1,735 (15.7%) | 3.09 |
| Non-family | 4,103 (37.1%) | 1.23 |
| Total Households | 11,064 (100.0%) | 2.54 |
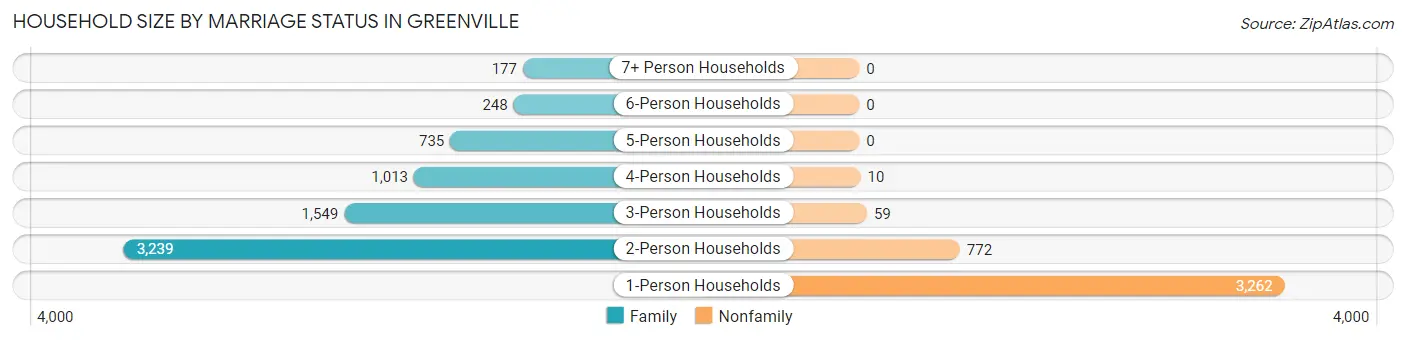
Household Size by Marriage Status in Greenville
Out of a total of 11,064 households in Greenville, 6,961 (62.9%) are family households, while 4,103 (37.1%) are nonfamily households. The most numerous type of family households are 2-person households, comprising 3,239, and the most common type of nonfamily households are 1-person households, comprising 3,262.
| Household Size | Family Households | Nonfamily Households |
| 1-Person Households | - | 3,262 (29.5%) |
| 2-Person Households | 3,239 (29.3%) | 772 (7.0%) |
| 3-Person Households | 1,549 (14.0%) | 59 (0.5%) |
| 4-Person Households | 1,013 (9.2%) | 10 (0.1%) |
| 5-Person Households | 735 (6.6%) | 0 (0.0%) |
| 6-Person Households | 248 (2.2%) | 0 (0.0%) |
| 7+ Person Households | 177 (1.6%) | 0 (0.0%) |
| Total | 6,961 (62.9%) | 4,103 (37.1%) |
Female Fertility in Greenville
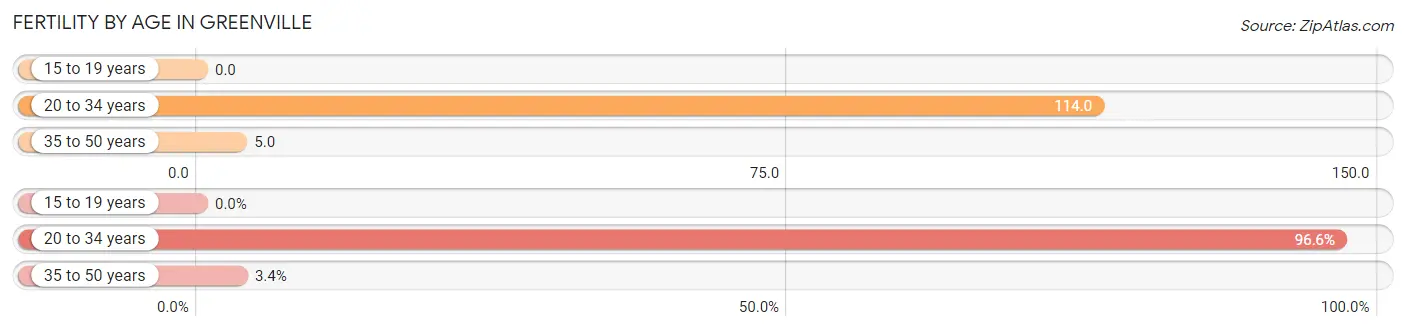
Fertility by Age in Greenville
Average fertility rate in Greenville is 58.0 births per 1,000 women. Women in the age bracket of 20 to 34 years have the highest fertility rate with 114.0 births per 1,000 women. Women in the age bracket of 20 to 34 years acount for 96.6% of all women with births.
| Age Bracket | Women with Births | Births / 1,000 Women |
| 15 to 19 years | 0 (0.0%) | 0.0 |
| 20 to 34 years | 371 (96.6%) | 114.0 |
| 35 to 50 years | 13 (3.4%) | 5.0 |
| Total | 384 (100.0%) | 58.0 |
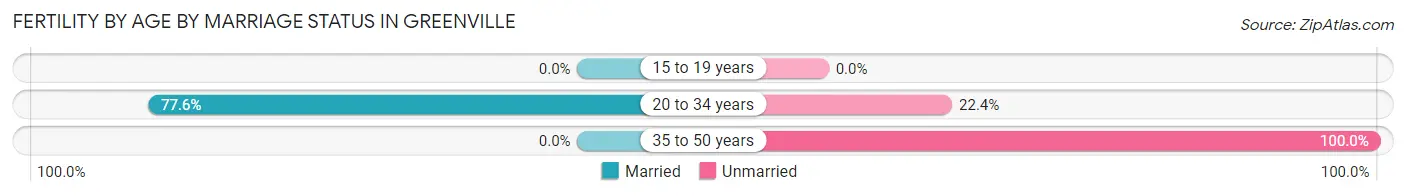
Fertility by Age by Marriage Status in Greenville
75.0% of women with births (384) in Greenville are married. The highest percentage of unmarried women with births falls into 35 to 50 years age bracket with 100.0% of them unmarried at the time of birth, while the lowest percentage of unmarried women with births belong to 20 to 34 years age bracket with 22.4% of them unmarried.
| Age Bracket | Married | Unmarried |
| 15 to 19 years | 0 (0.0%) | 0 (0.0%) |
| 20 to 34 years | 288 (77.6%) | 83 (22.4%) |
| 35 to 50 years | 0 (0.0%) | 13 (100.0%) |
| Total | 288 (75.0%) | 96 (25.0%) |
Fertility by Education in Greenville
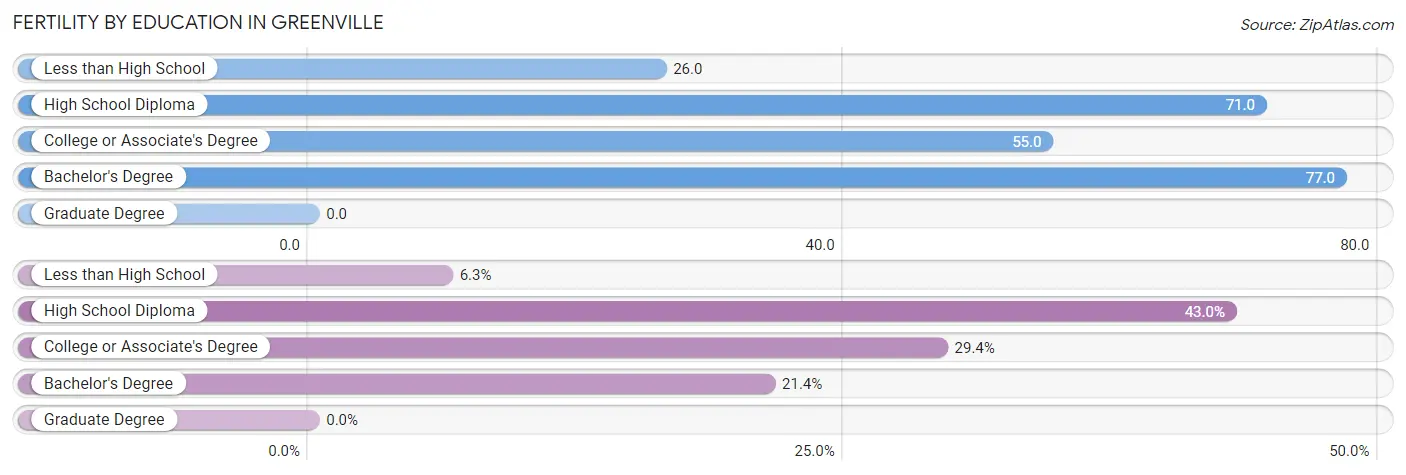
| Educational Attainment | Women with Births | Births / 1,000 Women |
| Less than High School | 24 (6.2%) | 26.0 |
| High School Diploma | 165 (43.0%) | 71.0 |
| College or Associate's Degree | 113 (29.4%) | 55.0 |
| Bachelor's Degree | 82 (21.3%) | 77.0 |
| Graduate Degree | 0 (0.0%) | 0.0 |
| Total | 384 (100.0%) | 58.0 |
Fertility by Education by Marriage Status in Greenville
25.0% of women with births in Greenville are unmarried. Women with the educational attainment of less than high school are most likely to be married with 100.0% of them married at childbirth, while women with the educational attainment of high school diploma are least likely to be married with 27.9% of them unmarried at childbirth.
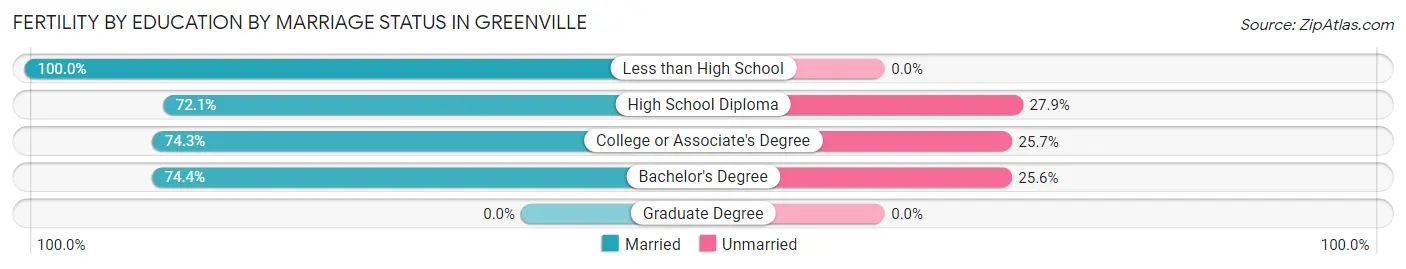
| Educational Attainment | Married | Unmarried |
| Less than High School | 24 (100.0%) | 0 (0.0%) |
| High School Diploma | 119 (72.1%) | 46 (27.9%) |
| College or Associate's Degree | 84 (74.3%) | 29 (25.7%) |
| Bachelor's Degree | 61 (74.4%) | 21 (25.6%) |
| Graduate Degree | 0 (0.0%) | 0 (0.0%) |
| Total | 288 (75.0%) | 96 (25.0%) |
Employment Characteristics in Greenville
Employment by Class of Employer in Greenville
Among the 13,224 employed individuals in Greenville, private company employees (10,045 | 76.0%), state government employees (719 | 5.4%), and local government employees (666 | 5.0%) make up the most common classes of employment.
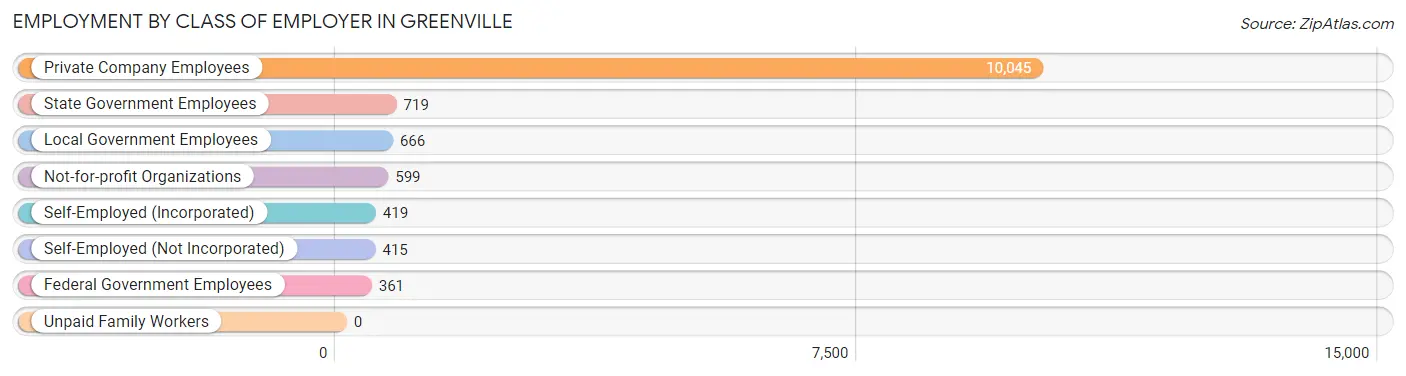
| Employer Class | # Employees | % Employees |
| Private Company Employees | 10,045 | 76.0% |
| Self-Employed (Incorporated) | 419 | 3.2% |
| Self-Employed (Not Incorporated) | 415 | 3.1% |
| Not-for-profit Organizations | 599 | 4.5% |
| Local Government Employees | 666 | 5.0% |
| State Government Employees | 719 | 5.4% |
| Federal Government Employees | 361 | 2.7% |
| Unpaid Family Workers | 0 | 0.0% |
| Total | 13,224 | 100.0% |
Employment Status by Age in Greenville
According to the labor force statistics for Greenville, out of the total population over 16 years of age (22,611), 64.5% or 14,584 individuals are in the labor force, with 6.4% or 933 of them unemployed. The age group with the highest labor force participation rate is 20 to 24 years, with 88.1% or 1,766 individuals in the labor force. Within the labor force, the 16 to 19 years age range has the highest percentage of unemployed individuals, with 29.3% or 149 of them being unemployed.
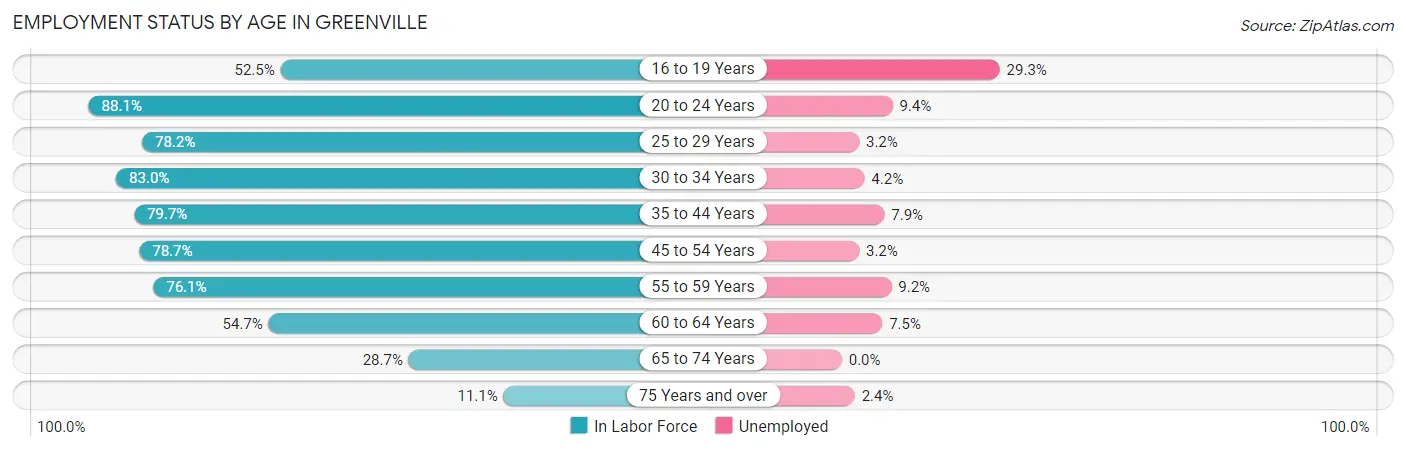
| Age Bracket | In Labor Force | Unemployed |
| 16 to 19 Years | 508 (52.5%) | 149 (29.3%) |
| 20 to 24 Years | 1,766 (88.1%) | 166 (9.4%) |
| 25 to 29 Years | 1,894 (78.2%) | 61 (3.2%) |
| 30 to 34 Years | 2,187 (83.0%) | 92 (4.2%) |
| 35 to 44 Years | 2,824 (79.7%) | 223 (7.9%) |
| 45 to 54 Years | 2,500 (78.7%) | 80 (3.2%) |
| 55 to 59 Years | 924 (76.1%) | 85 (9.2%) |
| 60 to 64 Years | 981 (54.7%) | 74 (7.5%) |
| 65 to 74 Years | 744 (28.7%) | 0 (0.0%) |
| 75 Years and over | 251 (11.1%) | 6 (2.4%) |
| Total | 14,584 (64.5%) | 933 (6.4%) |
Employment Status by Educational Attainment in Greenville
According to labor force statistics for Greenville, 76.5% of individuals (11,309) out of the total population between 25 and 64 years of age (14,783) are in the labor force, with 5.4% or 611 of them being unemployed. The group with the highest labor force participation rate are those with the educational attainment of bachelor's degree or higher, with 85.9% or 2,383 individuals in the labor force. Within the labor force, individuals with high school diploma education have the highest percentage of unemployment, with 10.1% or 428 of them being unemployed.
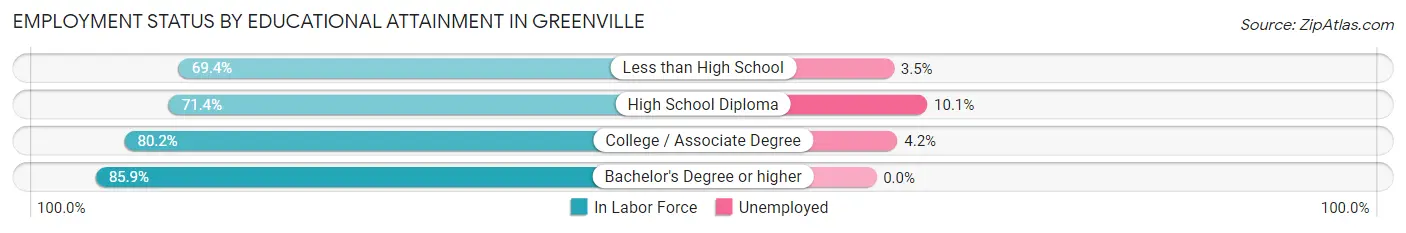
| Educational Attainment | In Labor Force | Unemployed |
| Less than High School | 1,169 (69.4%) | 59 (3.5%) |
| High School Diploma | 4,237 (71.4%) | 599 (10.1%) |
| College / Associate Degree | 3,521 (80.2%) | 184 (4.2%) |
| Bachelor's Degree or higher | 2,383 (85.9%) | 0 (0.0%) |
| Total | 11,309 (76.5%) | 798 (5.4%) |
Employment Occupations by Sex in Greenville
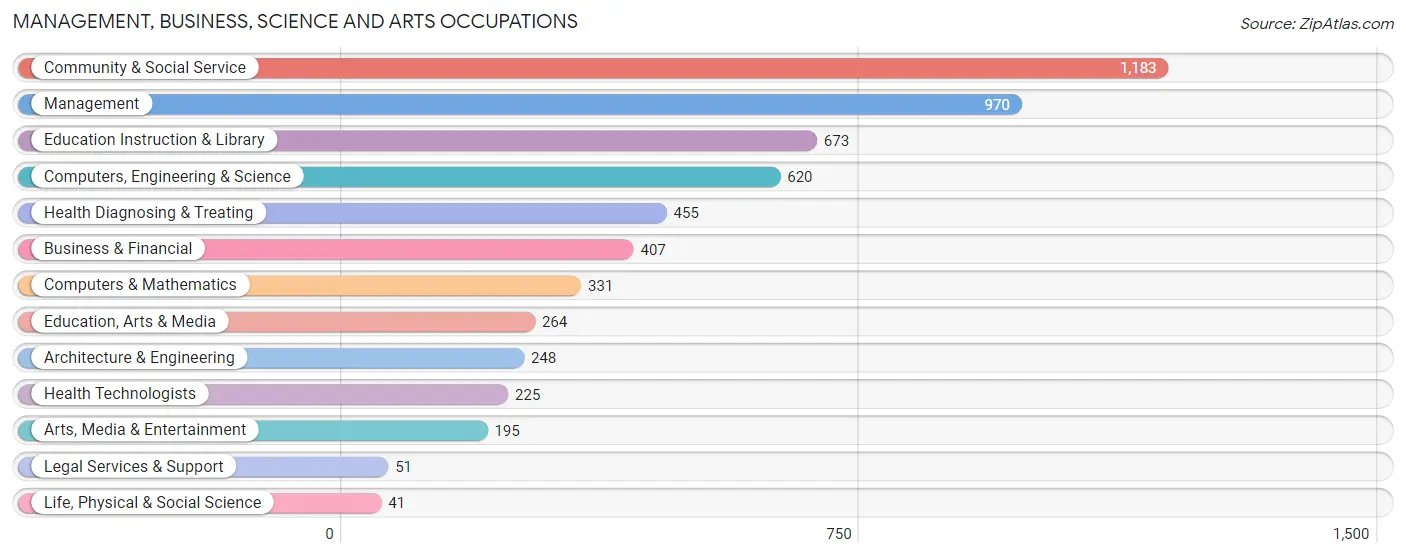
Management, Business, Science and Arts Occupations
The most common Management, Business, Science and Arts occupations in Greenville are Community & Social Service (1,183 | 8.7%), Management (970 | 7.1%), Education Instruction & Library (673 | 4.9%), Computers, Engineering & Science (620 | 4.5%), and Health Diagnosing & Treating (455 | 3.3%).
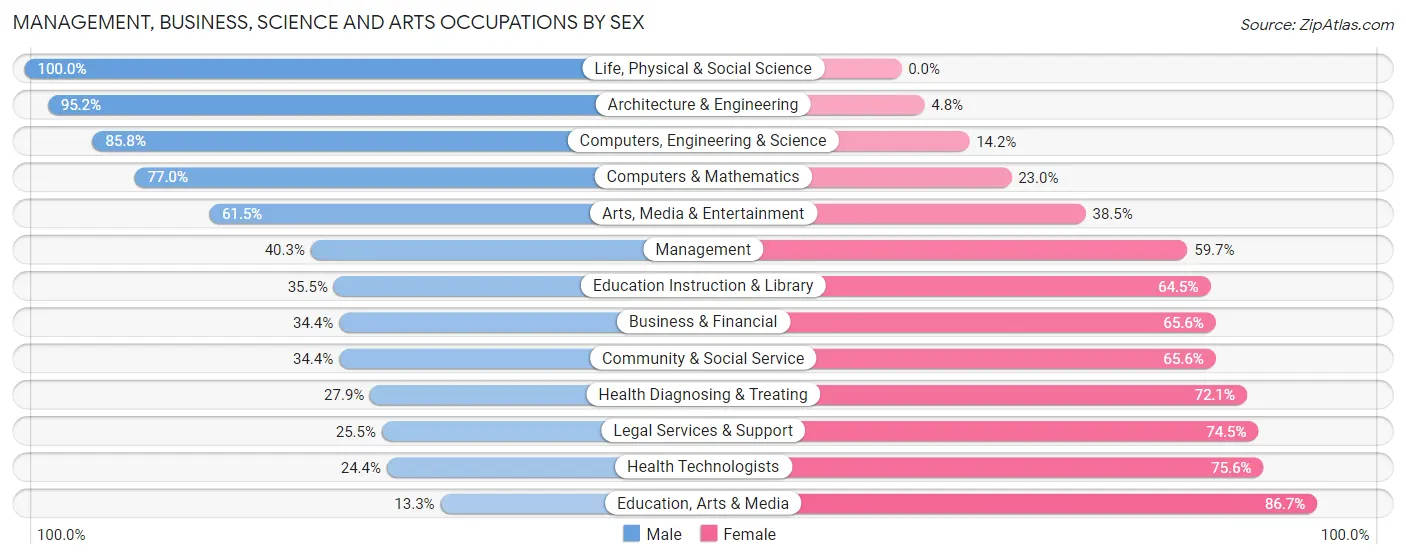
Management, Business, Science and Arts Occupations by Sex
Within the Management, Business, Science and Arts occupations in Greenville, the most male-oriented occupations are Life, Physical & Social Science (100.0%), Architecture & Engineering (95.2%), and Computers, Engineering & Science (85.8%), while the most female-oriented occupations are Education, Arts & Media (86.7%), Health Technologists (75.6%), and Legal Services & Support (74.5%).
| Occupation | Male | Female |
| Management | 391 (40.3%) | 579 (59.7%) |
| Business & Financial | 140 (34.4%) | 267 (65.6%) |
| Computers, Engineering & Science | 532 (85.8%) | 88 (14.2%) |
| Computers & Mathematics | 255 (77.0%) | 76 (23.0%) |
| Architecture & Engineering | 236 (95.2%) | 12 (4.8%) |
| Life, Physical & Social Science | 41 (100.0%) | 0 (0.0%) |
| Community & Social Service | 407 (34.4%) | 776 (65.6%) |
| Education, Arts & Media | 35 (13.3%) | 229 (86.7%) |
| Legal Services & Support | 13 (25.5%) | 38 (74.5%) |
| Education Instruction & Library | 239 (35.5%) | 434 (64.5%) |
| Arts, Media & Entertainment | 120 (61.5%) | 75 (38.5%) |
| Health Diagnosing & Treating | 127 (27.9%) | 328 (72.1%) |
| Health Technologists | 55 (24.4%) | 170 (75.6%) |
| Total (Category) | 1,597 (43.9%) | 2,038 (56.1%) |
| Total (Overall) | 7,695 (56.5%) | 5,929 (43.5%) |
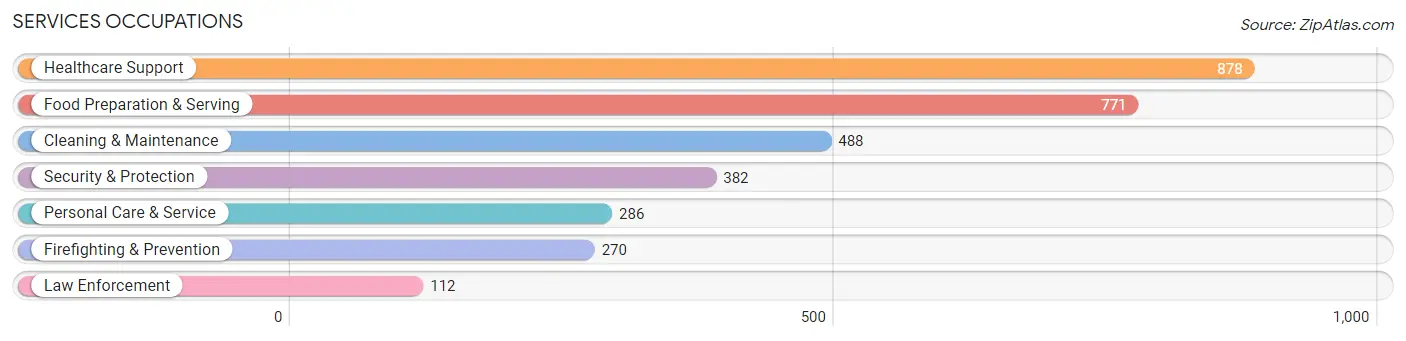
Services Occupations
The most common Services occupations in Greenville are Healthcare Support (878 | 6.4%), Food Preparation & Serving (771 | 5.7%), Cleaning & Maintenance (488 | 3.6%), Security & Protection (382 | 2.8%), and Personal Care & Service (286 | 2.1%).
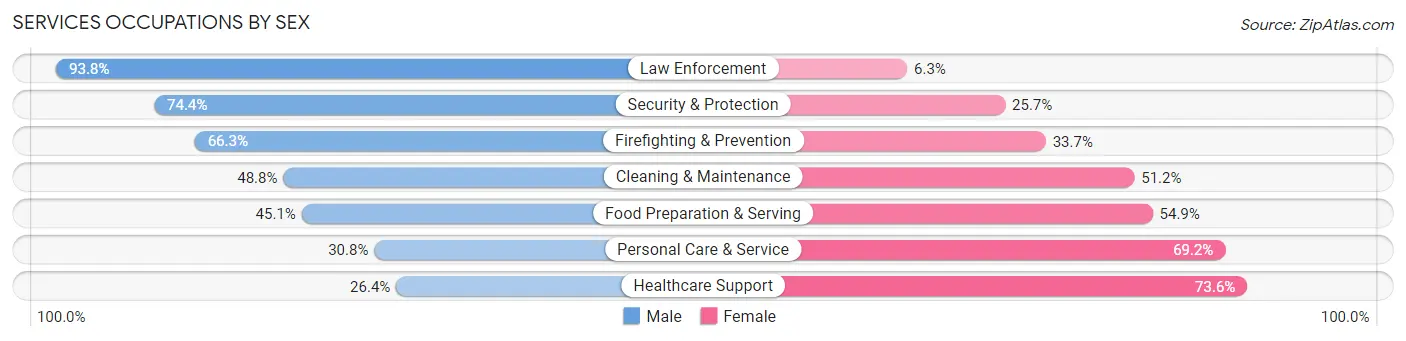
Services Occupations by Sex
Within the Services occupations in Greenville, the most male-oriented occupations are Law Enforcement (93.8%), Security & Protection (74.4%), and Firefighting & Prevention (66.3%), while the most female-oriented occupations are Healthcare Support (73.6%), Personal Care & Service (69.2%), and Food Preparation & Serving (54.9%).
| Occupation | Male | Female |
| Healthcare Support | 232 (26.4%) | 646 (73.6%) |
| Security & Protection | 284 (74.4%) | 98 (25.7%) |
| Firefighting & Prevention | 179 (66.3%) | 91 (33.7%) |
| Law Enforcement | 105 (93.8%) | 7 (6.2%) |
| Food Preparation & Serving | 348 (45.1%) | 423 (54.9%) |
| Cleaning & Maintenance | 238 (48.8%) | 250 (51.2%) |
| Personal Care & Service | 88 (30.8%) | 198 (69.2%) |
| Total (Category) | 1,190 (42.4%) | 1,615 (57.6%) |
| Total (Overall) | 7,695 (56.5%) | 5,929 (43.5%) |
Sales and Office Occupations
The most common Sales and Office occupations in Greenville are Office & Administration (1,702 | 12.5%), and Sales & Related (1,071 | 7.9%).

Sales and Office Occupations by Sex
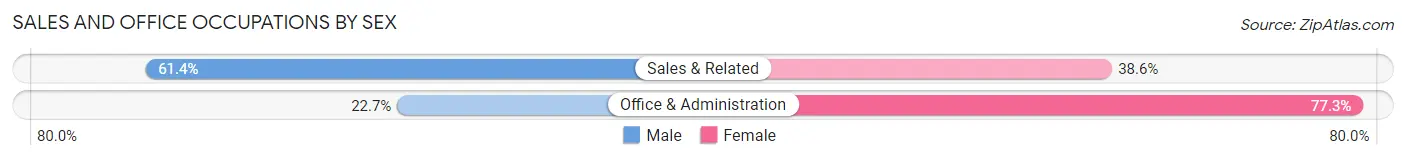
| Occupation | Male | Female |
| Sales & Related | 658 (61.4%) | 413 (38.6%) |
| Office & Administration | 386 (22.7%) | 1,316 (77.3%) |
| Total (Category) | 1,044 (37.7%) | 1,729 (62.4%) |
| Total (Overall) | 7,695 (56.5%) | 5,929 (43.5%) |
Natural Resources, Construction and Maintenance Occupations
The most common Natural Resources, Construction and Maintenance occupations in Greenville are Construction & Extraction (1,037 | 7.6%), Installation, Maintenance & Repair (801 | 5.9%), and Farming, Fishing & Forestry (19 | 0.1%).

Natural Resources, Construction and Maintenance Occupations by Sex
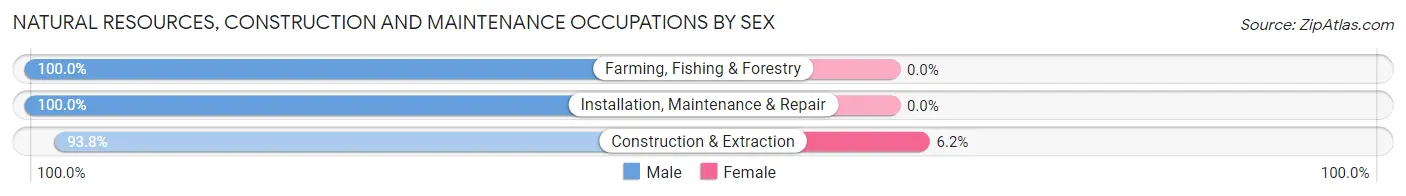
| Occupation | Male | Female |
| Farming, Fishing & Forestry | 19 (100.0%) | 0 (0.0%) |
| Construction & Extraction | 973 (93.8%) | 64 (6.2%) |
| Installation, Maintenance & Repair | 801 (100.0%) | 0 (0.0%) |
| Total (Category) | 1,793 (96.6%) | 64 (3.5%) |
| Total (Overall) | 7,695 (56.5%) | 5,929 (43.5%) |
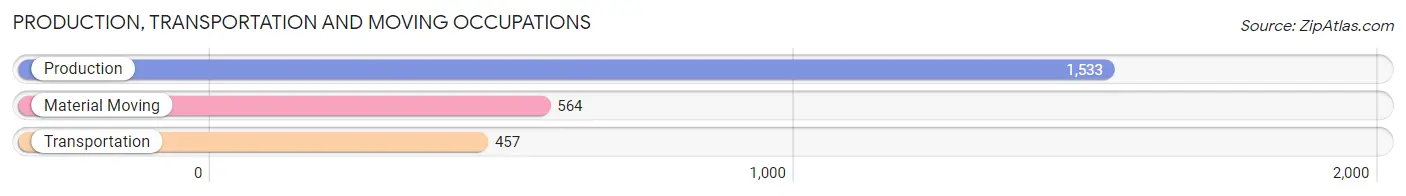
Production, Transportation and Moving Occupations
The most common Production, Transportation and Moving occupations in Greenville are Production (1,533 | 11.3%), Material Moving (564 | 4.1%), and Transportation (457 | 3.4%).
Production, Transportation and Moving Occupations by Sex
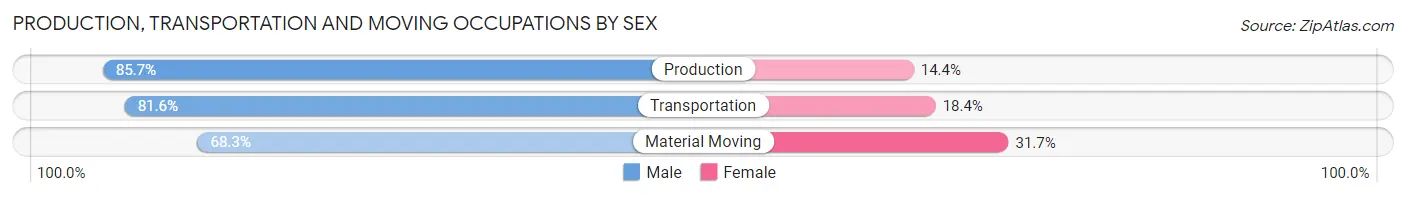
| Occupation | Male | Female |
| Production | 1,313 (85.7%) | 220 (14.3%) |
| Transportation | 373 (81.6%) | 84 (18.4%) |
| Material Moving | 385 (68.3%) | 179 (31.7%) |
| Total (Category) | 2,071 (81.1%) | 483 (18.9%) |
| Total (Overall) | 7,695 (56.5%) | 5,929 (43.5%) |
Employment Industries by Sex in Greenville
Employment Industries in Greenville
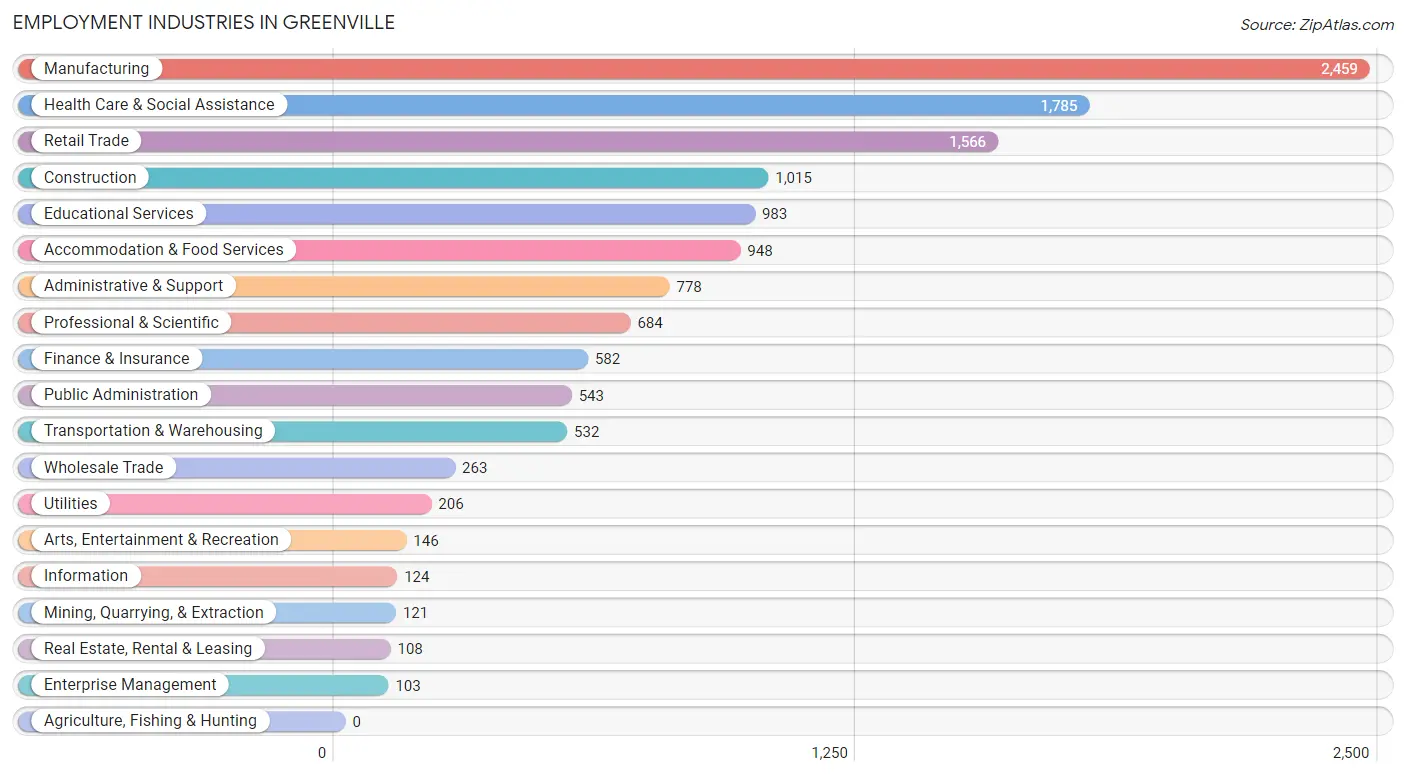
The major employment industries in Greenville include Manufacturing (2,459 | 18.0%), Health Care & Social Assistance (1,785 | 13.1%), Retail Trade (1,566 | 11.5%), Construction (1,015 | 7.4%), and Educational Services (983 | 7.2%).
Employment Industries by Sex in Greenville
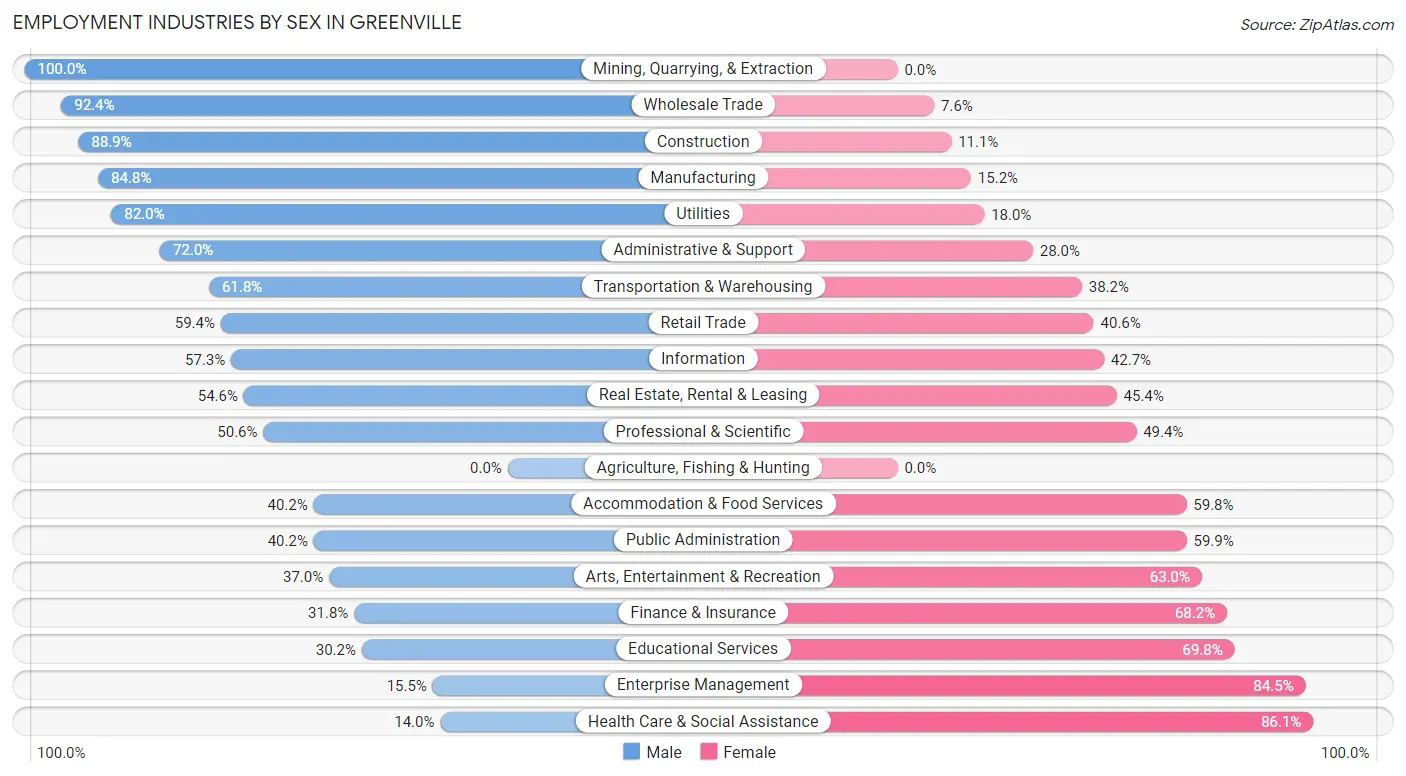
The Greenville industries that see more men than women are Mining, Quarrying, & Extraction (100.0%), Wholesale Trade (92.4%), and Construction (88.9%), whereas the industries that tend to have a higher number of women are Health Care & Social Assistance (86.1%), Enterprise Management (84.5%), and Educational Services (69.8%).
| Industry | Male | Female |
| Agriculture, Fishing & Hunting | 0 (0.0%) | 0 (0.0%) |
| Mining, Quarrying, & Extraction | 121 (100.0%) | 0 (0.0%) |
| Construction | 902 (88.9%) | 113 (11.1%) |
| Manufacturing | 2,085 (84.8%) | 374 (15.2%) |
| Wholesale Trade | 243 (92.4%) | 20 (7.6%) |
| Retail Trade | 930 (59.4%) | 636 (40.6%) |
| Transportation & Warehousing | 329 (61.8%) | 203 (38.2%) |
| Utilities | 169 (82.0%) | 37 (18.0%) |
| Information | 71 (57.3%) | 53 (42.7%) |
| Finance & Insurance | 185 (31.8%) | 397 (68.2%) |
| Real Estate, Rental & Leasing | 59 (54.6%) | 49 (45.4%) |
| Professional & Scientific | 346 (50.6%) | 338 (49.4%) |
| Enterprise Management | 16 (15.5%) | 87 (84.5%) |
| Administrative & Support | 560 (72.0%) | 218 (28.0%) |
| Educational Services | 297 (30.2%) | 686 (69.8%) |
| Health Care & Social Assistance | 249 (14.0%) | 1,536 (86.1%) |
| Arts, Entertainment & Recreation | 54 (37.0%) | 92 (63.0%) |
| Accommodation & Food Services | 381 (40.2%) | 567 (59.8%) |
| Public Administration | 218 (40.2%) | 325 (59.9%) |
| Total | 7,695 (56.5%) | 5,929 (43.5%) |
Education in Greenville
School Enrollment in Greenville
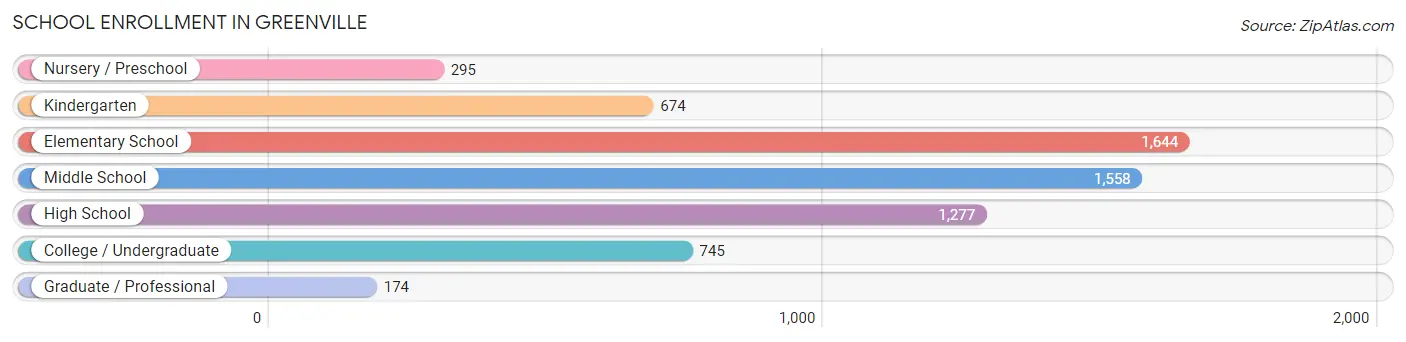
The most common levels of schooling among the 6,367 students in Greenville are elementary school (1,644 | 25.8%), middle school (1,558 | 24.5%), and high school (1,277 | 20.1%).
| School Level | # Students | % Students |
| Nursery / Preschool | 295 | 4.6% |
| Kindergarten | 674 | 10.6% |
| Elementary School | 1,644 | 25.8% |
| Middle School | 1,558 | 24.5% |
| High School | 1,277 | 20.1% |
| College / Undergraduate | 745 | 11.7% |
| Graduate / Professional | 174 | 2.7% |
| Total | 6,367 | 100.0% |
School Enrollment by Age by Funding Source in Greenville
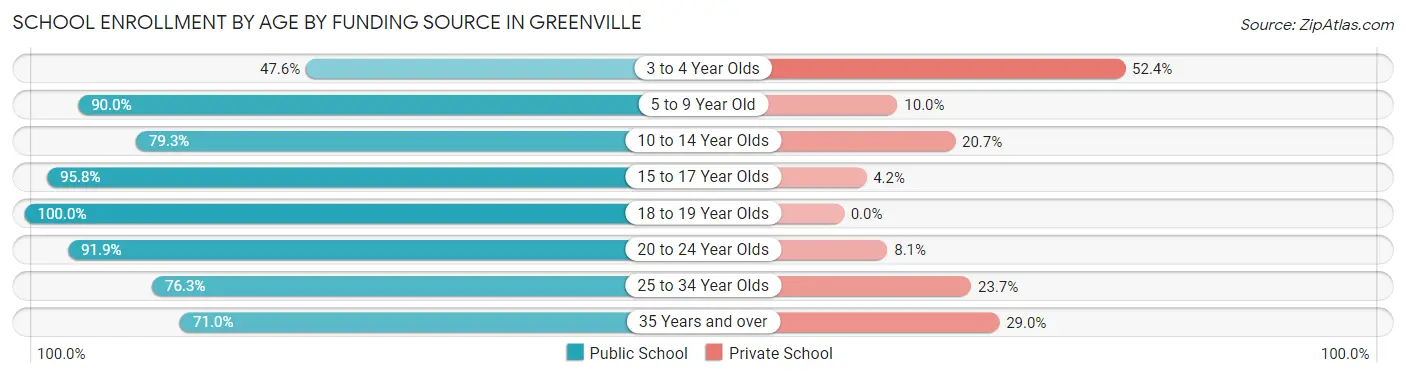
Out of a total of 6,367 students who are enrolled in schools in Greenville, 936 (14.7%) attend a private institution, while the remaining 5,431 (85.3%) are enrolled in public schools. The age group of 3 to 4 year olds has the highest likelihood of being enrolled in private schools, with 119 (52.4% in the age bracket) enrolled. Conversely, the age group of 18 to 19 year olds has the lowest likelihood of being enrolled in a private school, with 150 (100.0% in the age bracket) attending a public institution.
| Age Bracket | Public School | Private School |
| 3 to 4 Year Olds | 108 (47.6%) | 119 (52.4%) |
| 5 to 9 Year Old | 1,953 (90.0%) | 217 (10.0%) |
| 10 to 14 Year Olds | 1,643 (79.3%) | 430 (20.7%) |
| 15 to 17 Year Olds | 912 (95.8%) | 40 (4.2%) |
| 18 to 19 Year Olds | 150 (100.0%) | 0 (0.0%) |
| 20 to 24 Year Olds | 396 (91.9%) | 35 (8.1%) |
| 25 to 34 Year Olds | 167 (76.3%) | 52 (23.7%) |
| 35 Years and over | 103 (71.0%) | 42 (29.0%) |
| Total | 5,431 (85.3%) | 936 (14.7%) |
Educational Attainment by Field of Study in Greenville
Education (732 | 18.0%), business (705 | 17.3%), arts & humanities (409 | 10.0%), science & technology (338 | 8.3%), and psychology (328 | 8.1%) are the most common fields of study among 4,075 individuals in Greenville who have obtained a bachelor's degree or higher.
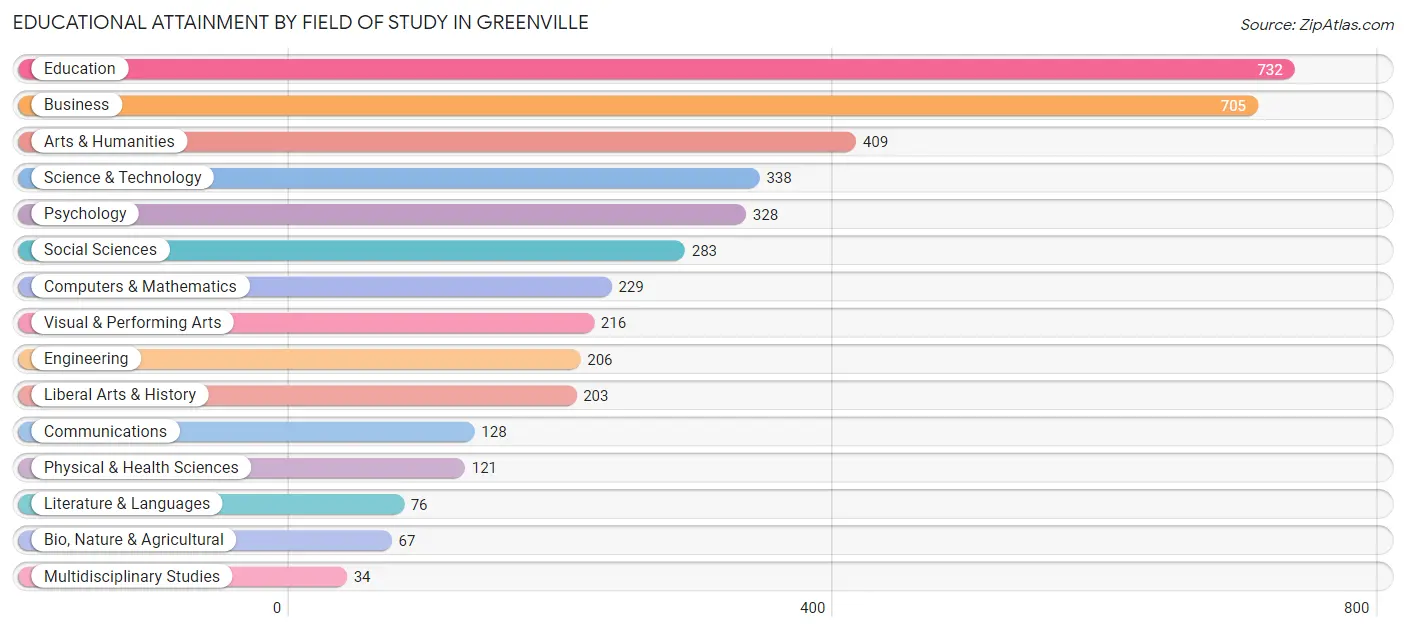
| Field of Study | # Graduates | % Graduates |
| Computers & Mathematics | 229 | 5.6% |
| Bio, Nature & Agricultural | 67 | 1.6% |
| Physical & Health Sciences | 121 | 3.0% |
| Psychology | 328 | 8.1% |
| Social Sciences | 283 | 6.9% |
| Engineering | 206 | 5.1% |
| Multidisciplinary Studies | 34 | 0.8% |
| Science & Technology | 338 | 8.3% |
| Business | 705 | 17.3% |
| Education | 732 | 18.0% |
| Literature & Languages | 76 | 1.9% |
| Liberal Arts & History | 203 | 5.0% |
| Visual & Performing Arts | 216 | 5.3% |
| Communications | 128 | 3.1% |
| Arts & Humanities | 409 | 10.0% |
| Total | 4,075 | 100.0% |
Transportation & Commute in Greenville
Vehicle Availability by Sex in Greenville
The most prevalent vehicle ownership categories in Greenville are males with 2 vehicles (3,229, accounting for 43.0%) and females with 2 vehicles (2,810, making up 56.8%).
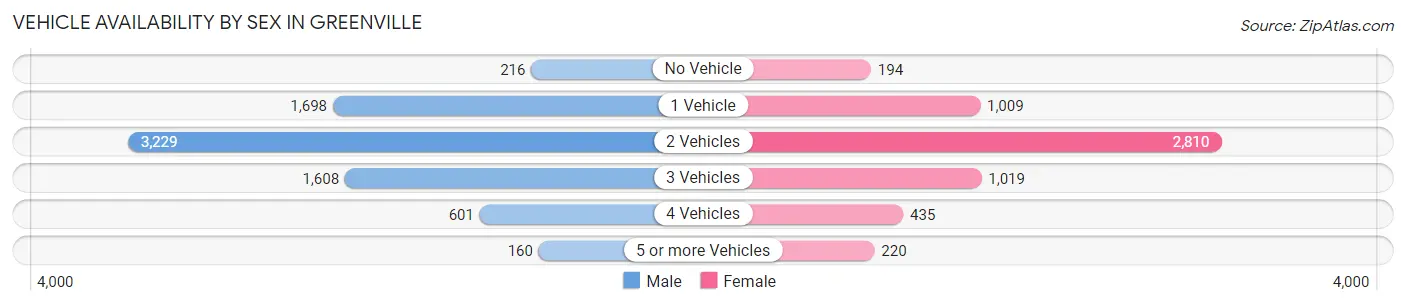
| Vehicles Available | Male | Female |
| No Vehicle | 216 (2.9%) | 194 (3.4%) |
| 1 Vehicle | 1,698 (22.6%) | 1,009 (17.7%) |
| 2 Vehicles | 3,229 (43.0%) | 2,810 (49.4%) |
| 3 Vehicles | 1,608 (21.4%) | 1,019 (17.9%) |
| 4 Vehicles | 601 (8.0%) | 435 (7.6%) |
| 5 or more Vehicles | 160 (2.1%) | 220 (3.9%) |
| Total | 7,512 (100.0%) | 5,687 (100.0%) |
Commute Time in Greenville
The most frequently occuring commute durations in Greenville are 10 to 14 minutes (2,743 commuters, 22.1%), 5 to 9 minutes (2,151 commuters, 17.3%), and 60 to 89 minutes (1,443 commuters, 11.6%).
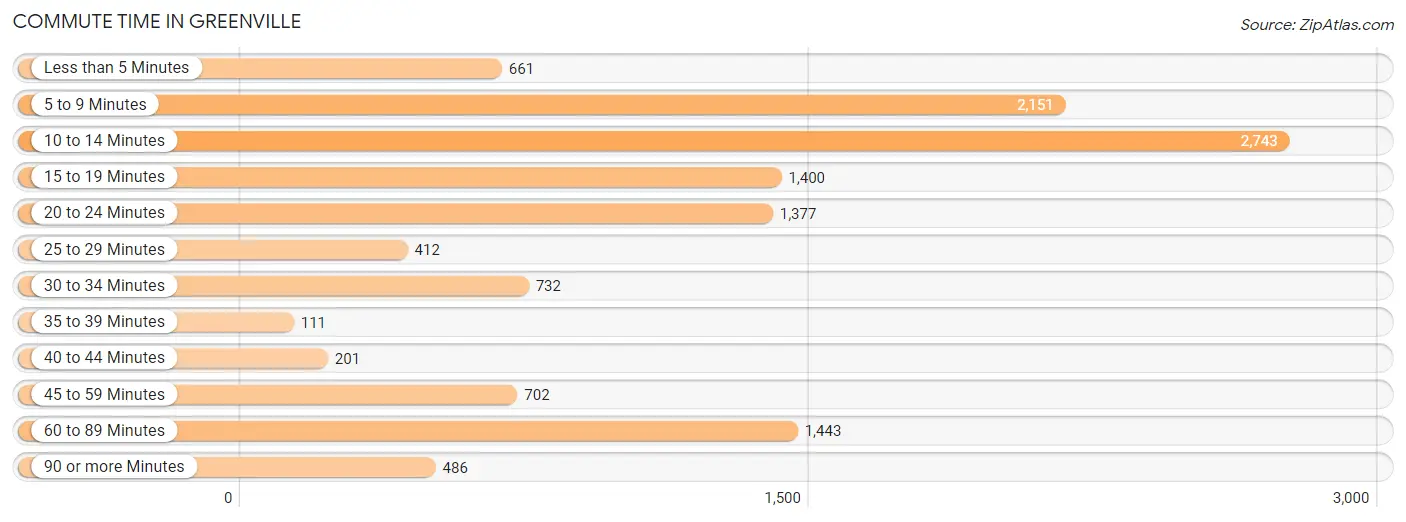
| Commute Time | # Commuters | % Commuters |
| Less than 5 Minutes | 661 | 5.3% |
| 5 to 9 Minutes | 2,151 | 17.3% |
| 10 to 14 Minutes | 2,743 | 22.1% |
| 15 to 19 Minutes | 1,400 | 11.3% |
| 20 to 24 Minutes | 1,377 | 11.1% |
| 25 to 29 Minutes | 412 | 3.3% |
| 30 to 34 Minutes | 732 | 5.9% |
| 35 to 39 Minutes | 111 | 0.9% |
| 40 to 44 Minutes | 201 | 1.6% |
| 45 to 59 Minutes | 702 | 5.7% |
| 60 to 89 Minutes | 1,443 | 11.6% |
| 90 or more Minutes | 486 | 3.9% |
Commute Time by Sex in Greenville
The most common commute times in Greenville are 10 to 14 minutes (1,527 commuters, 21.0%) for males and 10 to 14 minutes (1,216 commuters, 23.6%) for females.
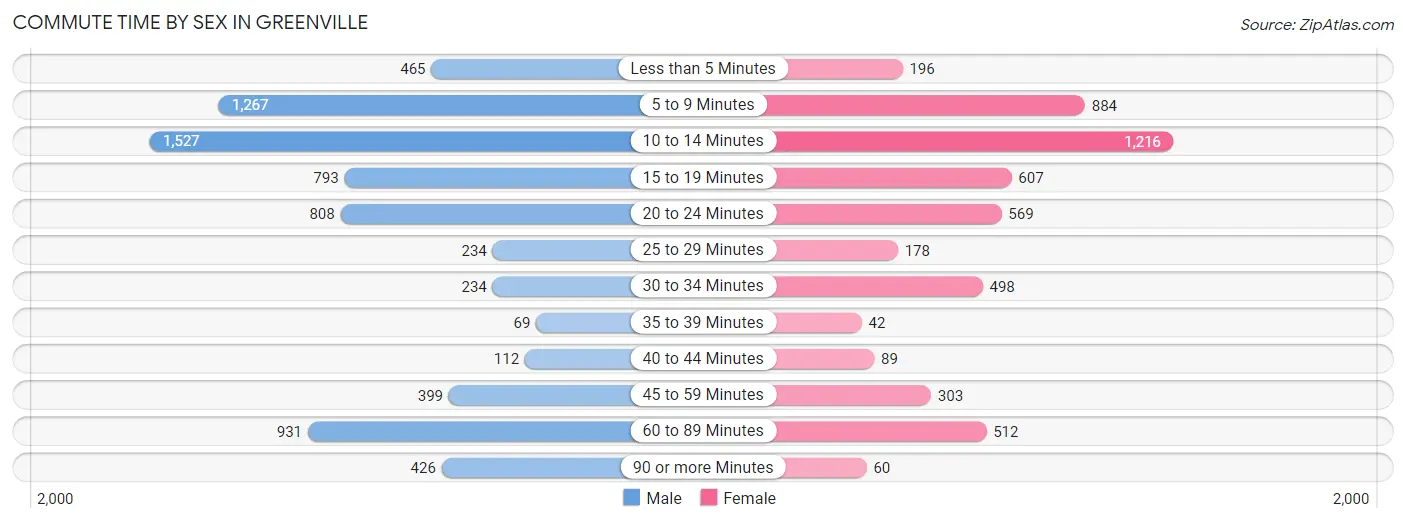
| Commute Time | Male | Female |
| Less than 5 Minutes | 465 (6.4%) | 196 (3.8%) |
| 5 to 9 Minutes | 1,267 (17.4%) | 884 (17.2%) |
| 10 to 14 Minutes | 1,527 (21.0%) | 1,216 (23.6%) |
| 15 to 19 Minutes | 793 (10.9%) | 607 (11.8%) |
| 20 to 24 Minutes | 808 (11.1%) | 569 (11.0%) |
| 25 to 29 Minutes | 234 (3.2%) | 178 (3.5%) |
| 30 to 34 Minutes | 234 (3.2%) | 498 (9.7%) |
| 35 to 39 Minutes | 69 (0.9%) | 42 (0.8%) |
| 40 to 44 Minutes | 112 (1.5%) | 89 (1.7%) |
| 45 to 59 Minutes | 399 (5.5%) | 303 (5.9%) |
| 60 to 89 Minutes | 931 (12.8%) | 512 (9.9%) |
| 90 or more Minutes | 426 (5.9%) | 60 (1.2%) |
Time of Departure to Work by Sex in Greenville
The most frequent times of departure to work in Greenville are 7:00 AM to 7:29 AM (1,091, 15.0%) for males and 7:30 AM to 7:59 AM (954, 18.5%) for females.
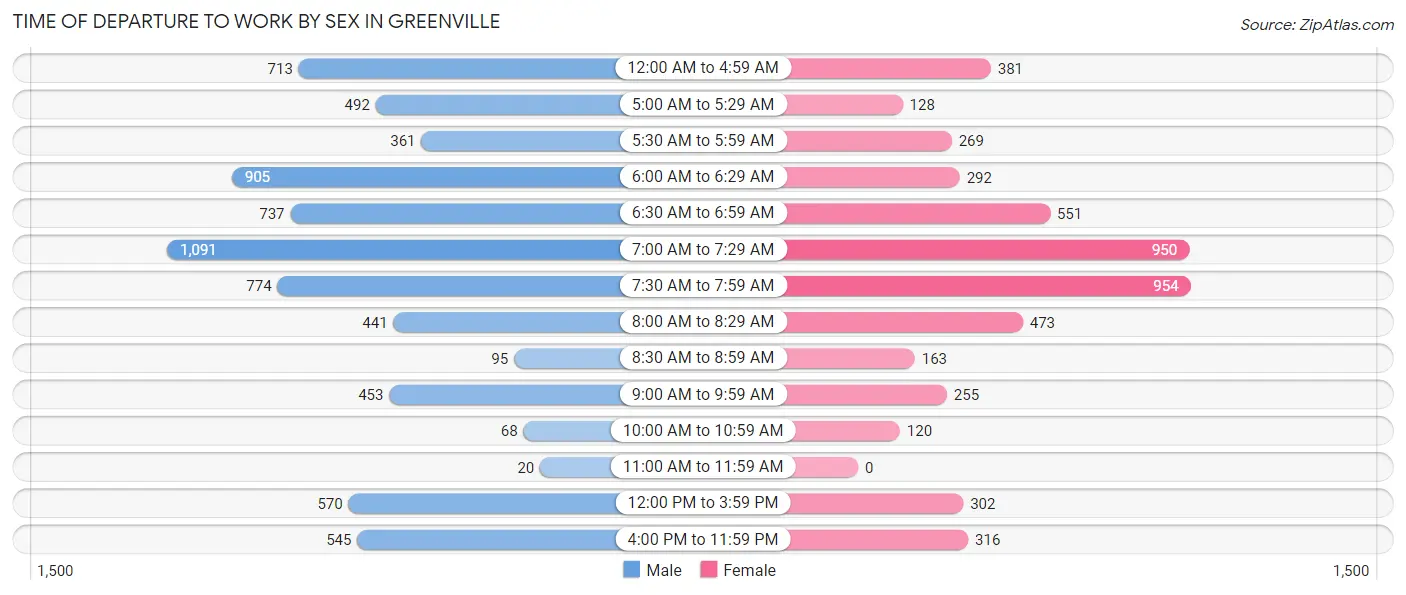
| Time of Departure | Male | Female |
| 12:00 AM to 4:59 AM | 713 (9.8%) | 381 (7.4%) |
| 5:00 AM to 5:29 AM | 492 (6.8%) | 128 (2.5%) |
| 5:30 AM to 5:59 AM | 361 (5.0%) | 269 (5.2%) |
| 6:00 AM to 6:29 AM | 905 (12.5%) | 292 (5.7%) |
| 6:30 AM to 6:59 AM | 737 (10.1%) | 551 (10.7%) |
| 7:00 AM to 7:29 AM | 1,091 (15.0%) | 950 (18.4%) |
| 7:30 AM to 7:59 AM | 774 (10.6%) | 954 (18.5%) |
| 8:00 AM to 8:29 AM | 441 (6.1%) | 473 (9.2%) |
| 8:30 AM to 8:59 AM | 95 (1.3%) | 163 (3.2%) |
| 9:00 AM to 9:59 AM | 453 (6.2%) | 255 (5.0%) |
| 10:00 AM to 10:59 AM | 68 (0.9%) | 120 (2.3%) |
| 11:00 AM to 11:59 AM | 20 (0.3%) | 0 (0.0%) |
| 12:00 PM to 3:59 PM | 570 (7.9%) | 302 (5.9%) |
| 4:00 PM to 11:59 PM | 545 (7.5%) | 316 (6.1%) |
| Total | 7,265 (100.0%) | 5,154 (100.0%) |
Housing Occupancy in Greenville
Occupancy by Ownership in Greenville
Of the total 11,064 dwellings in Greenville, owner-occupied units account for 5,529 (50.0%), while renter-occupied units make up 5,535 (50.0%).
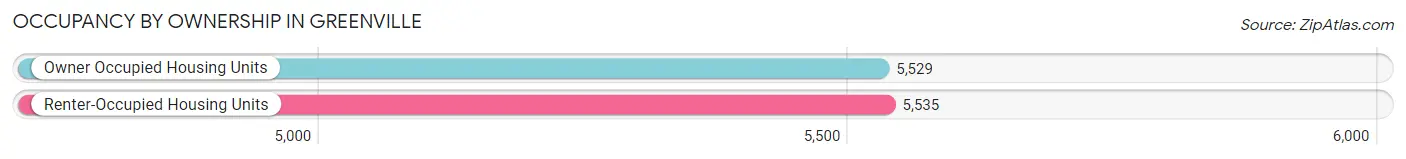
| Occupancy | # Housing Units | % Housing Units |
| Owner Occupied Housing Units | 5,529 | 50.0% |
| Renter-Occupied Housing Units | 5,535 | 50.0% |
| Total Occupied Housing Units | 11,064 | 100.0% |
Occupancy by Household Size in Greenville
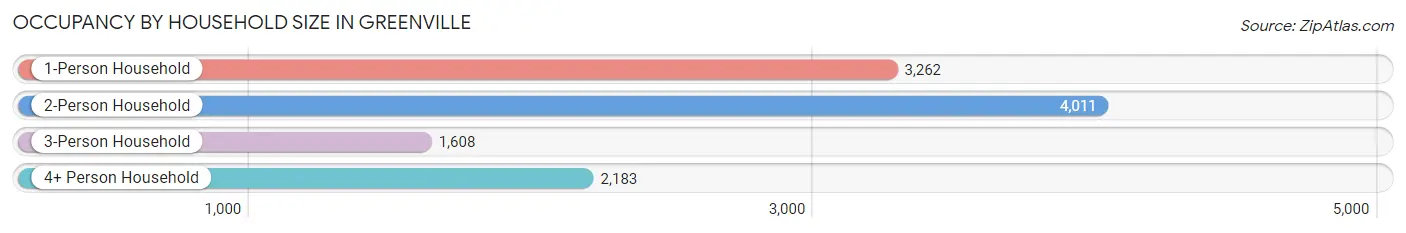
| Household Size | # Housing Units | % Housing Units |
| 1-Person Household | 3,262 | 29.5% |
| 2-Person Household | 4,011 | 36.2% |
| 3-Person Household | 1,608 | 14.5% |
| 4+ Person Household | 2,183 | 19.7% |
| Total Housing Units | 11,064 | 100.0% |
Occupancy by Ownership by Household Size in Greenville
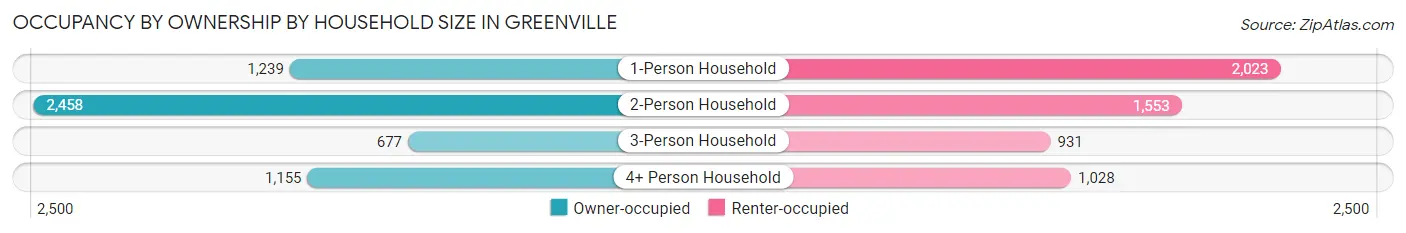
| Household Size | Owner-occupied | Renter-occupied |
| 1-Person Household | 1,239 (38.0%) | 2,023 (62.0%) |
| 2-Person Household | 2,458 (61.3%) | 1,553 (38.7%) |
| 3-Person Household | 677 (42.1%) | 931 (57.9%) |
| 4+ Person Household | 1,155 (52.9%) | 1,028 (47.1%) |
| Total Housing Units | 5,529 (50.0%) | 5,535 (50.0%) |
Occupancy by Educational Attainment in Greenville
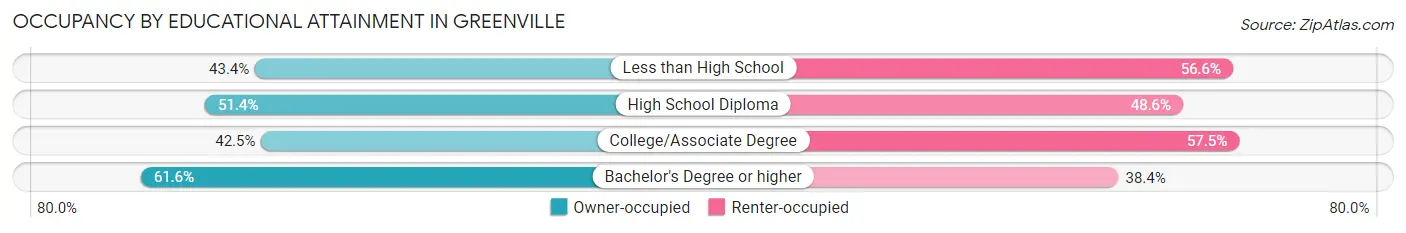
| Household Size | Owner-occupied | Renter-occupied |
| Less than High School | 692 (43.4%) | 901 (56.6%) |
| High School Diploma | 1,875 (51.4%) | 1,776 (48.6%) |
| College/Associate Degree | 1,380 (42.5%) | 1,870 (57.5%) |
| Bachelor's Degree or higher | 1,582 (61.6%) | 988 (38.4%) |
Occupancy by Age of Householder in Greenville
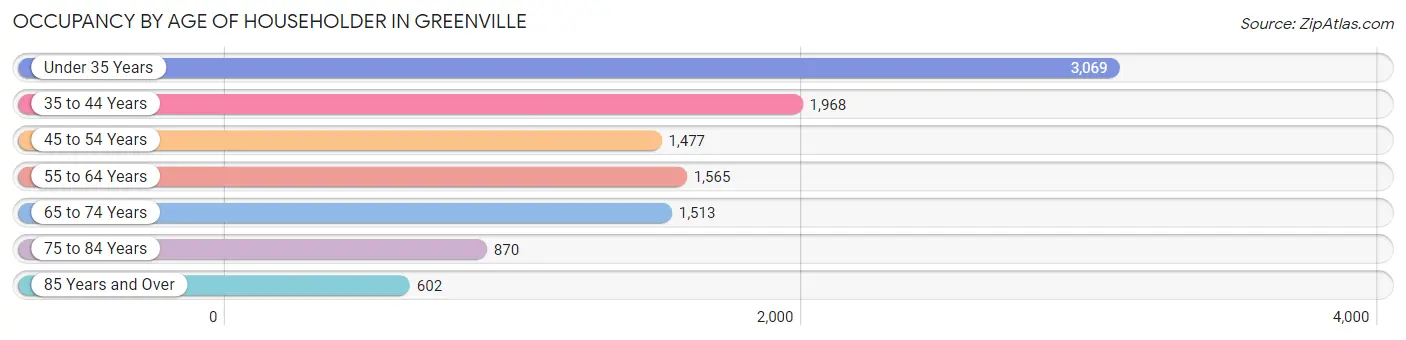
| Age Bracket | # Households | % Households |
| Under 35 Years | 3,069 | 27.7% |
| 35 to 44 Years | 1,968 | 17.8% |
| 45 to 54 Years | 1,477 | 13.4% |
| 55 to 64 Years | 1,565 | 14.1% |
| 65 to 74 Years | 1,513 | 13.7% |
| 75 to 84 Years | 870 | 7.9% |
| 85 Years and Over | 602 | 5.4% |
| Total | 11,064 | 100.0% |
Housing Finances in Greenville
Median Income by Occupancy in Greenville
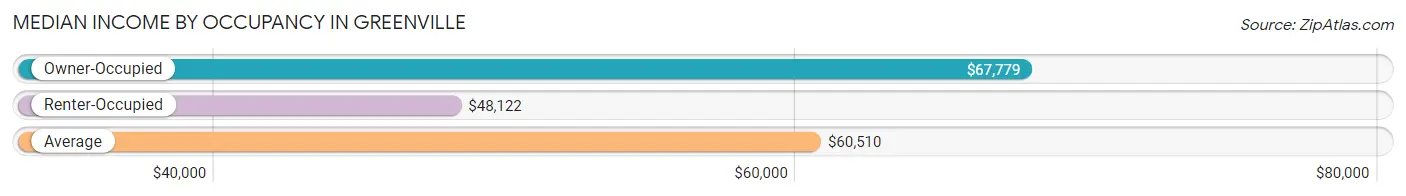
| Occupancy Type | # Households | Median Income |
| Owner-Occupied | 5,529 (50.0%) | $67,779 |
| Renter-Occupied | 5,535 (50.0%) | $48,122 |
| Average | 11,064 (100.0%) | $60,510 |
Occupancy by Householder Income Bracket in Greenville
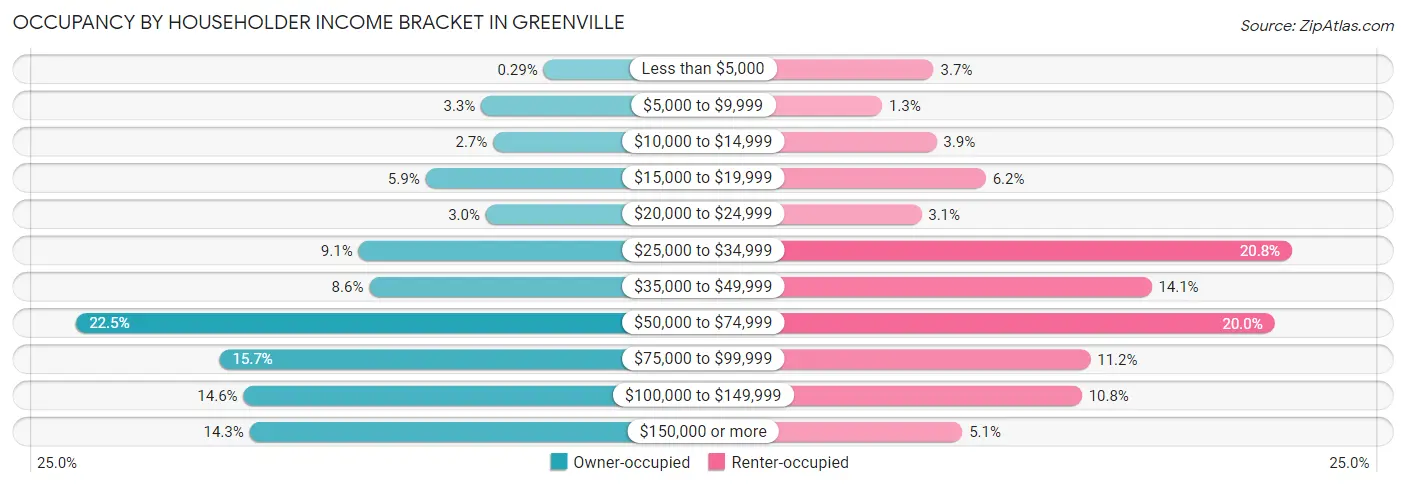
| Income Bracket | Owner-occupied | Renter-occupied |
| Less than $5,000 | 16 (0.3%) | 206 (3.7%) |
| $5,000 to $9,999 | 180 (3.3%) | 70 (1.3%) |
| $10,000 to $14,999 | 149 (2.7%) | 213 (3.8%) |
| $15,000 to $19,999 | 327 (5.9%) | 343 (6.2%) |
| $20,000 to $24,999 | 168 (3.0%) | 173 (3.1%) |
| $25,000 to $34,999 | 503 (9.1%) | 1,150 (20.8%) |
| $35,000 to $49,999 | 475 (8.6%) | 780 (14.1%) |
| $50,000 to $74,999 | 1,246 (22.5%) | 1,104 (20.0%) |
| $75,000 to $99,999 | 869 (15.7%) | 619 (11.2%) |
| $100,000 to $149,999 | 806 (14.6%) | 596 (10.8%) |
| $150,000 or more | 790 (14.3%) | 281 (5.1%) |
| Total | 5,529 (100.0%) | 5,535 (100.0%) |
Monthly Housing Cost Tiers in Greenville
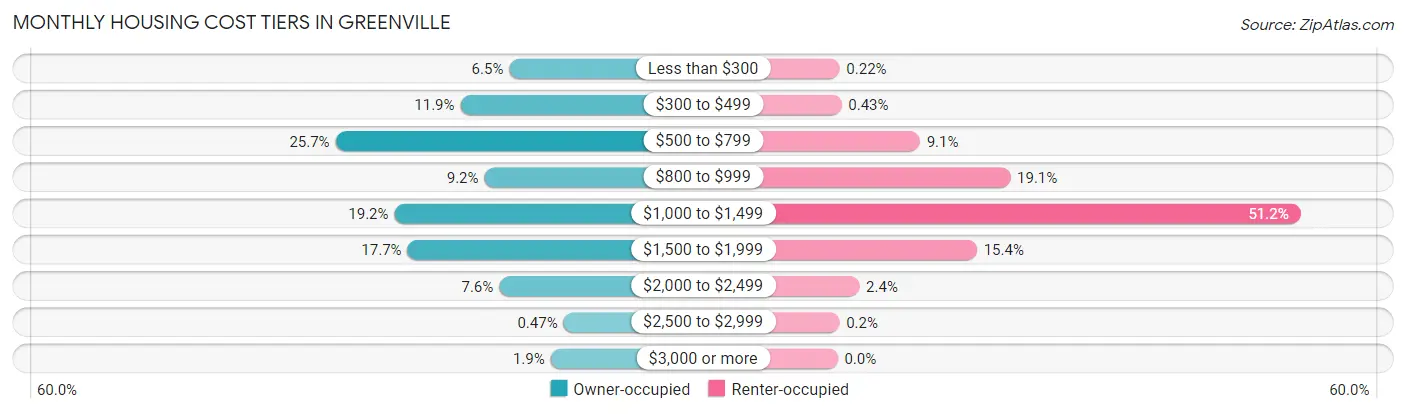
| Monthly Cost | Owner-occupied | Renter-occupied |
| Less than $300 | 357 (6.5%) | 12 (0.2%) |
| $300 to $499 | 656 (11.9%) | 24 (0.4%) |
| $500 to $799 | 1,419 (25.7%) | 503 (9.1%) |
| $800 to $999 | 509 (9.2%) | 1,056 (19.1%) |
| $1,000 to $1,499 | 1,059 (19.2%) | 2,831 (51.1%) |
| $1,500 to $1,999 | 979 (17.7%) | 852 (15.4%) |
| $2,000 to $2,499 | 419 (7.6%) | 133 (2.4%) |
| $2,500 to $2,999 | 26 (0.5%) | 11 (0.2%) |
| $3,000 or more | 105 (1.9%) | 0 (0.0%) |
| Total | 5,529 (100.0%) | 5,535 (100.0%) |
Physical Housing Characteristics in Greenville
Housing Structures in Greenville
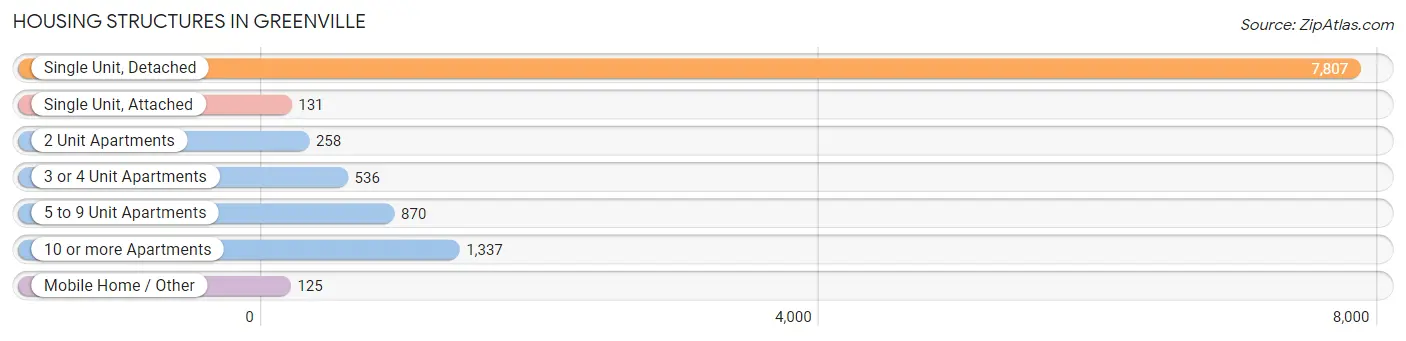
| Structure Type | # Housing Units | % Housing Units |
| Single Unit, Detached | 7,807 | 70.6% |
| Single Unit, Attached | 131 | 1.2% |
| 2 Unit Apartments | 258 | 2.3% |
| 3 or 4 Unit Apartments | 536 | 4.8% |
| 5 to 9 Unit Apartments | 870 | 7.9% |
| 10 or more Apartments | 1,337 | 12.1% |
| Mobile Home / Other | 125 | 1.1% |
| Total | 11,064 | 100.0% |
Housing Structures by Occupancy in Greenville
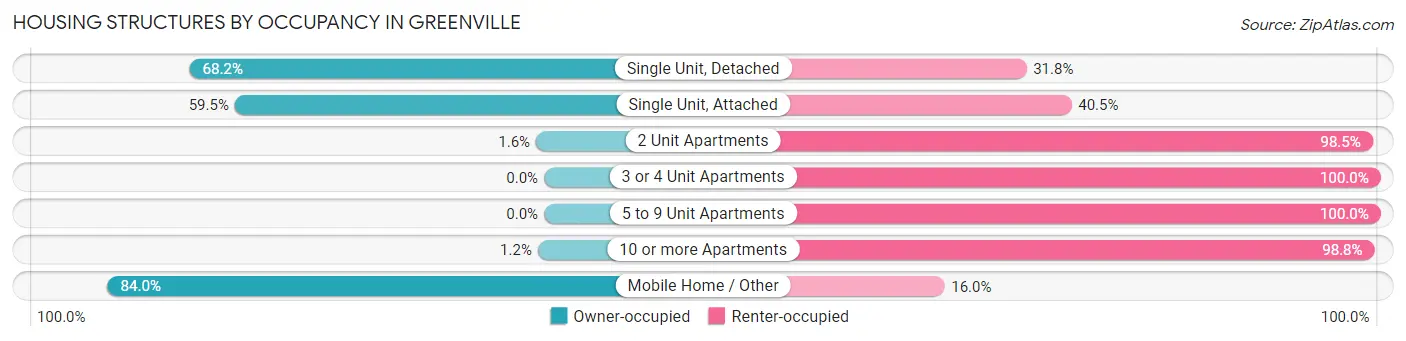
| Structure Type | Owner-occupied | Renter-occupied |
| Single Unit, Detached | 5,326 (68.2%) | 2,481 (31.8%) |
| Single Unit, Attached | 78 (59.5%) | 53 (40.5%) |
| 2 Unit Apartments | 4 (1.5%) | 254 (98.5%) |
| 3 or 4 Unit Apartments | 0 (0.0%) | 536 (100.0%) |
| 5 to 9 Unit Apartments | 0 (0.0%) | 870 (100.0%) |
| 10 or more Apartments | 16 (1.2%) | 1,321 (98.8%) |
| Mobile Home / Other | 105 (84.0%) | 20 (16.0%) |
| Total | 5,529 (50.0%) | 5,535 (50.0%) |
Housing Structures by Number of Rooms in Greenville
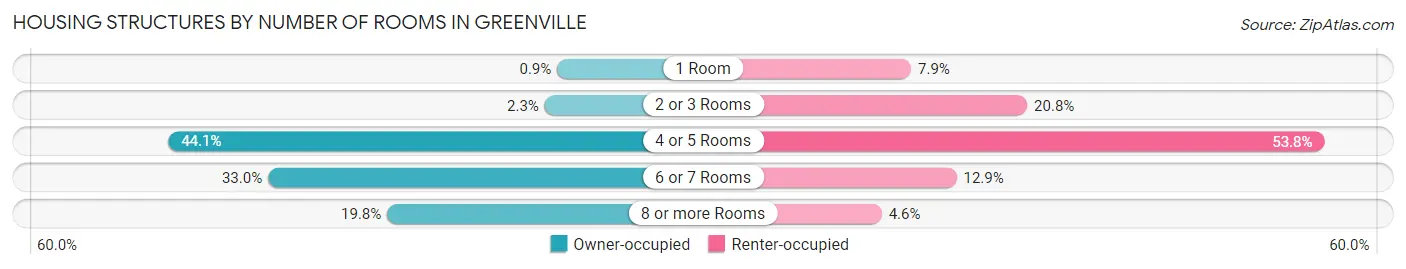
| Number of Rooms | Owner-occupied | Renter-occupied |
| 1 Room | 50 (0.9%) | 437 (7.9%) |
| 2 or 3 Rooms | 126 (2.3%) | 1,150 (20.8%) |
| 4 or 5 Rooms | 2,436 (44.1%) | 2,975 (53.7%) |
| 6 or 7 Rooms | 1,824 (33.0%) | 716 (12.9%) |
| 8 or more Rooms | 1,093 (19.8%) | 257 (4.6%) |
| Total | 5,529 (100.0%) | 5,535 (100.0%) |
Housing Structure by Heating Type in Greenville
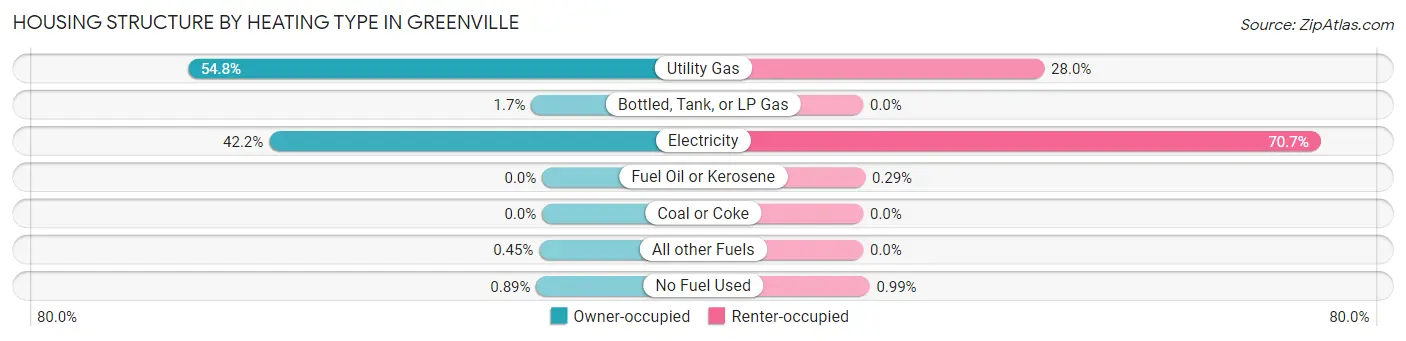
| Heating Type | Owner-occupied | Renter-occupied |
| Utility Gas | 3,029 (54.8%) | 1,550 (28.0%) |
| Bottled, Tank, or LP Gas | 93 (1.7%) | 0 (0.0%) |
| Electricity | 2,333 (42.2%) | 3,914 (70.7%) |
| Fuel Oil or Kerosene | 0 (0.0%) | 16 (0.3%) |
| Coal or Coke | 0 (0.0%) | 0 (0.0%) |
| All other Fuels | 25 (0.4%) | 0 (0.0%) |
| No Fuel Used | 49 (0.9%) | 55 (1.0%) |
| Total | 5,529 (100.0%) | 5,535 (100.0%) |
Household Vehicle Usage in Greenville
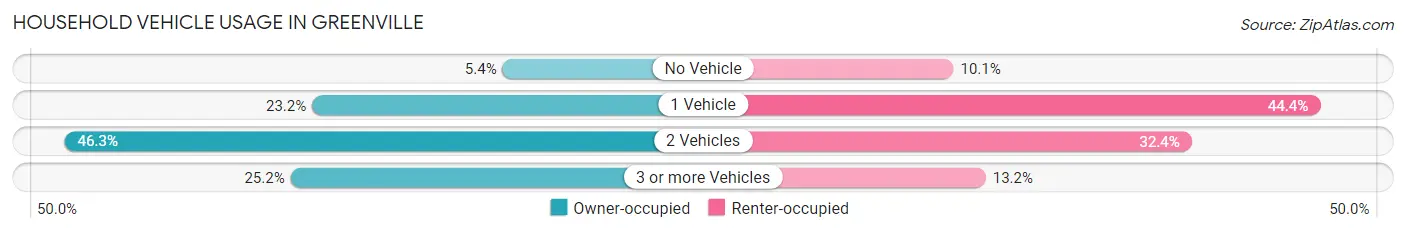
| Vehicles per Household | Owner-occupied | Renter-occupied |
| No Vehicle | 298 (5.4%) | 561 (10.1%) |
| 1 Vehicle | 1,281 (23.2%) | 2,455 (44.4%) |
| 2 Vehicles | 2,558 (46.3%) | 1,791 (32.4%) |
| 3 or more Vehicles | 1,392 (25.2%) | 728 (13.2%) |
| Total | 5,529 (100.0%) | 5,535 (100.0%) |
Real Estate & Mortgages in Greenville
Real Estate and Mortgage Overview in Greenville
| Characteristic | Without Mortgage | With Mortgage |
| Housing Units | 2,834 | 2,695 |
| Median Property Value | $109,100 | $215,600 |
| Median Household Income | $56,928 | $649 |
| Monthly Housing Costs | $590 | $105 |
| Real Estate Taxes | $1,950 | $170 |
Property Value by Mortgage Status in Greenville
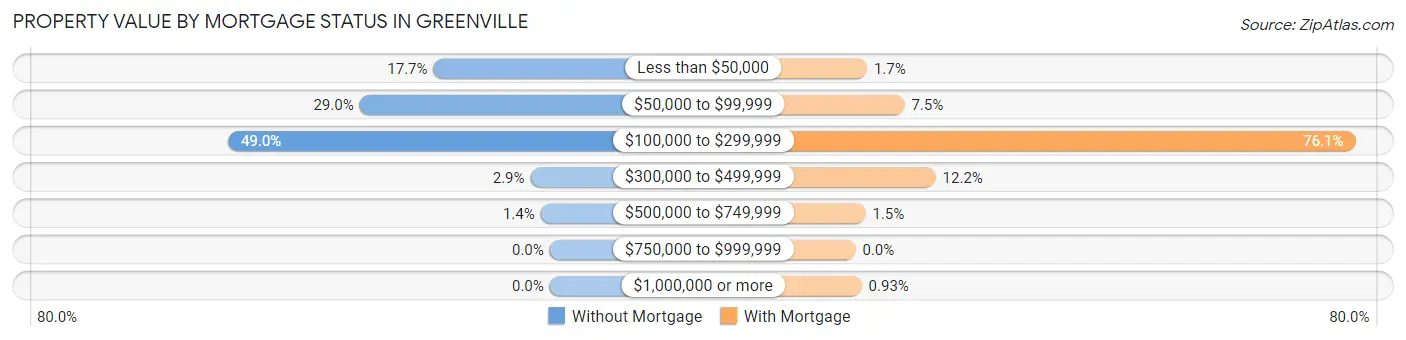
| Property Value | Without Mortgage | With Mortgage |
| Less than $50,000 | 502 (17.7%) | 47 (1.7%) |
| $50,000 to $99,999 | 821 (29.0%) | 201 (7.5%) |
| $100,000 to $299,999 | 1,389 (49.0%) | 2,052 (76.1%) |
| $300,000 to $499,999 | 83 (2.9%) | 329 (12.2%) |
| $500,000 to $749,999 | 39 (1.4%) | 41 (1.5%) |
| $750,000 to $999,999 | 0 (0.0%) | 0 (0.0%) |
| $1,000,000 or more | 0 (0.0%) | 25 (0.9%) |
| Total | 2,834 (100.0%) | 2,695 (100.0%) |
Household Income by Mortgage Status in Greenville
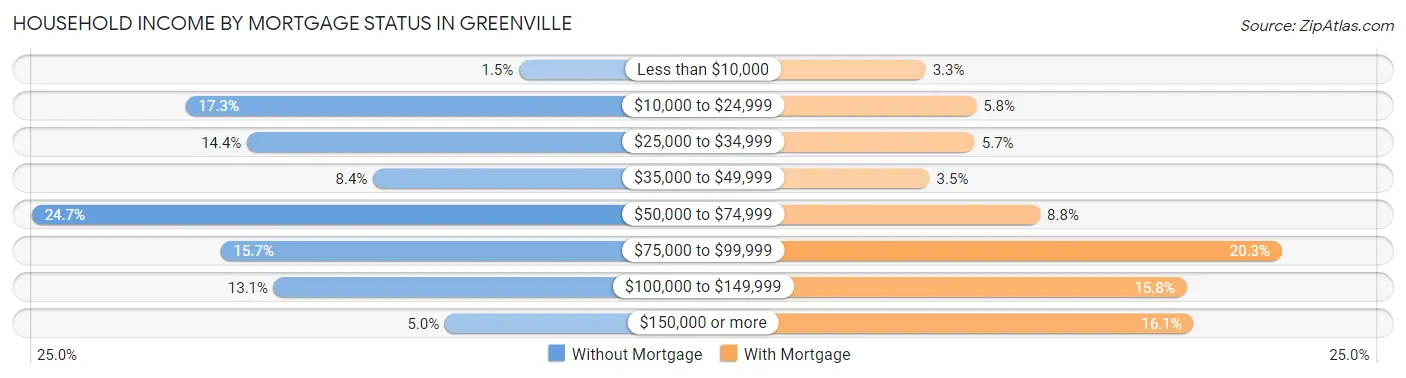
| Household Income | Without Mortgage | With Mortgage |
| Less than $10,000 | 41 (1.5%) | 90 (3.3%) |
| $10,000 to $24,999 | 491 (17.3%) | 155 (5.8%) |
| $25,000 to $34,999 | 408 (14.4%) | 153 (5.7%) |
| $35,000 to $49,999 | 238 (8.4%) | 95 (3.5%) |
| $50,000 to $74,999 | 699 (24.7%) | 237 (8.8%) |
| $75,000 to $99,999 | 444 (15.7%) | 547 (20.3%) |
| $100,000 to $149,999 | 372 (13.1%) | 425 (15.8%) |
| $150,000 or more | 141 (5.0%) | 434 (16.1%) |
| Total | 2,834 (100.0%) | 2,695 (100.0%) |
Property Value to Household Income Ratio in Greenville
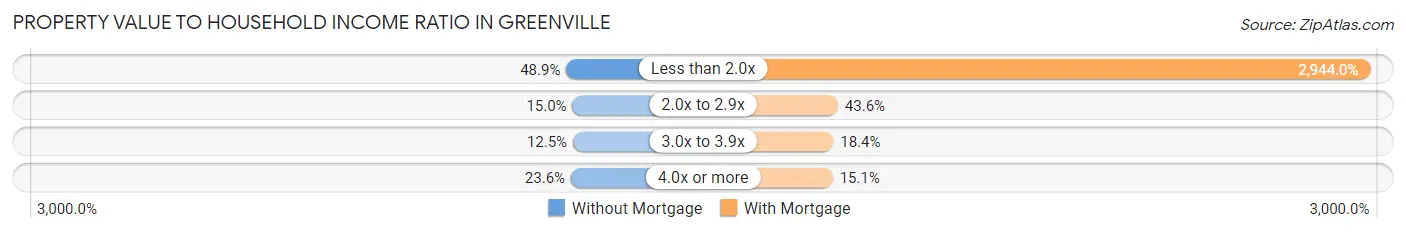
| Value-to-Income Ratio | Without Mortgage | With Mortgage |
| Less than 2.0x | 1,385 (48.9%) | 79,341 (2,944.0%) |
| 2.0x to 2.9x | 426 (15.0%) | 1,175 (43.6%) |
| 3.0x to 3.9x | 354 (12.5%) | 496 (18.4%) |
| 4.0x or more | 669 (23.6%) | 407 (15.1%) |
| Total | 2,834 (100.0%) | 2,695 (100.0%) |
Real Estate Taxes by Mortgage Status in Greenville
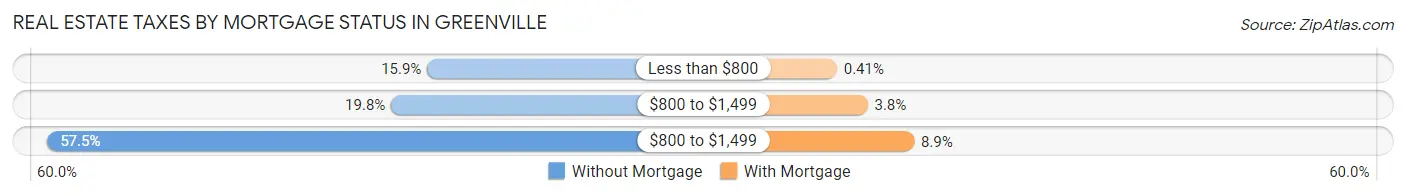
| Property Taxes | Without Mortgage | With Mortgage |
| Less than $800 | 450 (15.9%) | 11 (0.4%) |
| $800 to $1,499 | 562 (19.8%) | 102 (3.8%) |
| $800 to $1,499 | 1,630 (57.5%) | 239 (8.9%) |
| Total | 2,834 (100.0%) | 2,695 (100.0%) |
Health & Disability in Greenville
Health Insurance Coverage by Age in Greenville
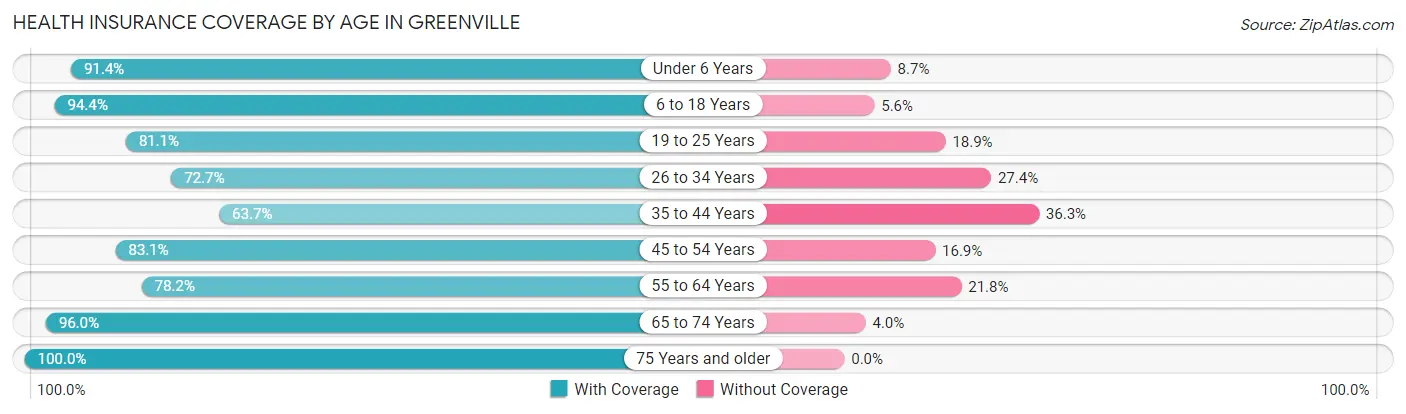
| Age Bracket | With Coverage | Without Coverage |
| Under 6 Years | 1,890 (91.3%) | 179 (8.6%) |
| 6 to 18 Years | 4,678 (94.4%) | 277 (5.6%) |
| 19 to 25 Years | 2,043 (81.1%) | 475 (18.9%) |
| 26 to 34 Years | 3,414 (72.7%) | 1,285 (27.4%) |
| 35 to 44 Years | 2,165 (63.7%) | 1,233 (36.3%) |
| 45 to 54 Years | 2,591 (83.1%) | 528 (16.9%) |
| 55 to 64 Years | 2,327 (78.2%) | 649 (21.8%) |
| 65 to 74 Years | 2,376 (96.0%) | 98 (4.0%) |
| 75 Years and older | 1,994 (100.0%) | 0 (0.0%) |
| Total | 23,478 (83.3%) | 4,724 (16.8%) |
Health Insurance Coverage by Citizenship Status in Greenville
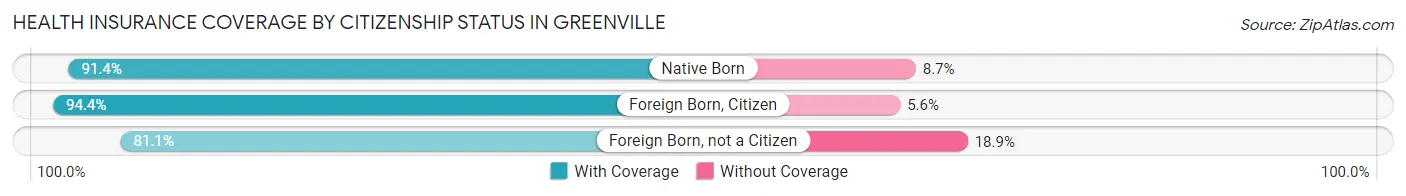
| Citizenship Status | With Coverage | Without Coverage |
| Native Born | 1,890 (91.3%) | 179 (8.6%) |
| Foreign Born, Citizen | 4,678 (94.4%) | 277 (5.6%) |
| Foreign Born, not a Citizen | 2,043 (81.1%) | 475 (18.9%) |
Health Insurance Coverage by Household Income in Greenville
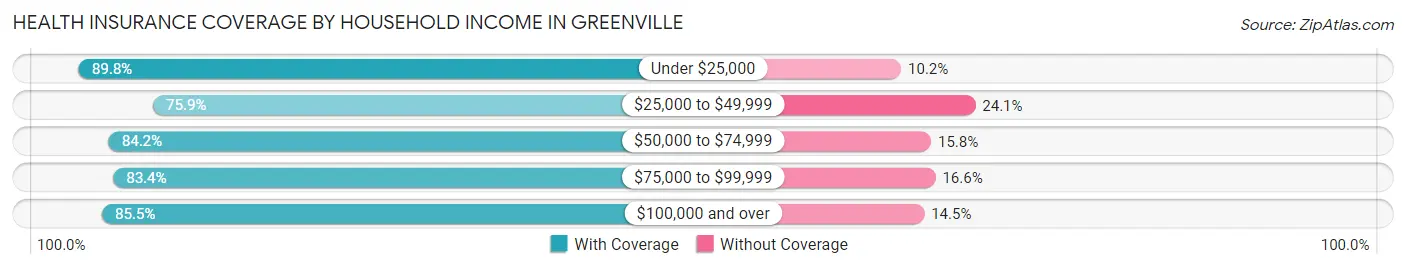
| Household Income | With Coverage | Without Coverage |
| Under $25,000 | 2,727 (89.8%) | 309 (10.2%) |
| $25,000 to $49,999 | 4,550 (75.9%) | 1,444 (24.1%) |
| $50,000 to $74,999 | 5,125 (84.2%) | 961 (15.8%) |
| $75,000 to $99,999 | 3,939 (83.4%) | 785 (16.6%) |
| $100,000 and over | 7,030 (85.5%) | 1,193 (14.5%) |
Public vs Private Health Insurance Coverage by Age in Greenville
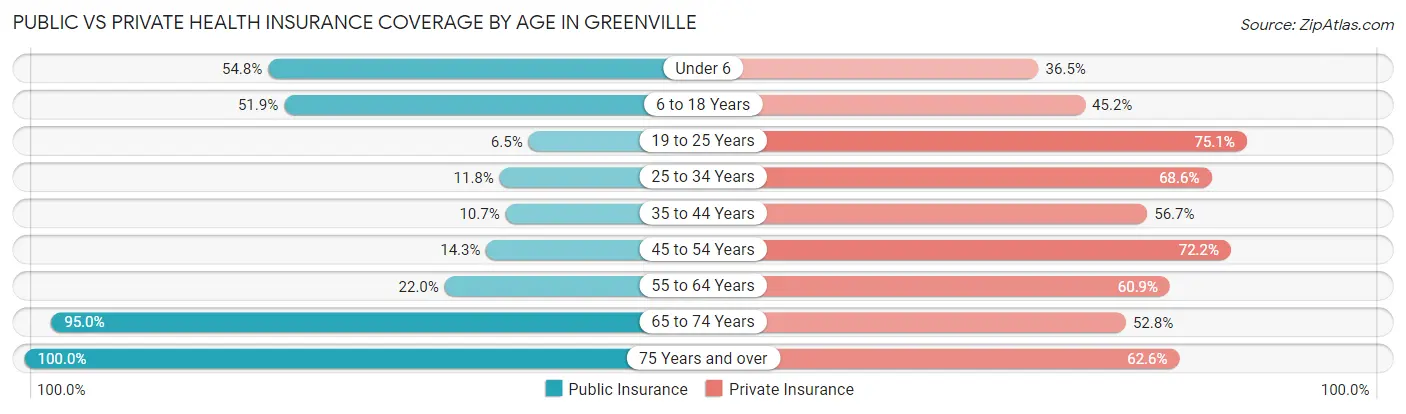
| Age Bracket | Public Insurance | Private Insurance |
| Under 6 | 1,134 (54.8%) | 756 (36.5%) |
| 6 to 18 Years | 2,569 (51.8%) | 2,238 (45.2%) |
| 19 to 25 Years | 163 (6.5%) | 1,892 (75.1%) |
| 25 to 34 Years | 556 (11.8%) | 3,222 (68.6%) |
| 35 to 44 Years | 365 (10.7%) | 1,927 (56.7%) |
| 45 to 54 Years | 446 (14.3%) | 2,252 (72.2%) |
| 55 to 64 Years | 656 (22.0%) | 1,812 (60.9%) |
| 65 to 74 Years | 2,351 (95.0%) | 1,305 (52.7%) |
| 75 Years and over | 1,994 (100.0%) | 1,249 (62.6%) |
| Total | 10,234 (36.3%) | 16,653 (59.1%) |
Disability Status by Sex by Age in Greenville
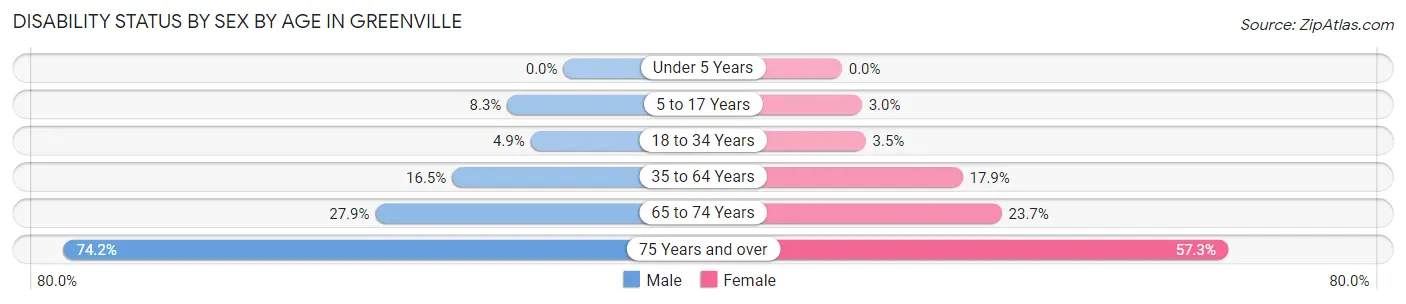
| Age Bracket | Male | Female |
| Under 5 Years | 0 (0.0%) | 0 (0.0%) |
| 5 to 17 Years | 242 (8.3%) | 71 (3.0%) |
| 18 to 34 Years | 191 (4.9%) | 122 (3.5%) |
| 35 to 64 Years | 760 (16.5%) | 878 (17.9%) |
| 65 to 74 Years | 299 (27.9%) | 333 (23.7%) |
| 75 Years and over | 541 (74.2%) | 725 (57.3%) |
Disability Class by Sex by Age in Greenville
Disability Class: Hearing Difficulty
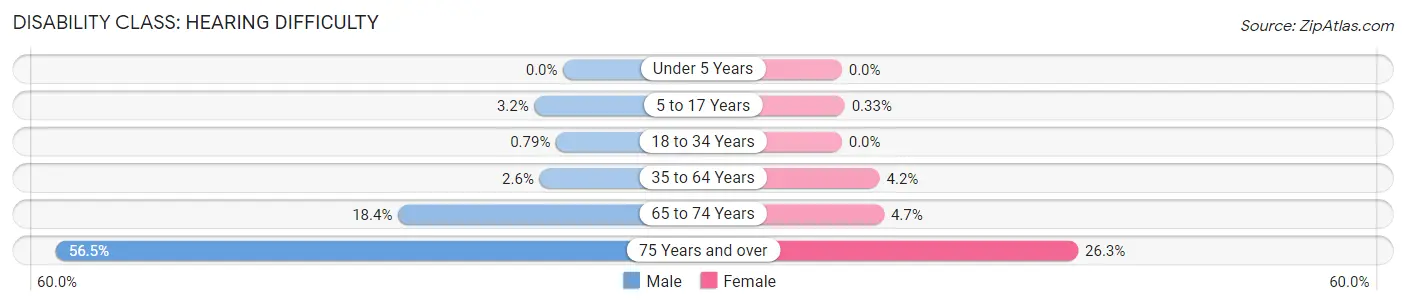
| Age Bracket | Male | Female |
| Under 5 Years | 0 (0.0%) | 0 (0.0%) |
| 5 to 17 Years | 93 (3.2%) | 8 (0.3%) |
| 18 to 34 Years | 31 (0.8%) | 0 (0.0%) |
| 35 to 64 Years | 121 (2.6%) | 206 (4.2%) |
| 65 to 74 Years | 197 (18.4%) | 66 (4.7%) |
| 75 Years and over | 412 (56.5%) | 333 (26.3%) |
Disability Class: Vision Difficulty
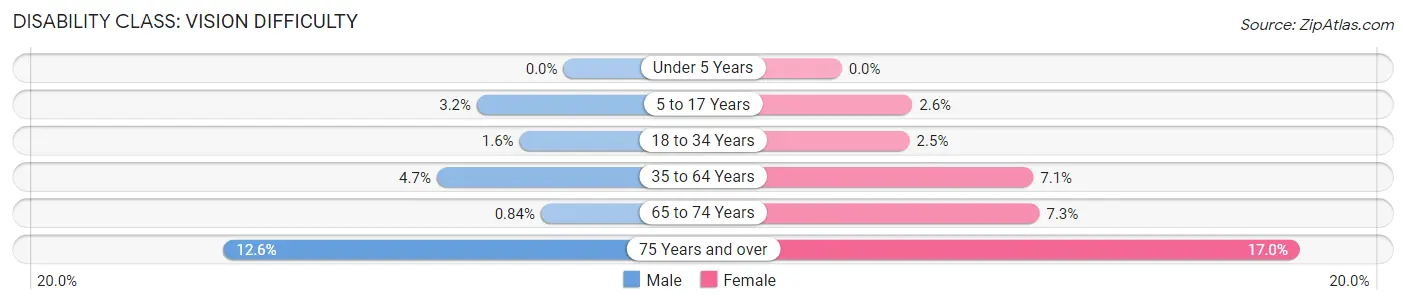
| Age Bracket | Male | Female |
| Under 5 Years | 0 (0.0%) | 0 (0.0%) |
| 5 to 17 Years | 93 (3.2%) | 63 (2.6%) |
| 18 to 34 Years | 64 (1.6%) | 87 (2.5%) |
| 35 to 64 Years | 216 (4.7%) | 348 (7.1%) |
| 65 to 74 Years | 9 (0.8%) | 103 (7.3%) |
| 75 Years and over | 92 (12.6%) | 215 (17.0%) |
Disability Class: Cognitive Difficulty
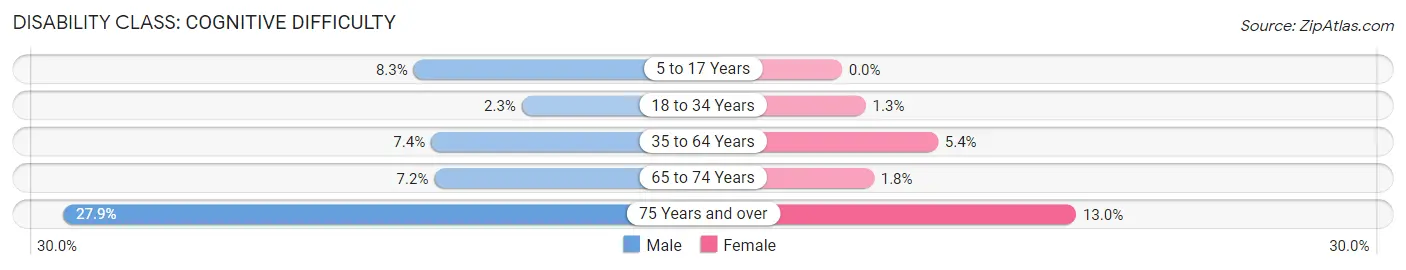
| Age Bracket | Male | Female |
| 5 to 17 Years | 242 (8.3%) | 0 (0.0%) |
| 18 to 34 Years | 91 (2.3%) | 46 (1.3%) |
| 35 to 64 Years | 339 (7.4%) | 262 (5.3%) |
| 65 to 74 Years | 77 (7.2%) | 25 (1.8%) |
| 75 Years and over | 203 (27.9%) | 165 (13.0%) |
Disability Class: Ambulatory Difficulty
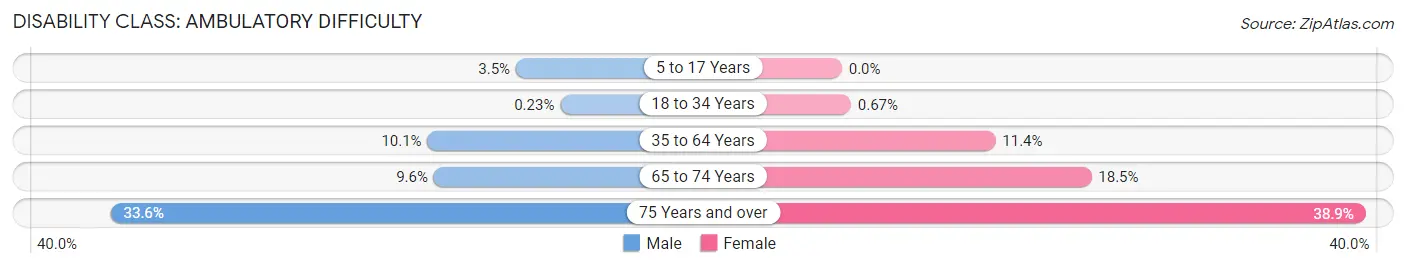
| Age Bracket | Male | Female |
| 5 to 17 Years | 102 (3.5%) | 0 (0.0%) |
| 18 to 34 Years | 9 (0.2%) | 23 (0.7%) |
| 35 to 64 Years | 464 (10.1%) | 558 (11.4%) |
| 65 to 74 Years | 103 (9.6%) | 260 (18.5%) |
| 75 Years and over | 245 (33.6%) | 492 (38.9%) |
Disability Class: Self-Care Difficulty
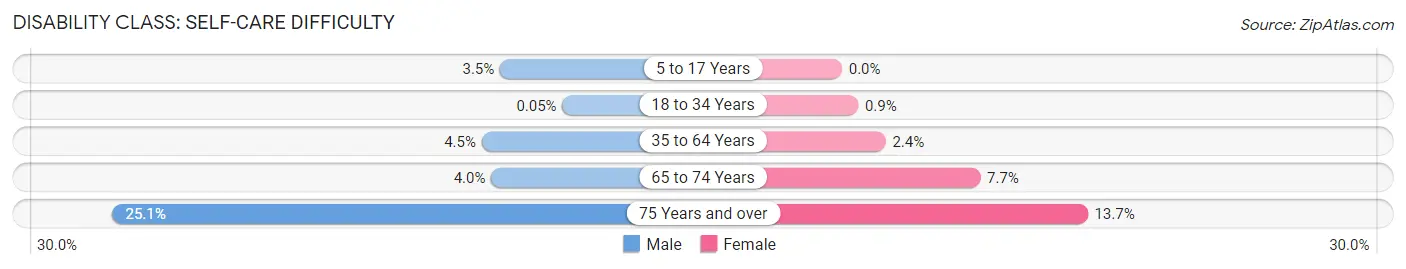
| Age Bracket | Male | Female |
| 5 to 17 Years | 102 (3.5%) | 0 (0.0%) |
| 18 to 34 Years | 2 (0.1%) | 31 (0.9%) |
| 35 to 64 Years | 209 (4.5%) | 119 (2.4%) |
| 65 to 74 Years | 43 (4.0%) | 108 (7.7%) |
| 75 Years and over | 183 (25.1%) | 173 (13.7%) |
Technology Access in Greenville
Computing Device Access in Greenville
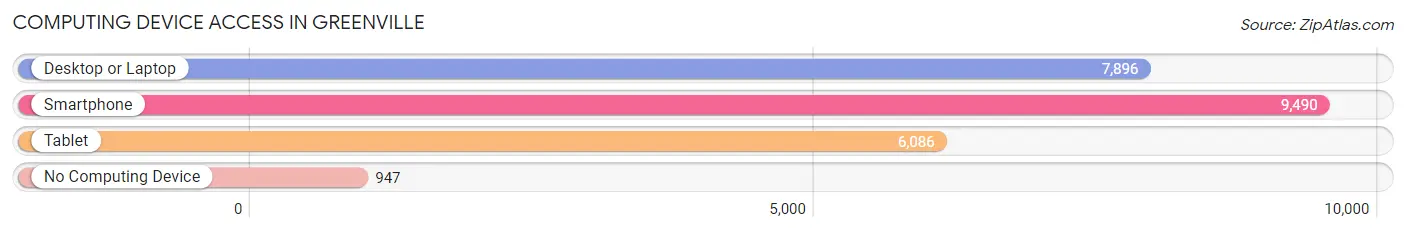
| Device Type | # Households | % Households |
| Desktop or Laptop | 7,896 | 71.4% |
| Smartphone | 9,490 | 85.8% |
| Tablet | 6,086 | 55.0% |
| No Computing Device | 947 | 8.6% |
| Total | 11,064 | 100.0% |
Internet Access in Greenville
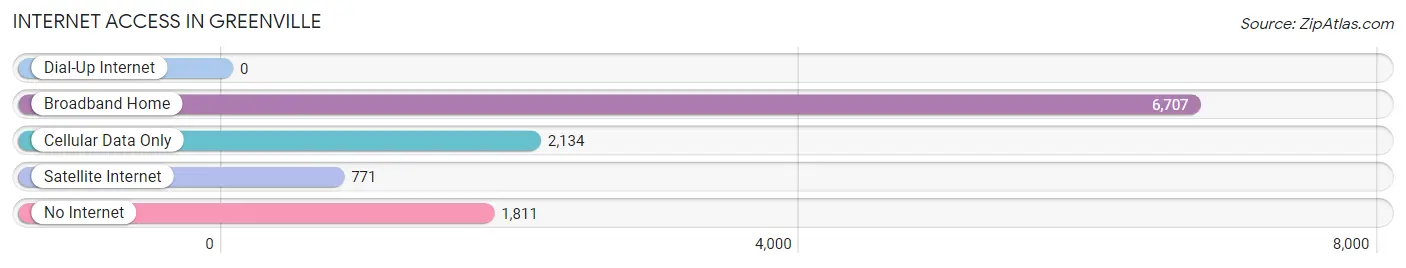
| Internet Type | # Households | % Households |
| Dial-Up Internet | 0 | 0.0% |
| Broadband Home | 6,707 | 60.6% |
| Cellular Data Only | 2,134 | 19.3% |
| Satellite Internet | 771 | 7.0% |
| No Internet | 1,811 | 16.4% |
| Total | 11,064 | 100.0% |
Greenville Summary
Introduction
Greenville is a city located in Hunt County, Texas, United States. It is the county seat and largest city of Hunt County. As of the 2010 census, the city population was 25,557, making it the largest city in the county. Greenville is located approximately 45 miles northeast of Dallas and is part of the Dallas–Fort Worth metroplex.
History
Greenville was founded in 1846 by Thomas J. Beasley and was named after Thomas J. Green, a prominent local businessman. The city was incorporated in 1873 and has grown steadily since then. In the late 19th century, Greenville was a major cotton-producing center and was home to several cotton mills. The city was also a major railroad hub, with several railroads running through it.
In the early 20th century, Greenville experienced a period of growth and prosperity. The city was home to several large businesses, including a cotton mill, a flour mill, a brick factory, and a furniture factory. The city also had a thriving downtown area, with several stores, restaurants, and other businesses.
In the mid-20th century, Greenville experienced a period of decline. The city's economy was hit hard by the Great Depression and the decline of the cotton industry. The city's population also declined, as many people moved away in search of better economic opportunities.
Geography
Greenville is located in Hunt County, Texas, approximately 45 miles northeast of Dallas. The city is situated on the banks of the East Fork of the Trinity River. The city has a total area of 24.2 square miles, of which 24.1 square miles is land and 0.1 square miles is water.
Greenville is located in the Blackland Prairie region of Texas, which is characterized by flat terrain and fertile soil. The city is surrounded by several small towns and rural areas, including Campbell, Commerce, and Wolfe City.
Economy
Greenville's economy is largely based on agriculture and manufacturing. The city is home to several large agricultural operations, including cotton farms, cattle ranches, and poultry farms. The city is also home to several manufacturing companies, including a furniture factory, a brick factory, and a flour mill.
Greenville is also home to several large retail stores, including Walmart, Lowe's, and Home Depot. The city is also home to several restaurants, including several fast food chains and several local restaurants.
Demographics
As of the 2010 census, the city of Greenville had a population of 25,557. The racial makeup of the city was 68.3% White, 24.2% African American, 0.7% Native American, 0.7% Asian, 0.1% Pacific Islander, 4.2% from other races, and 1.9% from two or more races. Hispanic or Latino of any race were 10.2% of the population.
The median income for a household in the city was $37,945, and the median income for a family was $45,945. The per capita income for the city was $20,845. About 17.2% of families and 20.7% of the population were below the poverty line, including 28.2% of those under age 18 and 13.2% of those age 65 or over.
Conclusion
Greenville is a city located in Hunt County, Texas, United States. It is the county seat and largest city of Hunt County. As of the 2010 census, the city population was 25,557, making it the largest city in the county. Greenville is located approximately 45 miles northeast of Dallas and is part of the Dallas–Fort Worth metroplex. The city's economy is largely based on agriculture and manufacturing, and it is home to several large retail stores and restaurants. The city has a diverse population, with a median income of $37,945 and a poverty rate of 17.2%. Greenville is a vibrant city with a rich history and a bright future.
Common Questions
What is Per Capita Income in Greenville?
Per Capita income in Greenville is $29,346.
What is the Median Family Income in Greenville?
Median Family Income in Greenville is $65,048.
What is the Median Household income in Greenville?
Median Household Income in Greenville is $60,510.
What is Income or Wage Gap in Greenville?
Income or Wage Gap in Greenville is 26.9%.
Women in Greenville earn 73.1 cents for every dollar earned by a man.
What is Family Income Deficit in Greenville?
Family Income Deficit in Greenville is $8,290.
Families that are below poverty line in Greenville earn $8,290 less on average than the poverty threshold level.
What is Inequality or Gini Index in Greenville?
Inequality or Gini Index in Greenville is 0.42.
What is the Total Population of Greenville?
Total Population of Greenville is 28,923.
What is the Total Male Population of Greenville?
Total Male Population of Greenville is 14,574.
What is the Total Female Population of Greenville?
Total Female Population of Greenville is 14,349.
What is the Ratio of Males per 100 Females in Greenville?
There are 101.57 Males per 100 Females in Greenville.
What is the Ratio of Females per 100 Males in Greenville?
There are 98.46 Females per 100 Males in Greenville.
What is the Median Population Age in Greenville?
Median Population Age in Greenville is 35.3 Years.
What is the Average Family Size in Greenville
Average Family Size in Greenville is 3.1 People.
What is the Average Household Size in Greenville
Average Household Size in Greenville is 2.5 People.
How Large is the Labor Force in Greenville?
There are 14,584 People in the Labor Forcein in Greenville.
What is the Percentage of People in the Labor Force in Greenville?
64.5% of People are in the Labor Force in Greenville.
What is the Unemployment Rate in Greenville?
Unemployment Rate in Greenville is 6.4%.