Abilene, TX Map & Demographics
Abilene Map
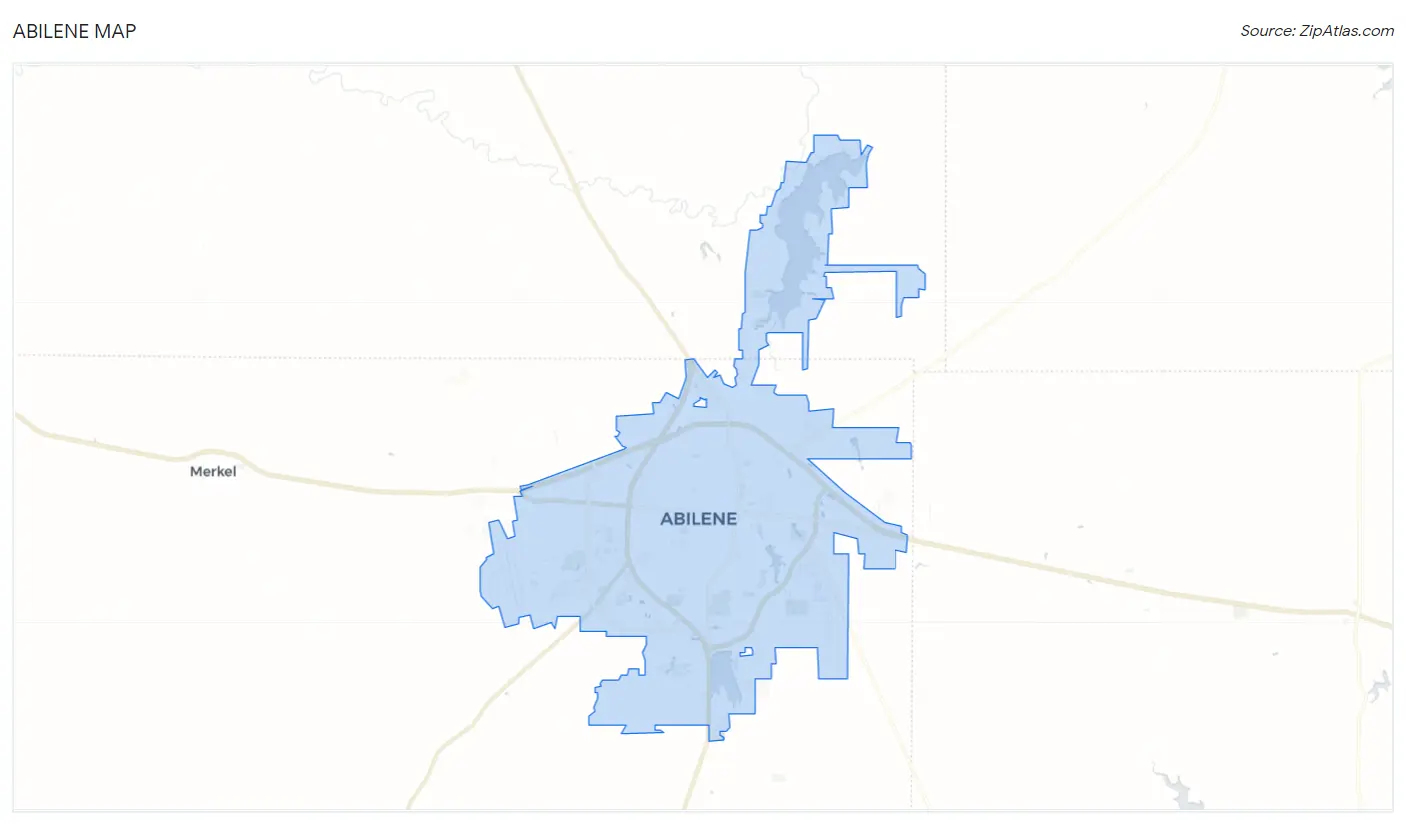
Abilene Overview
$29,272
PER CAPITA INCOME
$75,460
AVG FAMILY INCOME
$59,254
AVG HOUSEHOLD INCOME
20.2%
WAGE / INCOME GAP [ % ]
79.8¢/ $1
WAGE / INCOME GAP [ $ ]
$10,290
FAMILY INCOME DEFICIT
0.45
INEQUALITY / GINI INDEX
126,356
TOTAL POPULATION
64,608
MALE POPULATION
61,748
FEMALE POPULATION
104.63
MALES / 100 FEMALES
95.57
FEMALES / 100 MALES
32.2
MEDIAN AGE
3.0
AVG FAMILY SIZE
2.5
AVG HOUSEHOLD SIZE
62,373
LABOR FORCE [ PEOPLE ]
62.3%
PERCENT IN LABOR FORCE
2.8%
UNEMPLOYMENT RATE
Abilene Area Codes
Income in Abilene
Income Overview in Abilene
Per Capita Income in Abilene is $29,272, while median incomes of families and households are $75,460 and $59,254 respectively.
| Characteristic | Number | Measure |
| Per Capita Income | 126,356 | $29,272 |
| Median Family Income | 29,312 | $75,460 |
| Mean Family Income | 29,312 | $92,110 |
| Median Household Income | 46,030 | $59,254 |
| Mean Household Income | 46,030 | $78,487 |
| Income Deficit | 29,312 | $10,290 |
| Wage / Income Gap (%) | 126,356 | 20.25% |
| Wage / Income Gap ($) | 126,356 | 79.75¢ per $1 |
| Gini / Inequality Index | 126,356 | 0.45 |
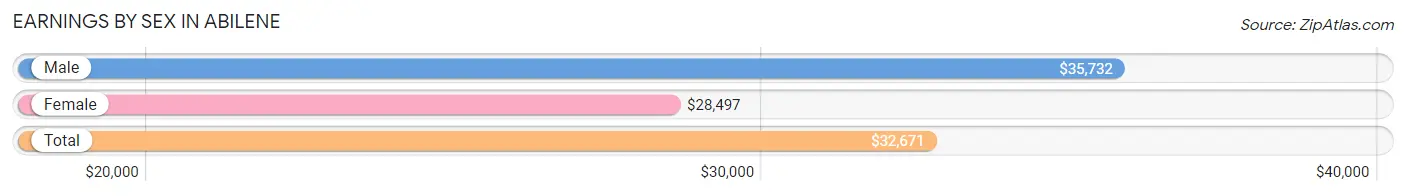
Earnings by Sex in Abilene
Average Earnings in Abilene are $32,671, $35,732 for men and $28,497 for women, a difference of 20.3%.
| Sex | Number | Average Earnings |
| Male | 34,851 (52.5%) | $35,732 |
| Female | 31,543 (47.5%) | $28,497 |
| Total | 66,394 (100.0%) | $32,671 |
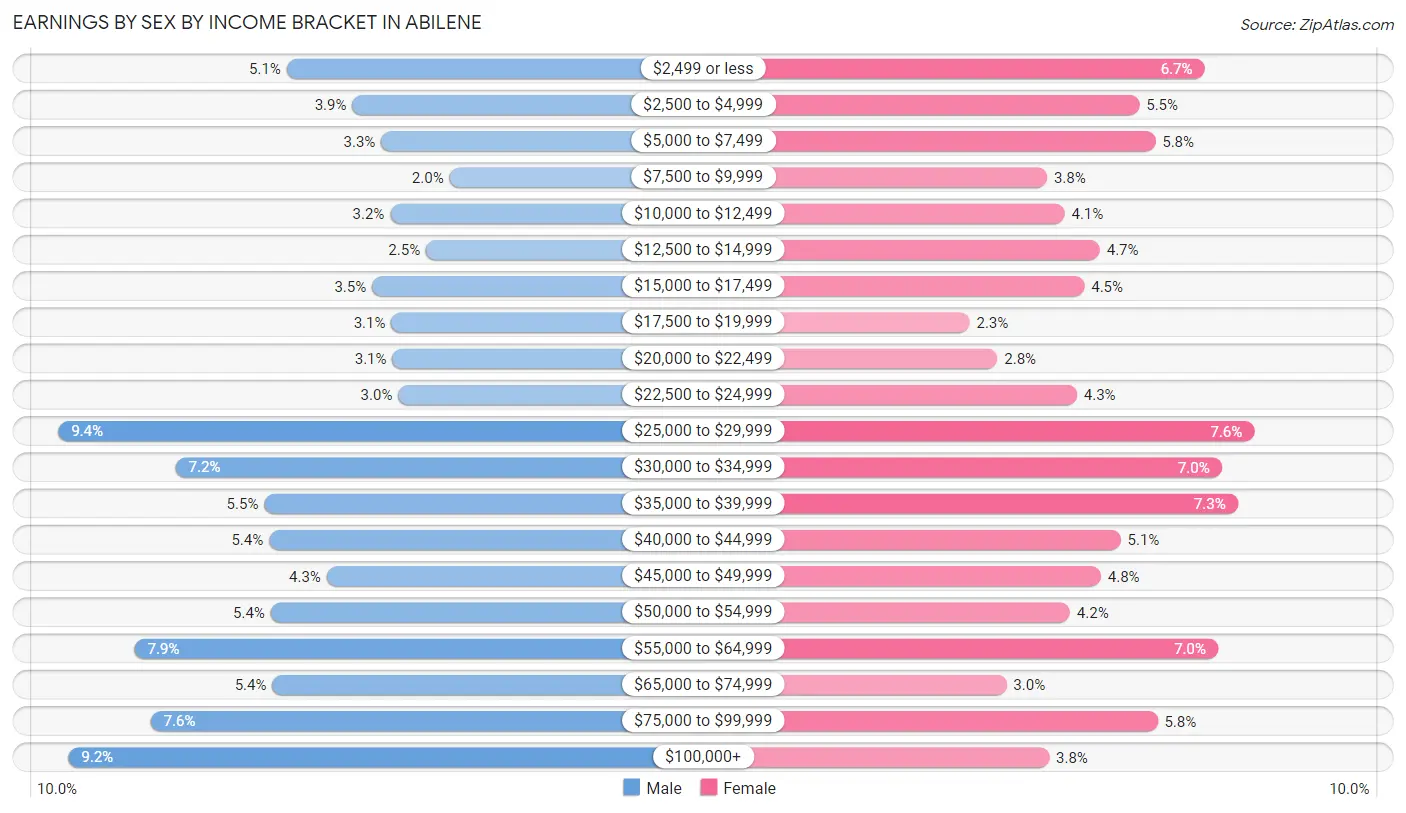
Earnings by Sex by Income Bracket in Abilene
The most common earnings brackets in Abilene are $25,000 to $29,999 for men (3,265 | 9.4%) and $25,000 to $29,999 for women (2,406 | 7.6%).
| Income | Male | Female |
| $2,499 or less | 1,775 (5.1%) | 2,113 (6.7%) |
| $2,500 to $4,999 | 1,346 (3.9%) | 1,730 (5.5%) |
| $5,000 to $7,499 | 1,157 (3.3%) | 1,823 (5.8%) |
| $7,500 to $9,999 | 710 (2.0%) | 1,182 (3.7%) |
| $10,000 to $12,499 | 1,099 (3.2%) | 1,287 (4.1%) |
| $12,500 to $14,999 | 864 (2.5%) | 1,494 (4.7%) |
| $15,000 to $17,499 | 1,216 (3.5%) | 1,403 (4.4%) |
| $17,500 to $19,999 | 1,092 (3.1%) | 727 (2.3%) |
| $20,000 to $22,499 | 1,084 (3.1%) | 889 (2.8%) |
| $22,500 to $24,999 | 1,047 (3.0%) | 1,360 (4.3%) |
| $25,000 to $29,999 | 3,265 (9.4%) | 2,406 (7.6%) |
| $30,000 to $34,999 | 2,498 (7.2%) | 2,215 (7.0%) |
| $35,000 to $39,999 | 1,922 (5.5%) | 2,310 (7.3%) |
| $40,000 to $44,999 | 1,888 (5.4%) | 1,619 (5.1%) |
| $45,000 to $49,999 | 1,513 (4.3%) | 1,503 (4.8%) |
| $50,000 to $54,999 | 1,877 (5.4%) | 1,318 (4.2%) |
| $55,000 to $64,999 | 2,766 (7.9%) | 2,191 (7.0%) |
| $65,000 to $74,999 | 1,867 (5.4%) | 943 (3.0%) |
| $75,000 to $99,999 | 2,664 (7.6%) | 1,835 (5.8%) |
| $100,000+ | 3,201 (9.2%) | 1,195 (3.8%) |
| Total | 34,851 (100.0%) | 31,543 (100.0%) |
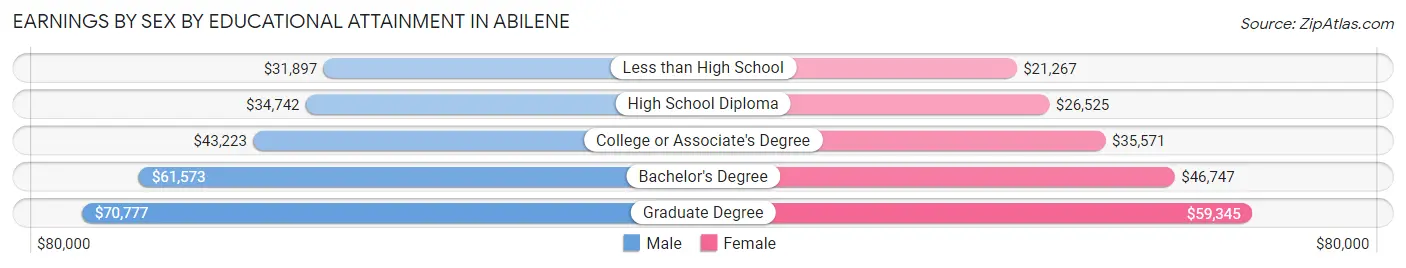
Earnings by Sex by Educational Attainment in Abilene
Average earnings in Abilene are $44,890 for men and $35,507 for women, a difference of 20.9%. Men with an educational attainment of graduate degree enjoy the highest average annual earnings of $70,777, while those with less than high school education earn the least with $31,897. Women with an educational attainment of graduate degree earn the most with the average annual earnings of $59,345, while those with less than high school education have the smallest earnings of $21,267.
| Educational Attainment | Male Income | Female Income |
| Less than High School | $31,897 | $21,267 |
| High School Diploma | $34,742 | $26,525 |
| College or Associate's Degree | $43,223 | $35,571 |
| Bachelor's Degree | $61,573 | $46,747 |
| Graduate Degree | $70,777 | $59,345 |
| Total | $44,890 | $35,507 |
Family Income in Abilene
Family Income Brackets in Abilene
According to the Abilene family income data, there are 5,511 families falling into the $100,000 to $149,999 income range, which is the most common income bracket and makes up 18.8% of all families. Conversely, the $10,000 to $14,999 income bracket is the least frequent group with only 791 families (2.7%) belonging to this category.
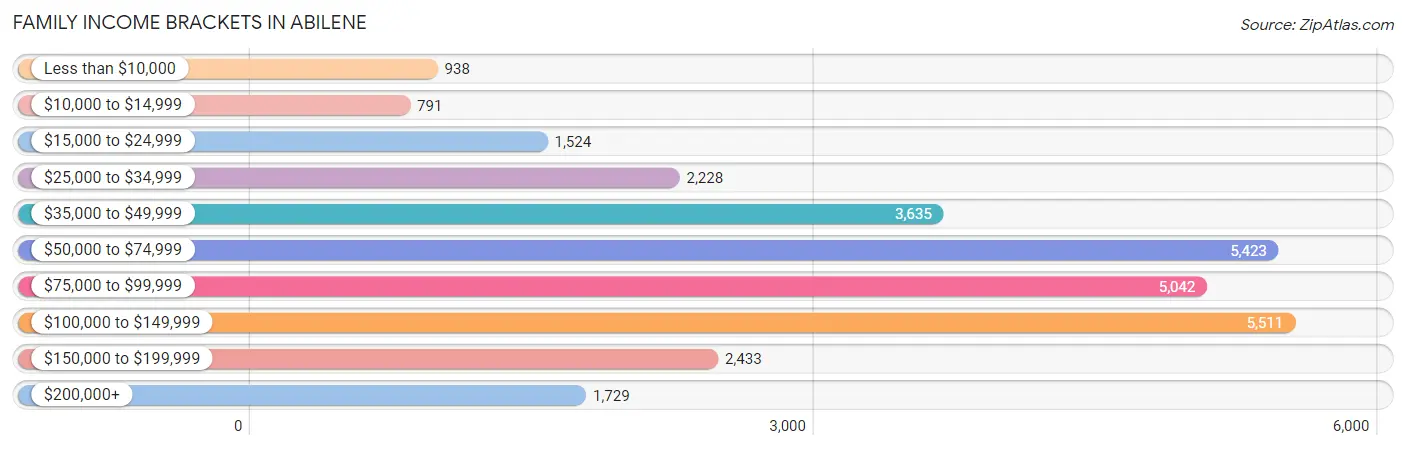
| Income Bracket | # Families | % Families |
| Less than $10,000 | 938 | 3.2% |
| $10,000 to $14,999 | 791 | 2.7% |
| $15,000 to $24,999 | 1,524 | 5.2% |
| $25,000 to $34,999 | 2,228 | 7.6% |
| $35,000 to $49,999 | 3,635 | 12.4% |
| $50,000 to $74,999 | 5,423 | 18.5% |
| $75,000 to $99,999 | 5,042 | 17.2% |
| $100,000 to $149,999 | 5,511 | 18.8% |
| $150,000 to $199,999 | 2,433 | 8.3% |
| $200,000+ | 1,729 | 5.9% |
Family Income by Famaliy Size in Abilene
7+ person families (443 | 1.5%) account for the highest median family income in Abilene with $112,118 per family, while 2-person families (13,994 | 47.7%) have the highest median income of $35,009 per family member.
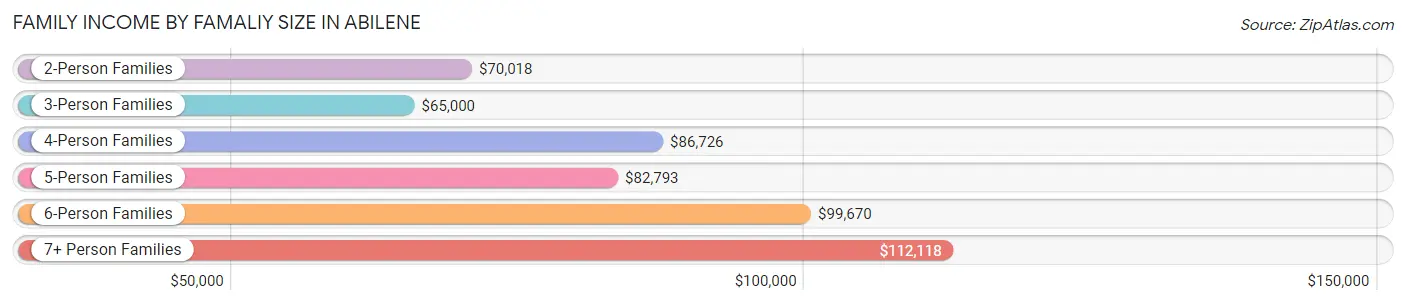
| Income Bracket | # Families | Median Income |
| 2-Person Families | 13,994 (47.7%) | $70,018 |
| 3-Person Families | 6,396 (21.8%) | $65,000 |
| 4-Person Families | 5,474 (18.7%) | $86,726 |
| 5-Person Families | 2,213 (7.5%) | $82,793 |
| 6-Person Families | 792 (2.7%) | $99,670 |
| 7+ Person Families | 443 (1.5%) | $112,118 |
| Total | 29,312 (100.0%) | $75,460 |
Family Income by Number of Earners in Abilene
The median family income in Abilene is $75,460, with families comprising 3+ earners (2,492) having the highest median family income of $113,496, while families with no earners (3,652) have the lowest median family income of $48,725, accounting for 8.5% and 12.5% of families, respectively.
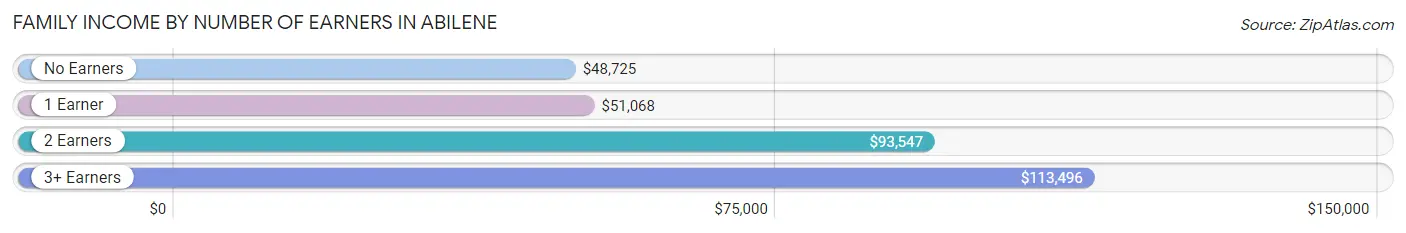
| Number of Earners | # Families | Median Income |
| No Earners | 3,652 (12.5%) | $48,725 |
| 1 Earner | 10,118 (34.5%) | $51,068 |
| 2 Earners | 13,050 (44.5%) | $93,547 |
| 3+ Earners | 2,492 (8.5%) | $113,496 |
| Total | 29,312 (100.0%) | $75,460 |
Household Income in Abilene
Household Income Brackets in Abilene
With 8,838 households falling in the category, the $50,000 to $74,999 income range is the most frequent in Abilene, accounting for 19.2% of all households. In contrast, only 2,071 households (4.5%) fall into the $200,000+ income bracket, making it the least populous group.
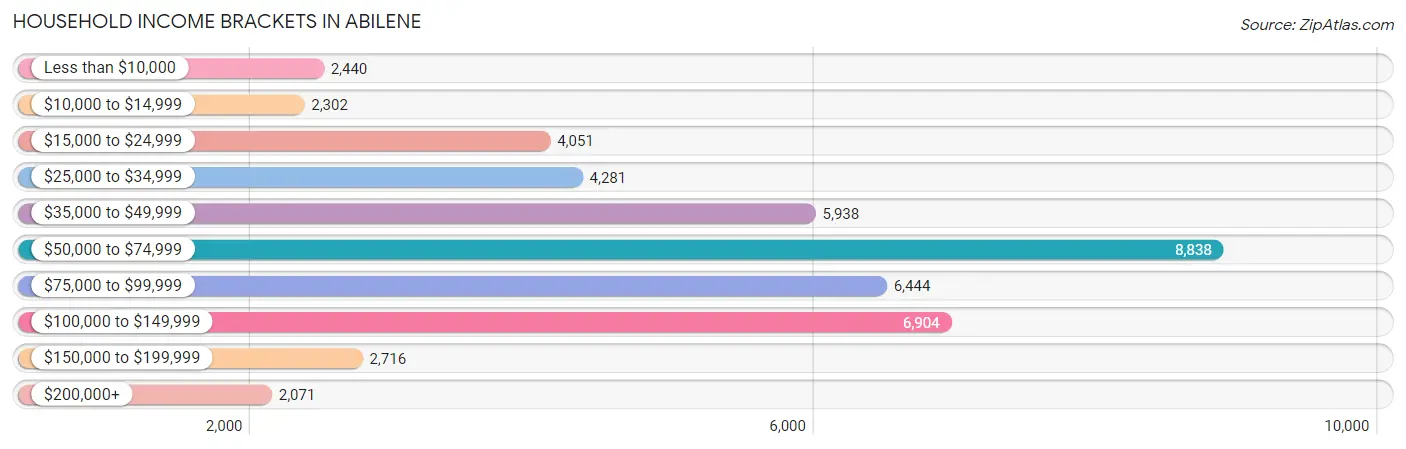
| Income Bracket | # Households | % Households |
| Less than $10,000 | 2,440 | 5.3% |
| $10,000 to $14,999 | 2,302 | 5.0% |
| $15,000 to $24,999 | 4,051 | 8.8% |
| $25,000 to $34,999 | 4,281 | 9.3% |
| $35,000 to $49,999 | 5,938 | 12.9% |
| $50,000 to $74,999 | 8,838 | 19.2% |
| $75,000 to $99,999 | 6,444 | 14.0% |
| $100,000 to $149,999 | 6,904 | 15.0% |
| $150,000 to $199,999 | 2,716 | 5.9% |
| $200,000+ | 2,071 | 4.5% |
Household Income by Householder Age in Abilene
The median household income in Abilene is $59,254, with the highest median household income of $69,448 found in the 45 to 64 years age bracket for the primary householder. A total of 12,631 households (27.4%) fall into this category. Meanwhile, the 15 to 24 years age bracket for the primary householder has the lowest median household income of $38,639, with 5,595 households (12.2%) in this group.
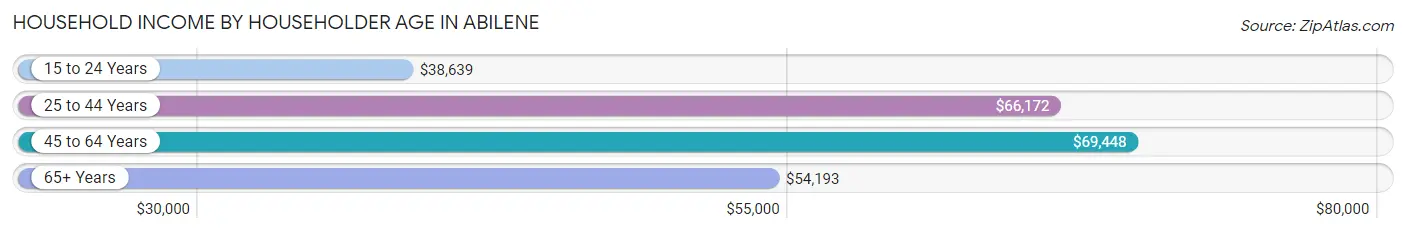
| Income Bracket | # Households | Median Income |
| 15 to 24 Years | 5,595 (12.2%) | $38,639 |
| 25 to 44 Years | 17,190 (37.3%) | $66,172 |
| 45 to 64 Years | 12,631 (27.4%) | $69,448 |
| 65+ Years | 10,614 (23.1%) | $54,193 |
| Total | 46,030 (100.0%) | $59,254 |
Poverty in Abilene
Income Below Poverty by Sex and Age in Abilene
With 14.1% poverty level for males and 17.6% for females among the residents of Abilene, 18 to 24 year old males and 18 to 24 year old females are the most vulnerable to poverty, with 1,732 males (23.4%) and 2,298 females (29.3%) in their respective age groups living below the poverty level.
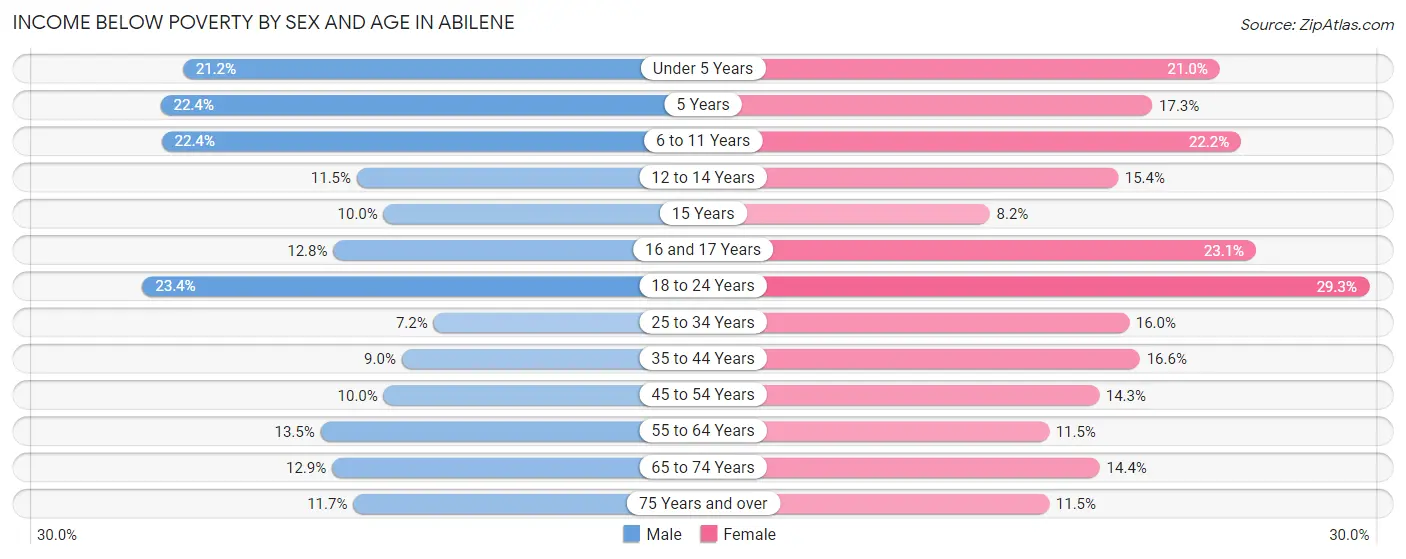
| Age Bracket | Male | Female |
| Under 5 Years | 874 (21.2%) | 845 (21.0%) |
| 5 Years | 144 (22.4%) | 118 (17.3%) |
| 6 to 11 Years | 1,101 (22.4%) | 957 (22.2%) |
| 12 to 14 Years | 271 (11.5%) | 412 (15.4%) |
| 15 Years | 92 (10.0%) | 81 (8.2%) |
| 16 and 17 Years | 181 (12.8%) | 336 (23.1%) |
| 18 to 24 Years | 1,732 (23.4%) | 2,298 (29.3%) |
| 25 to 34 Years | 640 (7.2%) | 1,364 (16.0%) |
| 35 to 44 Years | 671 (9.0%) | 1,229 (16.6%) |
| 45 to 54 Years | 480 (10.0%) | 728 (14.3%) |
| 55 to 64 Years | 782 (13.5%) | 747 (11.5%) |
| 65 to 74 Years | 517 (12.9%) | 705 (14.4%) |
| 75 Years and over | 337 (11.7%) | 516 (11.5%) |
| Total | 7,822 (14.1%) | 10,336 (17.6%) |
Income Above Poverty by Sex and Age in Abilene
According to the poverty statistics in Abilene, males aged 25 to 34 years and females aged 15 years are the age groups that are most secure financially, with 92.8% of males and 91.8% of females in these age groups living above the poverty line.
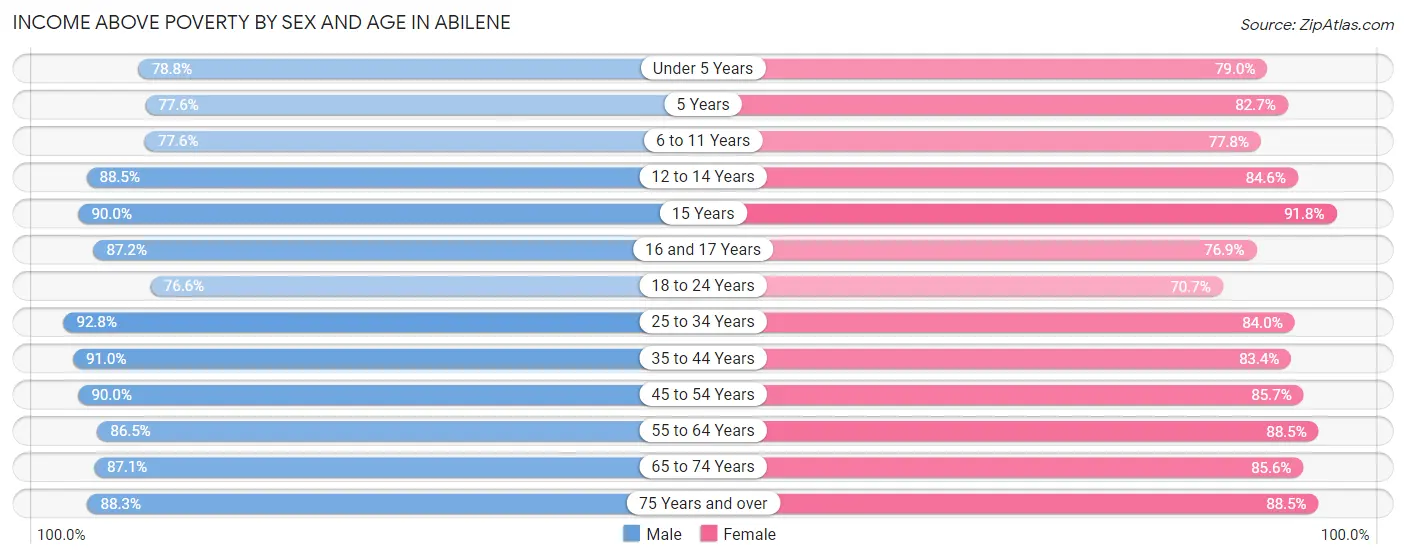
| Age Bracket | Male | Female |
| Under 5 Years | 3,251 (78.8%) | 3,171 (79.0%) |
| 5 Years | 498 (77.6%) | 565 (82.7%) |
| 6 to 11 Years | 3,821 (77.6%) | 3,348 (77.8%) |
| 12 to 14 Years | 2,085 (88.5%) | 2,269 (84.6%) |
| 15 Years | 827 (90.0%) | 903 (91.8%) |
| 16 and 17 Years | 1,232 (87.2%) | 1,121 (76.9%) |
| 18 to 24 Years | 5,657 (76.6%) | 5,535 (70.7%) |
| 25 to 34 Years | 8,206 (92.8%) | 7,174 (84.0%) |
| 35 to 44 Years | 6,782 (91.0%) | 6,180 (83.4%) |
| 45 to 54 Years | 4,317 (90.0%) | 4,359 (85.7%) |
| 55 to 64 Years | 5,001 (86.5%) | 5,737 (88.5%) |
| 65 to 74 Years | 3,498 (87.1%) | 4,203 (85.6%) |
| 75 Years and over | 2,544 (88.3%) | 3,961 (88.5%) |
| Total | 47,719 (85.9%) | 48,526 (82.4%) |
Income Below Poverty Among Married-Couple Families in Abilene
The poverty statistics for married-couple families in Abilene show that 4.6% or 971 of the total 20,884 families live below the poverty line. Families with 3 or 4 children have the highest poverty rate of 11.7%, comprising of 236 families. On the other hand, families with no children have the lowest poverty rate of 3.2%, which includes 381 families.
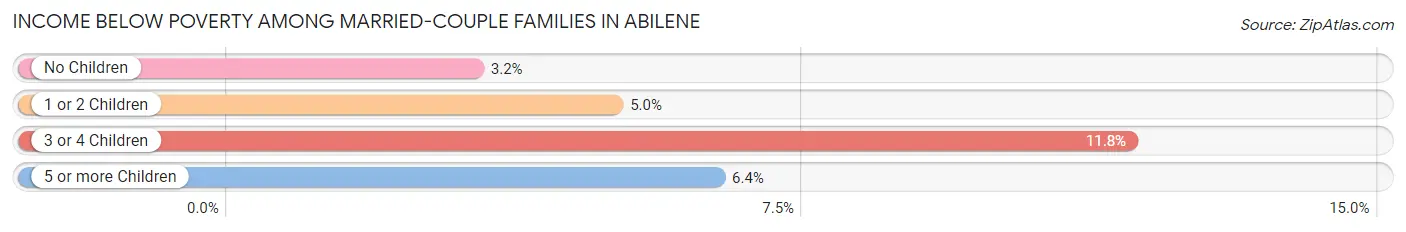
| Children | Above Poverty | Below Poverty |
| No Children | 11,506 (96.8%) | 381 (3.2%) |
| 1 or 2 Children | 6,473 (95.0%) | 343 (5.0%) |
| 3 or 4 Children | 1,772 (88.2%) | 236 (11.7%) |
| 5 or more Children | 162 (93.6%) | 11 (6.4%) |
| Total | 19,913 (95.4%) | 971 (4.6%) |
Income Below Poverty Among Single-Parent Households in Abilene
According to the poverty data in Abilene, 14.4% or 325 single-father households and 30.3% or 1,867 single-mother households are living below the poverty line. Among single-father households, those with 3 or 4 children have the highest poverty rate, with 87 households (58.4%) experiencing poverty. Likewise, among single-mother households, those with 5 or more children have the highest poverty rate, with 31 households (63.3%) falling below the poverty line.
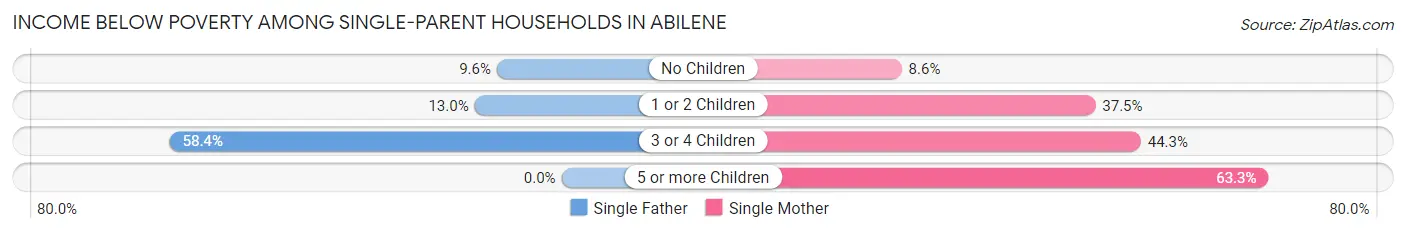
| Children | Single Father | Single Mother |
| No Children | 103 (9.6%) | 155 (8.6%) |
| 1 or 2 Children | 135 (13.0%) | 1,287 (37.5%) |
| 3 or 4 Children | 87 (58.4%) | 394 (44.3%) |
| 5 or more Children | 0 (0.0%) | 31 (63.3%) |
| Total | 325 (14.4%) | 1,867 (30.3%) |
Income Below Poverty Among Married-Couple vs Single-Parent Households in Abilene
The poverty data for Abilene shows that 971 of the married-couple family households (4.6%) and 2,192 of the single-parent households (26.0%) are living below the poverty level. Within the married-couple family households, those with 3 or 4 children have the highest poverty rate, with 236 households (11.7%) falling below the poverty line. Among the single-parent households, those with 5 or more children have the highest poverty rate, with 31 household (59.6%) living below poverty.
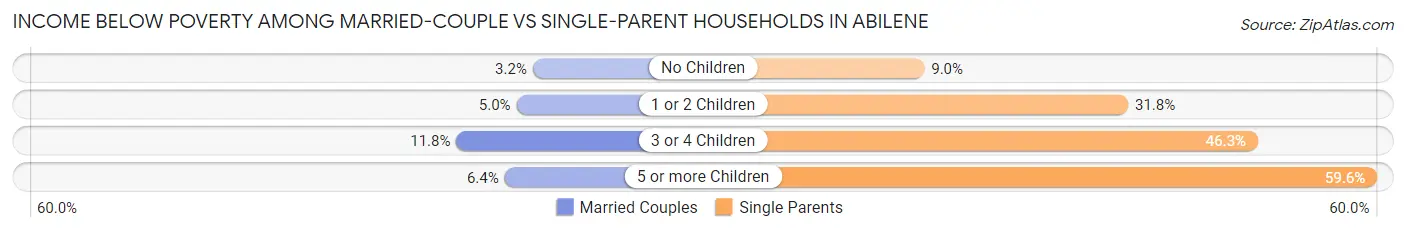
| Children | Married-Couple Families | Single-Parent Households |
| No Children | 381 (3.2%) | 258 (9.0%) |
| 1 or 2 Children | 343 (5.0%) | 1,422 (31.8%) |
| 3 or 4 Children | 236 (11.7%) | 481 (46.3%) |
| 5 or more Children | 11 (6.4%) | 31 (59.6%) |
| Total | 971 (4.6%) | 2,192 (26.0%) |
Race in Abilene
The most populous races in Abilene are White / Caucasian (86,031 | 68.1%), Hispanic or Latino (34,917 | 27.6%), and Two or more Races (14,957 | 11.8%).
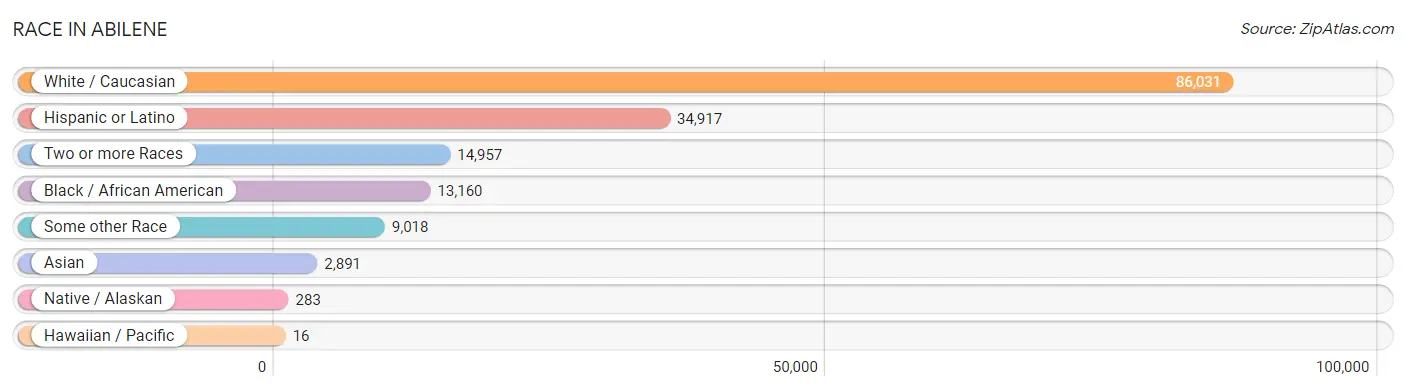
| Race | # Population | % Population |
| Asian | 2,891 | 2.3% |
| Black / African American | 13,160 | 10.4% |
| Hawaiian / Pacific | 16 | 0.0% |
| Hispanic or Latino | 34,917 | 27.6% |
| Native / Alaskan | 283 | 0.2% |
| White / Caucasian | 86,031 | 68.1% |
| Two or more Races | 14,957 | 11.8% |
| Some other Race | 9,018 | 7.1% |
| Total | 126,356 | 100.0% |
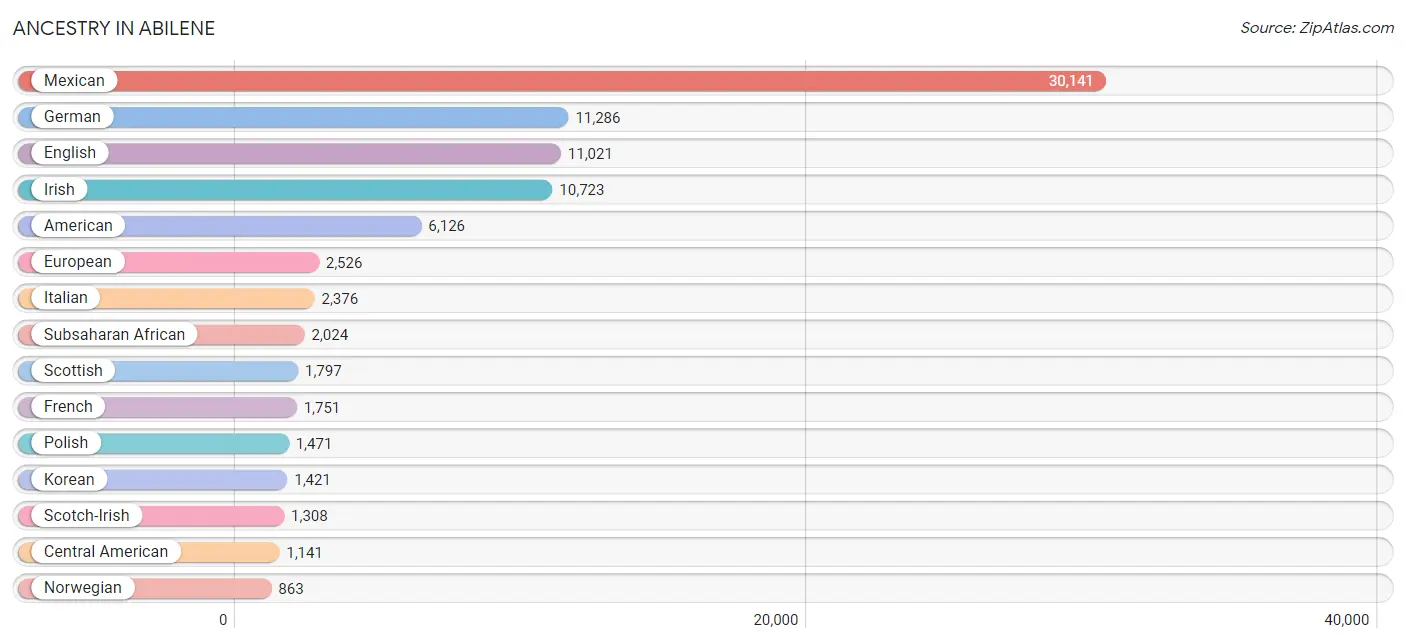
Ancestry in Abilene
The most populous ancestries reported in Abilene are Mexican (30,141 | 23.8%), German (11,286 | 8.9%), English (11,021 | 8.7%), Irish (10,723 | 8.5%), and American (6,126 | 4.9%), together accounting for 54.8% of all Abilene residents.
| Ancestry | # Population | % Population |
| African | 316 | 0.3% |
| Albanian | 10 | 0.0% |
| American | 6,126 | 4.9% |
| Apache | 54 | 0.0% |
| Arab | 157 | 0.1% |
| Argentinean | 17 | 0.0% |
| Armenian | 67 | 0.1% |
| Austrian | 41 | 0.0% |
| Belgian | 8 | 0.0% |
| Belizean | 18 | 0.0% |
| Bhutanese | 160 | 0.1% |
| Blackfeet | 70 | 0.1% |
| Brazilian | 7 | 0.0% |
| British | 582 | 0.5% |
| Burmese | 433 | 0.3% |
| Cajun | 114 | 0.1% |
| Canadian | 158 | 0.1% |
| Central American | 1,141 | 0.9% |
| Central American Indian | 143 | 0.1% |
| Cherokee | 513 | 0.4% |
| Chippewa | 64 | 0.1% |
| Choctaw | 154 | 0.1% |
| Colombian | 235 | 0.2% |
| Comanche | 44 | 0.0% |
| Costa Rican | 11 | 0.0% |
| Creek | 8 | 0.0% |
| Croatian | 7 | 0.0% |
| Crow | 39 | 0.0% |
| Cuban | 319 | 0.3% |
| Czech | 220 | 0.2% |
| Czechoslovakian | 69 | 0.1% |
| Danish | 288 | 0.2% |
| Dominican | 6 | 0.0% |
| Dutch | 859 | 0.7% |
| Dutch West Indian | 42 | 0.0% |
| Eastern European | 103 | 0.1% |
| English | 11,021 | 8.7% |
| Ethiopian | 115 | 0.1% |
| European | 2,526 | 2.0% |
| Filipino | 105 | 0.1% |
| Finnish | 99 | 0.1% |
| French | 1,751 | 1.4% |
| French Canadian | 439 | 0.4% |
| German | 11,286 | 8.9% |
| Ghanaian | 10 | 0.0% |
| Greek | 83 | 0.1% |
| Guamanian / Chamorro | 16 | 0.0% |
| Guatemalan | 151 | 0.1% |
| Haitian | 15 | 0.0% |
| Honduran | 102 | 0.1% |
| Hopi | 38 | 0.0% |
| Hungarian | 104 | 0.1% |
| Icelander | 22 | 0.0% |
| Indian (Asian) | 204 | 0.2% |
| Indonesian | 43 | 0.0% |
| Iranian | 11 | 0.0% |
| Irish | 10,723 | 8.5% |
| Israeli | 10 | 0.0% |
| Italian | 2,376 | 1.9% |
| Jamaican | 691 | 0.5% |
| Japanese | 118 | 0.1% |
| Kenyan | 105 | 0.1% |
| Kiowa | 3 | 0.0% |
| Korean | 1,421 | 1.1% |
| Latvian | 67 | 0.1% |
| Lebanese | 93 | 0.1% |
| Lithuanian | 25 | 0.0% |
| Macedonian | 13 | 0.0% |
| Malaysian | 8 | 0.0% |
| Menominee | 19 | 0.0% |
| Mexican | 30,141 | 23.8% |
| Mexican American Indian | 120 | 0.1% |
| Moroccan | 48 | 0.0% |
| Native Hawaiian | 10 | 0.0% |
| Navajo | 63 | 0.1% |
| New Zealander | 17 | 0.0% |
| Nicaraguan | 378 | 0.3% |
| Nigerian | 19 | 0.0% |
| Northern European | 65 | 0.1% |
| Norwegian | 863 | 0.7% |
| Osage | 19 | 0.0% |
| Pakistani | 61 | 0.1% |
| Panamanian | 32 | 0.0% |
| Pennsylvania German | 84 | 0.1% |
| Peruvian | 13 | 0.0% |
| Polish | 1,471 | 1.2% |
| Portuguese | 14 | 0.0% |
| Puerto Rican | 672 | 0.5% |
| Romanian | 12 | 0.0% |
| Russian | 148 | 0.1% |
| Salvadoran | 467 | 0.4% |
| Samoan | 8 | 0.0% |
| Scandinavian | 217 | 0.2% |
| Scotch-Irish | 1,308 | 1.0% |
| Scottish | 1,797 | 1.4% |
| Sioux | 28 | 0.0% |
| Slavic | 8 | 0.0% |
| Slovene | 37 | 0.0% |
| South American | 276 | 0.2% |
| Spaniard | 437 | 0.4% |
| Spanish | 546 | 0.4% |
| Sri Lankan | 507 | 0.4% |
| Subsaharan African | 2,024 | 1.6% |
| Sudanese | 28 | 0.0% |
| Swedish | 799 | 0.6% |
| Swiss | 88 | 0.1% |
| Thai | 238 | 0.2% |
| Trinidadian and Tobagonian | 23 | 0.0% |
| Turkish | 31 | 0.0% |
| Ukrainian | 44 | 0.0% |
| Uruguayan | 11 | 0.0% |
| Ute | 118 | 0.1% |
| Welsh | 337 | 0.3% |
| West Indian | 81 | 0.1% |
| Yugoslavian | 37 | 0.0% | View All 115 Rows |
Immigrants in Abilene
The most numerous immigrant groups reported in Abilene came from Latin America (4,807 | 3.8%), Central America (4,154 | 3.3%), Mexico (3,478 | 2.8%), Asia (1,957 | 1.5%), and Africa (1,526 | 1.2%), together accounting for 12.6% of all Abilene residents.
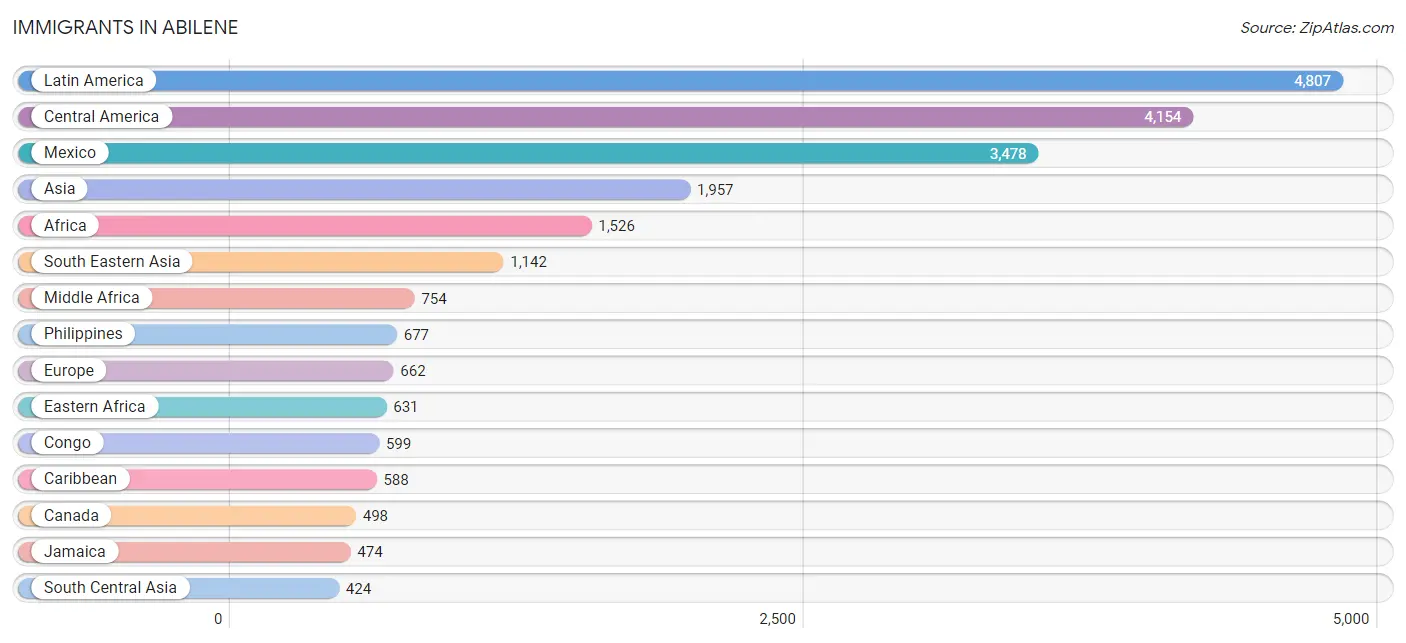
| Immigration Origin | # Population | % Population |
| Africa | 1,526 | 1.2% |
| Asia | 1,957 | 1.5% |
| Australia | 25 | 0.0% |
| Austria | 13 | 0.0% |
| Belize | 32 | 0.0% |
| Cambodia | 68 | 0.1% |
| Cameroon | 33 | 0.0% |
| Canada | 498 | 0.4% |
| Caribbean | 588 | 0.5% |
| Central America | 4,154 | 3.3% |
| China | 105 | 0.1% |
| Colombia | 33 | 0.0% |
| Congo | 599 | 0.5% |
| Costa Rica | 11 | 0.0% |
| Cuba | 100 | 0.1% |
| Denmark | 61 | 0.1% |
| Dominican Republic | 6 | 0.0% |
| Eastern Africa | 631 | 0.5% |
| Eastern Asia | 360 | 0.3% |
| Eastern Europe | 72 | 0.1% |
| El Salvador | 189 | 0.2% |
| England | 102 | 0.1% |
| Ethiopia | 57 | 0.1% |
| Europe | 662 | 0.5% |
| France | 31 | 0.0% |
| Germany | 100 | 0.1% |
| Ghana | 10 | 0.0% |
| Guatemala | 68 | 0.1% |
| Honduras | 168 | 0.1% |
| India | 109 | 0.1% |
| Iran | 11 | 0.0% |
| Ireland | 7 | 0.0% |
| Italy | 24 | 0.0% |
| Jamaica | 474 | 0.4% |
| Japan | 68 | 0.1% |
| Kenya | 223 | 0.2% |
| Korea | 187 | 0.2% |
| Latin America | 4,807 | 3.8% |
| Latvia | 49 | 0.0% |
| Mexico | 3,478 | 2.8% |
| Middle Africa | 754 | 0.6% |
| Morocco | 10 | 0.0% |
| Nepal | 235 | 0.2% |
| Netherlands | 5 | 0.0% |
| Nicaragua | 196 | 0.2% |
| Nigeria | 66 | 0.1% |
| Northern Africa | 10 | 0.0% |
| Northern Europe | 390 | 0.3% |
| Oceania | 41 | 0.0% |
| Pakistan | 8 | 0.0% |
| Panama | 12 | 0.0% |
| Peru | 13 | 0.0% |
| Philippines | 677 | 0.5% |
| Poland | 23 | 0.0% |
| South Africa | 16 | 0.0% |
| South America | 65 | 0.1% |
| South Central Asia | 424 | 0.3% |
| South Eastern Asia | 1,142 | 0.9% |
| Southern Europe | 51 | 0.0% |
| Spain | 16 | 0.0% |
| Thailand | 15 | 0.0% |
| Trinidad and Tobago | 8 | 0.0% |
| Turkey | 31 | 0.0% |
| Uruguay | 11 | 0.0% |
| Venezuela | 8 | 0.0% |
| Vietnam | 312 | 0.3% |
| Western Africa | 100 | 0.1% |
| Western Asia | 31 | 0.0% |
| Western Europe | 149 | 0.1% |
| Zaire | 122 | 0.1% |
| Zimbabwe | 6 | 0.0% | View All 71 Rows |
Sex and Age in Abilene
Sex and Age in Abilene
The most populous age groups in Abilene are 20 to 24 Years (7,712 | 11.9%) for men and 20 to 24 Years (7,068 | 11.5%) for women.
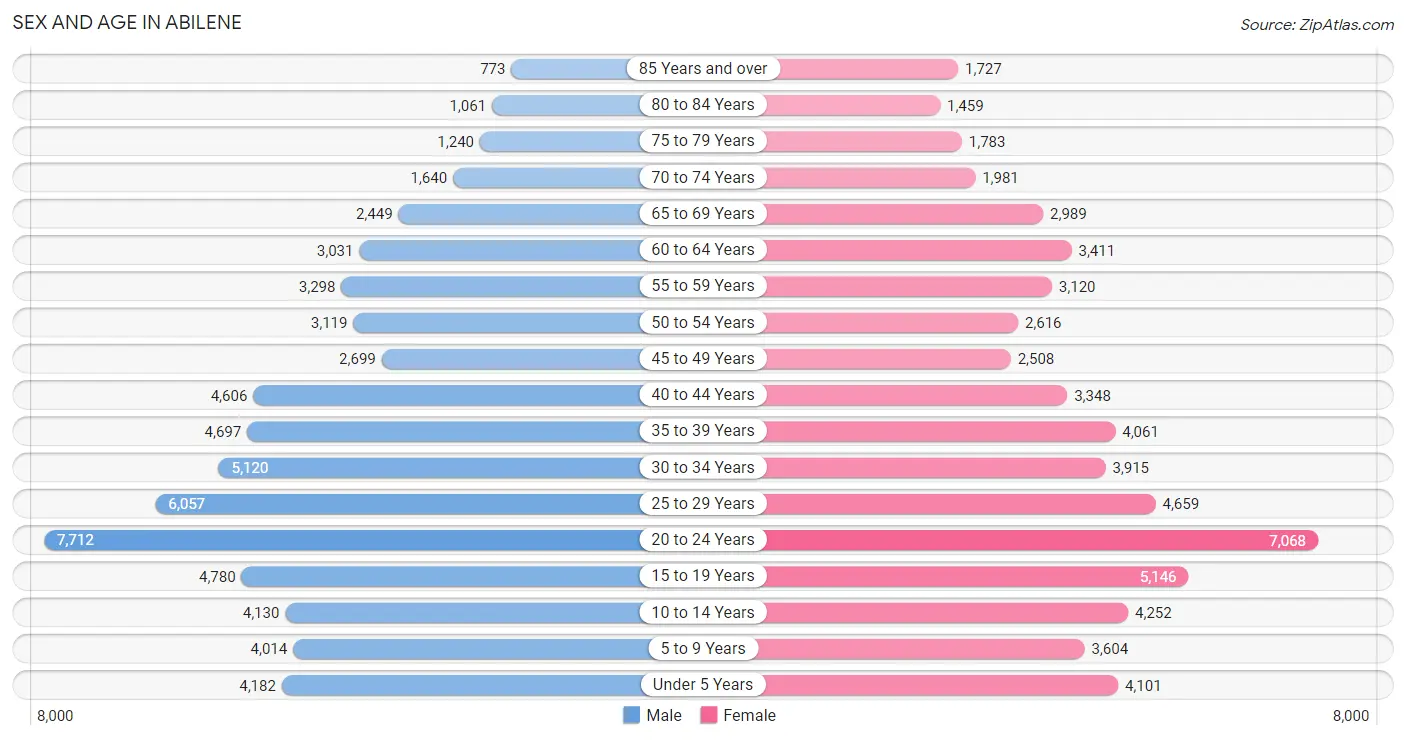
| Age Bracket | Male | Female |
| Under 5 Years | 4,182 (6.5%) | 4,101 (6.6%) |
| 5 to 9 Years | 4,014 (6.2%) | 3,604 (5.8%) |
| 10 to 14 Years | 4,130 (6.4%) | 4,252 (6.9%) |
| 15 to 19 Years | 4,780 (7.4%) | 5,146 (8.3%) |
| 20 to 24 Years | 7,712 (11.9%) | 7,068 (11.5%) |
| 25 to 29 Years | 6,057 (9.4%) | 4,659 (7.5%) |
| 30 to 34 Years | 5,120 (7.9%) | 3,915 (6.3%) |
| 35 to 39 Years | 4,697 (7.3%) | 4,061 (6.6%) |
| 40 to 44 Years | 4,606 (7.1%) | 3,348 (5.4%) |
| 45 to 49 Years | 2,699 (4.2%) | 2,508 (4.1%) |
| 50 to 54 Years | 3,119 (4.8%) | 2,616 (4.2%) |
| 55 to 59 Years | 3,298 (5.1%) | 3,120 (5.1%) |
| 60 to 64 Years | 3,031 (4.7%) | 3,411 (5.5%) |
| 65 to 69 Years | 2,449 (3.8%) | 2,989 (4.8%) |
| 70 to 74 Years | 1,640 (2.5%) | 1,981 (3.2%) |
| 75 to 79 Years | 1,240 (1.9%) | 1,783 (2.9%) |
| 80 to 84 Years | 1,061 (1.6%) | 1,459 (2.4%) |
| 85 Years and over | 773 (1.2%) | 1,727 (2.8%) |
| Total | 64,608 (100.0%) | 61,748 (100.0%) |
Families and Households in Abilene
Median Family Size in Abilene
The median family size in Abilene is 3.03 persons per family, with married-couple families (20,884 | 71.3%) accounting for the largest median family size of 3.07 persons per family. On the other hand, single male/father families (2,263 | 7.7%) represent the smallest median family size with 2.70 persons per family.
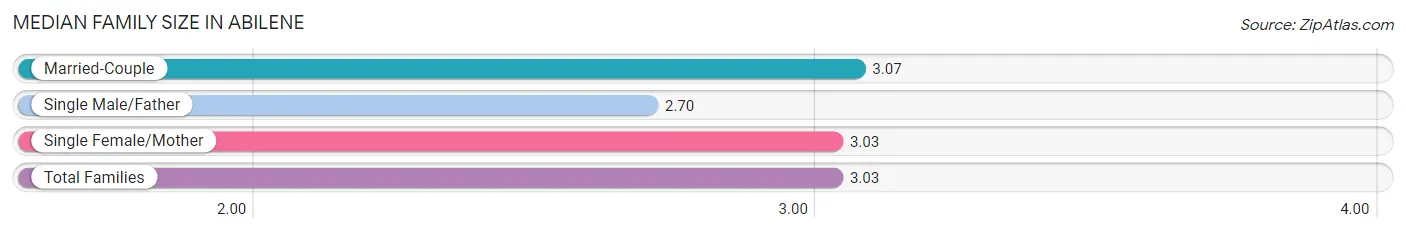
| Family Type | # Families | Family Size |
| Married-Couple | 20,884 (71.3%) | 3.07 |
| Single Male/Father | 2,263 (7.7%) | 2.70 |
| Single Female/Mother | 6,165 (21.0%) | 3.03 |
| Total Families | 29,312 (100.0%) | 3.03 |
Median Household Size in Abilene
The median household size in Abilene is 2.47 persons per household, with single female/mother households (6,165 | 13.4%) accounting for the largest median household size of 3.27 persons per household. non-family households (16,718 | 36.3%) represent the smallest median household size with 1.32 persons per household.
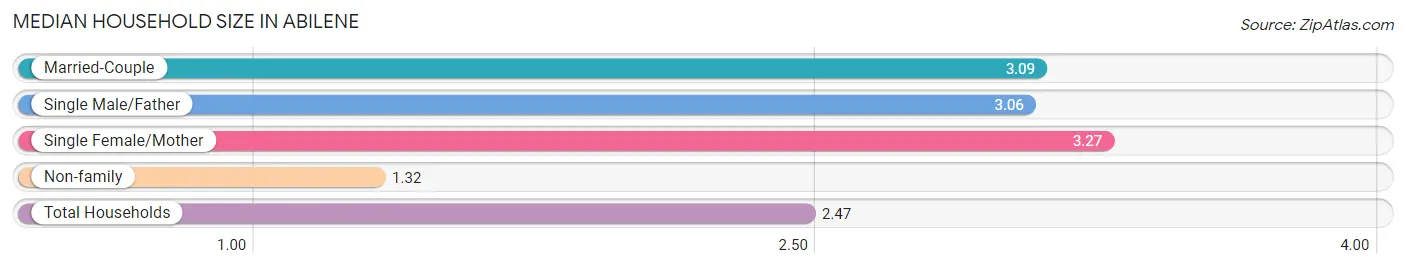
| Household Type | # Households | Household Size |
| Married-Couple | 20,884 (45.4%) | 3.09 |
| Single Male/Father | 2,263 (4.9%) | 3.06 |
| Single Female/Mother | 6,165 (13.4%) | 3.27 |
| Non-family | 16,718 (36.3%) | 1.32 |
| Total Households | 46,030 (100.0%) | 2.47 |
Household Size by Marriage Status in Abilene
Out of a total of 46,030 households in Abilene, 29,312 (63.7%) are family households, while 16,718 (36.3%) are nonfamily households. The most numerous type of family households are 2-person households, comprising 12,898, and the most common type of nonfamily households are 1-person households, comprising 12,778.
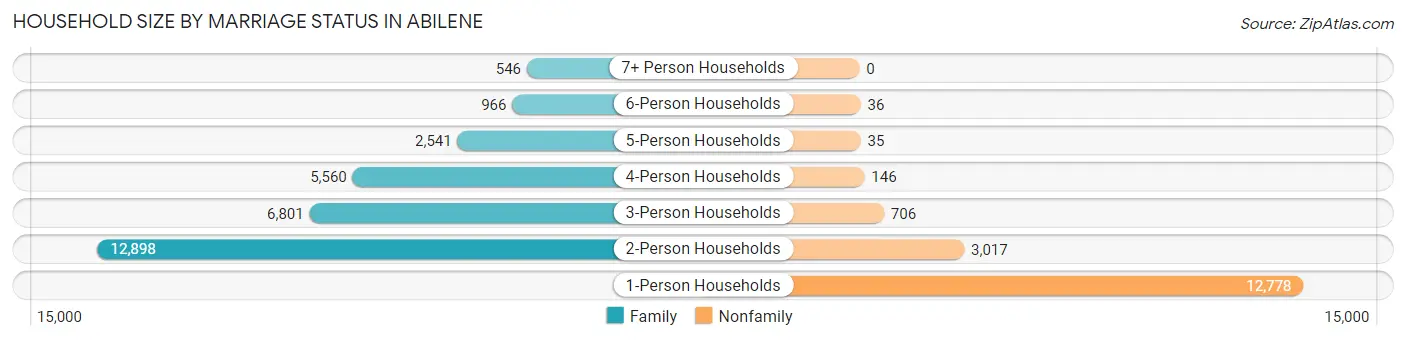
| Household Size | Family Households | Nonfamily Households |
| 1-Person Households | - | 12,778 (27.8%) |
| 2-Person Households | 12,898 (28.0%) | 3,017 (6.6%) |
| 3-Person Households | 6,801 (14.8%) | 706 (1.5%) |
| 4-Person Households | 5,560 (12.1%) | 146 (0.3%) |
| 5-Person Households | 2,541 (5.5%) | 35 (0.1%) |
| 6-Person Households | 966 (2.1%) | 36 (0.1%) |
| 7+ Person Households | 546 (1.2%) | 0 (0.0%) |
| Total | 29,312 (63.7%) | 16,718 (36.3%) |
Female Fertility in Abilene
Fertility by Age in Abilene
Average fertility rate in Abilene is 58.0 births per 1,000 women. Women in the age bracket of 20 to 34 years have the highest fertility rate with 99.0 births per 1,000 women. Women in the age bracket of 20 to 34 years acount for 85.0% of all women with births.
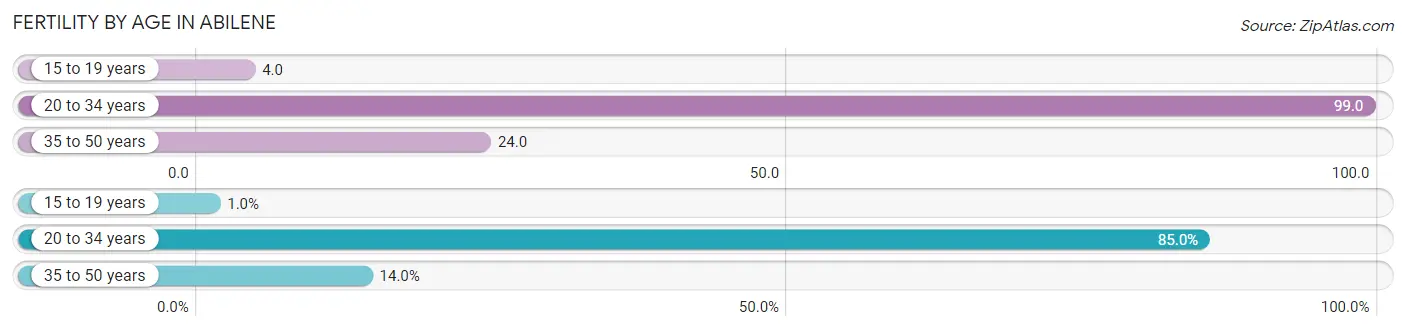
| Age Bracket | Women with Births | Births / 1,000 Women |
| 15 to 19 years | 19 (1.0%) | 4.0 |
| 20 to 34 years | 1,546 (85.0%) | 99.0 |
| 35 to 50 years | 254 (14.0%) | 24.0 |
| Total | 1,819 (100.0%) | 58.0 |
Fertility by Age by Marriage Status in Abilene
58.7% of women with births (1,819) in Abilene are married. The highest percentage of unmarried women with births falls into 15 to 19 years age bracket with 100.0% of them unmarried at the time of birth, while the lowest percentage of unmarried women with births belong to 35 to 50 years age bracket with 11.4% of them unmarried.
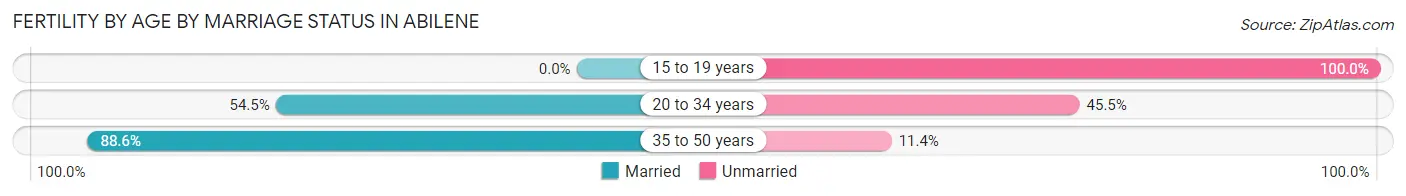
| Age Bracket | Married | Unmarried |
| 15 to 19 years | 0 (0.0%) | 19 (100.0%) |
| 20 to 34 years | 843 (54.5%) | 703 (45.5%) |
| 35 to 50 years | 225 (88.6%) | 29 (11.4%) |
| Total | 1,068 (58.7%) | 751 (41.3%) |
Fertility by Education in Abilene
Average fertility rate in Abilene is 58.0 births per 1,000 women. Women with the education attainment of graduate degree have the highest fertility rate of 70.0 births per 1,000 women, while women with the education attainment of less than high school have the lowest fertility at 24.0 births per 1,000 women. Women with the education attainment of college or associate's degree represent 40.2% of all women with births.
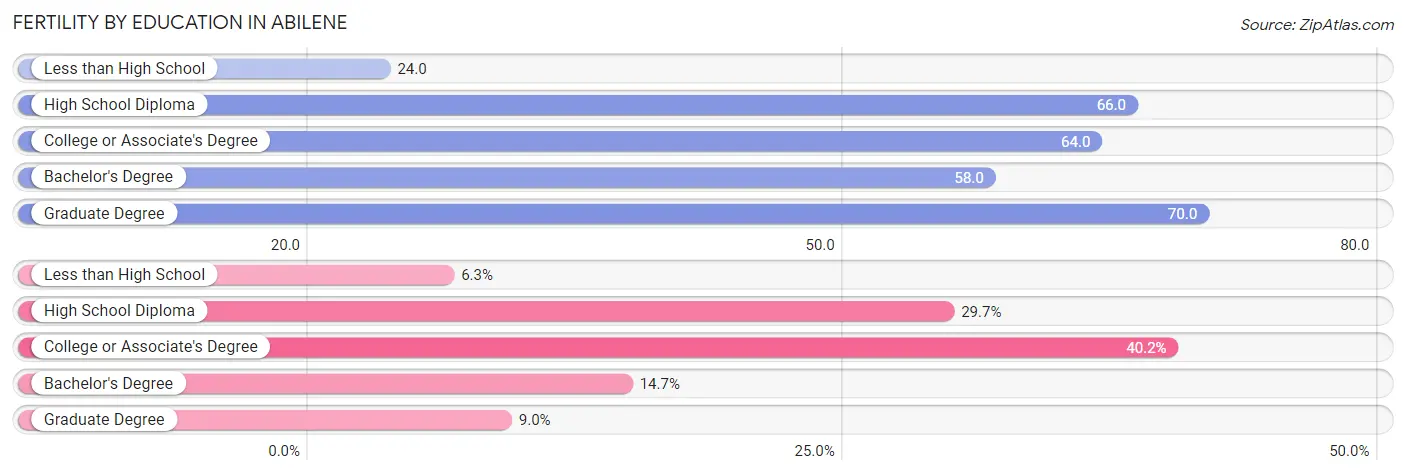
| Educational Attainment | Women with Births | Births / 1,000 Women |
| Less than High School | 115 (6.3%) | 24.0 |
| High School Diploma | 541 (29.7%) | 66.0 |
| College or Associate's Degree | 732 (40.2%) | 64.0 |
| Bachelor's Degree | 267 (14.7%) | 58.0 |
| Graduate Degree | 164 (9.0%) | 70.0 |
| Total | 1,819 (100.0%) | 58.0 |
Fertility by Education by Marriage Status in Abilene
41.3% of women with births in Abilene are unmarried. Women with the educational attainment of graduate degree are most likely to be married with 94.5% of them married at childbirth, while women with the educational attainment of high school diploma are least likely to be married with 65.1% of them unmarried at childbirth.
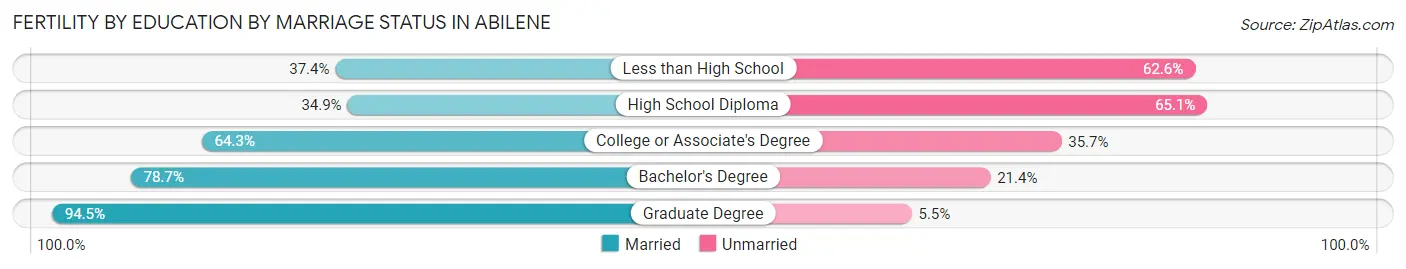
| Educational Attainment | Married | Unmarried |
| Less than High School | 43 (37.4%) | 72 (62.6%) |
| High School Diploma | 189 (34.9%) | 352 (65.1%) |
| College or Associate's Degree | 471 (64.3%) | 261 (35.7%) |
| Bachelor's Degree | 210 (78.6%) | 57 (21.3%) |
| Graduate Degree | 155 (94.5%) | 9 (5.5%) |
| Total | 1,068 (58.7%) | 751 (41.3%) |
Employment Characteristics in Abilene
Employment by Class of Employer in Abilene
Among the 60,073 employed individuals in Abilene, private company employees (36,361 | 60.5%), not-for-profit organizations (6,426 | 10.7%), and federal government employees (6,098 | 10.2%) make up the most common classes of employment.
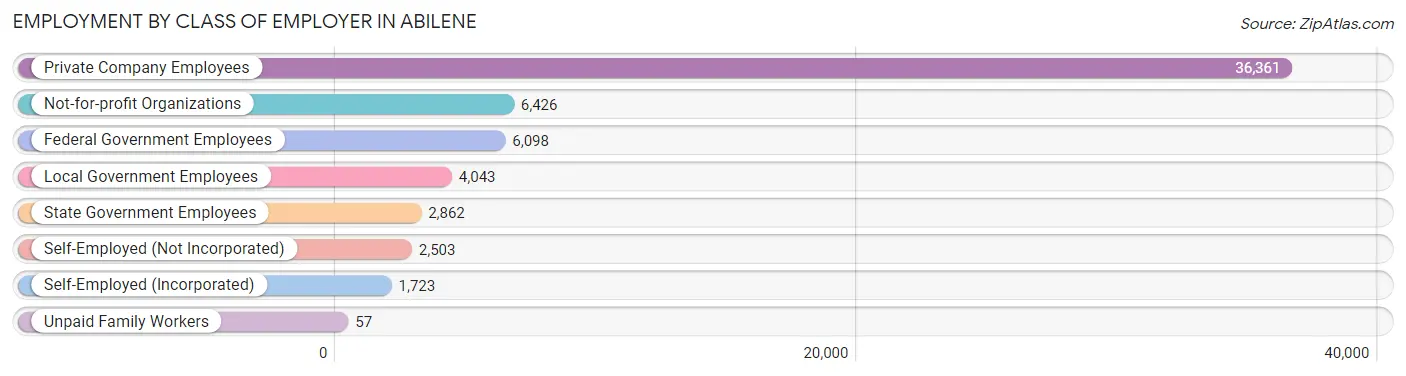
| Employer Class | # Employees | % Employees |
| Private Company Employees | 36,361 | 60.5% |
| Self-Employed (Incorporated) | 1,723 | 2.9% |
| Self-Employed (Not Incorporated) | 2,503 | 4.2% |
| Not-for-profit Organizations | 6,426 | 10.7% |
| Local Government Employees | 4,043 | 6.7% |
| State Government Employees | 2,862 | 4.8% |
| Federal Government Employees | 6,098 | 10.2% |
| Unpaid Family Workers | 57 | 0.1% |
| Total | 60,073 | 100.0% |
Employment Status by Age in Abilene
According to the labor force statistics for Abilene, out of the total population over 16 years of age (100,117), 62.3% or 62,373 individuals are in the labor force, with 2.8% or 1,746 of them unemployed. The age group with the highest labor force participation rate is 25 to 29 years, with 78.6% or 8,423 individuals in the labor force. Within the labor force, the 16 to 19 years age range has the highest percentage of unemployed individuals, with 10.0% or 358 of them being unemployed.
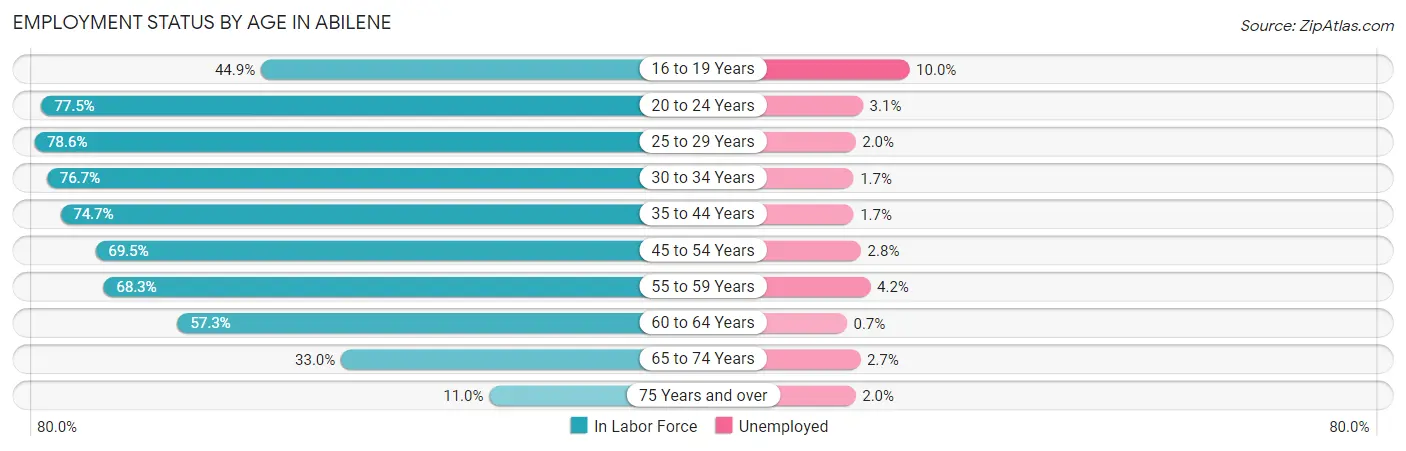
| Age Bracket | In Labor Force | Unemployed |
| 16 to 19 Years | 3,579 (44.9%) | 358 (10.0%) |
| 20 to 24 Years | 11,454 (77.5%) | 355 (3.1%) |
| 25 to 29 Years | 8,423 (78.6%) | 168 (2.0%) |
| 30 to 34 Years | 6,930 (76.7%) | 118 (1.7%) |
| 35 to 44 Years | 12,484 (74.7%) | 212 (1.7%) |
| 45 to 54 Years | 7,605 (69.5%) | 213 (2.8%) |
| 55 to 59 Years | 4,383 (68.3%) | 184 (4.2%) |
| 60 to 64 Years | 3,691 (57.3%) | 26 (0.7%) |
| 65 to 74 Years | 2,989 (33.0%) | 81 (2.7%) |
| 75 Years and over | 885 (11.0%) | 18 (2.0%) |
| Total | 62,373 (62.3%) | 1,746 (2.8%) |
Employment Status by Educational Attainment in Abilene
According to labor force statistics for Abilene, 72.2% of individuals (43,511) out of the total population between 25 and 64 years of age (60,265) are in the labor force, with 2.1% or 914 of them being unemployed. The group with the highest labor force participation rate are those with the educational attainment of bachelor's degree or higher, with 85.1% or 13,296 individuals in the labor force. Within the labor force, individuals with college / associate degree education have the highest percentage of unemployment, with 3.2% or 465 of them being unemployed.
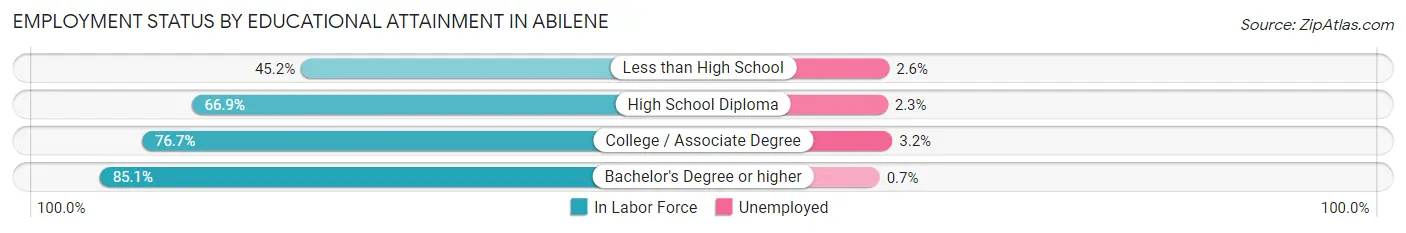
| Educational Attainment | In Labor Force | Unemployed |
| Less than High School | 3,129 (45.2%) | 180 (2.6%) |
| High School Diploma | 12,556 (66.9%) | 432 (2.3%) |
| College / Associate Degree | 14,535 (76.7%) | 606 (3.2%) |
| Bachelor's Degree or higher | 13,296 (85.1%) | 109 (0.7%) |
| Total | 43,511 (72.2%) | 1,266 (2.1%) |
Employment Occupations by Sex in Abilene
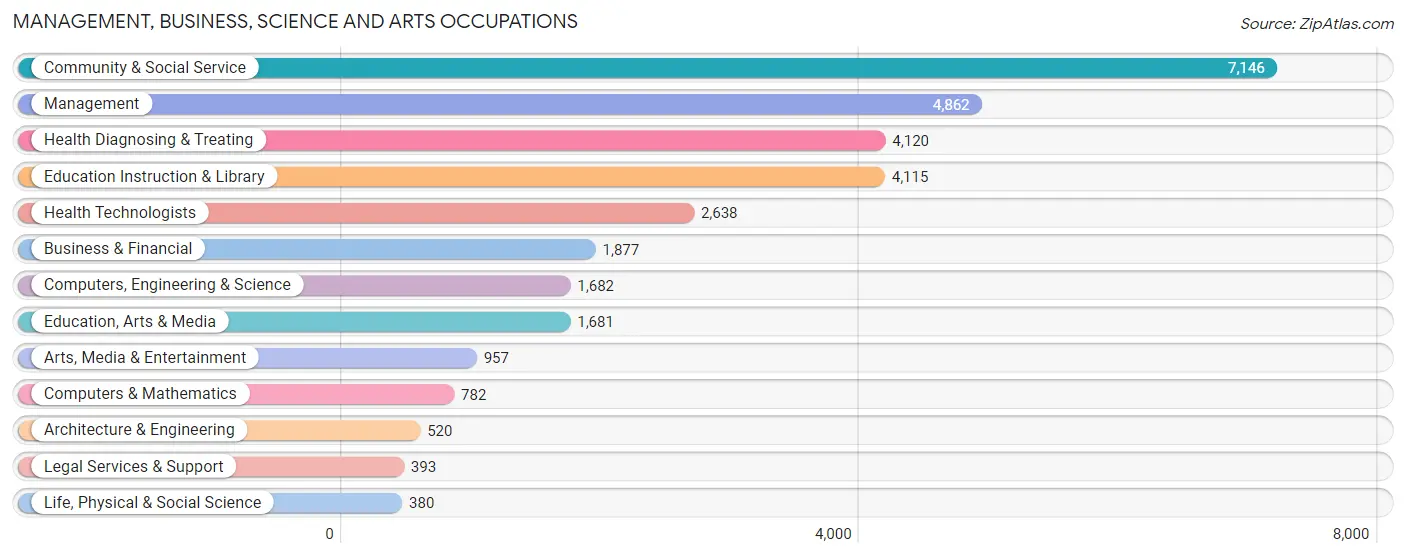
Management, Business, Science and Arts Occupations
The most common Management, Business, Science and Arts occupations in Abilene are Community & Social Service (7,146 | 12.7%), Management (4,862 | 8.7%), Health Diagnosing & Treating (4,120 | 7.3%), Education Instruction & Library (4,115 | 7.3%), and Health Technologists (2,638 | 4.7%).
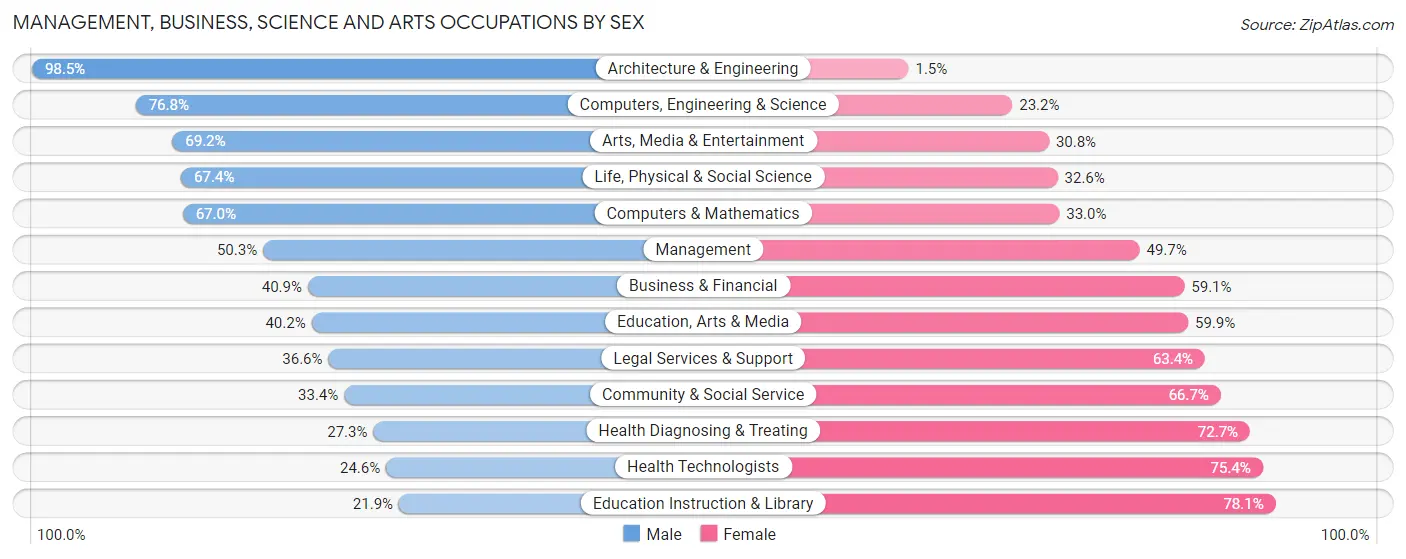
Management, Business, Science and Arts Occupations by Sex
Within the Management, Business, Science and Arts occupations in Abilene, the most male-oriented occupations are Architecture & Engineering (98.5%), Computers, Engineering & Science (76.8%), and Arts, Media & Entertainment (69.2%), while the most female-oriented occupations are Education Instruction & Library (78.1%), Health Technologists (75.4%), and Health Diagnosing & Treating (72.7%).
| Occupation | Male | Female |
| Management | 2,444 (50.3%) | 2,418 (49.7%) |
| Business & Financial | 768 (40.9%) | 1,109 (59.1%) |
| Computers, Engineering & Science | 1,292 (76.8%) | 390 (23.2%) |
| Computers & Mathematics | 524 (67.0%) | 258 (33.0%) |
| Architecture & Engineering | 512 (98.5%) | 8 (1.5%) |
| Life, Physical & Social Science | 256 (67.4%) | 124 (32.6%) |
| Community & Social Service | 2,383 (33.4%) | 4,763 (66.6%) |
| Education, Arts & Media | 675 (40.2%) | 1,006 (59.9%) |
| Legal Services & Support | 144 (36.6%) | 249 (63.4%) |
| Education Instruction & Library | 902 (21.9%) | 3,213 (78.1%) |
| Arts, Media & Entertainment | 662 (69.2%) | 295 (30.8%) |
| Health Diagnosing & Treating | 1,123 (27.3%) | 2,997 (72.7%) |
| Health Technologists | 649 (24.6%) | 1,989 (75.4%) |
| Total (Category) | 8,010 (40.7%) | 11,677 (59.3%) |
| Total (Overall) | 27,869 (49.7%) | 28,203 (50.3%) |
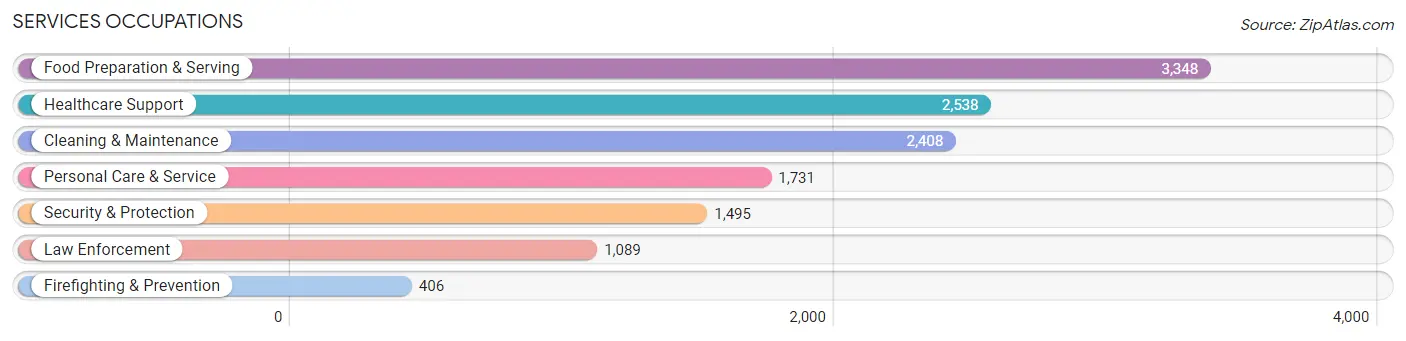
Services Occupations
The most common Services occupations in Abilene are Food Preparation & Serving (3,348 | 6.0%), Healthcare Support (2,538 | 4.5%), Cleaning & Maintenance (2,408 | 4.3%), Personal Care & Service (1,731 | 3.1%), and Security & Protection (1,495 | 2.7%).
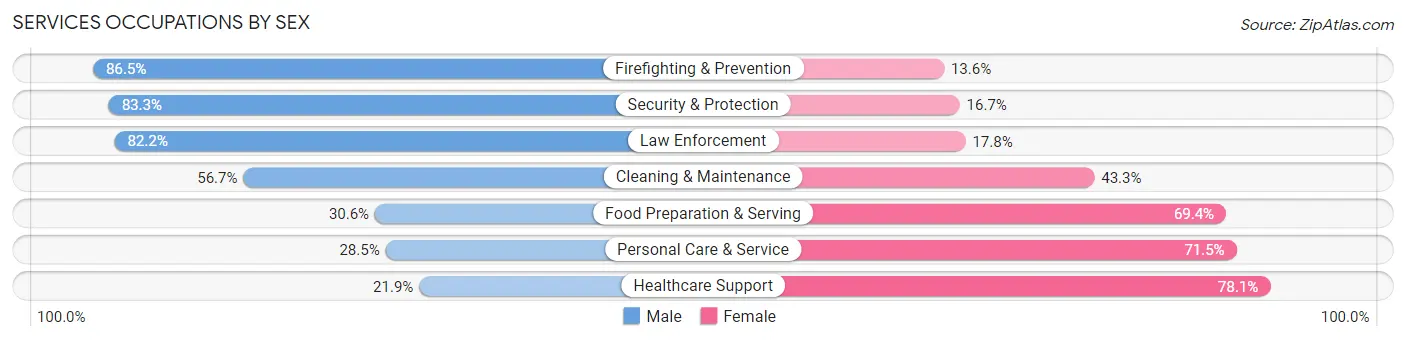
Services Occupations by Sex
Within the Services occupations in Abilene, the most male-oriented occupations are Firefighting & Prevention (86.5%), Security & Protection (83.3%), and Law Enforcement (82.2%), while the most female-oriented occupations are Healthcare Support (78.1%), Personal Care & Service (71.5%), and Food Preparation & Serving (69.4%).
| Occupation | Male | Female |
| Healthcare Support | 555 (21.9%) | 1,983 (78.1%) |
| Security & Protection | 1,246 (83.3%) | 249 (16.7%) |
| Firefighting & Prevention | 351 (86.5%) | 55 (13.6%) |
| Law Enforcement | 895 (82.2%) | 194 (17.8%) |
| Food Preparation & Serving | 1,025 (30.6%) | 2,323 (69.4%) |
| Cleaning & Maintenance | 1,365 (56.7%) | 1,043 (43.3%) |
| Personal Care & Service | 494 (28.5%) | 1,237 (71.5%) |
| Total (Category) | 4,685 (40.7%) | 6,835 (59.3%) |
| Total (Overall) | 27,869 (49.7%) | 28,203 (50.3%) |
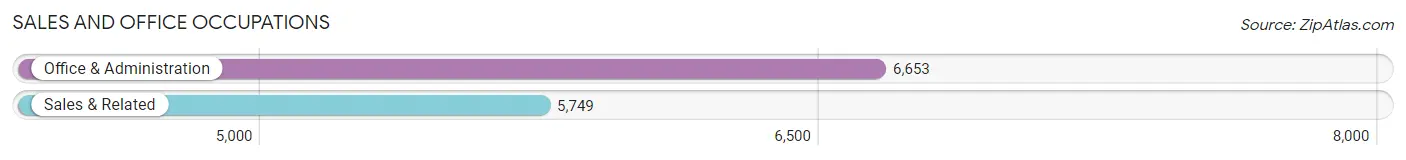
Sales and Office Occupations
The most common Sales and Office occupations in Abilene are Office & Administration (6,653 | 11.9%), and Sales & Related (5,749 | 10.2%).
Sales and Office Occupations by Sex
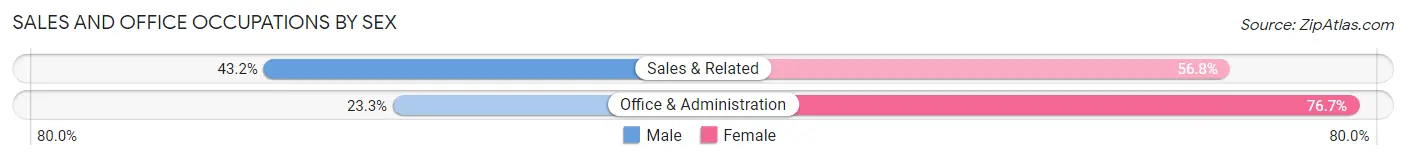
| Occupation | Male | Female |
| Sales & Related | 2,485 (43.2%) | 3,264 (56.8%) |
| Office & Administration | 1,552 (23.3%) | 5,101 (76.7%) |
| Total (Category) | 4,037 (32.6%) | 8,365 (67.4%) |
| Total (Overall) | 27,869 (49.7%) | 28,203 (50.3%) |
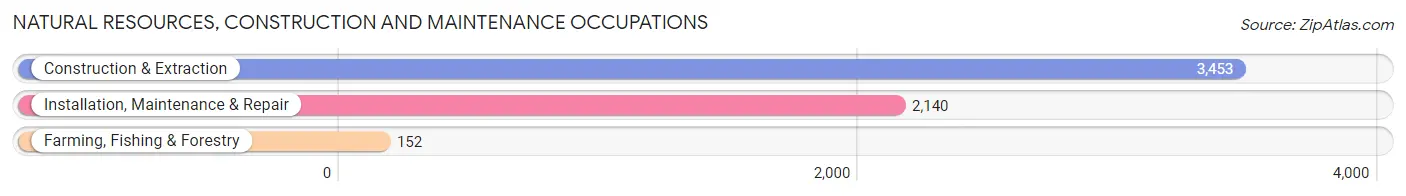
Natural Resources, Construction and Maintenance Occupations
The most common Natural Resources, Construction and Maintenance occupations in Abilene are Construction & Extraction (3,453 | 6.2%), Installation, Maintenance & Repair (2,140 | 3.8%), and Farming, Fishing & Forestry (152 | 0.3%).
Natural Resources, Construction and Maintenance Occupations by Sex
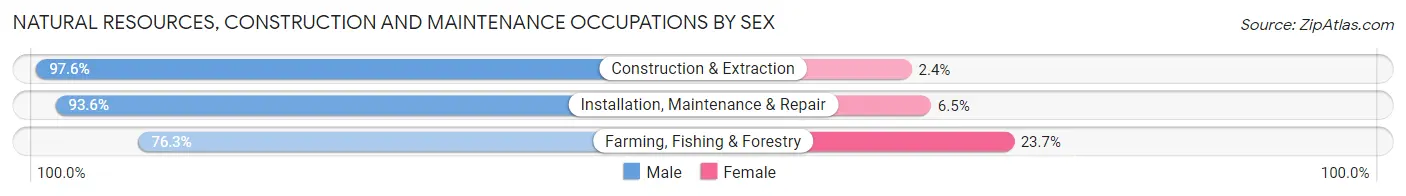
| Occupation | Male | Female |
| Farming, Fishing & Forestry | 116 (76.3%) | 36 (23.7%) |
| Construction & Extraction | 3,369 (97.6%) | 84 (2.4%) |
| Installation, Maintenance & Repair | 2,002 (93.5%) | 138 (6.5%) |
| Total (Category) | 5,487 (95.5%) | 258 (4.5%) |
| Total (Overall) | 27,869 (49.7%) | 28,203 (50.3%) |
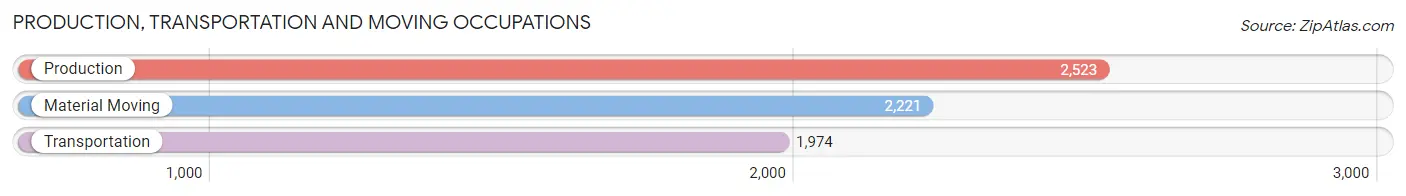
Production, Transportation and Moving Occupations
The most common Production, Transportation and Moving occupations in Abilene are Production (2,523 | 4.5%), Material Moving (2,221 | 4.0%), and Transportation (1,974 | 3.5%).
Production, Transportation and Moving Occupations by Sex
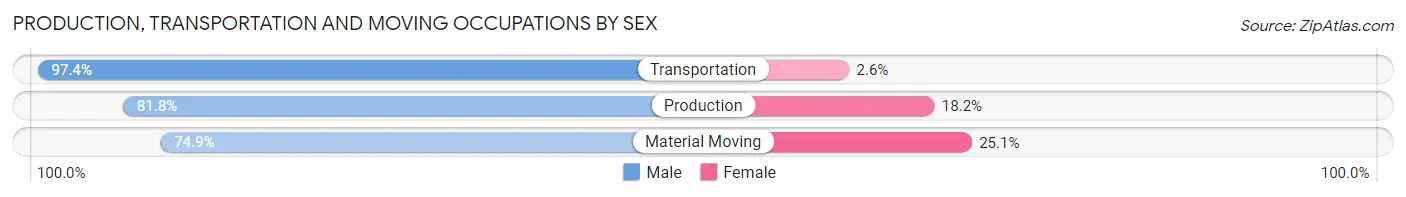
| Occupation | Male | Female |
| Production | 2,063 (81.8%) | 460 (18.2%) |
| Transportation | 1,923 (97.4%) | 51 (2.6%) |
| Material Moving | 1,664 (74.9%) | 557 (25.1%) |
| Total (Category) | 5,650 (84.1%) | 1,068 (15.9%) |
| Total (Overall) | 27,869 (49.7%) | 28,203 (50.3%) |
Employment Industries by Sex in Abilene
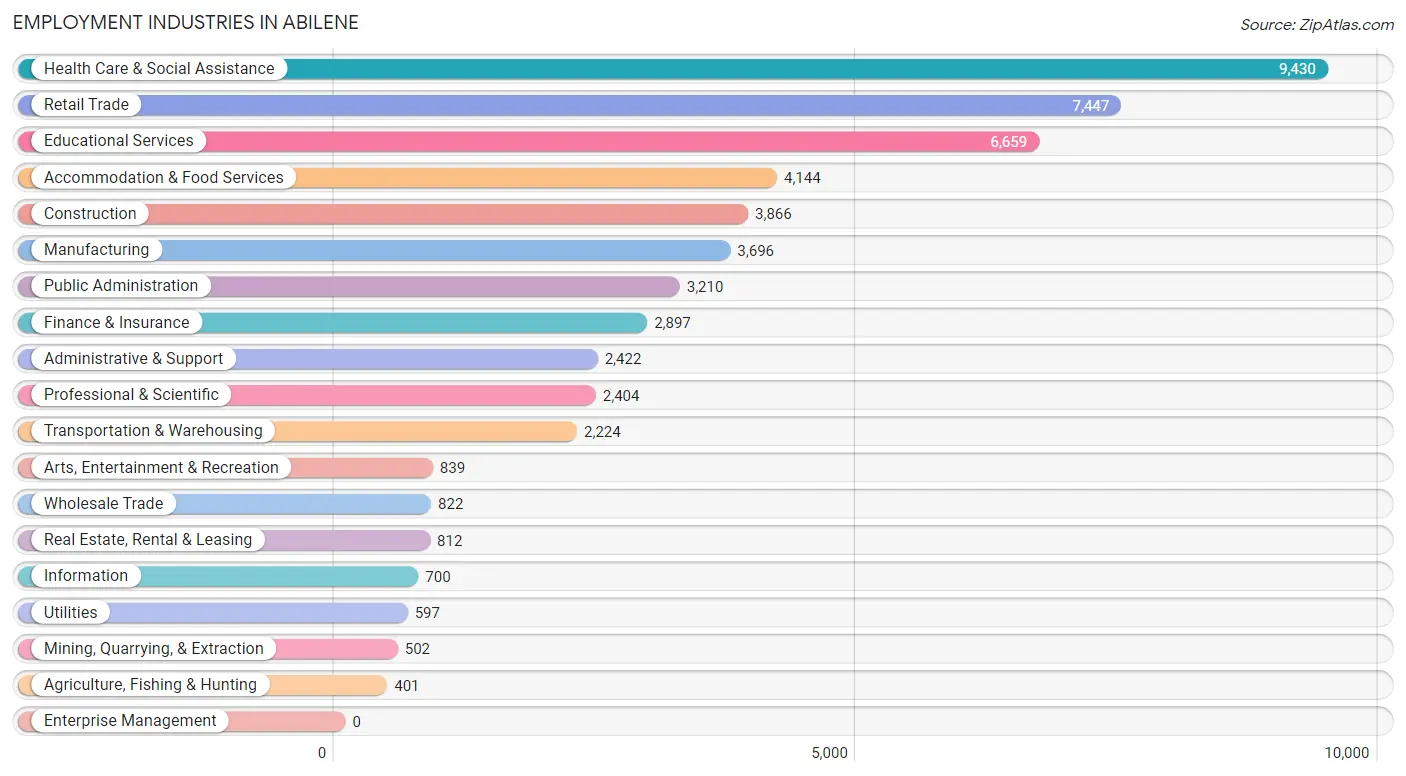
Employment Industries in Abilene
The major employment industries in Abilene include Health Care & Social Assistance (9,430 | 16.8%), Retail Trade (7,447 | 13.3%), Educational Services (6,659 | 11.9%), Accommodation & Food Services (4,144 | 7.4%), and Construction (3,866 | 6.9%).
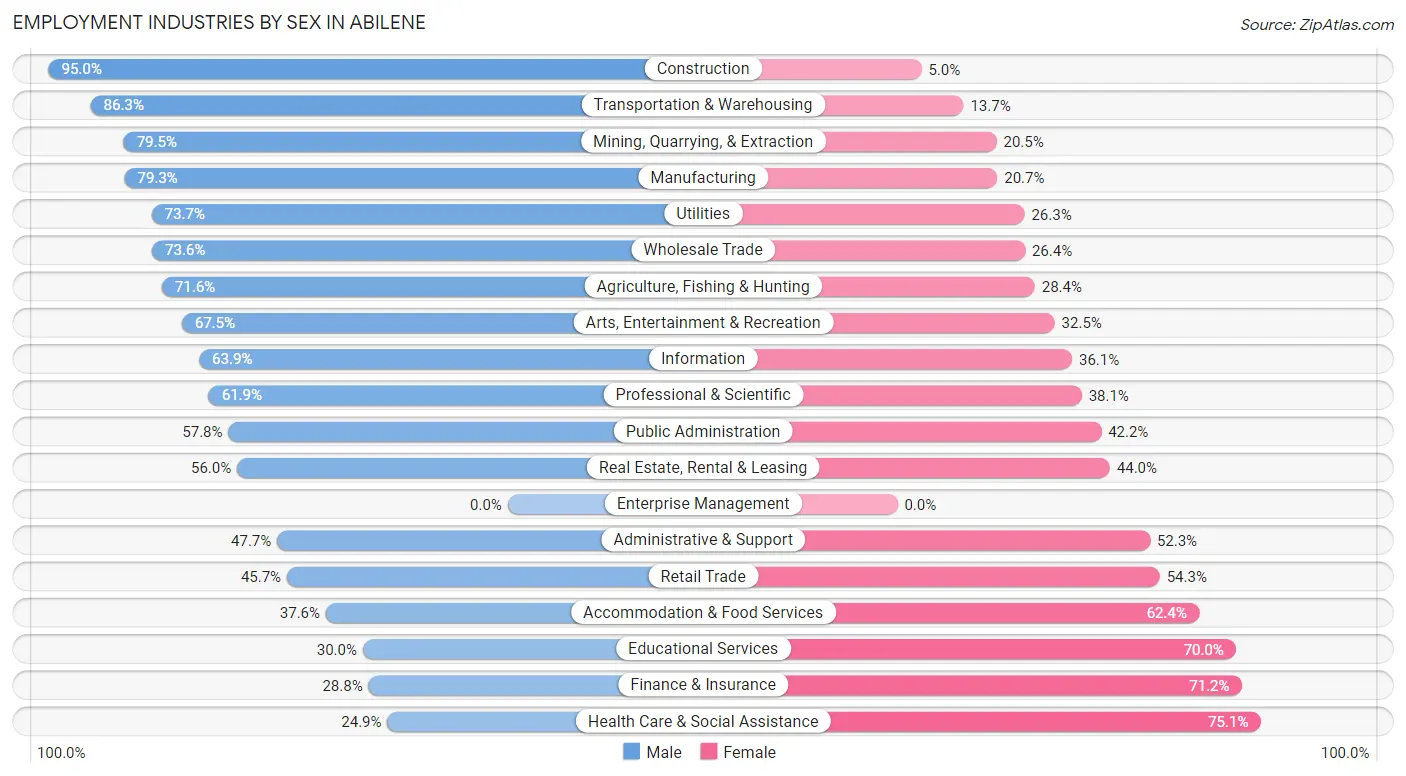
Employment Industries by Sex in Abilene
The Abilene industries that see more men than women are Construction (95.0%), Transportation & Warehousing (86.3%), and Mining, Quarrying, & Extraction (79.5%), whereas the industries that tend to have a higher number of women are Health Care & Social Assistance (75.1%), Finance & Insurance (71.2%), and Educational Services (70.0%).
| Industry | Male | Female |
| Agriculture, Fishing & Hunting | 287 (71.6%) | 114 (28.4%) |
| Mining, Quarrying, & Extraction | 399 (79.5%) | 103 (20.5%) |
| Construction | 3,674 (95.0%) | 192 (5.0%) |
| Manufacturing | 2,932 (79.3%) | 764 (20.7%) |
| Wholesale Trade | 605 (73.6%) | 217 (26.4%) |
| Retail Trade | 3,403 (45.7%) | 4,044 (54.3%) |
| Transportation & Warehousing | 1,920 (86.3%) | 304 (13.7%) |
| Utilities | 440 (73.7%) | 157 (26.3%) |
| Information | 447 (63.9%) | 253 (36.1%) |
| Finance & Insurance | 835 (28.8%) | 2,062 (71.2%) |
| Real Estate, Rental & Leasing | 455 (56.0%) | 357 (44.0%) |
| Professional & Scientific | 1,487 (61.9%) | 917 (38.1%) |
| Enterprise Management | 0 (0.0%) | 0 (0.0%) |
| Administrative & Support | 1,156 (47.7%) | 1,266 (52.3%) |
| Educational Services | 1,997 (30.0%) | 4,662 (70.0%) |
| Health Care & Social Assistance | 2,349 (24.9%) | 7,081 (75.1%) |
| Arts, Entertainment & Recreation | 566 (67.5%) | 273 (32.5%) |
| Accommodation & Food Services | 1,560 (37.6%) | 2,584 (62.4%) |
| Public Administration | 1,856 (57.8%) | 1,354 (42.2%) |
| Total | 27,869 (49.7%) | 28,203 (50.3%) |
Education in Abilene
School Enrollment in Abilene
The most common levels of schooling among the 34,469 students in Abilene are college / undergraduate (10,088 | 29.3%), high school (6,980 | 20.3%), and middle school (6,870 | 19.9%).
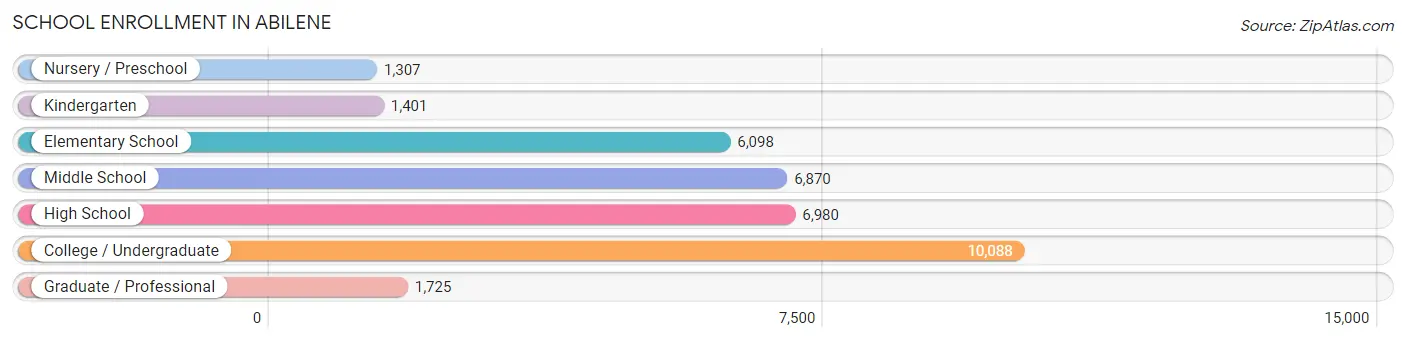
| School Level | # Students | % Students |
| Nursery / Preschool | 1,307 | 3.8% |
| Kindergarten | 1,401 | 4.1% |
| Elementary School | 6,098 | 17.7% |
| Middle School | 6,870 | 19.9% |
| High School | 6,980 | 20.3% |
| College / Undergraduate | 10,088 | 29.3% |
| Graduate / Professional | 1,725 | 5.0% |
| Total | 34,469 | 100.0% |
School Enrollment by Age by Funding Source in Abilene
Out of a total of 34,469 students who are enrolled in schools in Abilene, 9,238 (26.8%) attend a private institution, while the remaining 25,231 (73.2%) are enrolled in public schools. The age group of 20 to 24 year olds has the highest likelihood of being enrolled in private schools, with 3,888 (61.5% in the age bracket) enrolled. Conversely, the age group of 15 to 17 year olds has the lowest likelihood of being enrolled in a private school, with 4,273 (90.6% in the age bracket) attending a public institution.
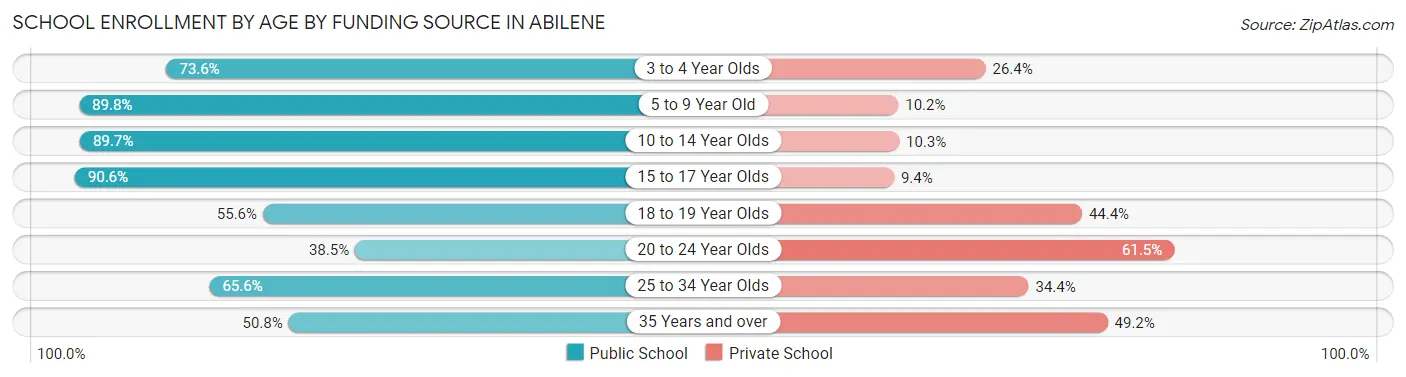
| Age Bracket | Public School | Private School |
| 3 to 4 Year Olds | 763 (73.6%) | 274 (26.4%) |
| 5 to 9 Year Old | 6,374 (89.8%) | 722 (10.2%) |
| 10 to 14 Year Olds | 7,238 (89.7%) | 833 (10.3%) |
| 15 to 17 Year Olds | 4,273 (90.6%) | 442 (9.4%) |
| 18 to 19 Year Olds | 2,045 (55.6%) | 1,632 (44.4%) |
| 20 to 24 Year Olds | 2,430 (38.5%) | 3,888 (61.5%) |
| 25 to 34 Year Olds | 1,321 (65.6%) | 694 (34.4%) |
| 35 Years and over | 783 (50.8%) | 757 (49.2%) |
| Total | 25,231 (73.2%) | 9,238 (26.8%) |
Educational Attainment by Field of Study in Abilene
Business (3,643 | 16.9%), education (3,630 | 16.8%), science & technology (3,275 | 15.1%), arts & humanities (1,838 | 8.5%), and social sciences (1,215 | 5.6%) are the most common fields of study among 21,624 individuals in Abilene who have obtained a bachelor's degree or higher.
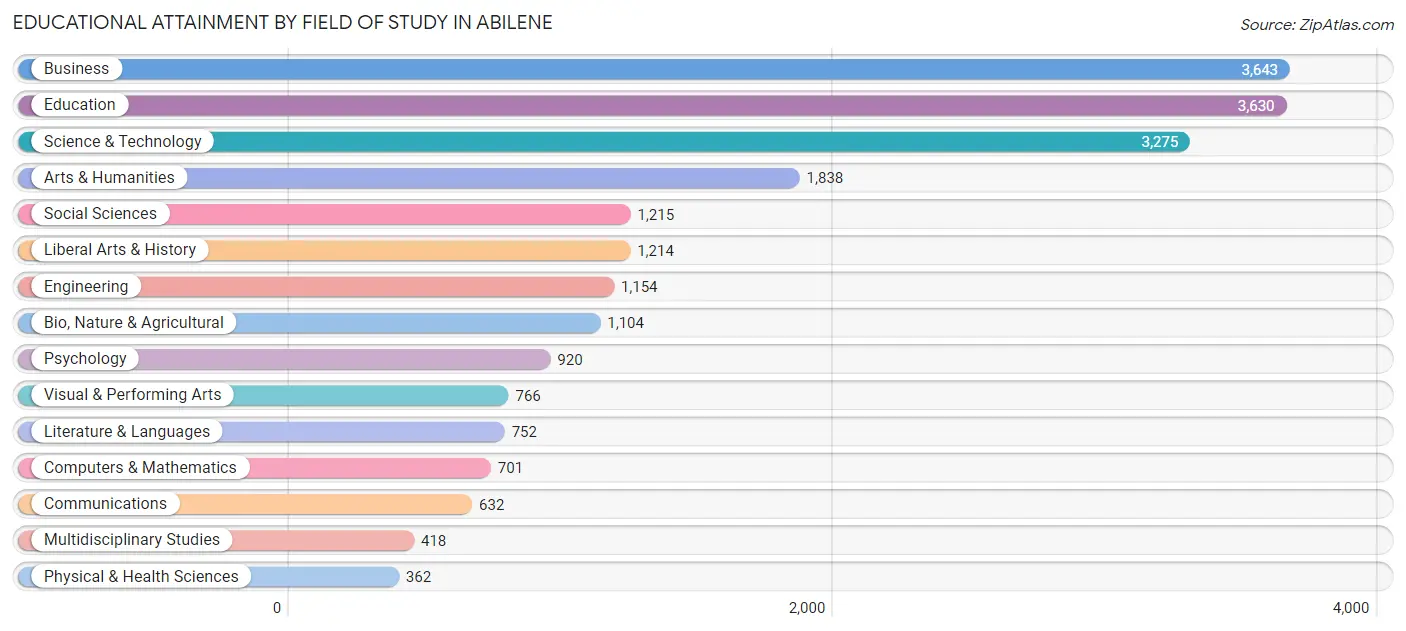
| Field of Study | # Graduates | % Graduates |
| Computers & Mathematics | 701 | 3.2% |
| Bio, Nature & Agricultural | 1,104 | 5.1% |
| Physical & Health Sciences | 362 | 1.7% |
| Psychology | 920 | 4.3% |
| Social Sciences | 1,215 | 5.6% |
| Engineering | 1,154 | 5.3% |
| Multidisciplinary Studies | 418 | 1.9% |
| Science & Technology | 3,275 | 15.1% |
| Business | 3,643 | 16.9% |
| Education | 3,630 | 16.8% |
| Literature & Languages | 752 | 3.5% |
| Liberal Arts & History | 1,214 | 5.6% |
| Visual & Performing Arts | 766 | 3.5% |
| Communications | 632 | 2.9% |
| Arts & Humanities | 1,838 | 8.5% |
| Total | 21,624 | 100.0% |
Transportation & Commute in Abilene
Vehicle Availability by Sex in Abilene
The most prevalent vehicle ownership categories in Abilene are males with 2 vehicles (14,997, accounting for 49.6%) and females with 2 vehicles (13,122, making up 54.4%).
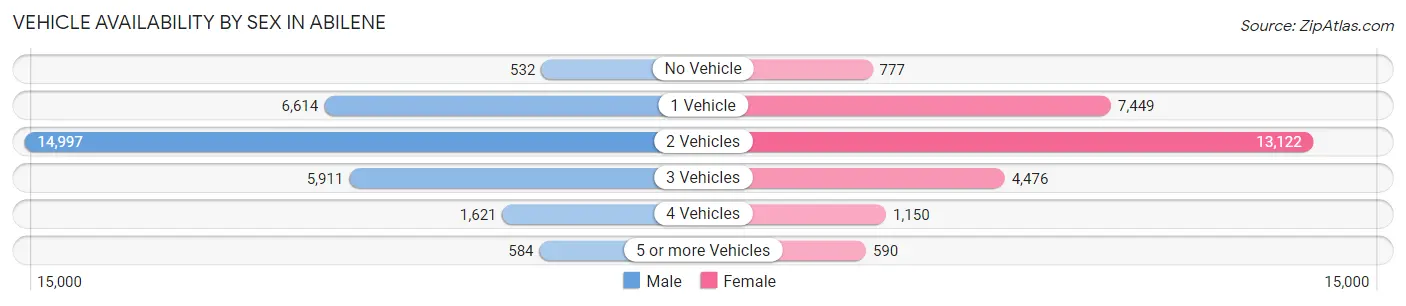
| Vehicles Available | Male | Female |
| No Vehicle | 532 (1.8%) | 777 (2.8%) |
| 1 Vehicle | 6,614 (21.9%) | 7,449 (27.0%) |
| 2 Vehicles | 14,997 (49.6%) | 13,122 (47.6%) |
| 3 Vehicles | 5,911 (19.5%) | 4,476 (16.2%) |
| 4 Vehicles | 1,621 (5.4%) | 1,150 (4.2%) |
| 5 or more Vehicles | 584 (1.9%) | 590 (2.1%) |
| Total | 30,259 (100.0%) | 27,564 (100.0%) |
Commute Time in Abilene
The most frequently occuring commute durations in Abilene are 10 to 14 minutes (15,405 commuters, 27.6%), 15 to 19 minutes (14,153 commuters, 25.4%), and 5 to 9 minutes (12,042 commuters, 21.6%).
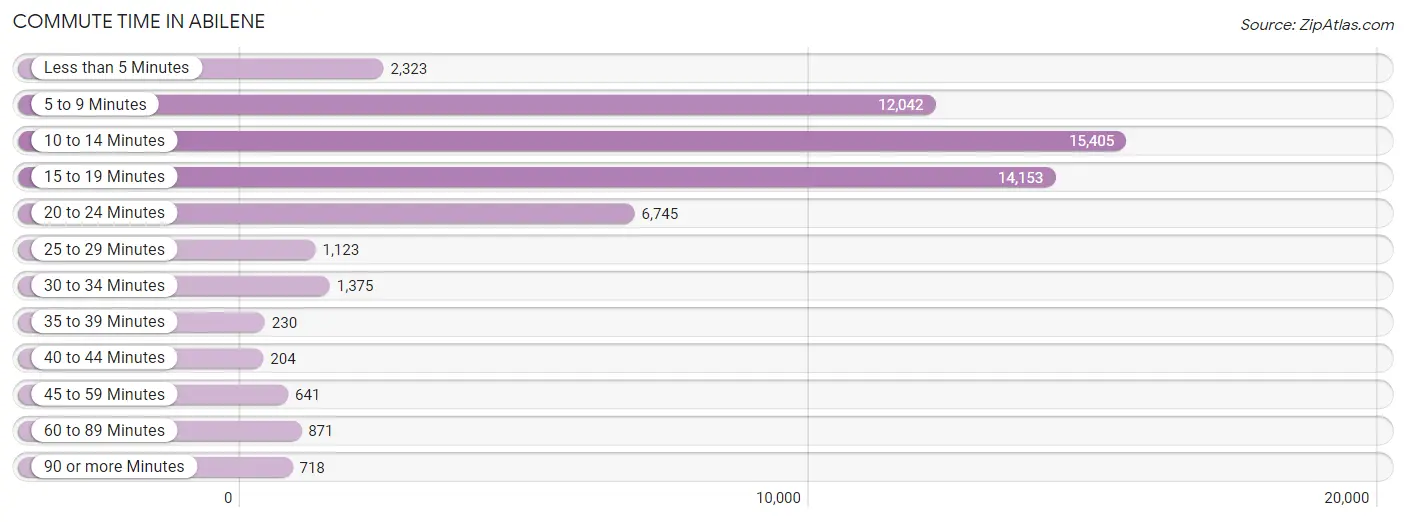
| Commute Time | # Commuters | % Commuters |
| Less than 5 Minutes | 2,323 | 4.2% |
| 5 to 9 Minutes | 12,042 | 21.6% |
| 10 to 14 Minutes | 15,405 | 27.6% |
| 15 to 19 Minutes | 14,153 | 25.4% |
| 20 to 24 Minutes | 6,745 | 12.1% |
| 25 to 29 Minutes | 1,123 | 2.0% |
| 30 to 34 Minutes | 1,375 | 2.5% |
| 35 to 39 Minutes | 230 | 0.4% |
| 40 to 44 Minutes | 204 | 0.4% |
| 45 to 59 Minutes | 641 | 1.1% |
| 60 to 89 Minutes | 871 | 1.6% |
| 90 or more Minutes | 718 | 1.3% |
Commute Time by Sex in Abilene
The most common commute times in Abilene are 10 to 14 minutes (7,676 commuters, 26.1%) for males and 10 to 14 minutes (7,729 commuters, 29.2%) for females.
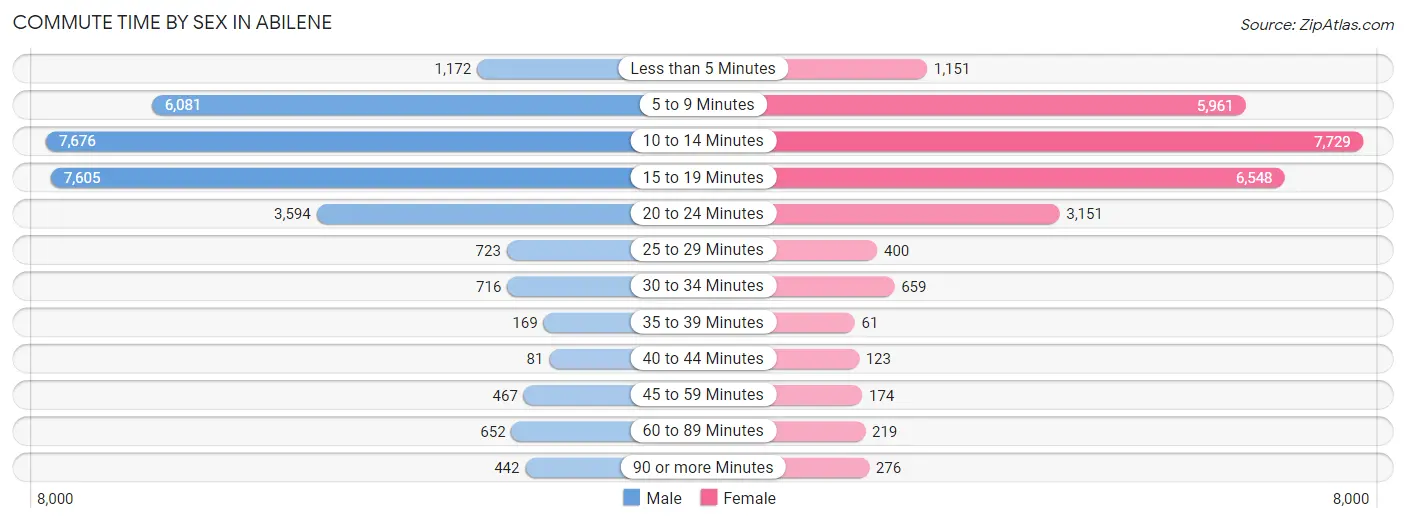
| Commute Time | Male | Female |
| Less than 5 Minutes | 1,172 (4.0%) | 1,151 (4.3%) |
| 5 to 9 Minutes | 6,081 (20.7%) | 5,961 (22.5%) |
| 10 to 14 Minutes | 7,676 (26.1%) | 7,729 (29.2%) |
| 15 to 19 Minutes | 7,605 (25.9%) | 6,548 (24.7%) |
| 20 to 24 Minutes | 3,594 (12.2%) | 3,151 (11.9%) |
| 25 to 29 Minutes | 723 (2.5%) | 400 (1.5%) |
| 30 to 34 Minutes | 716 (2.4%) | 659 (2.5%) |
| 35 to 39 Minutes | 169 (0.6%) | 61 (0.2%) |
| 40 to 44 Minutes | 81 (0.3%) | 123 (0.5%) |
| 45 to 59 Minutes | 467 (1.6%) | 174 (0.7%) |
| 60 to 89 Minutes | 652 (2.2%) | 219 (0.8%) |
| 90 or more Minutes | 442 (1.5%) | 276 (1.0%) |
Time of Departure to Work by Sex in Abilene
The most frequent times of departure to work in Abilene are 7:30 AM to 7:59 AM (4,927, 16.8%) for males and 7:30 AM to 7:59 AM (5,907, 22.3%) for females.
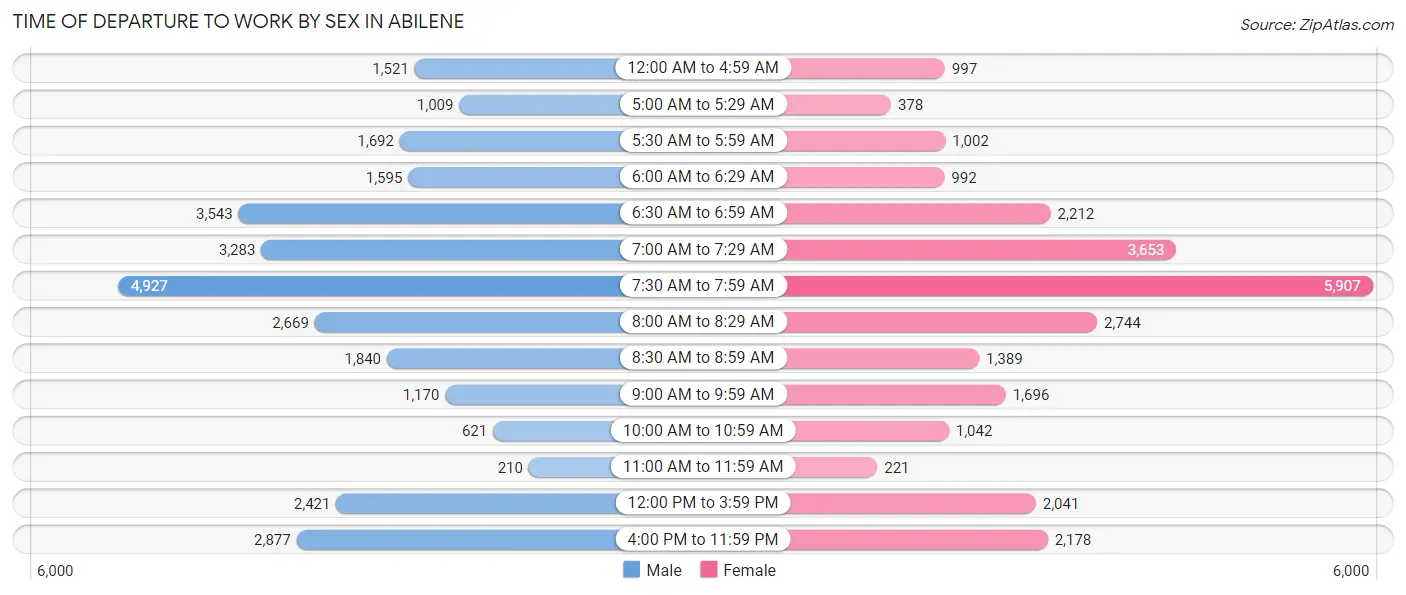
| Time of Departure | Male | Female |
| 12:00 AM to 4:59 AM | 1,521 (5.2%) | 997 (3.8%) |
| 5:00 AM to 5:29 AM | 1,009 (3.4%) | 378 (1.4%) |
| 5:30 AM to 5:59 AM | 1,692 (5.8%) | 1,002 (3.8%) |
| 6:00 AM to 6:29 AM | 1,595 (5.4%) | 992 (3.7%) |
| 6:30 AM to 6:59 AM | 3,543 (12.1%) | 2,212 (8.4%) |
| 7:00 AM to 7:29 AM | 3,283 (11.2%) | 3,653 (13.8%) |
| 7:30 AM to 7:59 AM | 4,927 (16.8%) | 5,907 (22.3%) |
| 8:00 AM to 8:29 AM | 2,669 (9.1%) | 2,744 (10.4%) |
| 8:30 AM to 8:59 AM | 1,840 (6.3%) | 1,389 (5.2%) |
| 9:00 AM to 9:59 AM | 1,170 (4.0%) | 1,696 (6.4%) |
| 10:00 AM to 10:59 AM | 621 (2.1%) | 1,042 (3.9%) |
| 11:00 AM to 11:59 AM | 210 (0.7%) | 221 (0.8%) |
| 12:00 PM to 3:59 PM | 2,421 (8.2%) | 2,041 (7.7%) |
| 4:00 PM to 11:59 PM | 2,877 (9.8%) | 2,178 (8.2%) |
| Total | 29,378 (100.0%) | 26,452 (100.0%) |
Housing Occupancy in Abilene
Occupancy by Ownership in Abilene
Of the total 46,030 dwellings in Abilene, owner-occupied units account for 24,865 (54.0%), while renter-occupied units make up 21,165 (46.0%).
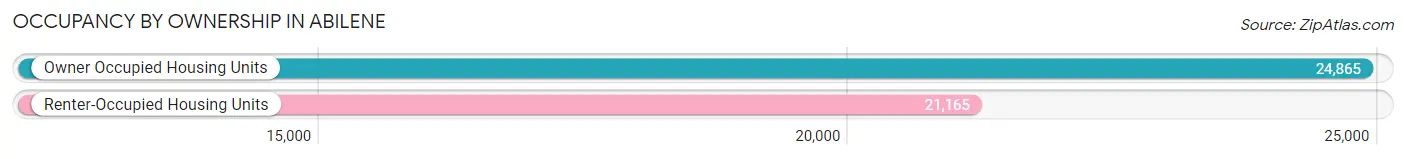
| Occupancy | # Housing Units | % Housing Units |
| Owner Occupied Housing Units | 24,865 | 54.0% |
| Renter-Occupied Housing Units | 21,165 | 46.0% |
| Total Occupied Housing Units | 46,030 | 100.0% |
Occupancy by Household Size in Abilene
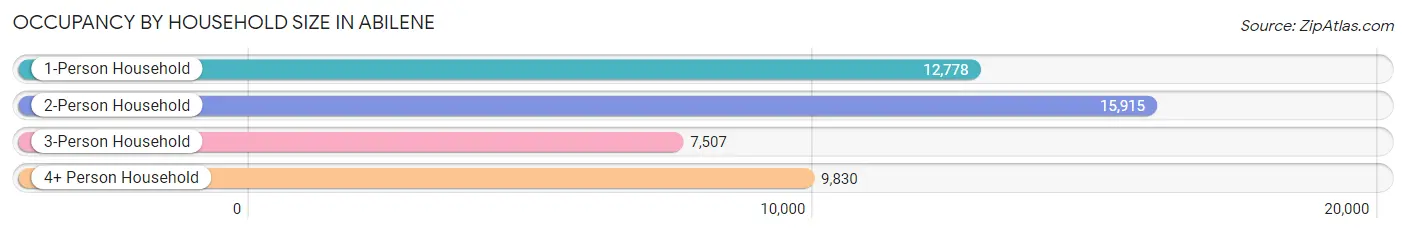
| Household Size | # Housing Units | % Housing Units |
| 1-Person Household | 12,778 | 27.8% |
| 2-Person Household | 15,915 | 34.6% |
| 3-Person Household | 7,507 | 16.3% |
| 4+ Person Household | 9,830 | 21.4% |
| Total Housing Units | 46,030 | 100.0% |
Occupancy by Ownership by Household Size in Abilene
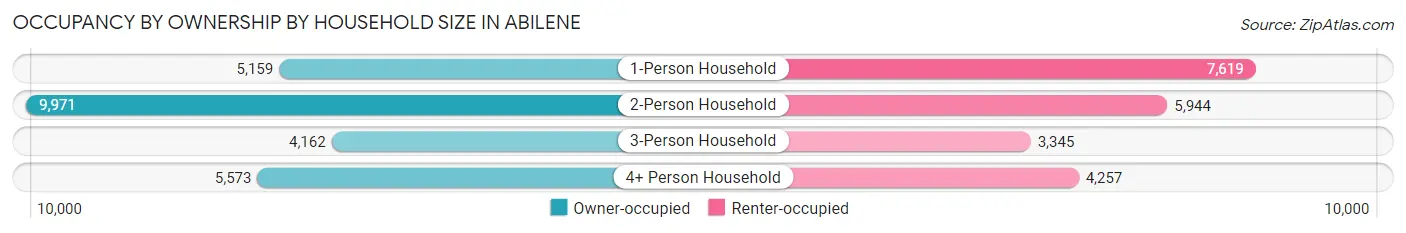
| Household Size | Owner-occupied | Renter-occupied |
| 1-Person Household | 5,159 (40.4%) | 7,619 (59.6%) |
| 2-Person Household | 9,971 (62.6%) | 5,944 (37.3%) |
| 3-Person Household | 4,162 (55.4%) | 3,345 (44.6%) |
| 4+ Person Household | 5,573 (56.7%) | 4,257 (43.3%) |
| Total Housing Units | 24,865 (54.0%) | 21,165 (46.0%) |
Occupancy by Educational Attainment in Abilene
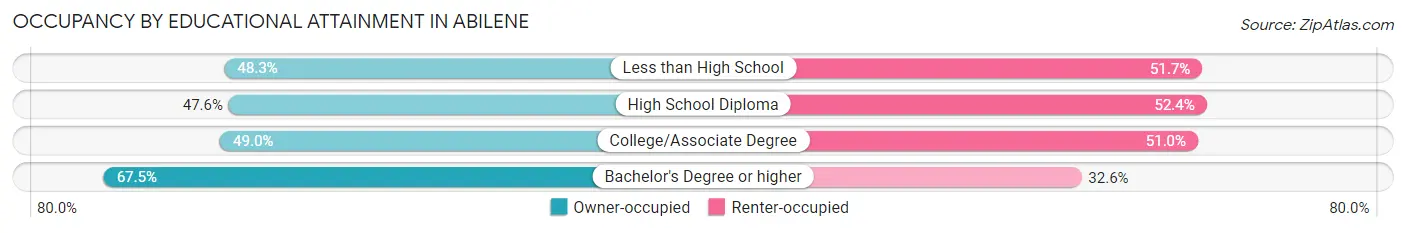
| Household Size | Owner-occupied | Renter-occupied |
| Less than High School | 1,906 (48.3%) | 2,040 (51.7%) |
| High School Diploma | 5,828 (47.6%) | 6,412 (52.4%) |
| College/Associate Degree | 7,951 (49.0%) | 8,282 (51.0%) |
| Bachelor's Degree or higher | 9,180 (67.4%) | 4,431 (32.6%) |
Occupancy by Age of Householder in Abilene
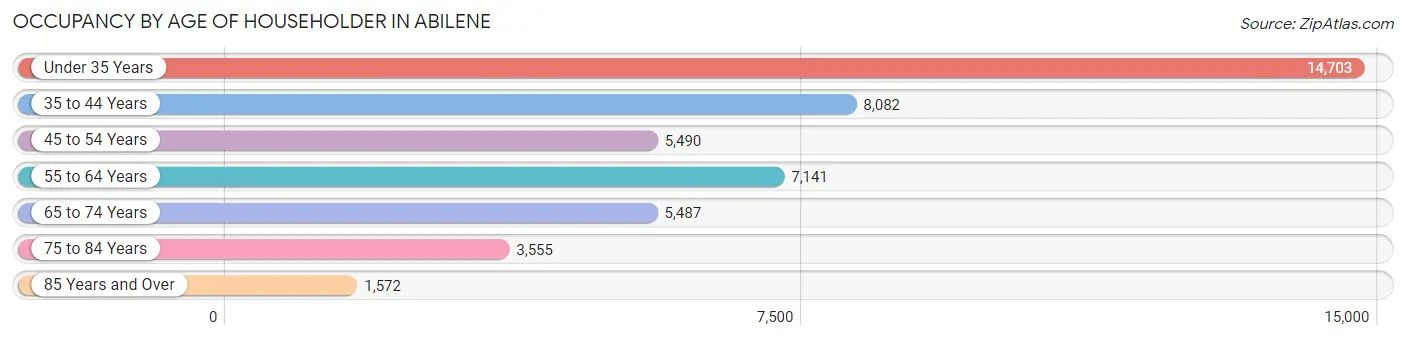
| Age Bracket | # Households | % Households |
| Under 35 Years | 14,703 | 31.9% |
| 35 to 44 Years | 8,082 | 17.6% |
| 45 to 54 Years | 5,490 | 11.9% |
| 55 to 64 Years | 7,141 | 15.5% |
| 65 to 74 Years | 5,487 | 11.9% |
| 75 to 84 Years | 3,555 | 7.7% |
| 85 Years and Over | 1,572 | 3.4% |
| Total | 46,030 | 100.0% |
Housing Finances in Abilene
Median Income by Occupancy in Abilene
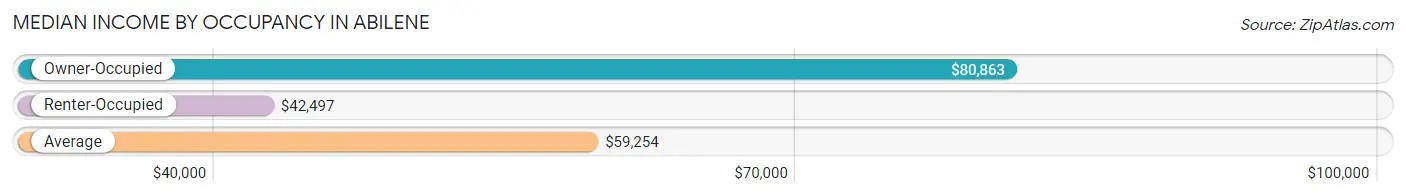
| Occupancy Type | # Households | Median Income |
| Owner-Occupied | 24,865 (54.0%) | $80,863 |
| Renter-Occupied | 21,165 (46.0%) | $42,497 |
| Average | 46,030 (100.0%) | $59,254 |
Occupancy by Householder Income Bracket in Abilene
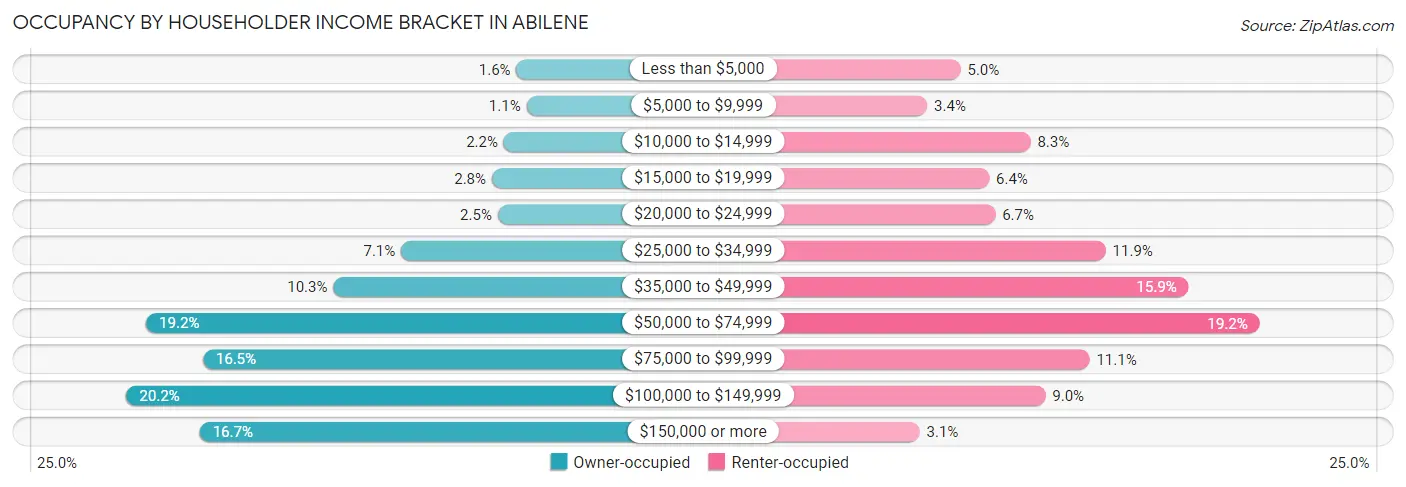
| Income Bracket | Owner-occupied | Renter-occupied |
| Less than $5,000 | 393 (1.6%) | 1,059 (5.0%) |
| $5,000 to $9,999 | 273 (1.1%) | 722 (3.4%) |
| $10,000 to $14,999 | 542 (2.2%) | 1,764 (8.3%) |
| $15,000 to $19,999 | 685 (2.8%) | 1,347 (6.4%) |
| $20,000 to $24,999 | 615 (2.5%) | 1,407 (6.7%) |
| $25,000 to $34,999 | 1,759 (7.1%) | 2,521 (11.9%) |
| $35,000 to $49,999 | 2,561 (10.3%) | 3,357 (15.9%) |
| $50,000 to $74,999 | 4,777 (19.2%) | 4,073 (19.2%) |
| $75,000 to $99,999 | 4,106 (16.5%) | 2,357 (11.1%) |
| $100,000 to $149,999 | 5,011 (20.2%) | 1,913 (9.0%) |
| $150,000 or more | 4,143 (16.7%) | 645 (3.0%) |
| Total | 24,865 (100.0%) | 21,165 (100.0%) |
Monthly Housing Cost Tiers in Abilene
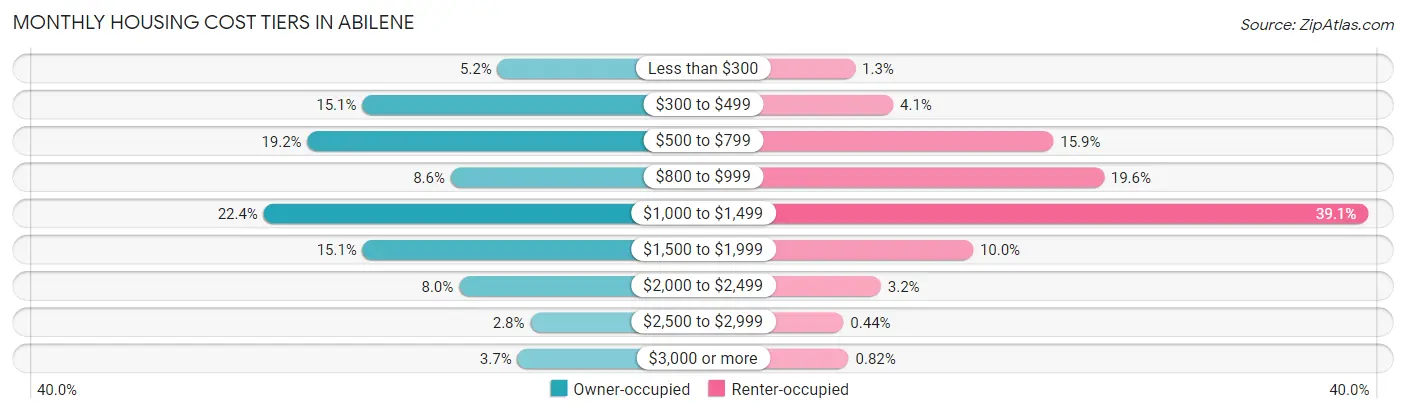
| Monthly Cost | Owner-occupied | Renter-occupied |
| Less than $300 | 1,283 (5.2%) | 276 (1.3%) |
| $300 to $499 | 3,761 (15.1%) | 868 (4.1%) |
| $500 to $799 | 4,767 (19.2%) | 3,365 (15.9%) |
| $800 to $999 | 2,141 (8.6%) | 4,152 (19.6%) |
| $1,000 to $1,499 | 5,567 (22.4%) | 8,272 (39.1%) |
| $1,500 to $1,999 | 3,754 (15.1%) | 2,112 (10.0%) |
| $2,000 to $2,499 | 1,990 (8.0%) | 678 (3.2%) |
| $2,500 to $2,999 | 683 (2.8%) | 94 (0.4%) |
| $3,000 or more | 919 (3.7%) | 173 (0.8%) |
| Total | 24,865 (100.0%) | 21,165 (100.0%) |
Physical Housing Characteristics in Abilene
Housing Structures in Abilene
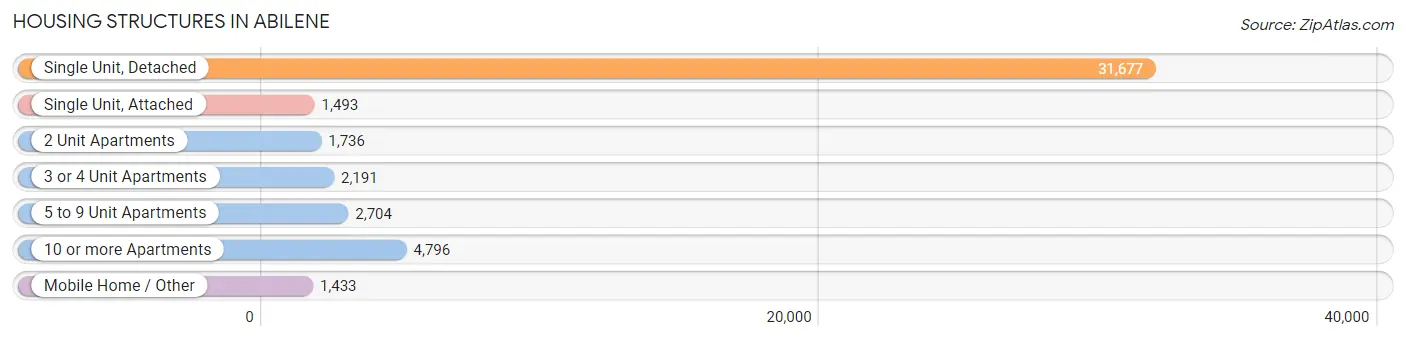
| Structure Type | # Housing Units | % Housing Units |
| Single Unit, Detached | 31,677 | 68.8% |
| Single Unit, Attached | 1,493 | 3.2% |
| 2 Unit Apartments | 1,736 | 3.8% |
| 3 or 4 Unit Apartments | 2,191 | 4.8% |
| 5 to 9 Unit Apartments | 2,704 | 5.9% |
| 10 or more Apartments | 4,796 | 10.4% |
| Mobile Home / Other | 1,433 | 3.1% |
| Total | 46,030 | 100.0% |
Housing Structures by Occupancy in Abilene
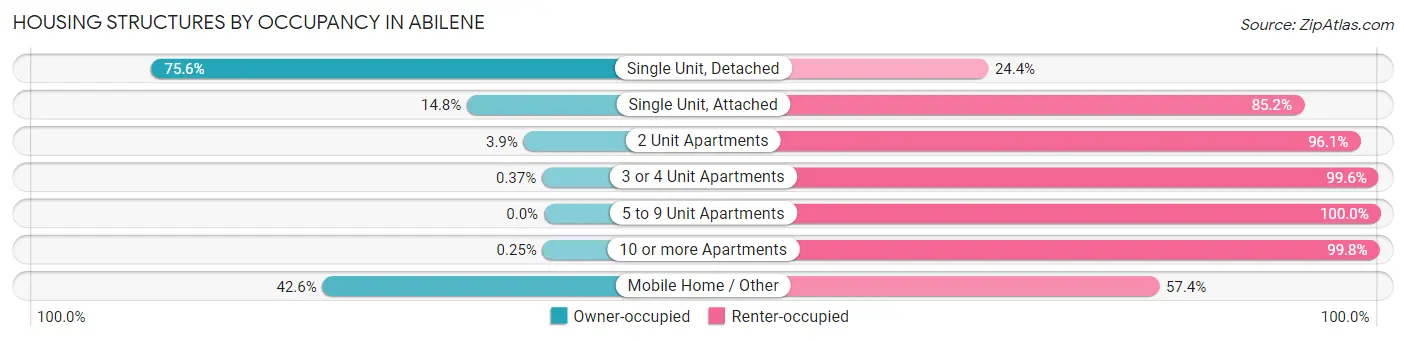
| Structure Type | Owner-occupied | Renter-occupied |
| Single Unit, Detached | 23,945 (75.6%) | 7,732 (24.4%) |
| Single Unit, Attached | 221 (14.8%) | 1,272 (85.2%) |
| 2 Unit Apartments | 68 (3.9%) | 1,668 (96.1%) |
| 3 or 4 Unit Apartments | 8 (0.4%) | 2,183 (99.6%) |
| 5 to 9 Unit Apartments | 0 (0.0%) | 2,704 (100.0%) |
| 10 or more Apartments | 12 (0.3%) | 4,784 (99.8%) |
| Mobile Home / Other | 611 (42.6%) | 822 (57.4%) |
| Total | 24,865 (54.0%) | 21,165 (46.0%) |
Housing Structures by Number of Rooms in Abilene
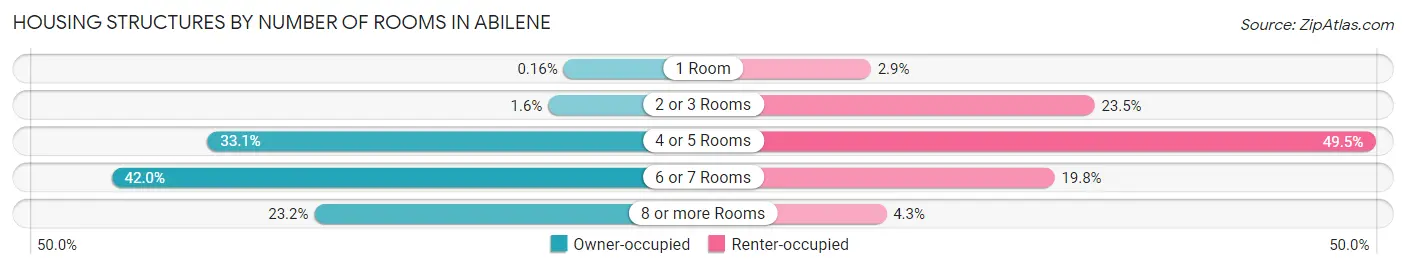
| Number of Rooms | Owner-occupied | Renter-occupied |
| 1 Room | 40 (0.2%) | 604 (2.9%) |
| 2 or 3 Rooms | 394 (1.6%) | 4,982 (23.5%) |
| 4 or 5 Rooms | 8,229 (33.1%) | 10,473 (49.5%) |
| 6 or 7 Rooms | 10,431 (41.9%) | 4,200 (19.8%) |
| 8 or more Rooms | 5,771 (23.2%) | 906 (4.3%) |
| Total | 24,865 (100.0%) | 21,165 (100.0%) |
Housing Structure by Heating Type in Abilene
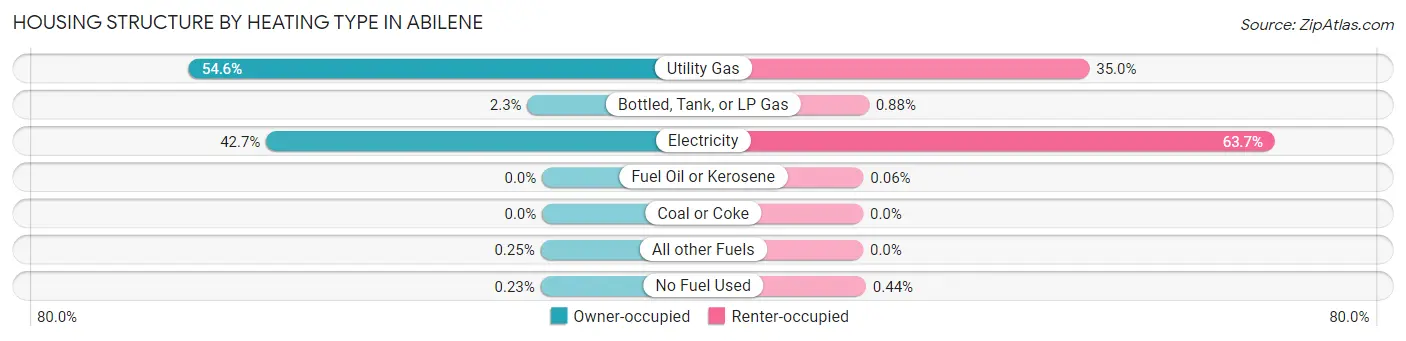
| Heating Type | Owner-occupied | Renter-occupied |
| Utility Gas | 13,577 (54.6%) | 7,401 (35.0%) |
| Bottled, Tank, or LP Gas | 564 (2.3%) | 186 (0.9%) |
| Electricity | 10,606 (42.6%) | 13,471 (63.6%) |
| Fuel Oil or Kerosene | 0 (0.0%) | 13 (0.1%) |
| Coal or Coke | 0 (0.0%) | 0 (0.0%) |
| All other Fuels | 62 (0.3%) | 0 (0.0%) |
| No Fuel Used | 56 (0.2%) | 94 (0.4%) |
| Total | 24,865 (100.0%) | 21,165 (100.0%) |
Household Vehicle Usage in Abilene
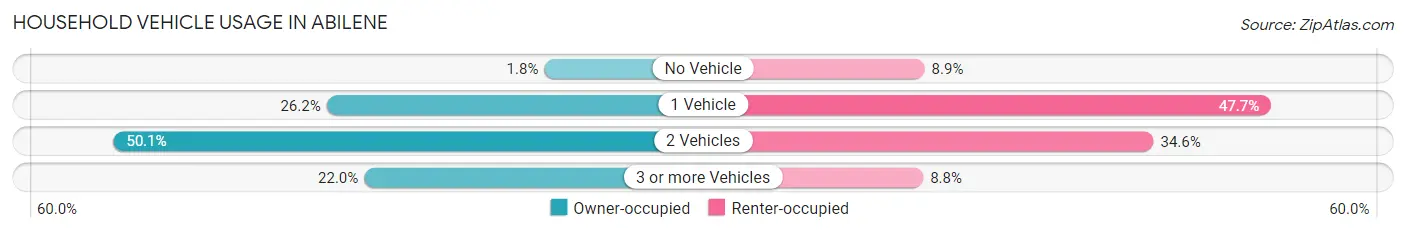
| Vehicles per Household | Owner-occupied | Renter-occupied |
| No Vehicle | 445 (1.8%) | 1,890 (8.9%) |
| 1 Vehicle | 6,510 (26.2%) | 10,102 (47.7%) |
| 2 Vehicles | 12,448 (50.1%) | 7,316 (34.6%) |
| 3 or more Vehicles | 5,462 (22.0%) | 1,857 (8.8%) |
| Total | 24,865 (100.0%) | 21,165 (100.0%) |
Real Estate & Mortgages in Abilene
Real Estate and Mortgage Overview in Abilene
| Characteristic | Without Mortgage | With Mortgage |
| Housing Units | 11,183 | 13,682 |
| Median Property Value | $121,400 | $182,800 |
| Median Household Income | $62,835 | $2,758 |
| Monthly Housing Costs | $535 | $864 |
| Real Estate Taxes | $1,590 | $637 |
Property Value by Mortgage Status in Abilene
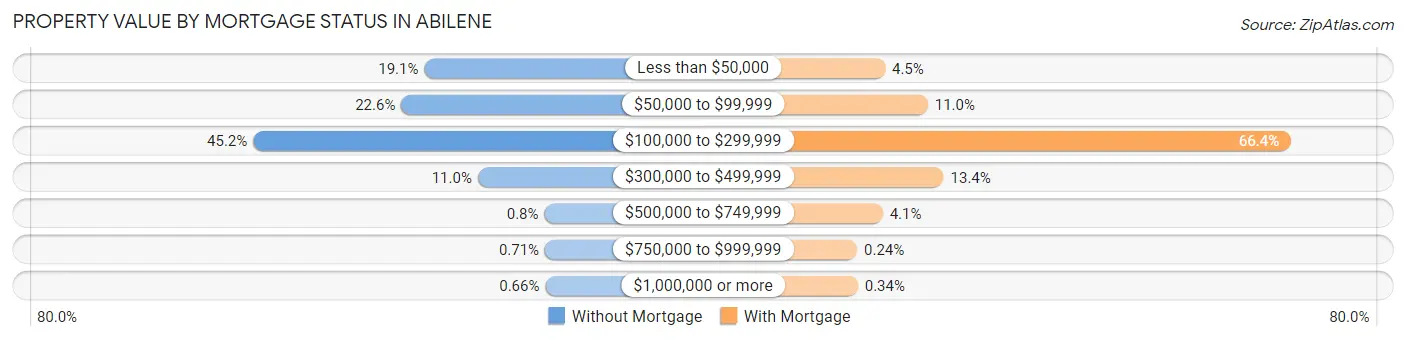
| Property Value | Without Mortgage | With Mortgage |
| Less than $50,000 | 2,135 (19.1%) | 615 (4.5%) |
| $50,000 to $99,999 | 2,528 (22.6%) | 1,506 (11.0%) |
| $100,000 to $299,999 | 5,053 (45.2%) | 9,079 (66.4%) |
| $300,000 to $499,999 | 1,225 (11.0%) | 1,836 (13.4%) |
| $500,000 to $749,999 | 89 (0.8%) | 567 (4.1%) |
| $750,000 to $999,999 | 79 (0.7%) | 33 (0.2%) |
| $1,000,000 or more | 74 (0.7%) | 46 (0.3%) |
| Total | 11,183 (100.0%) | 13,682 (100.0%) |
Household Income by Mortgage Status in Abilene
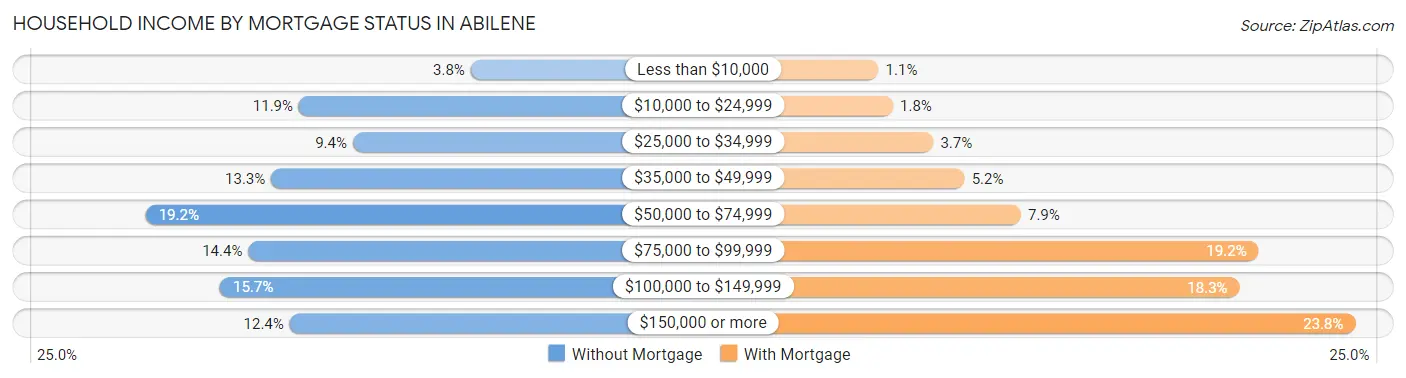
| Household Income | Without Mortgage | With Mortgage |
| Less than $10,000 | 421 (3.8%) | 151 (1.1%) |
| $10,000 to $24,999 | 1,335 (11.9%) | 245 (1.8%) |
| $25,000 to $34,999 | 1,048 (9.4%) | 507 (3.7%) |
| $35,000 to $49,999 | 1,483 (13.3%) | 711 (5.2%) |
| $50,000 to $74,999 | 2,151 (19.2%) | 1,078 (7.9%) |
| $75,000 to $99,999 | 1,605 (14.3%) | 2,626 (19.2%) |
| $100,000 to $149,999 | 1,755 (15.7%) | 2,501 (18.3%) |
| $150,000 or more | 1,385 (12.4%) | 3,256 (23.8%) |
| Total | 11,183 (100.0%) | 13,682 (100.0%) |
Property Value to Household Income Ratio in Abilene
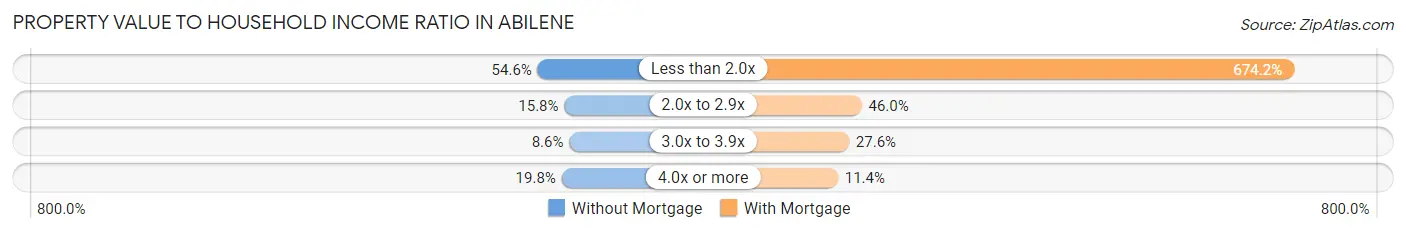
| Value-to-Income Ratio | Without Mortgage | With Mortgage |
| Less than 2.0x | 6,107 (54.6%) | 92,242 (674.2%) |
| 2.0x to 2.9x | 1,770 (15.8%) | 6,290 (46.0%) |
| 3.0x to 3.9x | 965 (8.6%) | 3,775 (27.6%) |
| 4.0x or more | 2,209 (19.8%) | 1,562 (11.4%) |
| Total | 11,183 (100.0%) | 13,682 (100.0%) |
Real Estate Taxes by Mortgage Status in Abilene
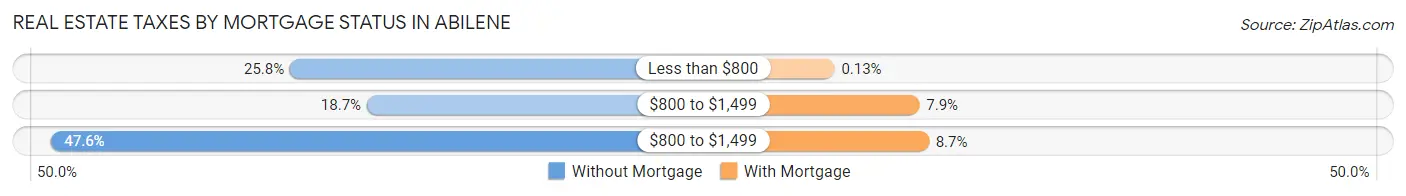
| Property Taxes | Without Mortgage | With Mortgage |
| Less than $800 | 2,881 (25.8%) | 18 (0.1%) |
| $800 to $1,499 | 2,096 (18.7%) | 1,078 (7.9%) |
| $800 to $1,499 | 5,317 (47.5%) | 1,196 (8.7%) |
| Total | 11,183 (100.0%) | 13,682 (100.0%) |
Health & Disability in Abilene
Health Insurance Coverage by Age in Abilene
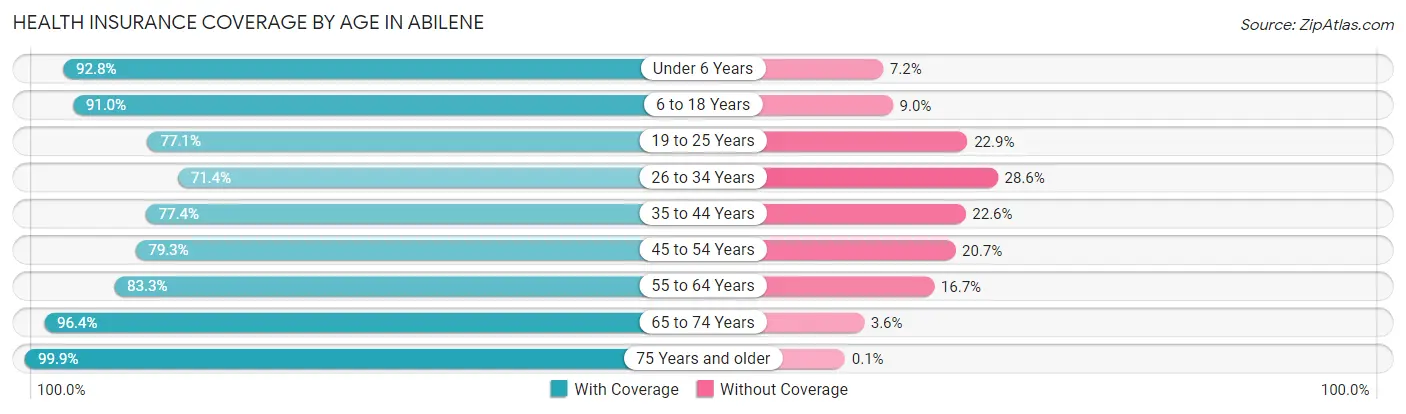
| Age Bracket | With Coverage | Without Coverage |
| Under 6 Years | 8,922 (92.8%) | 692 (7.2%) |
| 6 to 18 Years | 19,726 (91.0%) | 1,950 (9.0%) |
| 19 to 25 Years | 12,642 (77.1%) | 3,762 (22.9%) |
| 26 to 34 Years | 10,025 (71.4%) | 4,011 (28.6%) |
| 35 to 44 Years | 10,896 (77.4%) | 3,177 (22.6%) |
| 45 to 54 Years | 7,751 (79.3%) | 2,018 (20.7%) |
| 55 to 64 Years | 10,217 (83.3%) | 2,050 (16.7%) |
| 65 to 74 Years | 8,599 (96.4%) | 324 (3.6%) |
| 75 Years and older | 7,351 (99.9%) | 7 (0.1%) |
| Total | 96,129 (84.2%) | 17,991 (15.8%) |
Health Insurance Coverage by Citizenship Status in Abilene
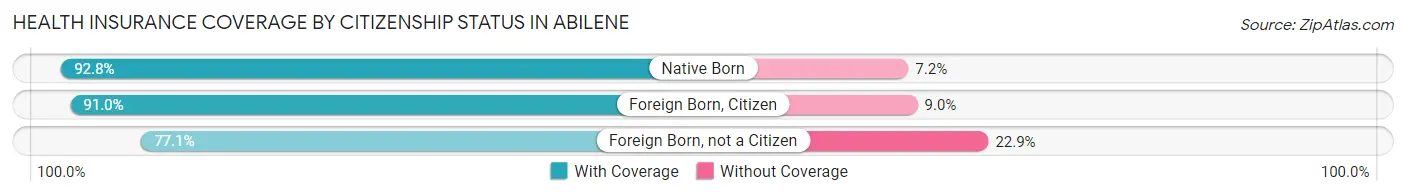
| Citizenship Status | With Coverage | Without Coverage |
| Native Born | 8,922 (92.8%) | 692 (7.2%) |
| Foreign Born, Citizen | 19,726 (91.0%) | 1,950 (9.0%) |
| Foreign Born, not a Citizen | 12,642 (77.1%) | 3,762 (22.9%) |
Health Insurance Coverage by Household Income in Abilene
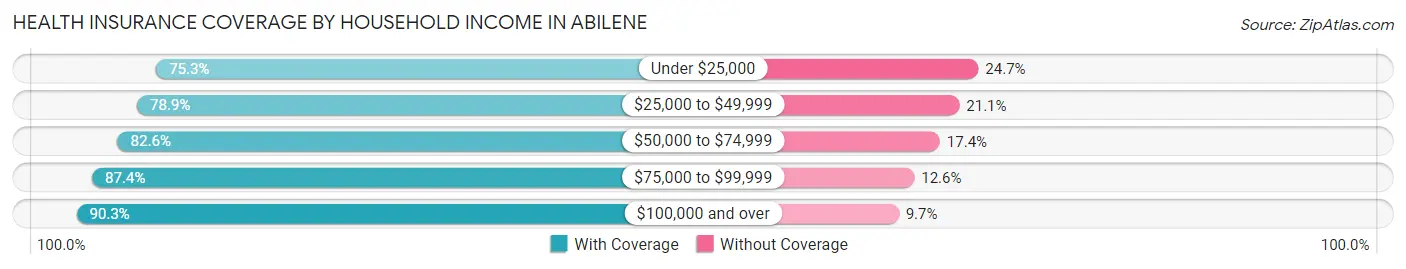
| Household Income | With Coverage | Without Coverage |
| Under $25,000 | 11,527 (75.3%) | 3,773 (24.7%) |
| $25,000 to $49,999 | 16,885 (78.9%) | 4,512 (21.1%) |
| $50,000 to $74,999 | 17,035 (82.6%) | 3,599 (17.4%) |
| $75,000 to $99,999 | 15,374 (87.4%) | 2,225 (12.6%) |
| $100,000 and over | 31,396 (90.3%) | 3,381 (9.7%) |
Public vs Private Health Insurance Coverage by Age in Abilene
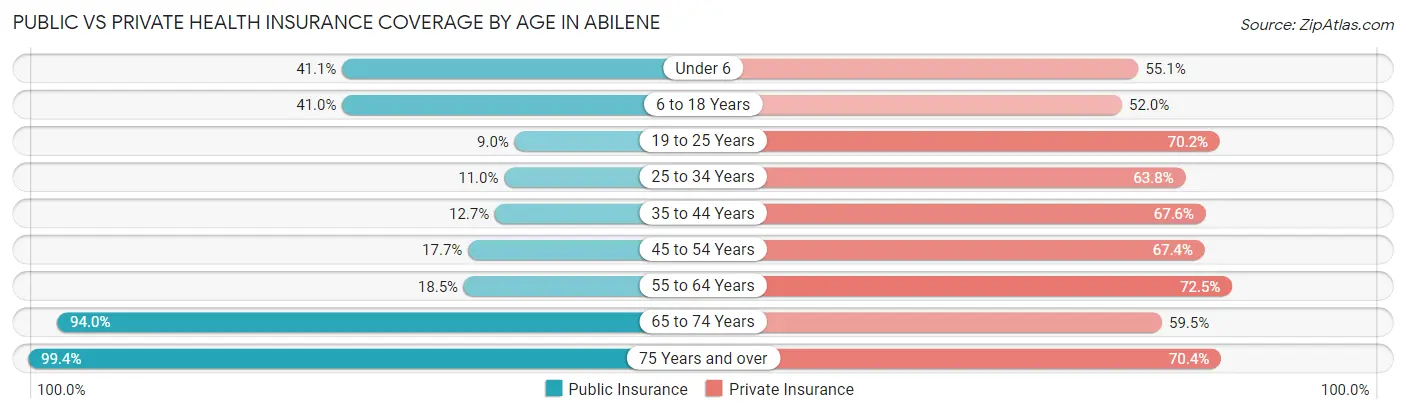
| Age Bracket | Public Insurance | Private Insurance |
| Under 6 | 3,947 (41.0%) | 5,294 (55.1%) |
| 6 to 18 Years | 8,893 (41.0%) | 11,279 (52.0%) |
| 19 to 25 Years | 1,483 (9.0%) | 11,512 (70.2%) |
| 25 to 34 Years | 1,538 (11.0%) | 8,954 (63.8%) |
| 35 to 44 Years | 1,784 (12.7%) | 9,509 (67.6%) |
| 45 to 54 Years | 1,726 (17.7%) | 6,582 (67.4%) |
| 55 to 64 Years | 2,264 (18.5%) | 8,889 (72.5%) |
| 65 to 74 Years | 8,384 (94.0%) | 5,305 (59.5%) |
| 75 Years and over | 7,311 (99.4%) | 5,181 (70.4%) |
| Total | 37,330 (32.7%) | 72,505 (63.5%) |
Disability Status by Sex by Age in Abilene
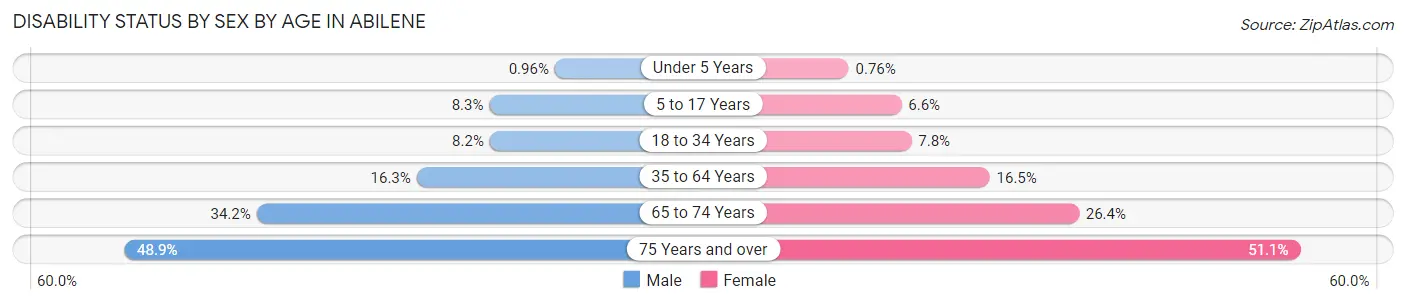
| Age Bracket | Male | Female |
| Under 5 Years | 40 (1.0%) | 31 (0.8%) |
| 5 to 17 Years | 866 (8.3%) | 683 (6.6%) |
| 18 to 34 Years | 1,230 (8.2%) | 1,368 (7.7%) |
| 35 to 64 Years | 2,823 (16.3%) | 3,100 (16.5%) |
| 65 to 74 Years | 1,372 (34.2%) | 1,295 (26.4%) |
| 75 Years and over | 1,409 (48.9%) | 2,286 (51.1%) |
Disability Class by Sex by Age in Abilene
Disability Class: Hearing Difficulty
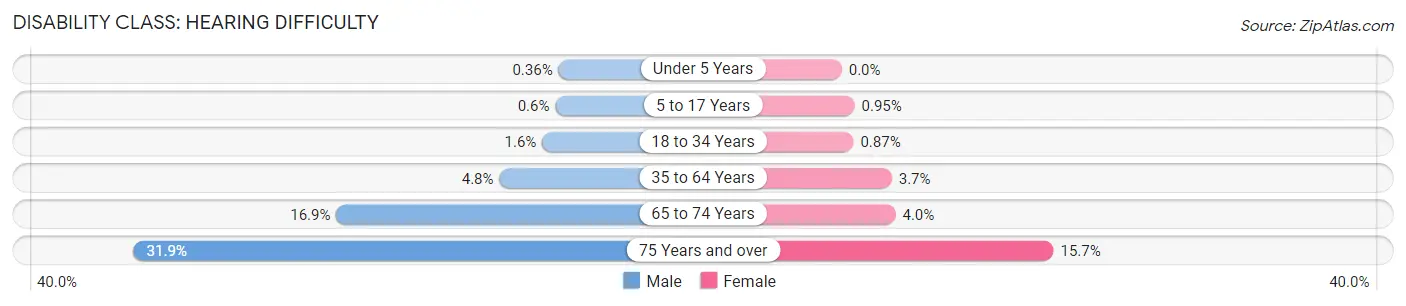
| Age Bracket | Male | Female |
| Under 5 Years | 15 (0.4%) | 0 (0.0%) |
| 5 to 17 Years | 63 (0.6%) | 98 (0.9%) |
| 18 to 34 Years | 236 (1.6%) | 153 (0.9%) |
| 35 to 64 Years | 821 (4.8%) | 699 (3.7%) |
| 65 to 74 Years | 677 (16.9%) | 196 (4.0%) |
| 75 Years and over | 919 (31.9%) | 704 (15.7%) |
Disability Class: Vision Difficulty
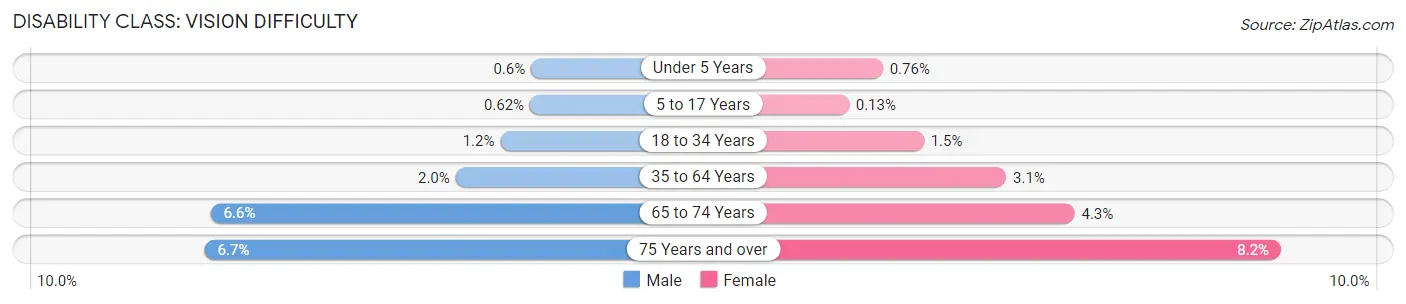
| Age Bracket | Male | Female |
| Under 5 Years | 25 (0.6%) | 31 (0.8%) |
| 5 to 17 Years | 65 (0.6%) | 13 (0.1%) |
| 18 to 34 Years | 176 (1.2%) | 268 (1.5%) |
| 35 to 64 Years | 345 (2.0%) | 574 (3.0%) |
| 65 to 74 Years | 263 (6.6%) | 212 (4.3%) |
| 75 Years and over | 192 (6.7%) | 365 (8.2%) |
Disability Class: Cognitive Difficulty
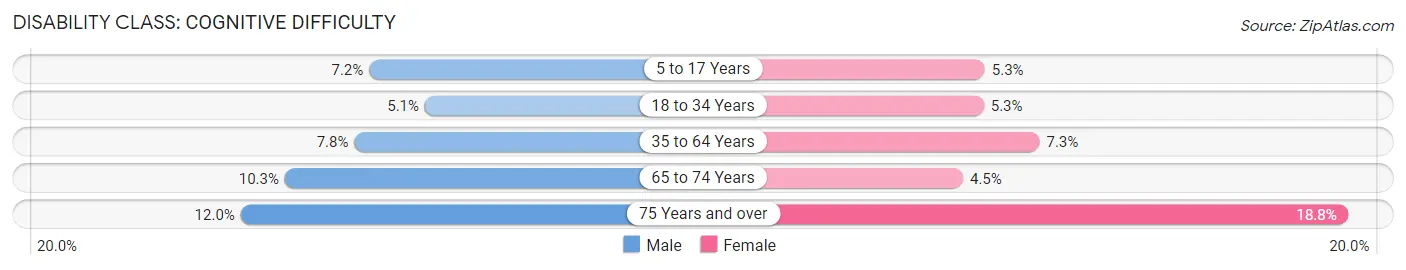
| Age Bracket | Male | Female |
| 5 to 17 Years | 756 (7.2%) | 547 (5.3%) |
| 18 to 34 Years | 771 (5.1%) | 930 (5.3%) |
| 35 to 64 Years | 1,340 (7.8%) | 1,383 (7.3%) |
| 65 to 74 Years | 415 (10.3%) | 221 (4.5%) |
| 75 Years and over | 345 (12.0%) | 842 (18.8%) |
Disability Class: Ambulatory Difficulty
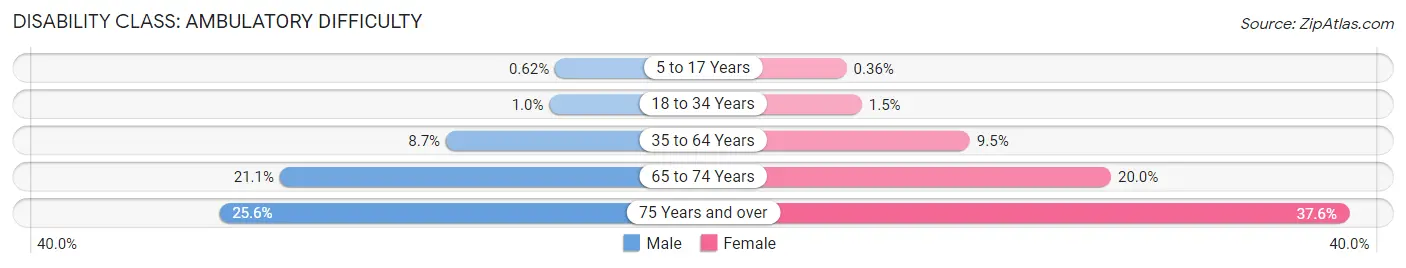
| Age Bracket | Male | Female |
| 5 to 17 Years | 65 (0.6%) | 37 (0.4%) |
| 18 to 34 Years | 156 (1.0%) | 264 (1.5%) |
| 35 to 64 Years | 1,506 (8.7%) | 1,790 (9.5%) |
| 65 to 74 Years | 845 (21.0%) | 981 (20.0%) |
| 75 Years and over | 736 (25.6%) | 1,685 (37.6%) |
Disability Class: Self-Care Difficulty
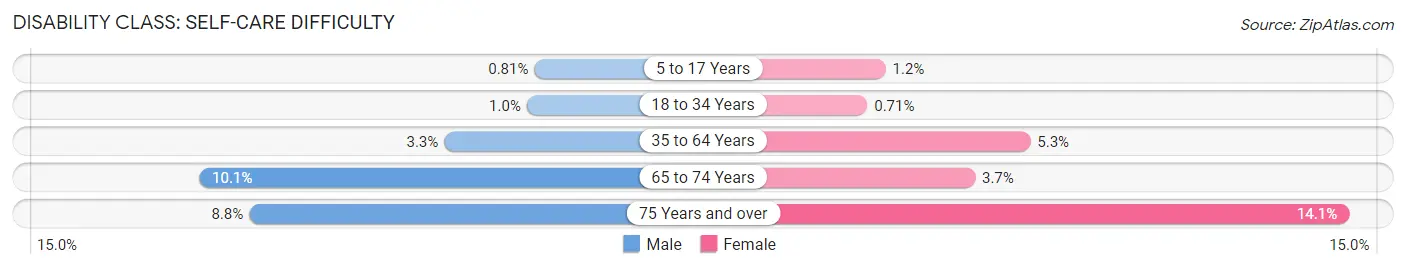
| Age Bracket | Male | Female |
| 5 to 17 Years | 85 (0.8%) | 126 (1.2%) |
| 18 to 34 Years | 153 (1.0%) | 126 (0.7%) |
| 35 to 64 Years | 573 (3.3%) | 989 (5.2%) |
| 65 to 74 Years | 407 (10.1%) | 182 (3.7%) |
| 75 Years and over | 252 (8.7%) | 632 (14.1%) |
Technology Access in Abilene
Computing Device Access in Abilene
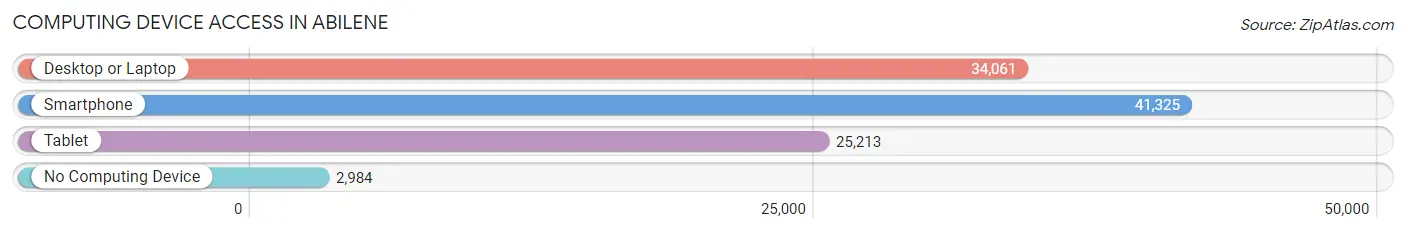
| Device Type | # Households | % Households |
| Desktop or Laptop | 34,061 | 74.0% |
| Smartphone | 41,325 | 89.8% |
| Tablet | 25,213 | 54.8% |
| No Computing Device | 2,984 | 6.5% |
| Total | 46,030 | 100.0% |
Internet Access in Abilene
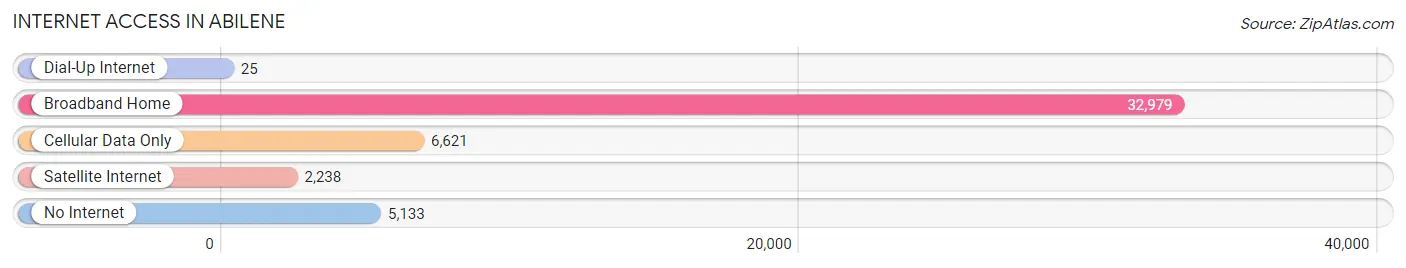
| Internet Type | # Households | % Households |
| Dial-Up Internet | 25 | 0.1% |
| Broadband Home | 32,979 | 71.7% |
| Cellular Data Only | 6,621 | 14.4% |
| Satellite Internet | 2,238 | 4.9% |
| No Internet | 5,133 | 11.2% |
| Total | 46,030 | 100.0% |
Abilene Summary
Abilene, Texas is a city located in Taylor and Jones counties in the state of Texas. It is the county seat of Taylor County and is located off of Interstate 20, about 180 miles west of Dallas. Abilene is the principal city of the Abilene Metropolitan Statistical Area, which had a population of 166,416 in 2019.
History
The area around Abilene was first settled in 1881 by cattle ranchers. The city was named after Abilene, Kansas, the original endpoint for the Chisholm Trail. The city was incorporated in 1883 and became the county seat of Taylor County in 1884.
Abilene was a major stop on the Texas and Pacific Railway, which connected the city to Fort Worth and Dallas. The city grew rapidly in the late 19th and early 20th centuries, becoming a center for the cattle industry and a hub for the oil industry.
Geography
Abilene is located in the rolling hills of West Central Texas, about 180 miles west of Dallas. The city is situated at the intersection of Interstate 20 and US Highway 83. Abilene is located in Taylor and Jones counties, with the majority of the city located in Taylor County.
The city has a total area of 112.2 square miles, of which 111.2 square miles is land and 1.0 square mile is water. Abilene is located in the Edwards Plateau region of Texas, which is characterized by rolling hills and limestone outcroppings.
Economy
Abilene’s economy is largely based on the service industry, with healthcare, education, and retail being the largest sectors. The city is also home to several manufacturing companies, including Abilene Machine, Inc., which produces agricultural and industrial equipment.
The city is also home to Dyess Air Force Base, which is a major employer in the area. The base is home to the 7th Bomb Wing, which is part of the Air Force Global Strike Command.
Demographics
As of the 2019 census, Abilene had a population of 122,999. The city has a population density of 1,097 people per square mile. The racial makeup of the city is 73.2% White, 17.3% Hispanic or Latino, 8.2% African American, 1.2% Asian, and 0.3% Native American.
Abilene has a median household income of $45,837 and a poverty rate of 17.3%. The city’s largest employers are Hendrick Medical Center, Abilene Independent School District, and Dyess Air Force Base.
Conclusion
Abilene, Texas is a city located in Taylor and Jones counties in the state of Texas. It is the county seat of Taylor County and is located off of Interstate 20, about 180 miles west of Dallas. Abilene is the principal city of the Abilene Metropolitan Statistical Area, which had a population of 166,416 in 2019. The city has a long history as a center for the cattle industry and a hub for the oil industry. Abilene’s economy is largely based on the service industry, with healthcare, education, and retail being the largest sectors. The city has a population of 122,999 and a median household income of $45,837. Abilene is home to Dyess Air Force Base, which is a major employer in the area.
Common Questions
What is Per Capita Income in Abilene?
Per Capita income in Abilene is $29,272.
What is the Median Family Income in Abilene?
Median Family Income in Abilene is $75,460.
What is the Median Household income in Abilene?
Median Household Income in Abilene is $59,254.
What is Income or Wage Gap in Abilene?
Income or Wage Gap in Abilene is 20.2%.
Women in Abilene earn 79.8 cents for every dollar earned by a man.
What is Family Income Deficit in Abilene?
Family Income Deficit in Abilene is $10,290.
Families that are below poverty line in Abilene earn $10,290 less on average than the poverty threshold level.
What is Inequality or Gini Index in Abilene?
Inequality or Gini Index in Abilene is 0.45.
What is the Total Population of Abilene?
Total Population of Abilene is 126,356.
What is the Total Male Population of Abilene?
Total Male Population of Abilene is 64,608.
What is the Total Female Population of Abilene?
Total Female Population of Abilene is 61,748.
What is the Ratio of Males per 100 Females in Abilene?
There are 104.63 Males per 100 Females in Abilene.
What is the Ratio of Females per 100 Males in Abilene?
There are 95.57 Females per 100 Males in Abilene.
What is the Median Population Age in Abilene?
Median Population Age in Abilene is 32.2 Years.
What is the Average Family Size in Abilene
Average Family Size in Abilene is 3.0 People.
What is the Average Household Size in Abilene
Average Household Size in Abilene is 2.5 People.
How Large is the Labor Force in Abilene?
There are 62,373 People in the Labor Forcein in Abilene.
What is the Percentage of People in the Labor Force in Abilene?
62.3% of People are in the Labor Force in Abilene.
What is the Unemployment Rate in Abilene?
Unemployment Rate in Abilene is 2.8%.