Seabrook, TX Map & Demographics
Seabrook Map
Seabrook Overview
$51,065
PER CAPITA INCOME
$144,432
AVG FAMILY INCOME
$96,223
AVG HOUSEHOLD INCOME
44.0%
WAGE / INCOME GAP [ % ]
56.0¢/ $1
WAGE / INCOME GAP [ $ ]
0.44
INEQUALITY / GINI INDEX
13,558
TOTAL POPULATION
6,733
MALE POPULATION
6,825
FEMALE POPULATION
98.65
MALES / 100 FEMALES
101.37
FEMALES / 100 MALES
34.8
MEDIAN AGE
3.2
AVG FAMILY SIZE
2.5
AVG HOUSEHOLD SIZE
7,582
LABOR FORCE [ PEOPLE ]
70.3%
PERCENT IN LABOR FORCE
3.8%
UNEMPLOYMENT RATE
Seabrook Zip Codes
Income in Seabrook
Income Overview in Seabrook
Per Capita Income in Seabrook is $51,065, while median incomes of families and households are $144,432 and $96,223 respectively.
| Characteristic | Number | Measure |
| Per Capita Income | 13,558 | $51,065 |
| Median Family Income | 3,266 | $144,432 |
| Mean Family Income | 3,266 | $151,406 |
| Median Household Income | 5,477 | $96,223 |
| Mean Household Income | 5,477 | $126,553 |
| Income Deficit | 3,266 | $0 |
| Wage / Income Gap (%) | 13,558 | 43.97% |
| Wage / Income Gap ($) | 13,558 | 56.03¢ per $1 |
| Gini / Inequality Index | 13,558 | 0.44 |
Earnings by Sex in Seabrook
Average Earnings in Seabrook are $50,093, $70,644 for men and $39,583 for women, a difference of 44.0%.
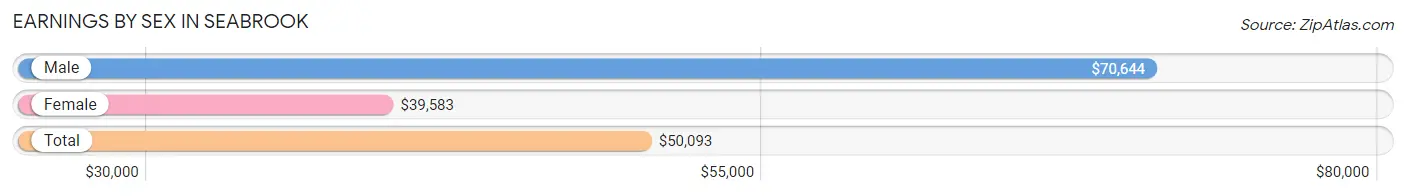
| Sex | Number | Average Earnings |
| Male | 4,310 (55.8%) | $70,644 |
| Female | 3,412 (44.2%) | $39,583 |
| Total | 7,722 (100.0%) | $50,093 |
Earnings by Sex by Income Bracket in Seabrook
The most common earnings brackets in Seabrook are $100,000+ for men (1,581 | 36.7%) and $100,000+ for women (371 | 10.9%).
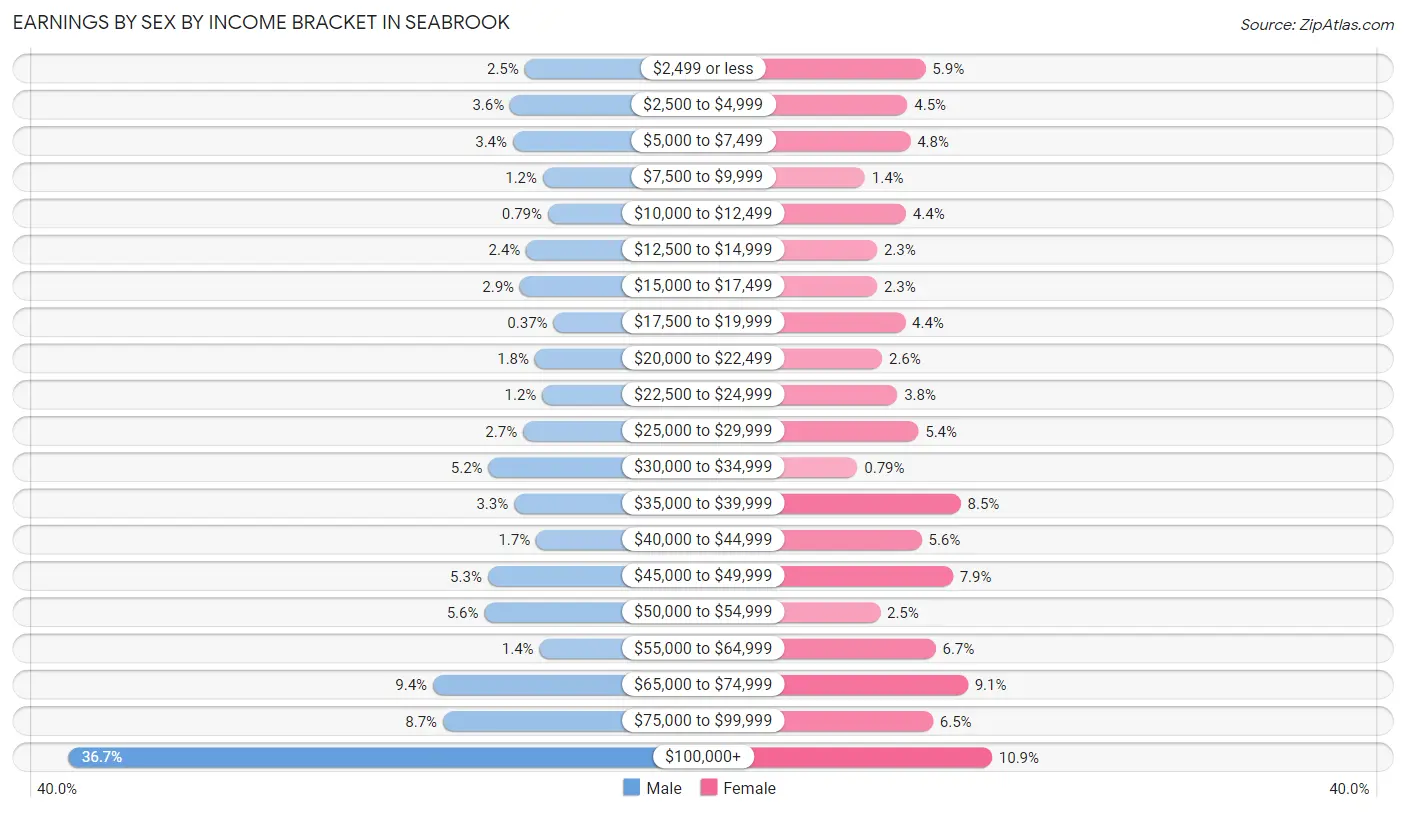
| Income | Male | Female |
| $2,499 or less | 109 (2.5%) | 201 (5.9%) |
| $2,500 to $4,999 | 156 (3.6%) | 155 (4.5%) |
| $5,000 to $7,499 | 147 (3.4%) | 162 (4.8%) |
| $7,500 to $9,999 | 50 (1.2%) | 46 (1.3%) |
| $10,000 to $12,499 | 34 (0.8%) | 151 (4.4%) |
| $12,500 to $14,999 | 104 (2.4%) | 77 (2.3%) |
| $15,000 to $17,499 | 124 (2.9%) | 77 (2.3%) |
| $17,500 to $19,999 | 16 (0.4%) | 149 (4.4%) |
| $20,000 to $22,499 | 76 (1.8%) | 90 (2.6%) |
| $22,500 to $24,999 | 52 (1.2%) | 129 (3.8%) |
| $25,000 to $29,999 | 114 (2.6%) | 183 (5.4%) |
| $30,000 to $34,999 | 226 (5.2%) | 27 (0.8%) |
| $35,000 to $39,999 | 143 (3.3%) | 291 (8.5%) |
| $40,000 to $44,999 | 72 (1.7%) | 191 (5.6%) |
| $45,000 to $49,999 | 228 (5.3%) | 271 (7.9%) |
| $50,000 to $54,999 | 239 (5.6%) | 85 (2.5%) |
| $55,000 to $64,999 | 61 (1.4%) | 227 (6.7%) |
| $65,000 to $74,999 | 405 (9.4%) | 309 (9.1%) |
| $75,000 to $99,999 | 373 (8.6%) | 220 (6.5%) |
| $100,000+ | 1,581 (36.7%) | 371 (10.9%) |
| Total | 4,310 (100.0%) | 3,412 (100.0%) |
Earnings by Sex by Educational Attainment in Seabrook
Average earnings in Seabrook are $81,727 for men and $43,500 for women, a difference of 46.8%. Men with an educational attainment of graduate degree enjoy the highest average annual earnings of $160,859, while those with less than high school education earn the least with $41,902. Women with an educational attainment of graduate degree earn the most with the average annual earnings of $105,351, while those with less than high school education have the smallest earnings of $13,486.
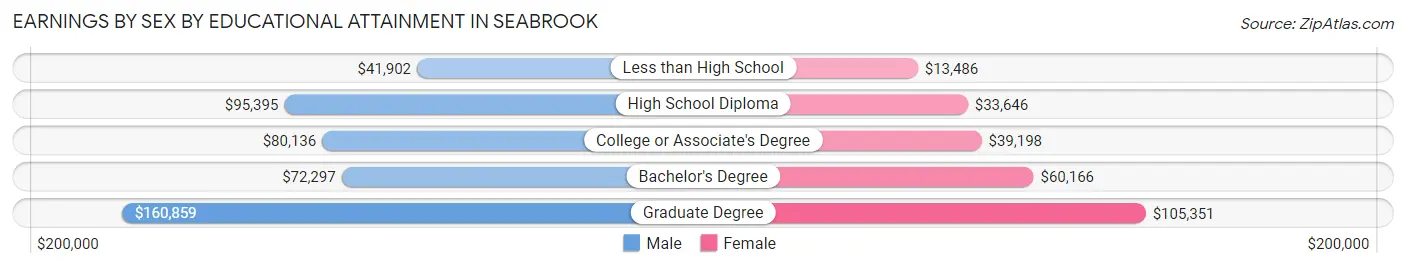
| Educational Attainment | Male Income | Female Income |
| Less than High School | $41,902 | $13,486 |
| High School Diploma | $95,395 | $33,646 |
| College or Associate's Degree | $80,136 | $39,198 |
| Bachelor's Degree | $72,297 | $60,166 |
| Graduate Degree | $160,859 | $105,351 |
| Total | $81,727 | $43,500 |
Family Income in Seabrook
Family Income Brackets in Seabrook
According to the Seabrook family income data, there are 823 families falling into the $200,000+ income range, which is the most common income bracket and makes up 25.2% of all families. Conversely, the $15,000 to $24,999 income bracket is the least frequent group with only 20 families (0.6%) belonging to this category.
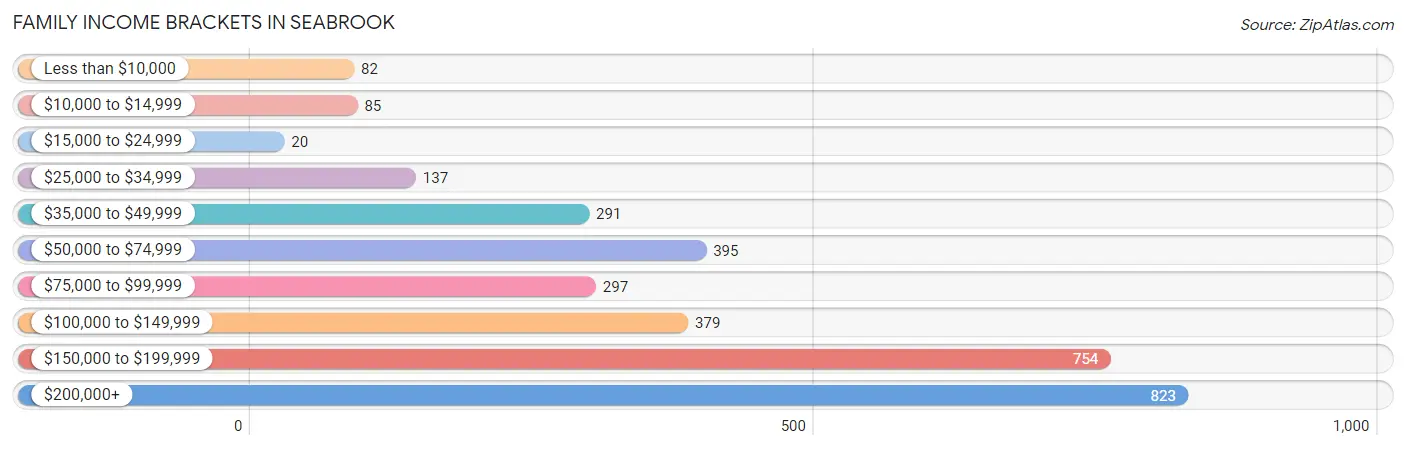
| Income Bracket | # Families | % Families |
| Less than $10,000 | 82 | 2.5% |
| $10,000 to $14,999 | 85 | 2.6% |
| $15,000 to $24,999 | 20 | 0.6% |
| $25,000 to $34,999 | 137 | 4.2% |
| $35,000 to $49,999 | 291 | 8.9% |
| $50,000 to $74,999 | 395 | 12.1% |
| $75,000 to $99,999 | 297 | 9.1% |
| $100,000 to $149,999 | 379 | 11.6% |
| $150,000 to $199,999 | 754 | 23.1% |
| $200,000+ | 823 | 25.2% |
Family Income by Famaliy Size in Seabrook
3-person families (670 | 20.5%) account for the highest median family income in Seabrook with $188,487 per family, while 3-person families (670 | 20.5%) have the highest median income of $62,829 per family member.
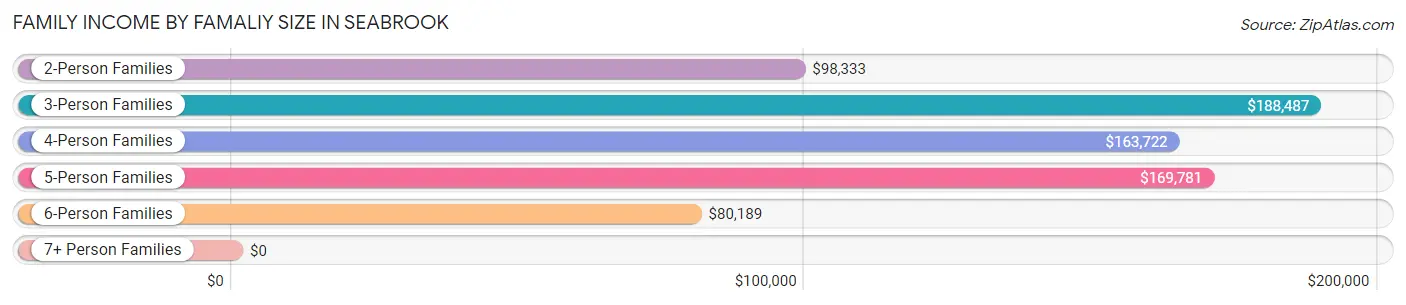
| Income Bracket | # Families | Median Income |
| 2-Person Families | 1,454 (44.5%) | $98,333 |
| 3-Person Families | 670 (20.5%) | $188,487 |
| 4-Person Families | 688 (21.1%) | $163,722 |
| 5-Person Families | 152 (4.6%) | $169,781 |
| 6-Person Families | 216 (6.6%) | $80,189 |
| 7+ Person Families | 86 (2.6%) | $0 |
| Total | 3,266 (100.0%) | $144,432 |
Family Income by Number of Earners in Seabrook
The median family income in Seabrook is $144,432, with families comprising 3+ earners (332) having the highest median family income of $196,875, while families with no earners (459) have the lowest median family income of $75,925, accounting for 10.2% and 14.1% of families, respectively.
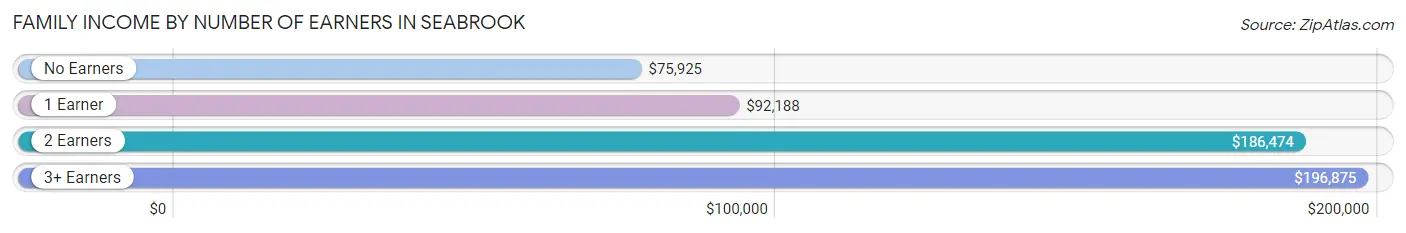
| Number of Earners | # Families | Median Income |
| No Earners | 459 (14.1%) | $75,925 |
| 1 Earner | 1,216 (37.2%) | $92,188 |
| 2 Earners | 1,259 (38.6%) | $186,474 |
| 3+ Earners | 332 (10.2%) | $196,875 |
| Total | 3,266 (100.0%) | $144,432 |
Household Income in Seabrook
Household Income Brackets in Seabrook
With 1,035 households falling in the category, the $200,000+ income range is the most frequent in Seabrook, accounting for 18.9% of all households. In contrast, only 137 households (2.5%) fall into the less than $10,000 income bracket, making it the least populous group.
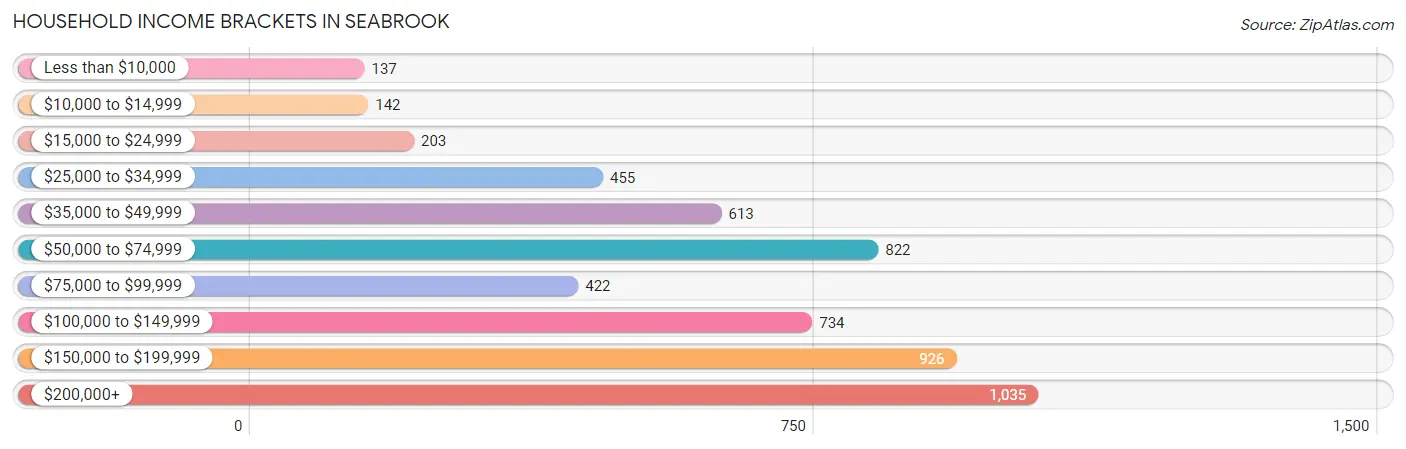
| Income Bracket | # Households | % Households |
| Less than $10,000 | 137 | 2.5% |
| $10,000 to $14,999 | 142 | 2.6% |
| $15,000 to $24,999 | 203 | 3.7% |
| $25,000 to $34,999 | 455 | 8.3% |
| $35,000 to $49,999 | 613 | 11.2% |
| $50,000 to $74,999 | 822 | 15.0% |
| $75,000 to $99,999 | 422 | 7.7% |
| $100,000 to $149,999 | 734 | 13.4% |
| $150,000 to $199,999 | 926 | 16.9% |
| $200,000+ | 1,035 | 18.9% |
Household Income by Householder Age in Seabrook
The median household income in Seabrook is $96,223, with the highest median household income of $126,488 found in the 45 to 64 years age bracket for the primary householder. A total of 2,039 households (37.2%) fall into this category. Meanwhile, the 15 to 24 years age bracket for the primary householder has the lowest median household income of $44,511, with 404 households (7.4%) in this group.
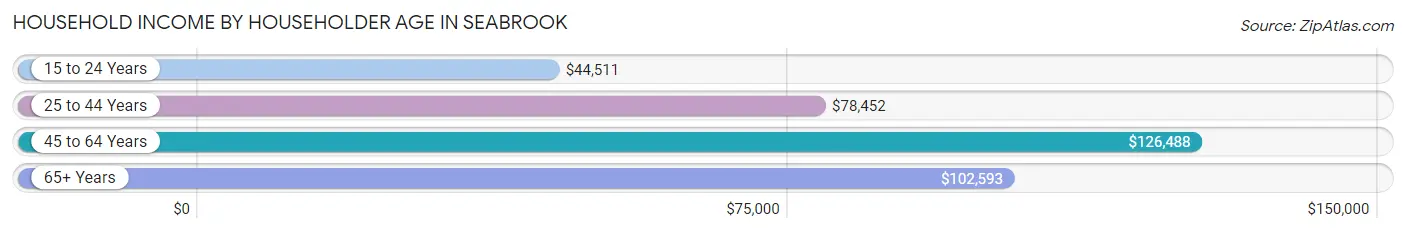
| Income Bracket | # Households | Median Income |
| 15 to 24 Years | 404 (7.4%) | $44,511 |
| 25 to 44 Years | 1,898 (34.6%) | $78,452 |
| 45 to 64 Years | 2,039 (37.2%) | $126,488 |
| 65+ Years | 1,136 (20.7%) | $102,593 |
| Total | 5,477 (100.0%) | $96,223 |
Poverty in Seabrook
Income Below Poverty by Sex and Age in Seabrook
With 5.6% poverty level for males and 7.2% for females among the residents of Seabrook, 35 to 44 year old males and 16 and 17 year old females are the most vulnerable to poverty, with 108 males (14.0%) and 41 females (15.2%) in their respective age groups living below the poverty level.
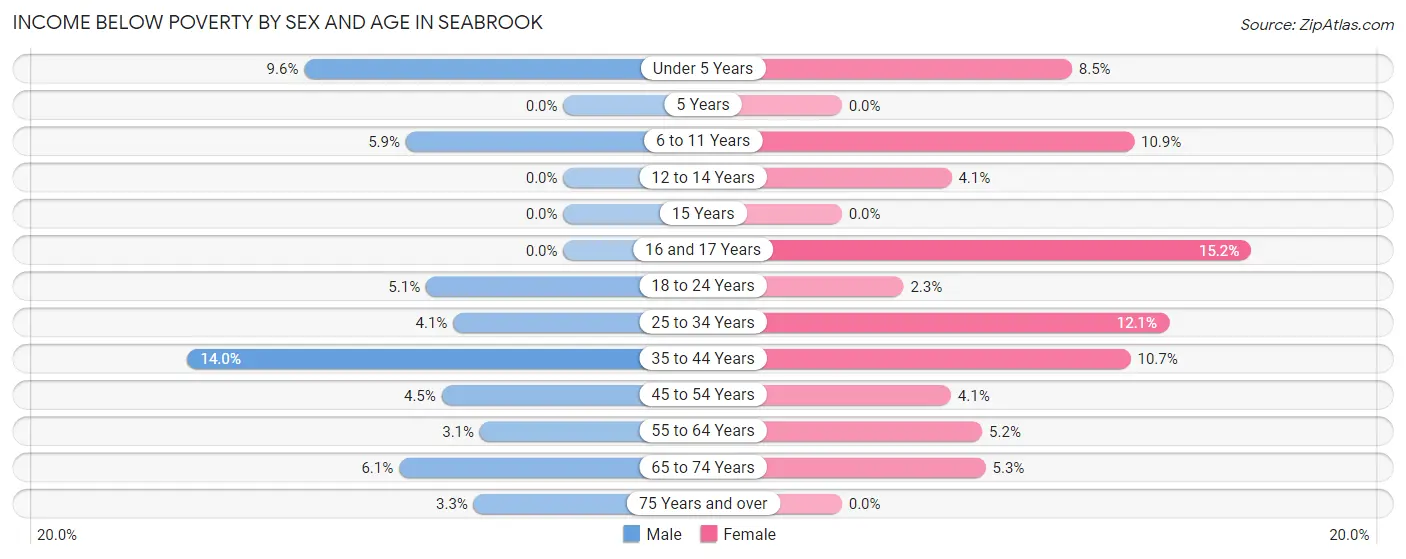
| Age Bracket | Male | Female |
| Under 5 Years | 43 (9.6%) | 41 (8.5%) |
| 5 Years | 0 (0.0%) | 0 (0.0%) |
| 6 to 11 Years | 20 (5.9%) | 73 (10.8%) |
| 12 to 14 Years | 0 (0.0%) | 15 (4.1%) |
| 15 Years | 0 (0.0%) | 0 (0.0%) |
| 16 and 17 Years | 0 (0.0%) | 41 (15.2%) |
| 18 to 24 Years | 39 (5.1%) | 14 (2.3%) |
| 25 to 34 Years | 53 (4.1%) | 118 (12.1%) |
| 35 to 44 Years | 108 (14.0%) | 83 (10.7%) |
| 45 to 54 Years | 41 (4.5%) | 40 (4.1%) |
| 55 to 64 Years | 24 (3.1%) | 40 (5.2%) |
| 65 to 74 Years | 42 (6.1%) | 29 (5.3%) |
| 75 Years and over | 9 (3.3%) | 0 (0.0%) |
| Total | 379 (5.6%) | 494 (7.2%) |
Income Above Poverty by Sex and Age in Seabrook
According to the poverty statistics in Seabrook, males aged 5 years and females aged 5 years are the age groups that are most secure financially, with 100.0% of males and 100.0% of females in these age groups living above the poverty line.
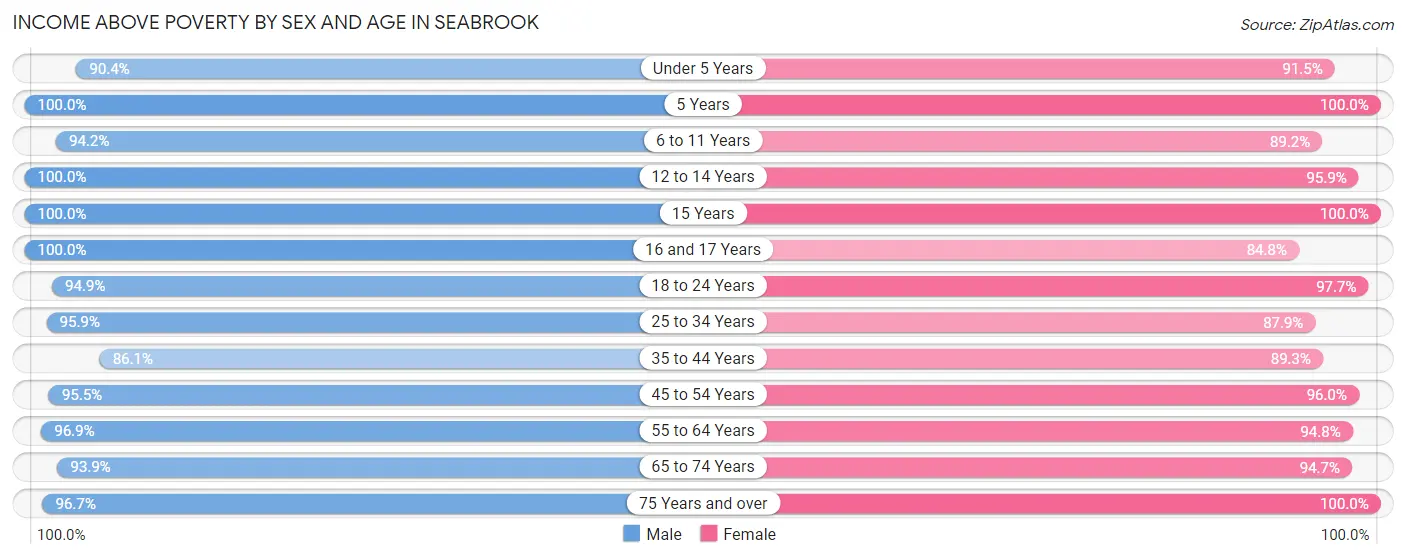
| Age Bracket | Male | Female |
| Under 5 Years | 404 (90.4%) | 439 (91.5%) |
| 5 Years | 58 (100.0%) | 100 (100.0%) |
| 6 to 11 Years | 322 (94.2%) | 600 (89.1%) |
| 12 to 14 Years | 140 (100.0%) | 354 (95.9%) |
| 15 Years | 146 (100.0%) | 18 (100.0%) |
| 16 and 17 Years | 124 (100.0%) | 229 (84.8%) |
| 18 to 24 Years | 726 (94.9%) | 598 (97.7%) |
| 25 to 34 Years | 1,244 (95.9%) | 854 (87.9%) |
| 35 to 44 Years | 666 (86.1%) | 691 (89.3%) |
| 45 to 54 Years | 866 (95.5%) | 948 (96.0%) |
| 55 to 64 Years | 750 (96.9%) | 728 (94.8%) |
| 65 to 74 Years | 647 (93.9%) | 514 (94.7%) |
| 75 Years and over | 261 (96.7%) | 258 (100.0%) |
| Total | 6,354 (94.4%) | 6,331 (92.8%) |
Income Below Poverty Among Married-Couple Families in Seabrook
The poverty statistics for married-couple families in Seabrook show that 1.4% or 34 of the total 2,480 families live below the poverty line. Families with no children have the highest poverty rate of 2.4%, comprising of 34 families. On the other hand, families with 1 or 2 children have the lowest poverty rate of 0.0%, which includes 0 families.
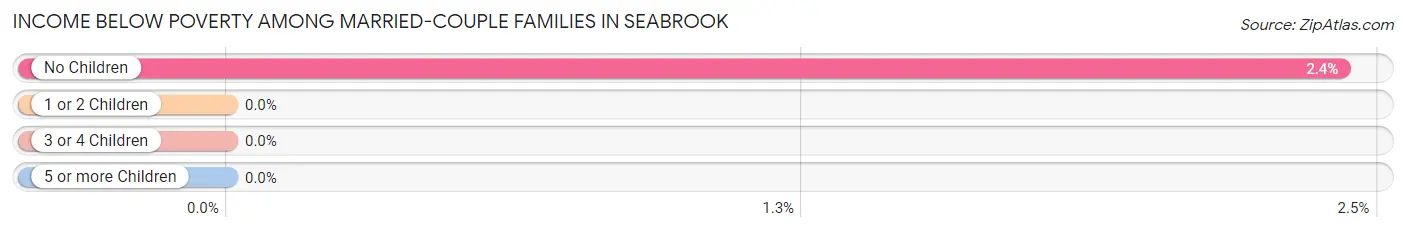
| Children | Above Poverty | Below Poverty |
| No Children | 1,373 (97.6%) | 34 (2.4%) |
| 1 or 2 Children | 881 (100.0%) | 0 (0.0%) |
| 3 or 4 Children | 192 (100.0%) | 0 (0.0%) |
| 5 or more Children | 0 (0.0%) | 0 (0.0%) |
| Total | 2,446 (98.6%) | 34 (1.4%) |
Income Below Poverty Among Single-Parent Households in Seabrook
According to the poverty data in Seabrook, 7.6% or 20 single-father households and 25.4% or 133 single-mother households are living below the poverty line. Among single-father households, those with 1 or 2 children have the highest poverty rate, with 20 households (11.2%) experiencing poverty. Likewise, among single-mother households, those with 3 or 4 children have the highest poverty rate, with 35 households (100.0%) falling below the poverty line.
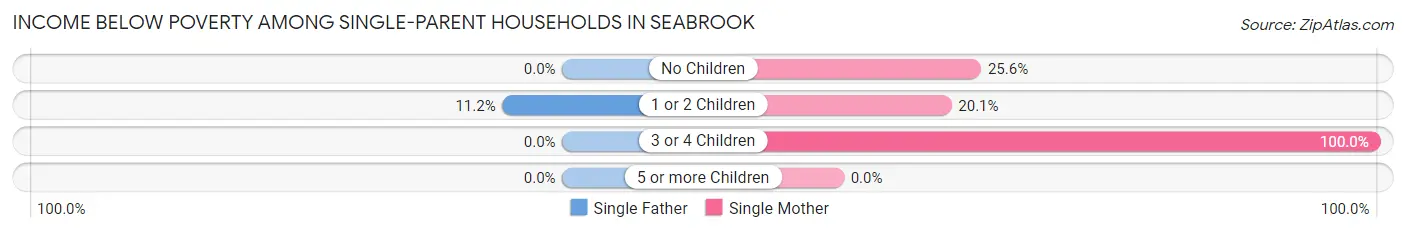
| Children | Single Father | Single Mother |
| No Children | 0 (0.0%) | 33 (25.6%) |
| 1 or 2 Children | 20 (11.2%) | 65 (20.1%) |
| 3 or 4 Children | 0 (0.0%) | 35 (100.0%) |
| 5 or more Children | 0 (0.0%) | 0 (0.0%) |
| Total | 20 (7.6%) | 133 (25.4%) |
Income Below Poverty Among Married-Couple vs Single-Parent Households in Seabrook
The poverty data for Seabrook shows that 34 of the married-couple family households (1.4%) and 153 of the single-parent households (19.5%) are living below the poverty level. Within the married-couple family households, those with no children have the highest poverty rate, with 34 households (2.4%) falling below the poverty line. Among the single-parent households, those with 3 or 4 children have the highest poverty rate, with 35 household (43.2%) living below poverty.
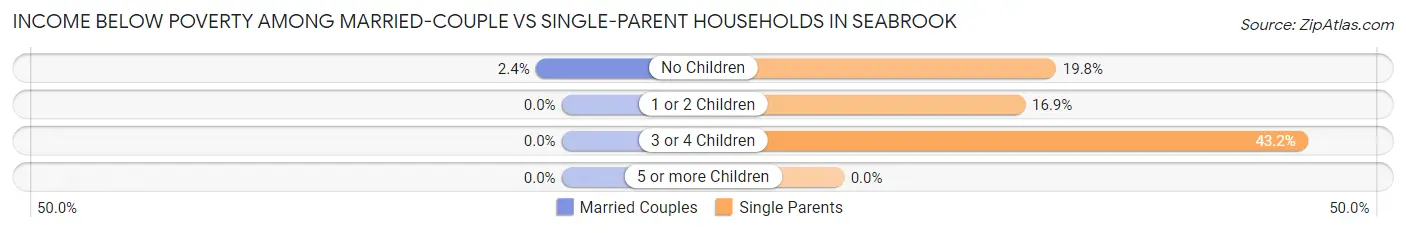
| Children | Married-Couple Families | Single-Parent Households |
| No Children | 34 (2.4%) | 33 (19.8%) |
| 1 or 2 Children | 0 (0.0%) | 85 (16.9%) |
| 3 or 4 Children | 0 (0.0%) | 35 (43.2%) |
| 5 or more Children | 0 (0.0%) | 0 (0.0%) |
| Total | 34 (1.4%) | 153 (19.5%) |
Race in Seabrook
The most populous races in Seabrook are White / Caucasian (11,427 | 84.3%), Hispanic or Latino (2,813 | 20.7%), and Black / African American (686 | 5.1%).
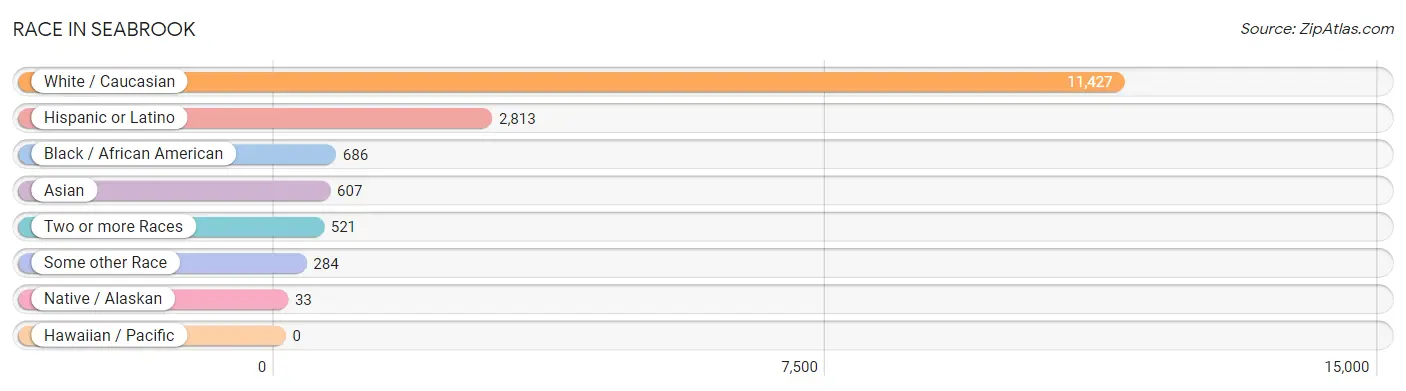
| Race | # Population | % Population |
| Asian | 607 | 4.5% |
| Black / African American | 686 | 5.1% |
| Hawaiian / Pacific | 0 | 0.0% |
| Hispanic or Latino | 2,813 | 20.7% |
| Native / Alaskan | 33 | 0.2% |
| White / Caucasian | 11,427 | 84.3% |
| Two or more Races | 521 | 3.8% |
| Some other Race | 284 | 2.1% |
| Total | 13,558 | 100.0% |
Ancestry in Seabrook
The most populous ancestries reported in Seabrook are Mexican (2,111 | 15.6%), German (1,565 | 11.5%), English (1,392 | 10.3%), Irish (1,100 | 8.1%), and Italian (1,006 | 7.4%), together accounting for 52.9% of all Seabrook residents.
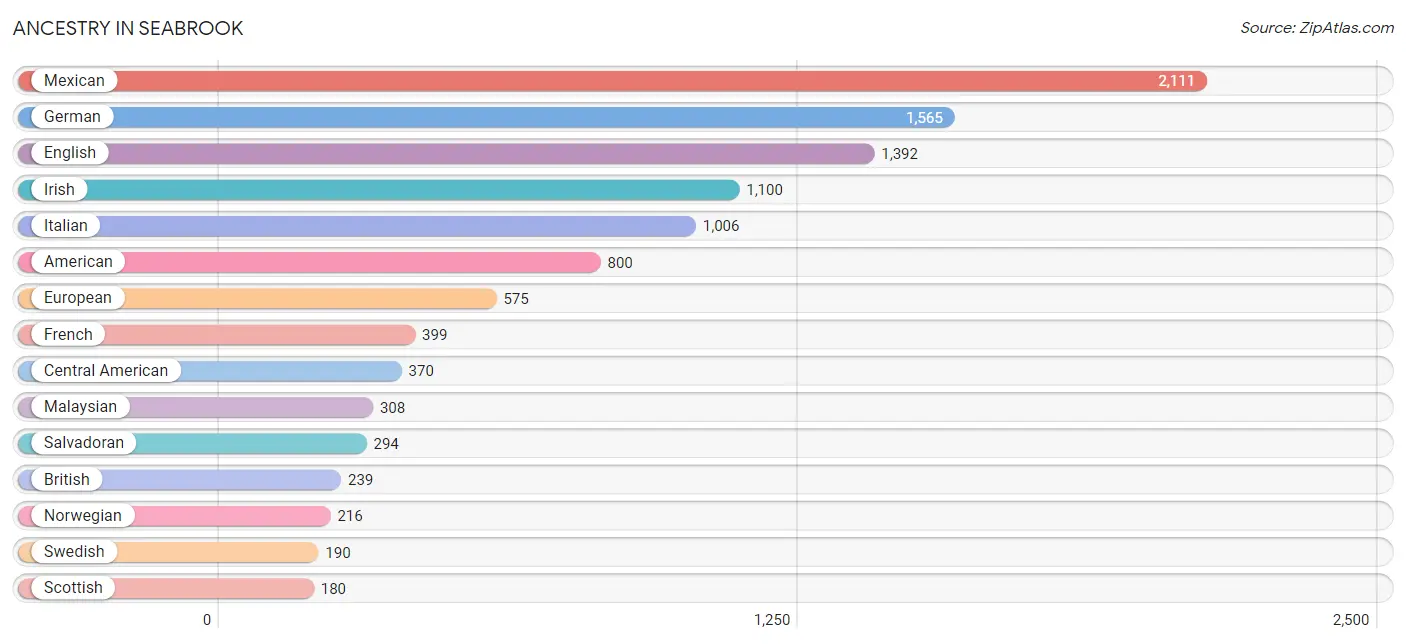
| Ancestry | # Population | % Population |
| African | 37 | 0.3% |
| American | 800 | 5.9% |
| Arab | 117 | 0.9% |
| Austrian | 7 | 0.1% |
| Bhutanese | 37 | 0.3% |
| Blackfeet | 41 | 0.3% |
| British | 239 | 1.8% |
| British West Indian | 16 | 0.1% |
| Bulgarian | 32 | 0.2% |
| Burmese | 28 | 0.2% |
| Canadian | 13 | 0.1% |
| Central American | 370 | 2.7% |
| Cherokee | 51 | 0.4% |
| Colombian | 64 | 0.5% |
| Costa Rican | 18 | 0.1% |
| Croatian | 51 | 0.4% |
| Cuban | 41 | 0.3% |
| Czech | 152 | 1.1% |
| Czechoslovakian | 40 | 0.3% |
| Danish | 10 | 0.1% |
| Dutch | 82 | 0.6% |
| Eastern European | 29 | 0.2% |
| Ecuadorian | 8 | 0.1% |
| English | 1,392 | 10.3% |
| European | 575 | 4.2% |
| Filipino | 11 | 0.1% |
| Finnish | 44 | 0.3% |
| French | 399 | 2.9% |
| French American Indian | 21 | 0.2% |
| French Canadian | 37 | 0.3% |
| German | 1,565 | 11.5% |
| Greek | 25 | 0.2% |
| Guamanian / Chamorro | 17 | 0.1% |
| Honduran | 37 | 0.3% |
| Indian (Asian) | 118 | 0.9% |
| Indonesian | 63 | 0.5% |
| Iranian | 10 | 0.1% |
| Irish | 1,100 | 8.1% |
| Italian | 1,006 | 7.4% |
| Korean | 65 | 0.5% |
| Latvian | 26 | 0.2% |
| Lebanese | 14 | 0.1% |
| Lithuanian | 48 | 0.4% |
| Malaysian | 308 | 2.3% |
| Mexican | 2,111 | 15.6% |
| Nigerian | 48 | 0.4% |
| Northern European | 52 | 0.4% |
| Norwegian | 216 | 1.6% |
| Palestinian | 51 | 0.4% |
| Polish | 148 | 1.1% |
| Portuguese | 34 | 0.3% |
| Puerto Rican | 109 | 0.8% |
| Romanian | 10 | 0.1% |
| Russian | 35 | 0.3% |
| Salvadoran | 294 | 2.2% |
| Scandinavian | 34 | 0.3% |
| Scotch-Irish | 146 | 1.1% |
| Scottish | 180 | 1.3% |
| Serbian | 18 | 0.1% |
| Slovak | 14 | 0.1% |
| South American | 87 | 0.6% |
| Spaniard | 17 | 0.1% |
| Spanish | 67 | 0.5% |
| Sri Lankan | 17 | 0.1% |
| Subsaharan African | 85 | 0.6% |
| Swedish | 190 | 1.4% |
| Thai | 65 | 0.5% |
| Ukrainian | 16 | 0.1% |
| Uruguayan | 15 | 0.1% |
| Welsh | 123 | 0.9% |
| Yugoslavian | 11 | 0.1% | View All 71 Rows |
Immigrants in Seabrook
The most numerous immigrant groups reported in Seabrook came from Latin America (842 | 6.2%), Central America (641 | 4.7%), Asia (474 | 3.5%), Mexico (337 | 2.5%), and South Eastern Asia (270 | 2.0%), together accounting for 18.9% of all Seabrook residents.
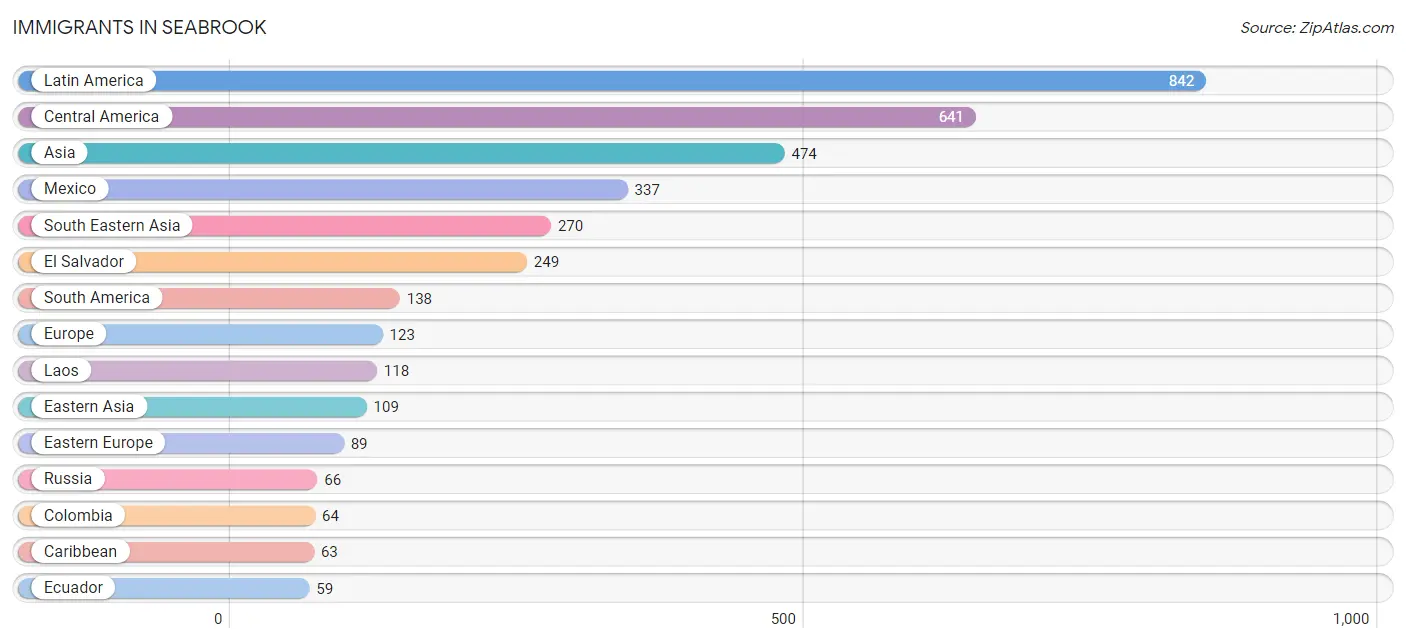
| Immigration Origin | # Population | % Population |
| Africa | 28 | 0.2% |
| Asia | 474 | 3.5% |
| Bulgaria | 10 | 0.1% |
| Canada | 9 | 0.1% |
| Caribbean | 63 | 0.5% |
| Central America | 641 | 4.7% |
| China | 58 | 0.4% |
| Colombia | 64 | 0.5% |
| Costa Rica | 18 | 0.1% |
| Croatia | 13 | 0.1% |
| Cuba | 41 | 0.3% |
| Eastern Asia | 109 | 0.8% |
| Eastern Europe | 89 | 0.7% |
| Ecuador | 59 | 0.4% |
| El Salvador | 249 | 1.8% |
| England | 9 | 0.1% |
| Europe | 123 | 0.9% |
| Germany | 12 | 0.1% |
| Honduras | 37 | 0.3% |
| Iran | 10 | 0.1% |
| Japan | 23 | 0.2% |
| Korea | 28 | 0.2% |
| Laos | 118 | 0.9% |
| Latin America | 842 | 6.2% |
| Mexico | 337 | 2.5% |
| Northern Africa | 28 | 0.2% |
| Northern Europe | 11 | 0.1% |
| Philippines | 33 | 0.2% |
| Portugal | 11 | 0.1% |
| Russia | 66 | 0.5% |
| South America | 138 | 1.0% |
| South Central Asia | 10 | 0.1% |
| South Eastern Asia | 270 | 2.0% |
| Southern Europe | 11 | 0.1% |
| Syria | 34 | 0.3% |
| Taiwan | 11 | 0.1% |
| Trinidad and Tobago | 6 | 0.0% |
| Uruguay | 15 | 0.1% |
| Vietnam | 56 | 0.4% |
| Western Asia | 34 | 0.3% |
| Western Europe | 12 | 0.1% | View All 41 Rows |
Sex and Age in Seabrook
Sex and Age in Seabrook
The most populous age groups in Seabrook are 25 to 29 Years (842 | 12.5%) for men and 10 to 14 Years (662 | 9.7%) for women.
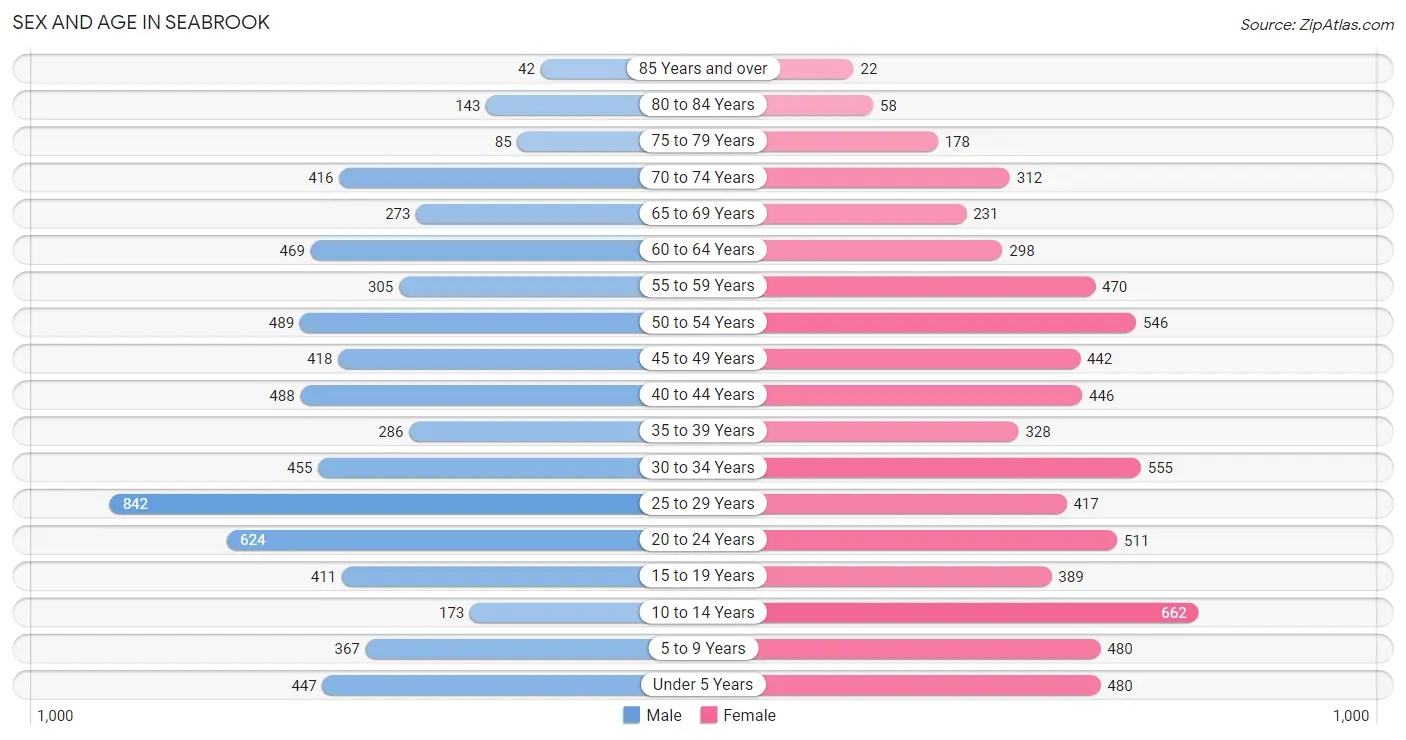
| Age Bracket | Male | Female |
| Under 5 Years | 447 (6.6%) | 480 (7.0%) |
| 5 to 9 Years | 367 (5.4%) | 480 (7.0%) |
| 10 to 14 Years | 173 (2.6%) | 662 (9.7%) |
| 15 to 19 Years | 411 (6.1%) | 389 (5.7%) |
| 20 to 24 Years | 624 (9.3%) | 511 (7.5%) |
| 25 to 29 Years | 842 (12.5%) | 417 (6.1%) |
| 30 to 34 Years | 455 (6.8%) | 555 (8.1%) |
| 35 to 39 Years | 286 (4.3%) | 328 (4.8%) |
| 40 to 44 Years | 488 (7.2%) | 446 (6.5%) |
| 45 to 49 Years | 418 (6.2%) | 442 (6.5%) |
| 50 to 54 Years | 489 (7.3%) | 546 (8.0%) |
| 55 to 59 Years | 305 (4.5%) | 470 (6.9%) |
| 60 to 64 Years | 469 (7.0%) | 298 (4.4%) |
| 65 to 69 Years | 273 (4.1%) | 231 (3.4%) |
| 70 to 74 Years | 416 (6.2%) | 312 (4.6%) |
| 75 to 79 Years | 85 (1.3%) | 178 (2.6%) |
| 80 to 84 Years | 143 (2.1%) | 58 (0.9%) |
| 85 Years and over | 42 (0.6%) | 22 (0.3%) |
| Total | 6,733 (100.0%) | 6,825 (100.0%) |
Families and Households in Seabrook
Median Family Size in Seabrook
The median family size in Seabrook is 3.24 persons per family, with married-couple families (2,480 | 75.9%) accounting for the largest median family size of 3.33 persons per family. On the other hand, single male/father families (263 | 8.1%) represent the smallest median family size with 2.96 persons per family.
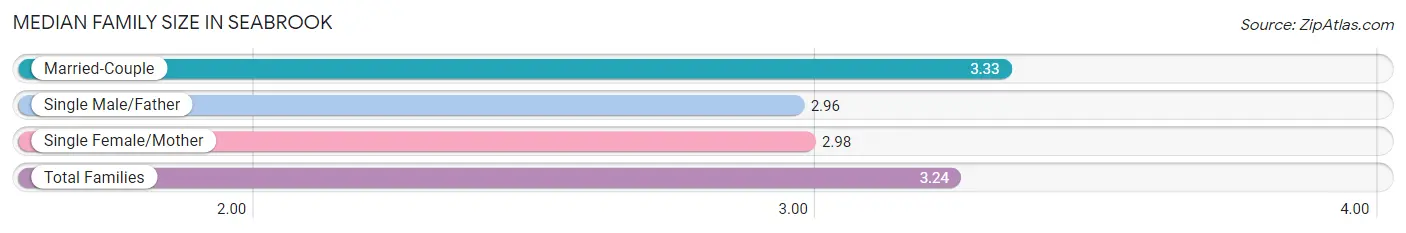
| Family Type | # Families | Family Size |
| Married-Couple | 2,480 (75.9%) | 3.33 |
| Single Male/Father | 263 (8.1%) | 2.96 |
| Single Female/Mother | 523 (16.0%) | 2.98 |
| Total Families | 3,266 (100.0%) | 3.24 |
Median Household Size in Seabrook
The median household size in Seabrook is 2.48 persons per household, with single female/mother households (523 | 9.6%) accounting for the largest median household size of 3.52 persons per household. non-family households (2,211 | 40.4%) represent the smallest median household size with 1.16 persons per household.
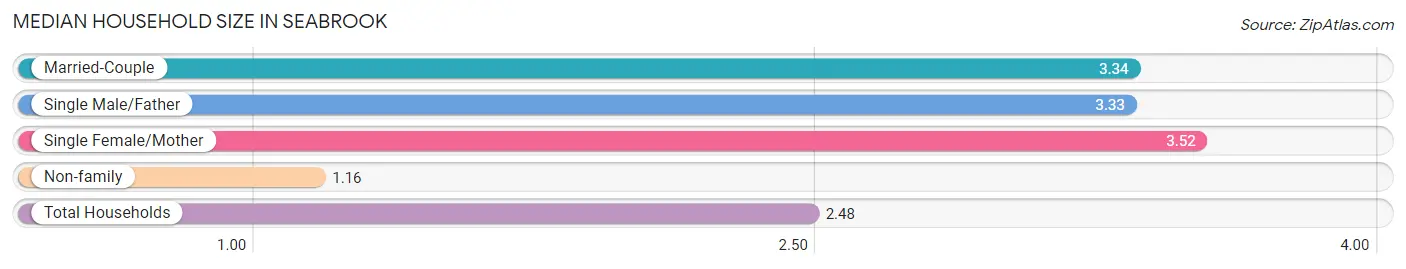
| Household Type | # Households | Household Size |
| Married-Couple | 2,480 (45.3%) | 3.34 |
| Single Male/Father | 263 (4.8%) | 3.33 |
| Single Female/Mother | 523 (9.6%) | 3.52 |
| Non-family | 2,211 (40.4%) | 1.16 |
| Total Households | 5,477 (100.0%) | 2.48 |
Household Size by Marriage Status in Seabrook
Out of a total of 5,477 households in Seabrook, 3,266 (59.6%) are family households, while 2,211 (40.4%) are nonfamily households. The most numerous type of family households are 2-person households, comprising 1,226, and the most common type of nonfamily households are 1-person households, comprising 1,861.
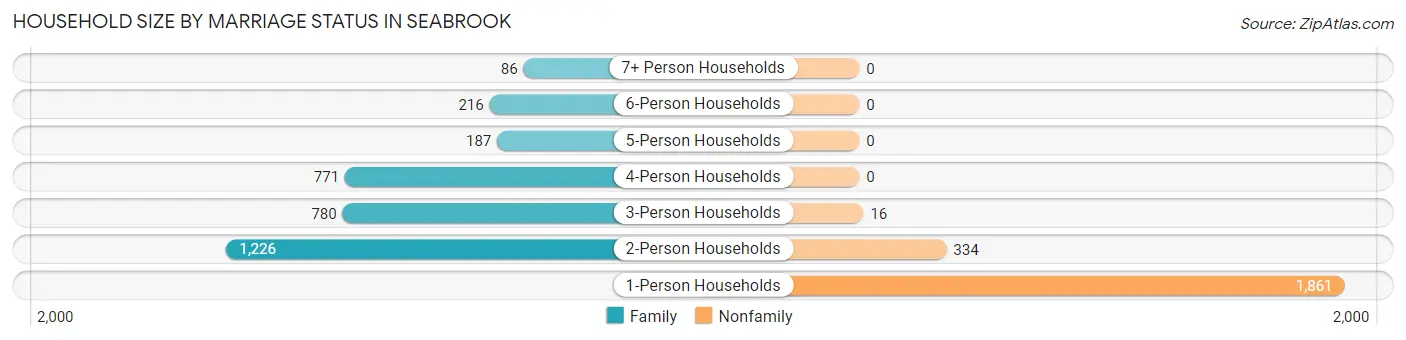
| Household Size | Family Households | Nonfamily Households |
| 1-Person Households | - | 1,861 (34.0%) |
| 2-Person Households | 1,226 (22.4%) | 334 (6.1%) |
| 3-Person Households | 780 (14.2%) | 16 (0.3%) |
| 4-Person Households | 771 (14.1%) | 0 (0.0%) |
| 5-Person Households | 187 (3.4%) | 0 (0.0%) |
| 6-Person Households | 216 (3.9%) | 0 (0.0%) |
| 7+ Person Households | 86 (1.6%) | 0 (0.0%) |
| Total | 3,266 (59.6%) | 2,211 (40.4%) |
Female Fertility in Seabrook
Fertility by Age in Seabrook
Average fertility rate in Seabrook is 110.0 births per 1,000 women. Women in the age bracket of 20 to 34 years have the highest fertility rate with 189.0 births per 1,000 women. Women in the age bracket of 20 to 34 years acount for 80.1% of all women with births.
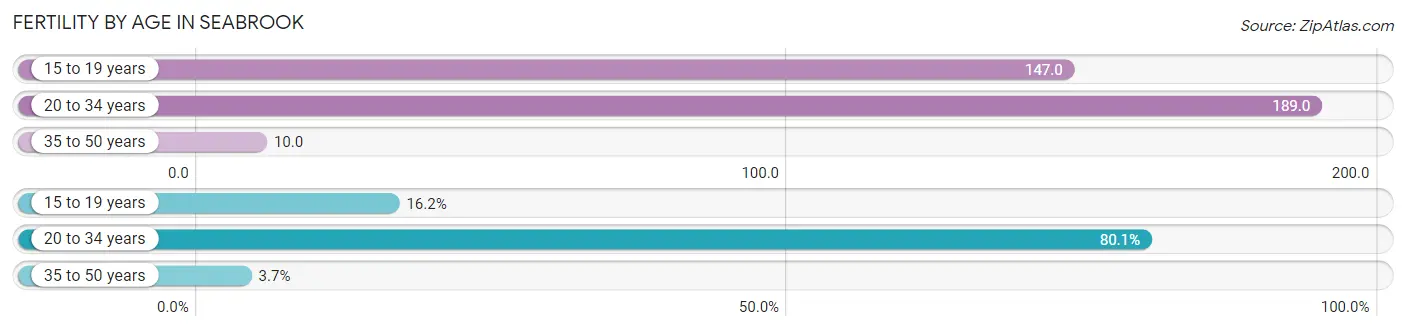
| Age Bracket | Women with Births | Births / 1,000 Women |
| 15 to 19 years | 57 (16.2%) | 147.0 |
| 20 to 34 years | 281 (80.1%) | 189.0 |
| 35 to 50 years | 13 (3.7%) | 10.0 |
| Total | 351 (100.0%) | 110.0 |
Fertility by Age by Marriage Status in Seabrook
35.0% of women with births (351) in Seabrook are married. The highest percentage of unmarried women with births falls into 15 to 19 years age bracket with 100.0% of them unmarried at the time of birth, while the lowest percentage of unmarried women with births belong to 20 to 34 years age bracket with 56.2% of them unmarried.
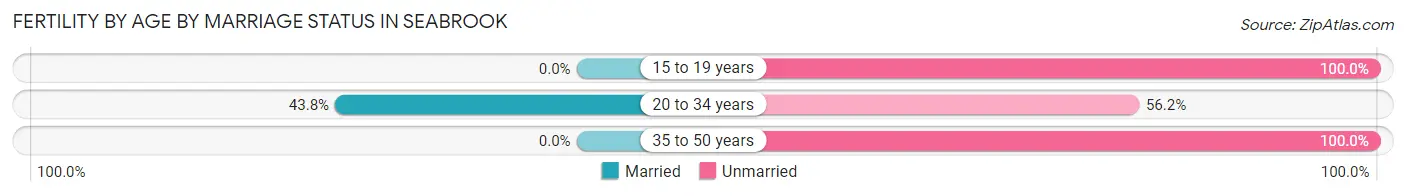
| Age Bracket | Married | Unmarried |
| 15 to 19 years | 0 (0.0%) | 57 (100.0%) |
| 20 to 34 years | 123 (43.8%) | 158 (56.2%) |
| 35 to 50 years | 0 (0.0%) | 13 (100.0%) |
| Total | 123 (35.0%) | 228 (65.0%) |
Fertility by Education in Seabrook
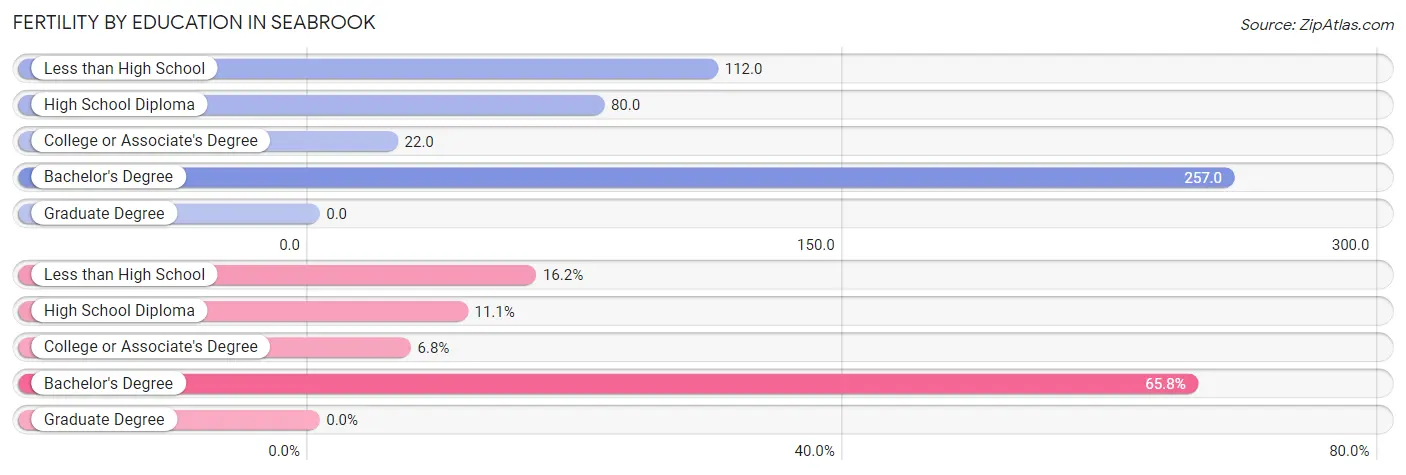
| Educational Attainment | Women with Births | Births / 1,000 Women |
| Less than High School | 57 (16.2%) | 112.0 |
| High School Diploma | 39 (11.1%) | 80.0 |
| College or Associate's Degree | 24 (6.8%) | 22.0 |
| Bachelor's Degree | 231 (65.8%) | 257.0 |
| Graduate Degree | 0 (0.0%) | 0.0 |
| Total | 351 (100.0%) | 110.0 |
Fertility by Education by Marriage Status in Seabrook
65.0% of women with births in Seabrook are unmarried. Women with the educational attainment of bachelor's degree are most likely to be married with 51.5% of them married at childbirth, while women with the educational attainment of less than high school are least likely to be married with 100.0% of them unmarried at childbirth.
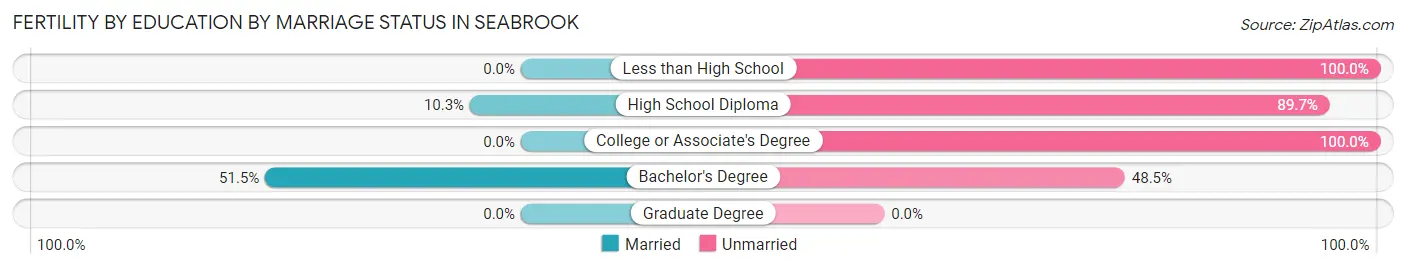
| Educational Attainment | Married | Unmarried |
| Less than High School | 0 (0.0%) | 57 (100.0%) |
| High School Diploma | 4 (10.3%) | 35 (89.7%) |
| College or Associate's Degree | 0 (0.0%) | 24 (100.0%) |
| Bachelor's Degree | 119 (51.5%) | 112 (48.5%) |
| Graduate Degree | 0 (0.0%) | 0 (0.0%) |
| Total | 123 (35.0%) | 228 (65.0%) |
Employment Characteristics in Seabrook
Employment by Class of Employer in Seabrook
Among the 7,233 employed individuals in Seabrook, private company employees (4,926 | 68.1%), self-employed (not incorporated) (742 | 10.3%), and local government employees (531 | 7.3%) make up the most common classes of employment.
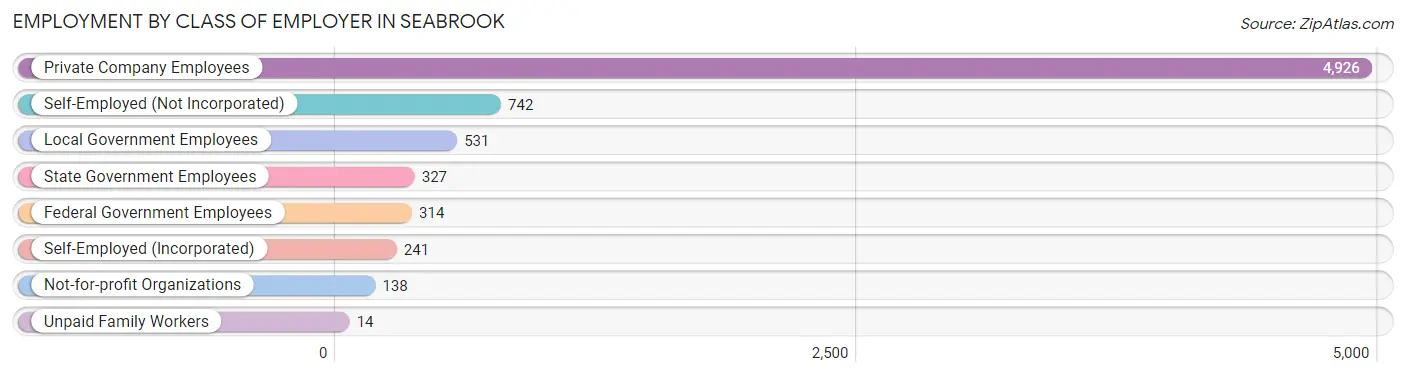
| Employer Class | # Employees | % Employees |
| Private Company Employees | 4,926 | 68.1% |
| Self-Employed (Incorporated) | 241 | 3.3% |
| Self-Employed (Not Incorporated) | 742 | 10.3% |
| Not-for-profit Organizations | 138 | 1.9% |
| Local Government Employees | 531 | 7.3% |
| State Government Employees | 327 | 4.5% |
| Federal Government Employees | 314 | 4.3% |
| Unpaid Family Workers | 14 | 0.2% |
| Total | 7,233 | 100.0% |
Employment Status by Age in Seabrook
According to the labor force statistics for Seabrook, out of the total population over 16 years of age (10,785), 70.3% or 7,582 individuals are in the labor force, with 3.8% or 288 of them unemployed. The age group with the highest labor force participation rate is 30 to 34 years, with 92.9% or 938 individuals in the labor force. Within the labor force, the 60 to 64 years age range has the highest percentage of unemployed individuals, with 12.0% or 64 of them being unemployed.
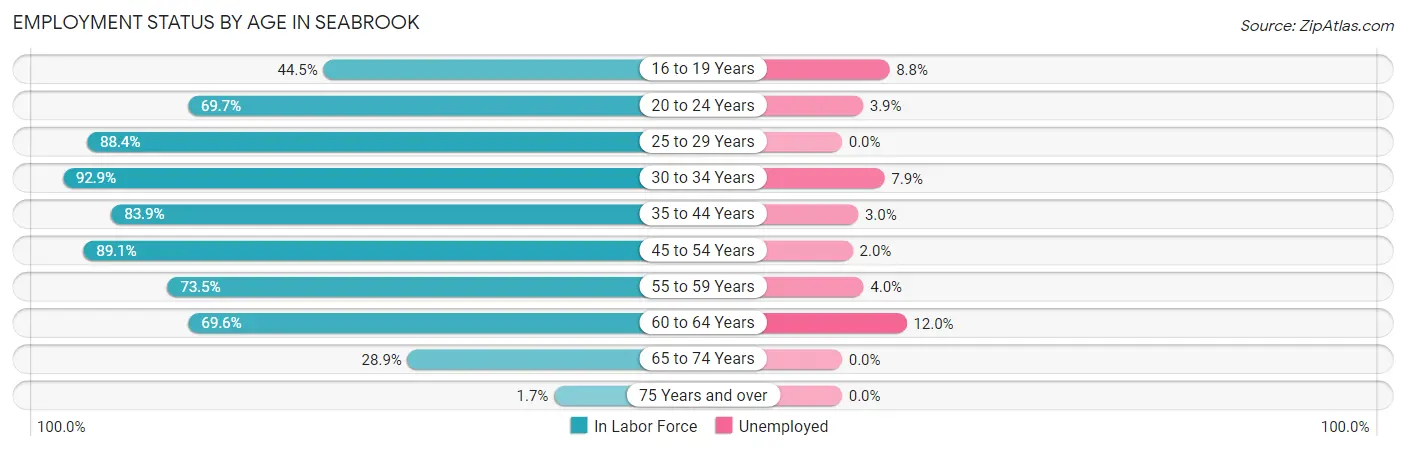
| Age Bracket | In Labor Force | Unemployed |
| 16 to 19 Years | 283 (44.5%) | 25 (8.8%) |
| 20 to 24 Years | 791 (69.7%) | 31 (3.9%) |
| 25 to 29 Years | 1,113 (88.4%) | 0 (0.0%) |
| 30 to 34 Years | 938 (92.9%) | 74 (7.9%) |
| 35 to 44 Years | 1,299 (83.9%) | 39 (3.0%) |
| 45 to 54 Years | 1,688 (89.1%) | 34 (2.0%) |
| 55 to 59 Years | 570 (73.5%) | 23 (4.0%) |
| 60 to 64 Years | 534 (69.6%) | 64 (12.0%) |
| 65 to 74 Years | 356 (28.9%) | 0 (0.0%) |
| 75 Years and over | 9 (1.7%) | 0 (0.0%) |
| Total | 7,582 (70.3%) | 288 (3.8%) |
Employment Status by Educational Attainment in Seabrook
According to labor force statistics for Seabrook, 84.7% of individuals (6,144) out of the total population between 25 and 64 years of age (7,254) are in the labor force, with 3.8% or 233 of them being unemployed. The group with the highest labor force participation rate are those with the educational attainment of bachelor's degree or higher, with 89.0% or 2,762 individuals in the labor force. Within the labor force, individuals with college / associate degree education have the highest percentage of unemployment, with 8.2% or 193 of them being unemployed.
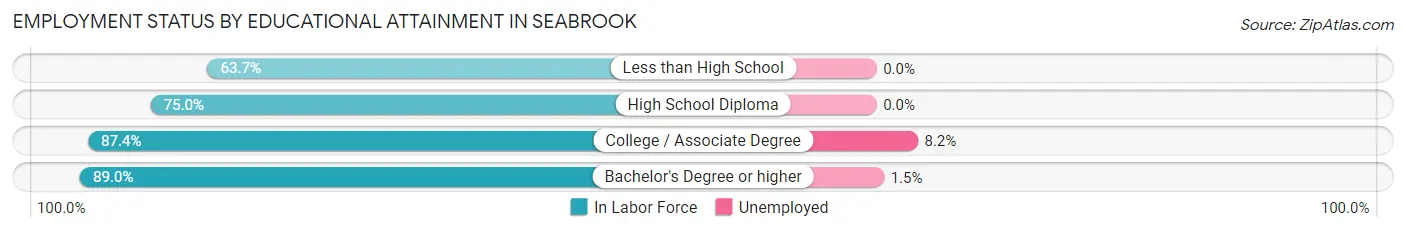
| Educational Attainment | In Labor Force | Unemployed |
| Less than High School | 384 (63.7%) | 0 (0.0%) |
| High School Diploma | 637 (75.0%) | 0 (0.0%) |
| College / Associate Degree | 2,359 (87.4%) | 221 (8.2%) |
| Bachelor's Degree or higher | 2,762 (89.0%) | 47 (1.5%) |
| Total | 6,144 (84.7%) | 276 (3.8%) |
Employment Occupations by Sex in Seabrook
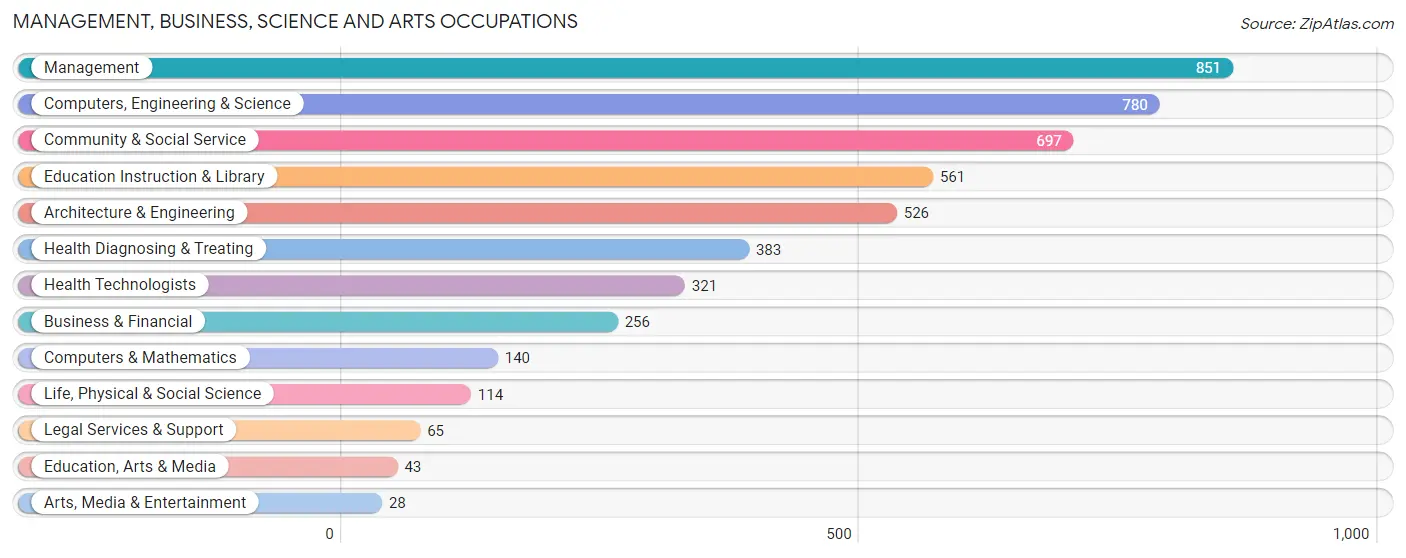
Management, Business, Science and Arts Occupations
The most common Management, Business, Science and Arts occupations in Seabrook are Management (851 | 11.7%), Computers, Engineering & Science (780 | 10.7%), Community & Social Service (697 | 9.6%), Education Instruction & Library (561 | 7.7%), and Architecture & Engineering (526 | 7.2%).
Management, Business, Science and Arts Occupations by Sex
Within the Management, Business, Science and Arts occupations in Seabrook, the most male-oriented occupations are Architecture & Engineering (82.9%), Computers, Engineering & Science (78.3%), and Business & Financial (77.3%), while the most female-oriented occupations are Arts, Media & Entertainment (100.0%), Education Instruction & Library (86.5%), and Community & Social Service (83.4%).
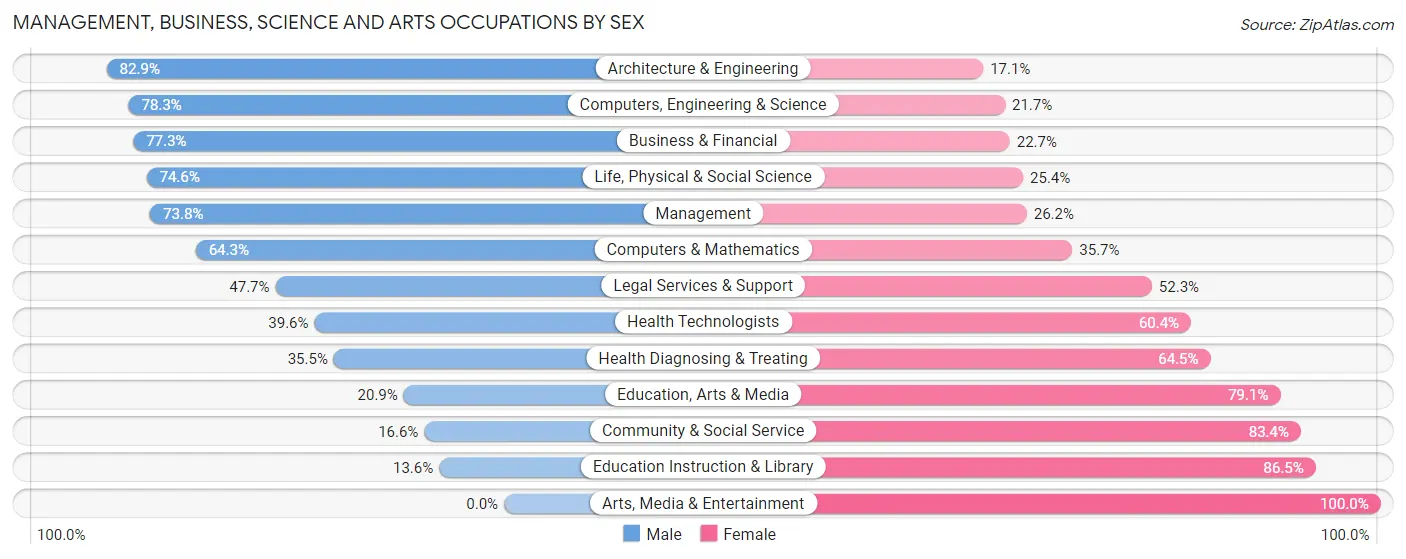
| Occupation | Male | Female |
| Management | 628 (73.8%) | 223 (26.2%) |
| Business & Financial | 198 (77.3%) | 58 (22.7%) |
| Computers, Engineering & Science | 611 (78.3%) | 169 (21.7%) |
| Computers & Mathematics | 90 (64.3%) | 50 (35.7%) |
| Architecture & Engineering | 436 (82.9%) | 90 (17.1%) |
| Life, Physical & Social Science | 85 (74.6%) | 29 (25.4%) |
| Community & Social Service | 116 (16.6%) | 581 (83.4%) |
| Education, Arts & Media | 9 (20.9%) | 34 (79.1%) |
| Legal Services & Support | 31 (47.7%) | 34 (52.3%) |
| Education Instruction & Library | 76 (13.6%) | 485 (86.5%) |
| Arts, Media & Entertainment | 0 (0.0%) | 28 (100.0%) |
| Health Diagnosing & Treating | 136 (35.5%) | 247 (64.5%) |
| Health Technologists | 127 (39.6%) | 194 (60.4%) |
| Total (Category) | 1,689 (56.9%) | 1,278 (43.1%) |
| Total (Overall) | 4,054 (55.7%) | 3,221 (44.3%) |
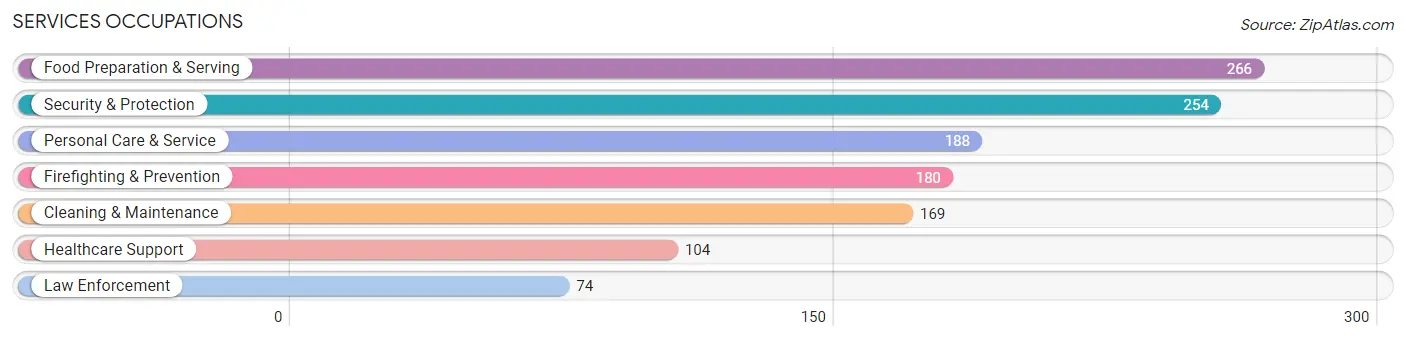
Services Occupations
The most common Services occupations in Seabrook are Food Preparation & Serving (266 | 3.7%), Security & Protection (254 | 3.5%), Personal Care & Service (188 | 2.6%), Firefighting & Prevention (180 | 2.5%), and Cleaning & Maintenance (169 | 2.3%).
Services Occupations by Sex
Within the Services occupations in Seabrook, the most male-oriented occupations are Cleaning & Maintenance (100.0%), Firefighting & Prevention (93.9%), and Security & Protection (84.3%), while the most female-oriented occupations are Healthcare Support (100.0%), Law Enforcement (39.2%), and Personal Care & Service (23.4%).
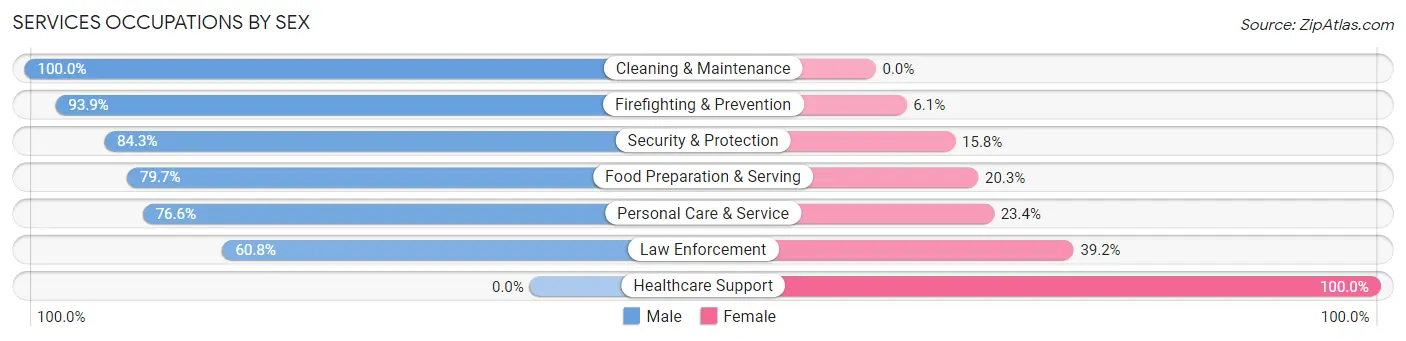
| Occupation | Male | Female |
| Healthcare Support | 0 (0.0%) | 104 (100.0%) |
| Security & Protection | 214 (84.3%) | 40 (15.8%) |
| Firefighting & Prevention | 169 (93.9%) | 11 (6.1%) |
| Law Enforcement | 45 (60.8%) | 29 (39.2%) |
| Food Preparation & Serving | 212 (79.7%) | 54 (20.3%) |
| Cleaning & Maintenance | 169 (100.0%) | 0 (0.0%) |
| Personal Care & Service | 144 (76.6%) | 44 (23.4%) |
| Total (Category) | 739 (75.3%) | 242 (24.7%) |
| Total (Overall) | 4,054 (55.7%) | 3,221 (44.3%) |
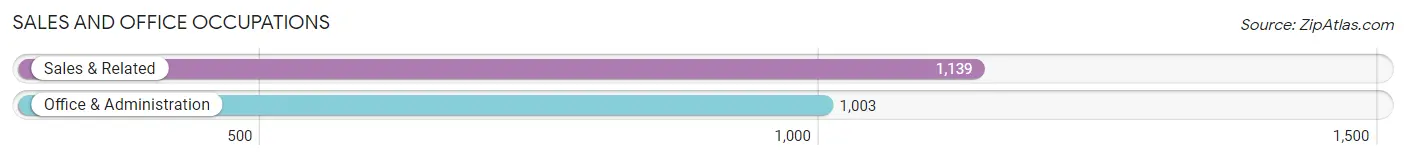
Sales and Office Occupations
The most common Sales and Office occupations in Seabrook are Sales & Related (1,139 | 15.7%), and Office & Administration (1,003 | 13.8%).
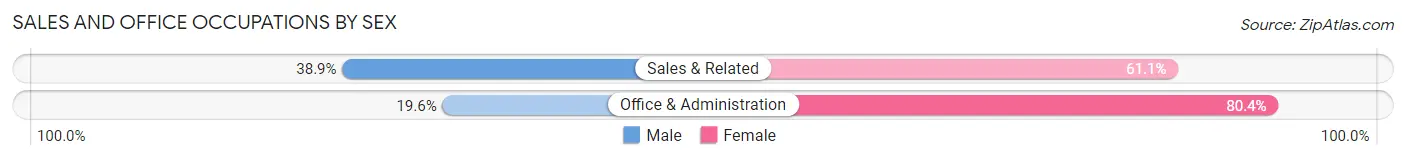
Sales and Office Occupations by Sex
| Occupation | Male | Female |
| Sales & Related | 443 (38.9%) | 696 (61.1%) |
| Office & Administration | 197 (19.6%) | 806 (80.4%) |
| Total (Category) | 640 (29.9%) | 1,502 (70.1%) |
| Total (Overall) | 4,054 (55.7%) | 3,221 (44.3%) |
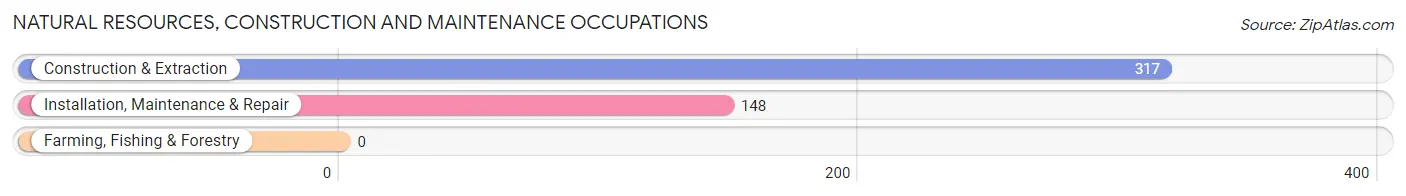
Natural Resources, Construction and Maintenance Occupations
The most common Natural Resources, Construction and Maintenance occupations in Seabrook are Construction & Extraction (317 | 4.4%), and Installation, Maintenance & Repair (148 | 2.0%).
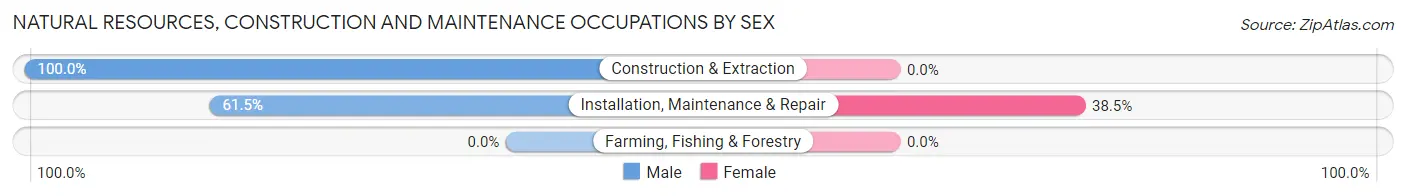
Natural Resources, Construction and Maintenance Occupations by Sex
| Occupation | Male | Female |
| Farming, Fishing & Forestry | 0 (0.0%) | 0 (0.0%) |
| Construction & Extraction | 317 (100.0%) | 0 (0.0%) |
| Installation, Maintenance & Repair | 91 (61.5%) | 57 (38.5%) |
| Total (Category) | 408 (87.7%) | 57 (12.3%) |
| Total (Overall) | 4,054 (55.7%) | 3,221 (44.3%) |
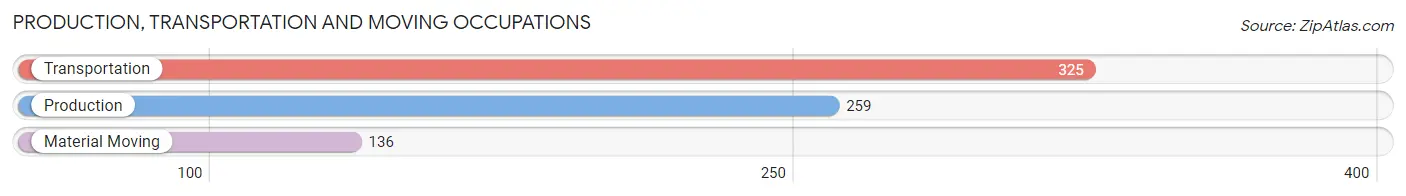
Production, Transportation and Moving Occupations
The most common Production, Transportation and Moving occupations in Seabrook are Transportation (325 | 4.5%), Production (259 | 3.6%), and Material Moving (136 | 1.9%).
Production, Transportation and Moving Occupations by Sex
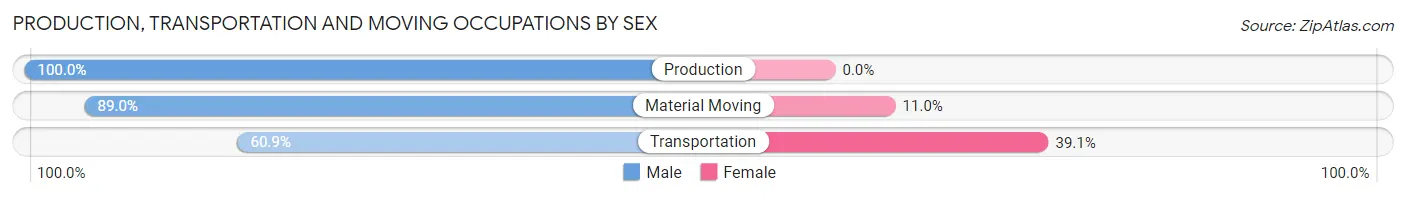
| Occupation | Male | Female |
| Production | 259 (100.0%) | 0 (0.0%) |
| Transportation | 198 (60.9%) | 127 (39.1%) |
| Material Moving | 121 (89.0%) | 15 (11.0%) |
| Total (Category) | 578 (80.3%) | 142 (19.7%) |
| Total (Overall) | 4,054 (55.7%) | 3,221 (44.3%) |
Employment Industries by Sex in Seabrook
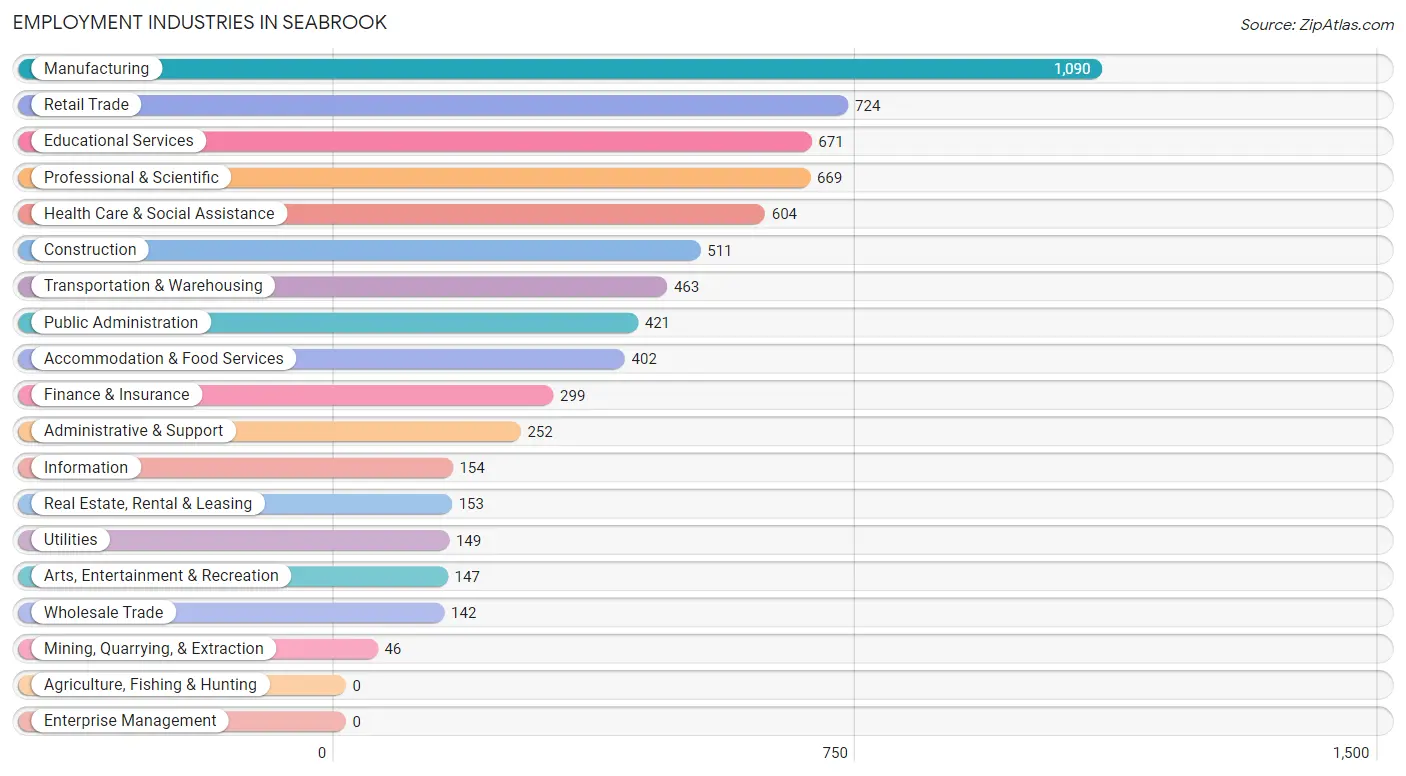
Employment Industries in Seabrook
The major employment industries in Seabrook include Manufacturing (1,090 | 15.0%), Retail Trade (724 | 10.0%), Educational Services (671 | 9.2%), Professional & Scientific (669 | 9.2%), and Health Care & Social Assistance (604 | 8.3%).
Employment Industries by Sex in Seabrook
The Seabrook industries that see more men than women are Construction (91.0%), Administrative & Support (78.2%), and Accommodation & Food Services (74.9%), whereas the industries that tend to have a higher number of women are Utilities (96.0%), Arts, Entertainment & Recreation (87.1%), and Educational Services (82.9%).
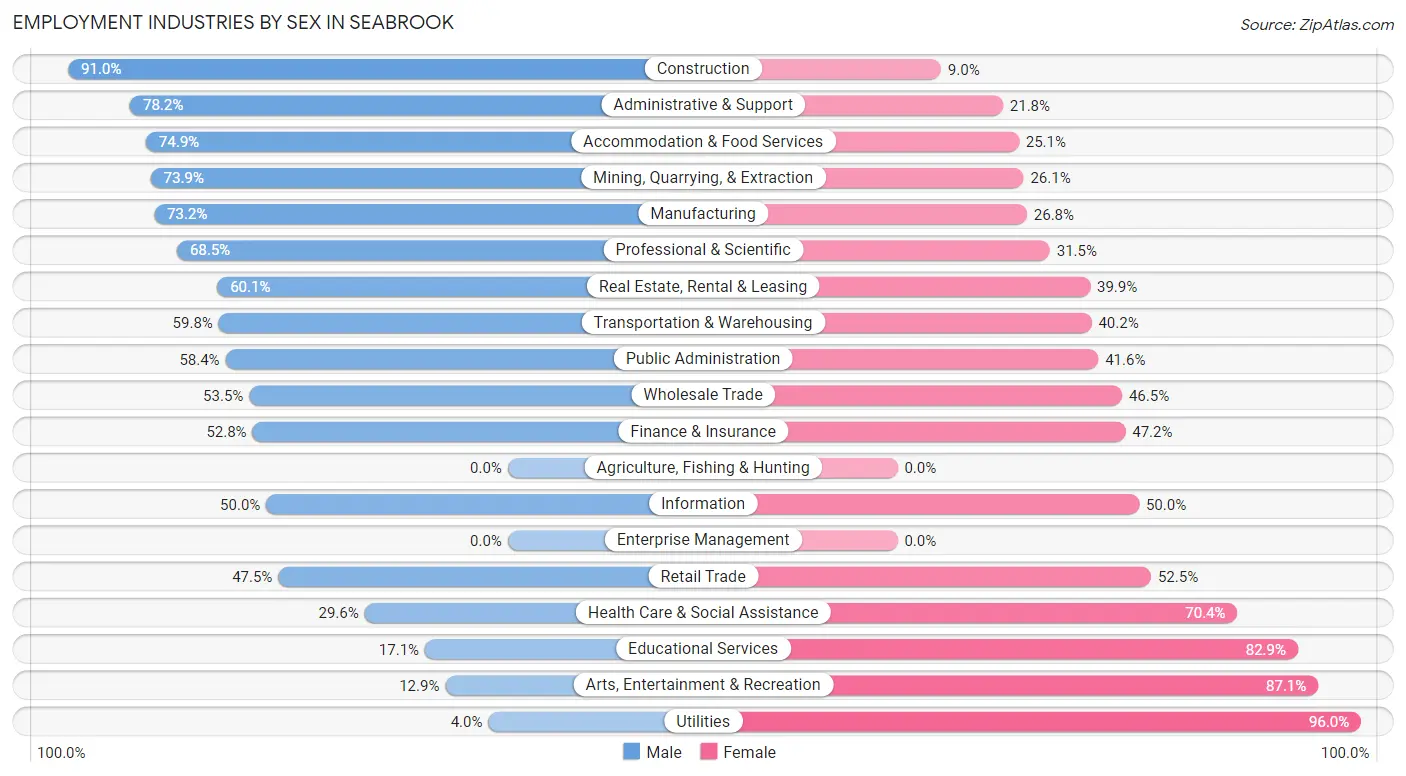
| Industry | Male | Female |
| Agriculture, Fishing & Hunting | 0 (0.0%) | 0 (0.0%) |
| Mining, Quarrying, & Extraction | 34 (73.9%) | 12 (26.1%) |
| Construction | 465 (91.0%) | 46 (9.0%) |
| Manufacturing | 798 (73.2%) | 292 (26.8%) |
| Wholesale Trade | 76 (53.5%) | 66 (46.5%) |
| Retail Trade | 344 (47.5%) | 380 (52.5%) |
| Transportation & Warehousing | 277 (59.8%) | 186 (40.2%) |
| Utilities | 6 (4.0%) | 143 (96.0%) |
| Information | 77 (50.0%) | 77 (50.0%) |
| Finance & Insurance | 158 (52.8%) | 141 (47.2%) |
| Real Estate, Rental & Leasing | 92 (60.1%) | 61 (39.9%) |
| Professional & Scientific | 458 (68.5%) | 211 (31.5%) |
| Enterprise Management | 0 (0.0%) | 0 (0.0%) |
| Administrative & Support | 197 (78.2%) | 55 (21.8%) |
| Educational Services | 115 (17.1%) | 556 (82.9%) |
| Health Care & Social Assistance | 179 (29.6%) | 425 (70.4%) |
| Arts, Entertainment & Recreation | 19 (12.9%) | 128 (87.1%) |
| Accommodation & Food Services | 301 (74.9%) | 101 (25.1%) |
| Public Administration | 246 (58.4%) | 175 (41.6%) |
| Total | 4,054 (55.7%) | 3,221 (44.3%) |
Education in Seabrook
School Enrollment in Seabrook
The most common levels of schooling among the 3,311 students in Seabrook are college / undergraduate (790 | 23.9%), high school (738 | 22.3%), and elementary school (648 | 19.6%).
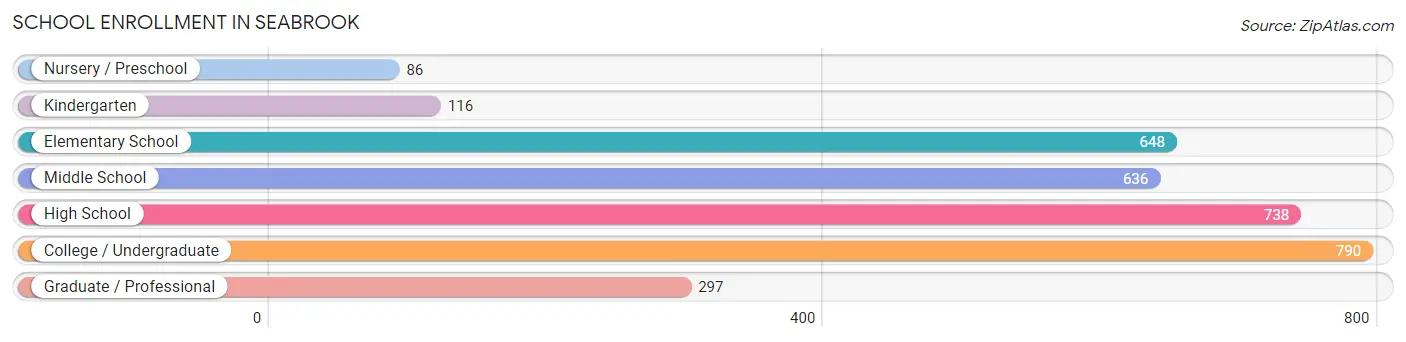
| School Level | # Students | % Students |
| Nursery / Preschool | 86 | 2.6% |
| Kindergarten | 116 | 3.5% |
| Elementary School | 648 | 19.6% |
| Middle School | 636 | 19.2% |
| High School | 738 | 22.3% |
| College / Undergraduate | 790 | 23.9% |
| Graduate / Professional | 297 | 9.0% |
| Total | 3,311 | 100.0% |
School Enrollment by Age by Funding Source in Seabrook
Out of a total of 3,311 students who are enrolled in schools in Seabrook, 275 (8.3%) attend a private institution, while the remaining 3,036 (91.7%) are enrolled in public schools. The age group of 3 to 4 year olds has the highest likelihood of being enrolled in private schools, with 34 (72.3% in the age bracket) enrolled. Conversely, the age group of 10 to 14 year olds has the lowest likelihood of being enrolled in a private school, with 759 (98.3% in the age bracket) attending a public institution.
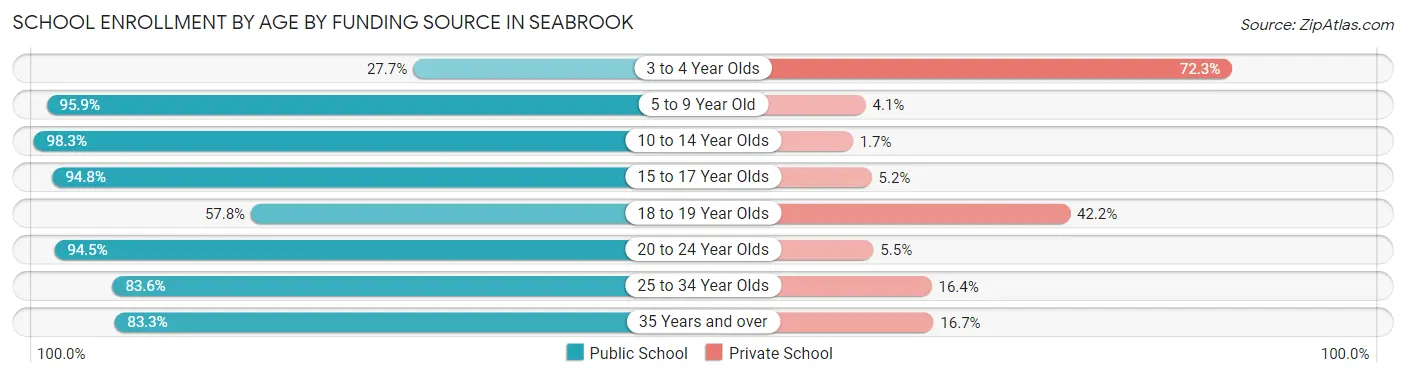
| Age Bracket | Public School | Private School |
| 3 to 4 Year Olds | 13 (27.7%) | 34 (72.3%) |
| 5 to 9 Year Old | 751 (95.9%) | 32 (4.1%) |
| 10 to 14 Year Olds | 759 (98.3%) | 13 (1.7%) |
| 15 to 17 Year Olds | 529 (94.8%) | 29 (5.2%) |
| 18 to 19 Year Olds | 59 (57.8%) | 43 (42.2%) |
| 20 to 24 Year Olds | 426 (94.5%) | 25 (5.5%) |
| 25 to 34 Year Olds | 235 (83.6%) | 46 (16.4%) |
| 35 Years and over | 264 (83.3%) | 53 (16.7%) |
| Total | 3,036 (91.7%) | 275 (8.3%) |
Educational Attainment by Field of Study in Seabrook
Business (739 | 18.6%), arts & humanities (536 | 13.5%), engineering (535 | 13.5%), science & technology (340 | 8.6%), and education (327 | 8.3%) are the most common fields of study among 3,964 individuals in Seabrook who have obtained a bachelor's degree or higher.
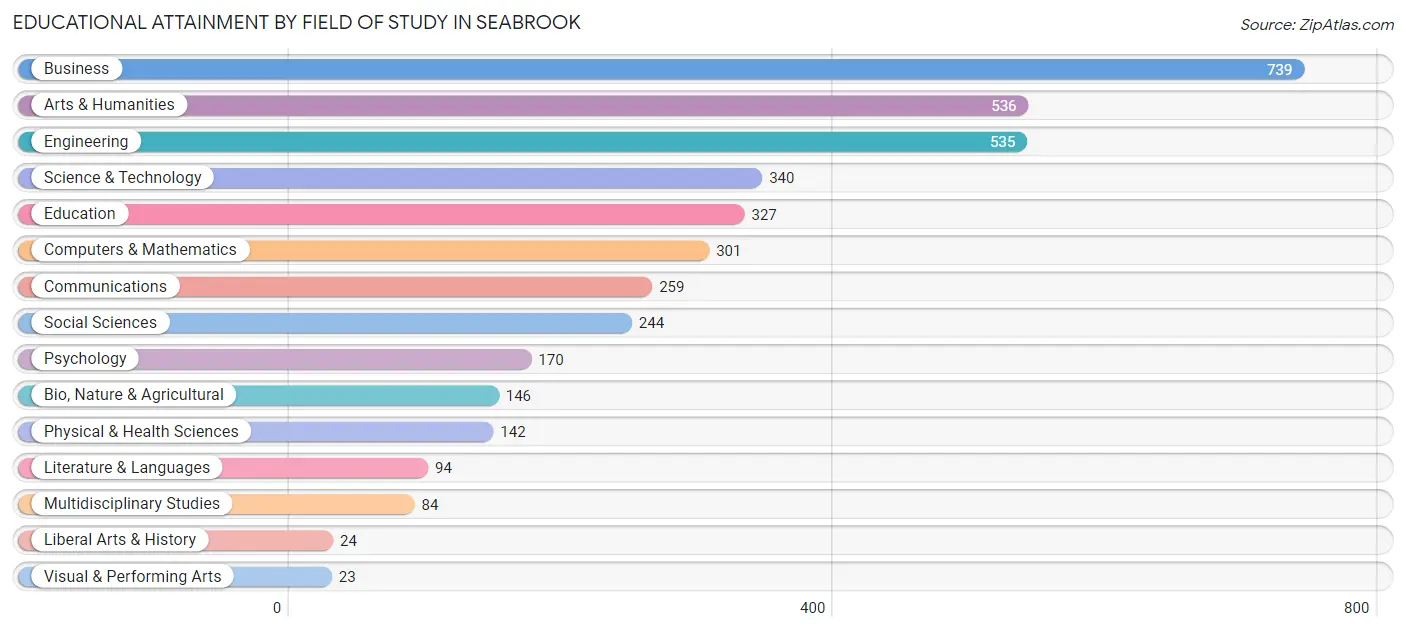
| Field of Study | # Graduates | % Graduates |
| Computers & Mathematics | 301 | 7.6% |
| Bio, Nature & Agricultural | 146 | 3.7% |
| Physical & Health Sciences | 142 | 3.6% |
| Psychology | 170 | 4.3% |
| Social Sciences | 244 | 6.2% |
| Engineering | 535 | 13.5% |
| Multidisciplinary Studies | 84 | 2.1% |
| Science & Technology | 340 | 8.6% |
| Business | 739 | 18.6% |
| Education | 327 | 8.3% |
| Literature & Languages | 94 | 2.4% |
| Liberal Arts & History | 24 | 0.6% |
| Visual & Performing Arts | 23 | 0.6% |
| Communications | 259 | 6.5% |
| Arts & Humanities | 536 | 13.5% |
| Total | 3,964 | 100.0% |
Transportation & Commute in Seabrook
Vehicle Availability by Sex in Seabrook
The most prevalent vehicle ownership categories in Seabrook are males with 2 vehicles (1,780, accounting for 43.8%) and females with 2 vehicles (1,417, making up 56.1%).
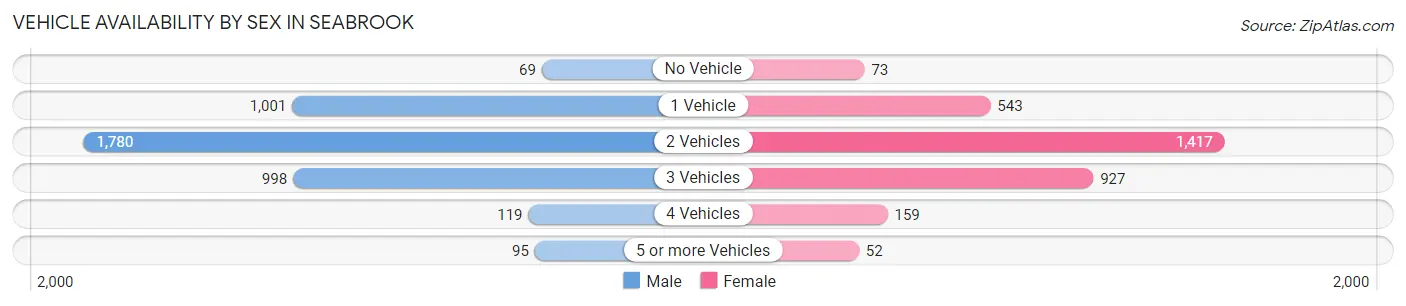
| Vehicles Available | Male | Female |
| No Vehicle | 69 (1.7%) | 73 (2.3%) |
| 1 Vehicle | 1,001 (24.6%) | 543 (17.1%) |
| 2 Vehicles | 1,780 (43.8%) | 1,417 (44.7%) |
| 3 Vehicles | 998 (24.6%) | 927 (29.2%) |
| 4 Vehicles | 119 (2.9%) | 159 (5.0%) |
| 5 or more Vehicles | 95 (2.3%) | 52 (1.6%) |
| Total | 4,062 (100.0%) | 3,171 (100.0%) |
Commute Time in Seabrook
The most frequently occuring commute durations in Seabrook are 15 to 19 minutes (1,539 commuters, 23.7%), 20 to 24 minutes (956 commuters, 14.7%), and 30 to 34 minutes (700 commuters, 10.8%).
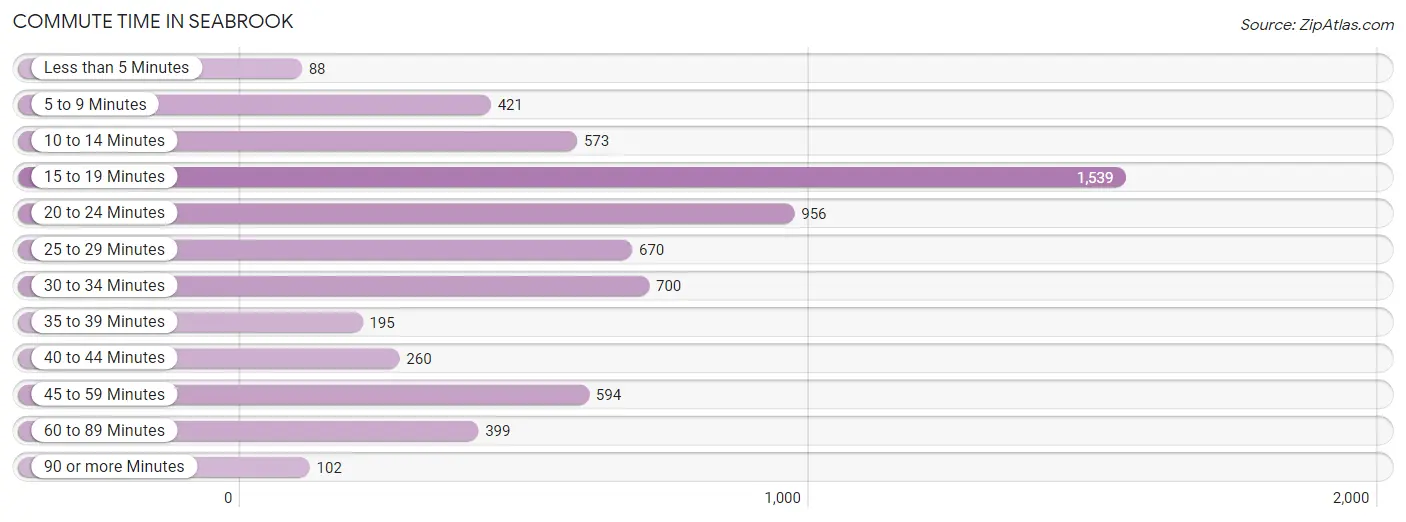
| Commute Time | # Commuters | % Commuters |
| Less than 5 Minutes | 88 | 1.3% |
| 5 to 9 Minutes | 421 | 6.5% |
| 10 to 14 Minutes | 573 | 8.8% |
| 15 to 19 Minutes | 1,539 | 23.7% |
| 20 to 24 Minutes | 956 | 14.7% |
| 25 to 29 Minutes | 670 | 10.3% |
| 30 to 34 Minutes | 700 | 10.8% |
| 35 to 39 Minutes | 195 | 3.0% |
| 40 to 44 Minutes | 260 | 4.0% |
| 45 to 59 Minutes | 594 | 9.1% |
| 60 to 89 Minutes | 399 | 6.1% |
| 90 or more Minutes | 102 | 1.6% |
Commute Time by Sex in Seabrook
The most common commute times in Seabrook are 15 to 19 minutes (1,010 commuters, 26.8%) for males and 15 to 19 minutes (529 commuters, 19.4%) for females.
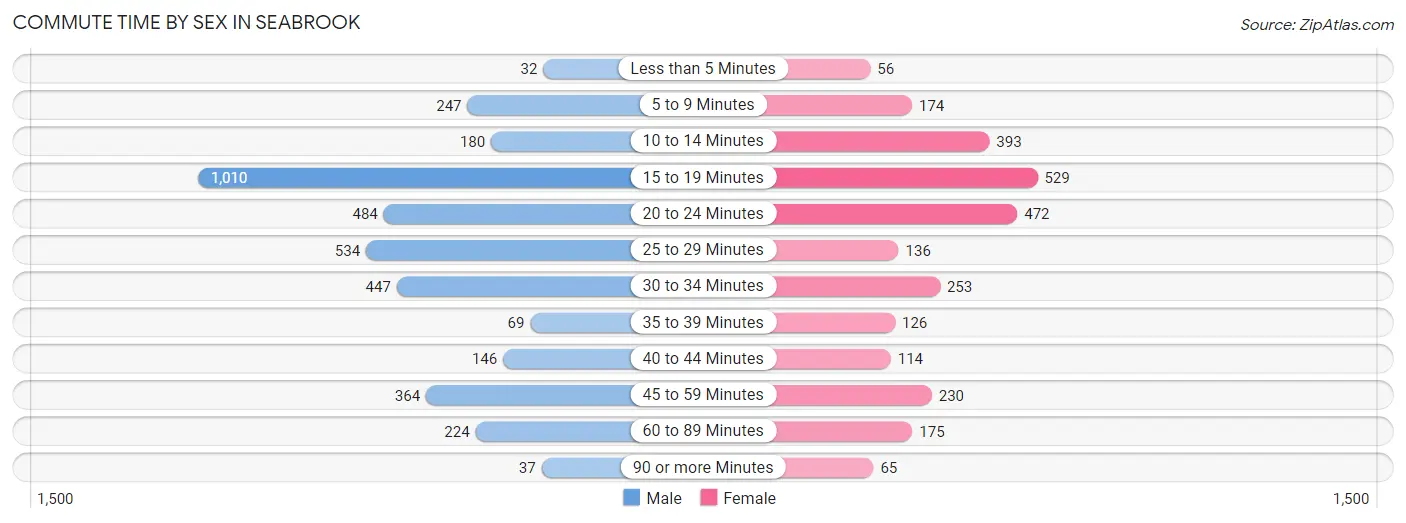
| Commute Time | Male | Female |
| Less than 5 Minutes | 32 (0.9%) | 56 (2.1%) |
| 5 to 9 Minutes | 247 (6.5%) | 174 (6.4%) |
| 10 to 14 Minutes | 180 (4.8%) | 393 (14.4%) |
| 15 to 19 Minutes | 1,010 (26.8%) | 529 (19.4%) |
| 20 to 24 Minutes | 484 (12.8%) | 472 (17.3%) |
| 25 to 29 Minutes | 534 (14.1%) | 136 (5.0%) |
| 30 to 34 Minutes | 447 (11.8%) | 253 (9.3%) |
| 35 to 39 Minutes | 69 (1.8%) | 126 (4.6%) |
| 40 to 44 Minutes | 146 (3.9%) | 114 (4.2%) |
| 45 to 59 Minutes | 364 (9.6%) | 230 (8.5%) |
| 60 to 89 Minutes | 224 (5.9%) | 175 (6.4%) |
| 90 or more Minutes | 37 (1.0%) | 65 (2.4%) |
Time of Departure to Work by Sex in Seabrook
The most frequent times of departure to work in Seabrook are 7:00 AM to 7:29 AM (610, 16.2%) for males and 7:30 AM to 7:59 AM (709, 26.0%) for females.
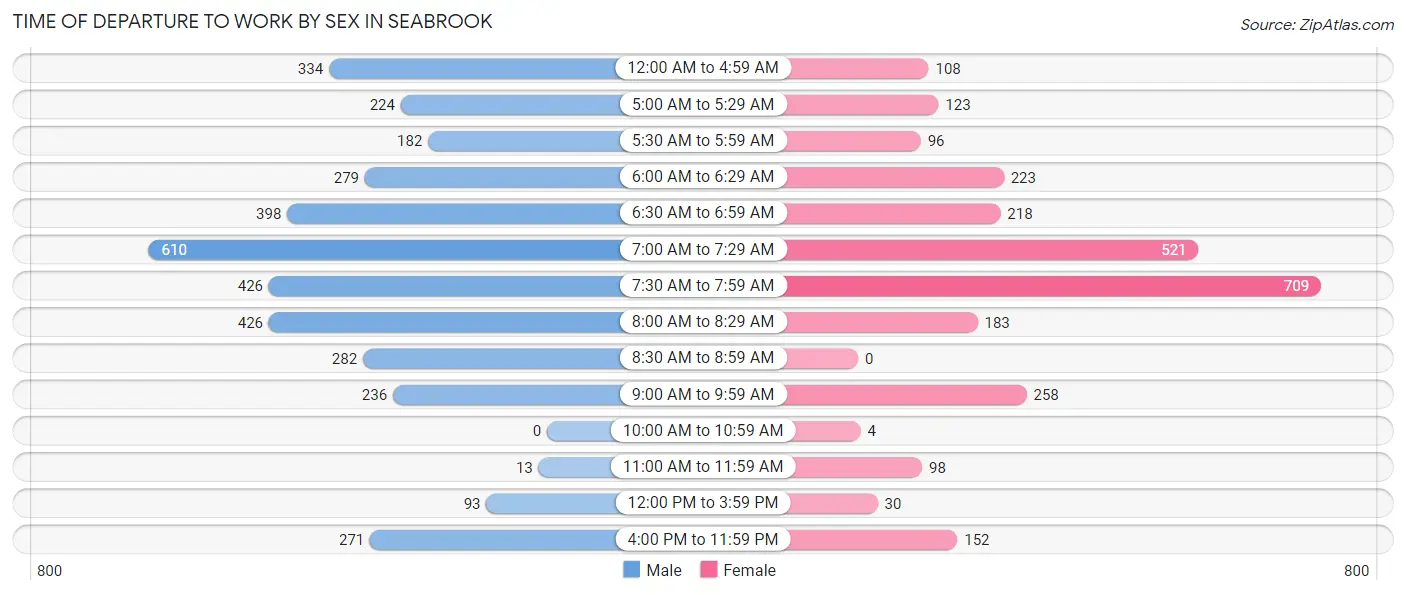
| Time of Departure | Male | Female |
| 12:00 AM to 4:59 AM | 334 (8.8%) | 108 (4.0%) |
| 5:00 AM to 5:29 AM | 224 (5.9%) | 123 (4.5%) |
| 5:30 AM to 5:59 AM | 182 (4.8%) | 96 (3.5%) |
| 6:00 AM to 6:29 AM | 279 (7.4%) | 223 (8.2%) |
| 6:30 AM to 6:59 AM | 398 (10.5%) | 218 (8.0%) |
| 7:00 AM to 7:29 AM | 610 (16.2%) | 521 (19.1%) |
| 7:30 AM to 7:59 AM | 426 (11.3%) | 709 (26.0%) |
| 8:00 AM to 8:29 AM | 426 (11.3%) | 183 (6.7%) |
| 8:30 AM to 8:59 AM | 282 (7.5%) | 0 (0.0%) |
| 9:00 AM to 9:59 AM | 236 (6.2%) | 258 (9.5%) |
| 10:00 AM to 10:59 AM | 0 (0.0%) | 4 (0.2%) |
| 11:00 AM to 11:59 AM | 13 (0.3%) | 98 (3.6%) |
| 12:00 PM to 3:59 PM | 93 (2.5%) | 30 (1.1%) |
| 4:00 PM to 11:59 PM | 271 (7.2%) | 152 (5.6%) |
| Total | 3,774 (100.0%) | 2,723 (100.0%) |
Housing Occupancy in Seabrook
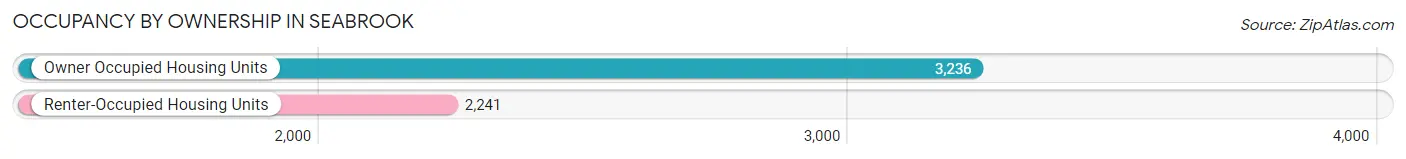
Occupancy by Ownership in Seabrook
Of the total 5,477 dwellings in Seabrook, owner-occupied units account for 3,236 (59.1%), while renter-occupied units make up 2,241 (40.9%).
| Occupancy | # Housing Units | % Housing Units |
| Owner Occupied Housing Units | 3,236 | 59.1% |
| Renter-Occupied Housing Units | 2,241 | 40.9% |
| Total Occupied Housing Units | 5,477 | 100.0% |
Occupancy by Household Size in Seabrook
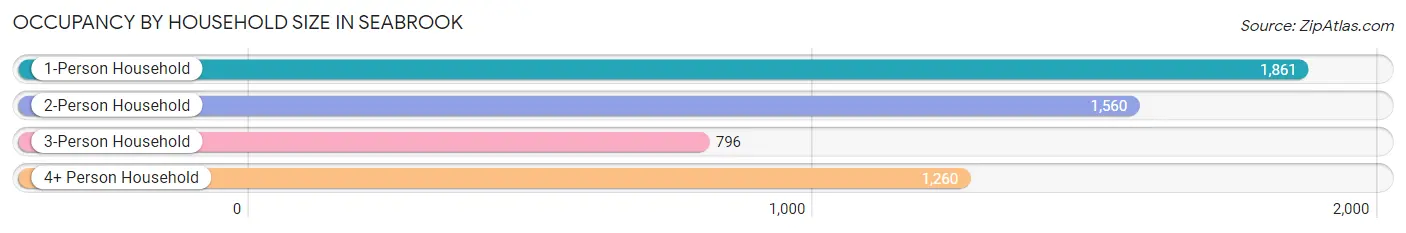
| Household Size | # Housing Units | % Housing Units |
| 1-Person Household | 1,861 | 34.0% |
| 2-Person Household | 1,560 | 28.5% |
| 3-Person Household | 796 | 14.5% |
| 4+ Person Household | 1,260 | 23.0% |
| Total Housing Units | 5,477 | 100.0% |
Occupancy by Ownership by Household Size in Seabrook
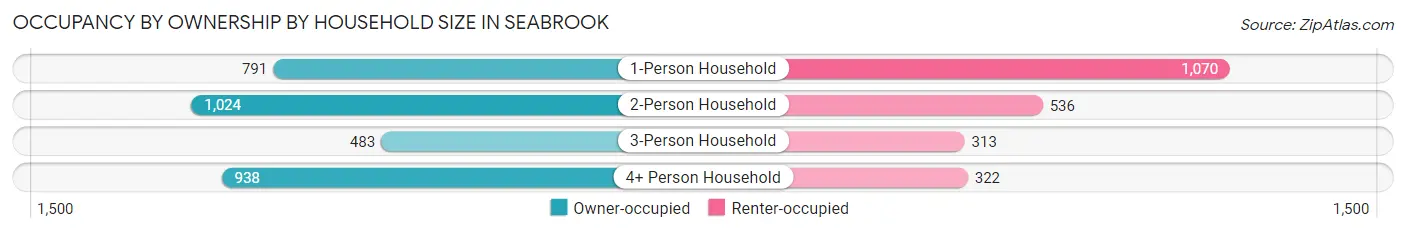
| Household Size | Owner-occupied | Renter-occupied |
| 1-Person Household | 791 (42.5%) | 1,070 (57.5%) |
| 2-Person Household | 1,024 (65.6%) | 536 (34.4%) |
| 3-Person Household | 483 (60.7%) | 313 (39.3%) |
| 4+ Person Household | 938 (74.4%) | 322 (25.6%) |
| Total Housing Units | 3,236 (59.1%) | 2,241 (40.9%) |
Occupancy by Educational Attainment in Seabrook
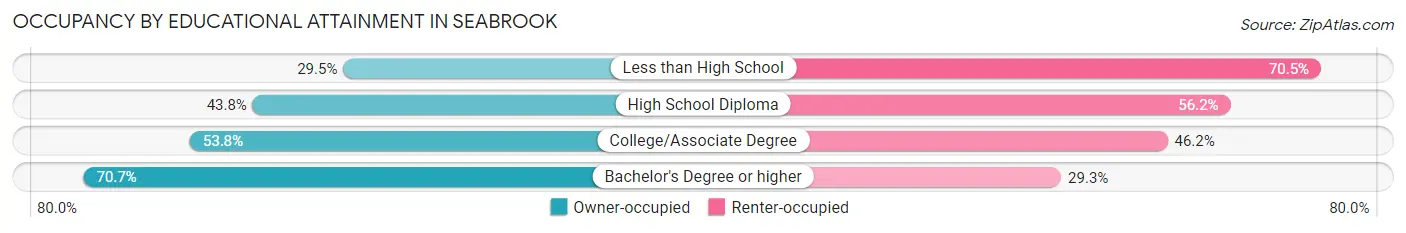
| Household Size | Owner-occupied | Renter-occupied |
| Less than High School | 104 (29.5%) | 249 (70.5%) |
| High School Diploma | 280 (43.8%) | 359 (56.2%) |
| College/Associate Degree | 1,010 (53.8%) | 868 (46.2%) |
| Bachelor's Degree or higher | 1,842 (70.7%) | 765 (29.3%) |
Occupancy by Age of Householder in Seabrook
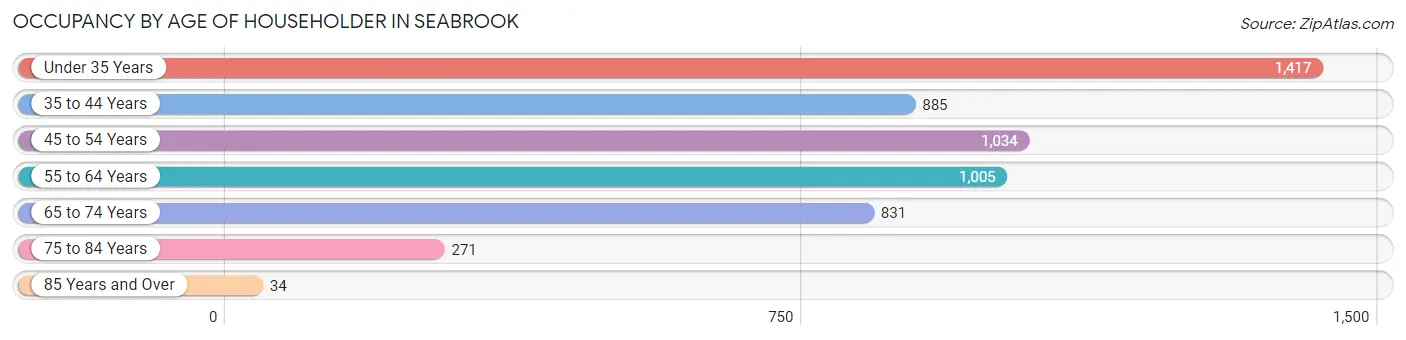
| Age Bracket | # Households | % Households |
| Under 35 Years | 1,417 | 25.9% |
| 35 to 44 Years | 885 | 16.2% |
| 45 to 54 Years | 1,034 | 18.9% |
| 55 to 64 Years | 1,005 | 18.3% |
| 65 to 74 Years | 831 | 15.2% |
| 75 to 84 Years | 271 | 5.0% |
| 85 Years and Over | 34 | 0.6% |
| Total | 5,477 | 100.0% |
Housing Finances in Seabrook
Median Income by Occupancy in Seabrook
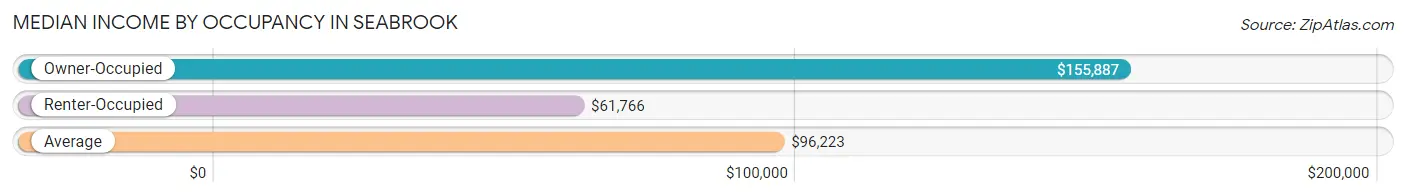
| Occupancy Type | # Households | Median Income |
| Owner-Occupied | 3,236 (59.1%) | $155,887 |
| Renter-Occupied | 2,241 (40.9%) | $61,766 |
| Average | 5,477 (100.0%) | $96,223 |
Occupancy by Householder Income Bracket in Seabrook
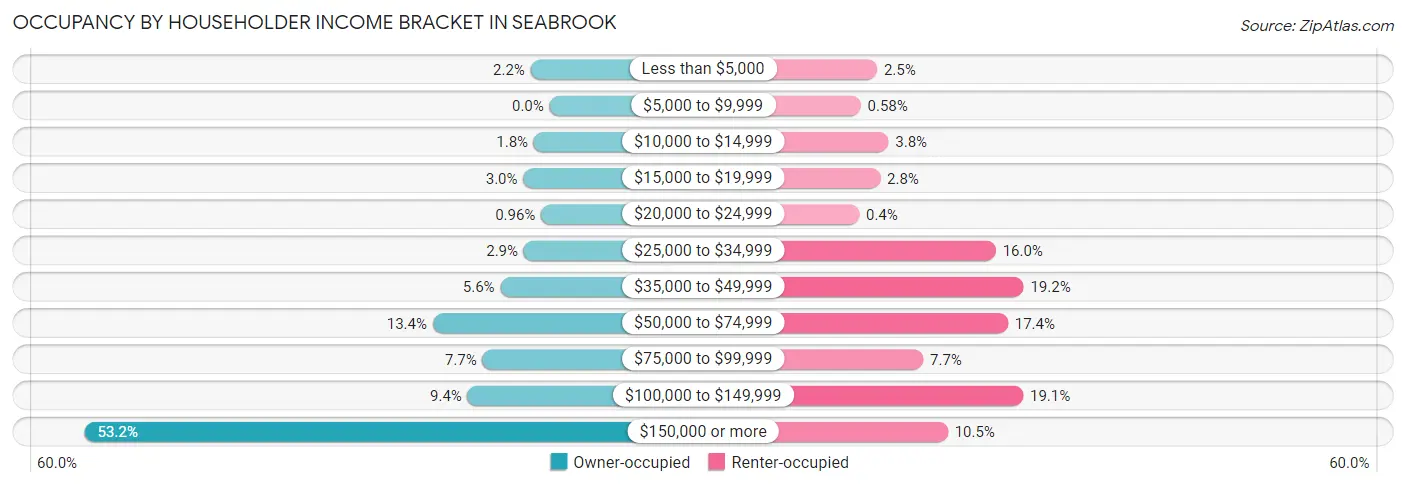
| Income Bracket | Owner-occupied | Renter-occupied |
| Less than $5,000 | 70 (2.2%) | 55 (2.5%) |
| $5,000 to $9,999 | 0 (0.0%) | 13 (0.6%) |
| $10,000 to $14,999 | 58 (1.8%) | 84 (3.7%) |
| $15,000 to $19,999 | 97 (3.0%) | 63 (2.8%) |
| $20,000 to $24,999 | 31 (1.0%) | 9 (0.4%) |
| $25,000 to $34,999 | 95 (2.9%) | 359 (16.0%) |
| $35,000 to $49,999 | 182 (5.6%) | 430 (19.2%) |
| $50,000 to $74,999 | 432 (13.4%) | 390 (17.4%) |
| $75,000 to $99,999 | 248 (7.7%) | 173 (7.7%) |
| $100,000 to $149,999 | 303 (9.4%) | 429 (19.1%) |
| $150,000 or more | 1,720 (53.1%) | 236 (10.5%) |
| Total | 3,236 (100.0%) | 2,241 (100.0%) |
Monthly Housing Cost Tiers in Seabrook
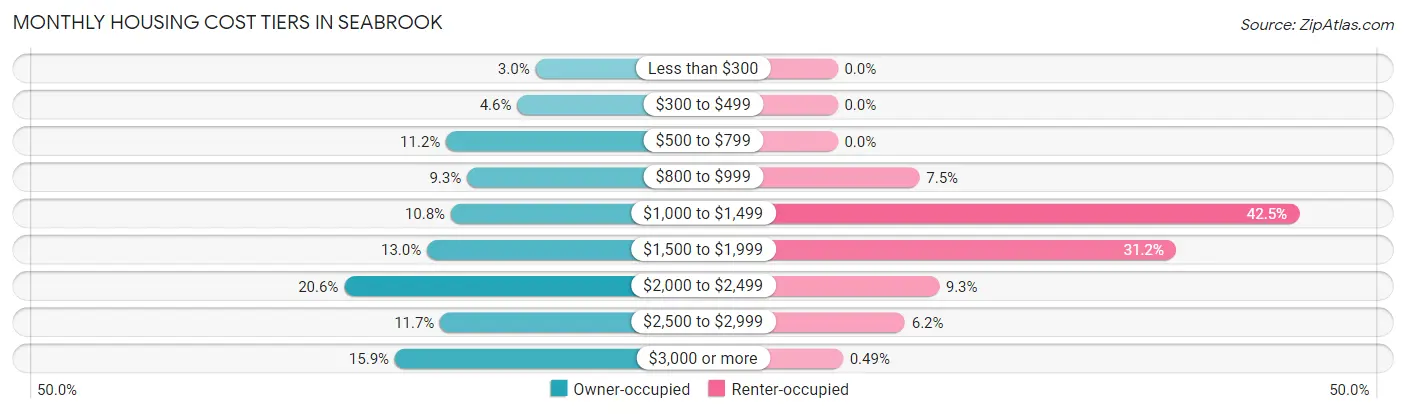
| Monthly Cost | Owner-occupied | Renter-occupied |
| Less than $300 | 96 (3.0%) | 0 (0.0%) |
| $300 to $499 | 150 (4.6%) | 0 (0.0%) |
| $500 to $799 | 362 (11.2%) | 0 (0.0%) |
| $800 to $999 | 300 (9.3%) | 169 (7.5%) |
| $1,000 to $1,499 | 348 (10.7%) | 952 (42.5%) |
| $1,500 to $1,999 | 419 (13.0%) | 698 (31.1%) |
| $2,000 to $2,499 | 666 (20.6%) | 209 (9.3%) |
| $2,500 to $2,999 | 380 (11.7%) | 139 (6.2%) |
| $3,000 or more | 515 (15.9%) | 11 (0.5%) |
| Total | 3,236 (100.0%) | 2,241 (100.0%) |
Physical Housing Characteristics in Seabrook
Housing Structures in Seabrook
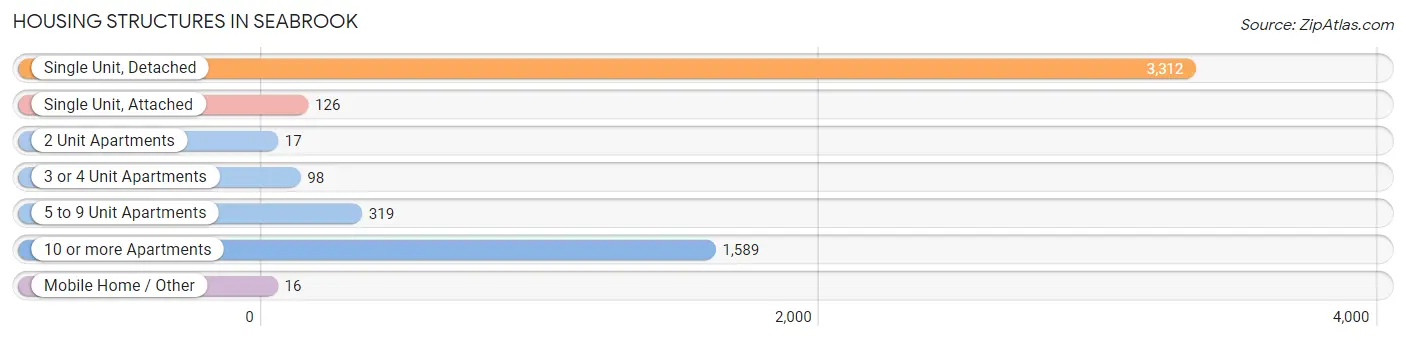
| Structure Type | # Housing Units | % Housing Units |
| Single Unit, Detached | 3,312 | 60.5% |
| Single Unit, Attached | 126 | 2.3% |
| 2 Unit Apartments | 17 | 0.3% |
| 3 or 4 Unit Apartments | 98 | 1.8% |
| 5 to 9 Unit Apartments | 319 | 5.8% |
| 10 or more Apartments | 1,589 | 29.0% |
| Mobile Home / Other | 16 | 0.3% |
| Total | 5,477 | 100.0% |
Housing Structures by Occupancy in Seabrook
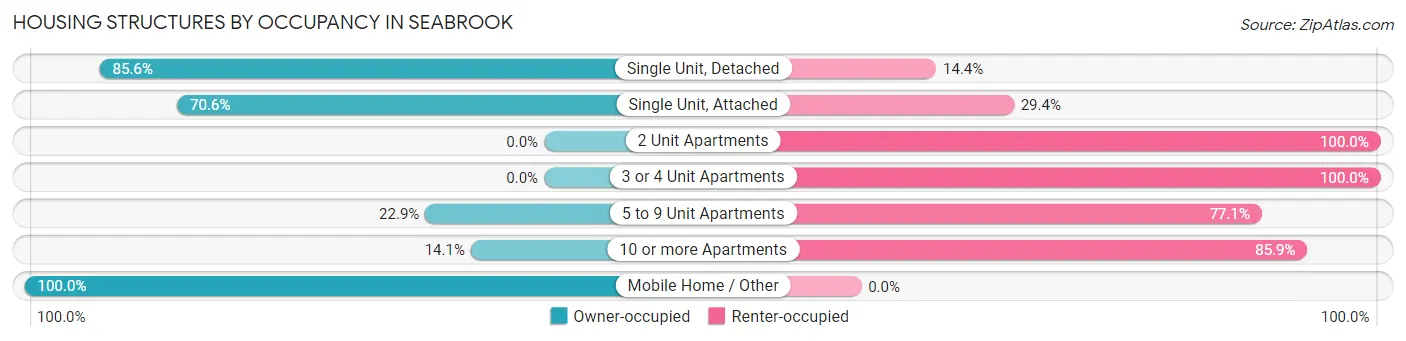
| Structure Type | Owner-occupied | Renter-occupied |
| Single Unit, Detached | 2,834 (85.6%) | 478 (14.4%) |
| Single Unit, Attached | 89 (70.6%) | 37 (29.4%) |
| 2 Unit Apartments | 0 (0.0%) | 17 (100.0%) |
| 3 or 4 Unit Apartments | 0 (0.0%) | 98 (100.0%) |
| 5 to 9 Unit Apartments | 73 (22.9%) | 246 (77.1%) |
| 10 or more Apartments | 224 (14.1%) | 1,365 (85.9%) |
| Mobile Home / Other | 16 (100.0%) | 0 (0.0%) |
| Total | 3,236 (59.1%) | 2,241 (40.9%) |
Housing Structures by Number of Rooms in Seabrook
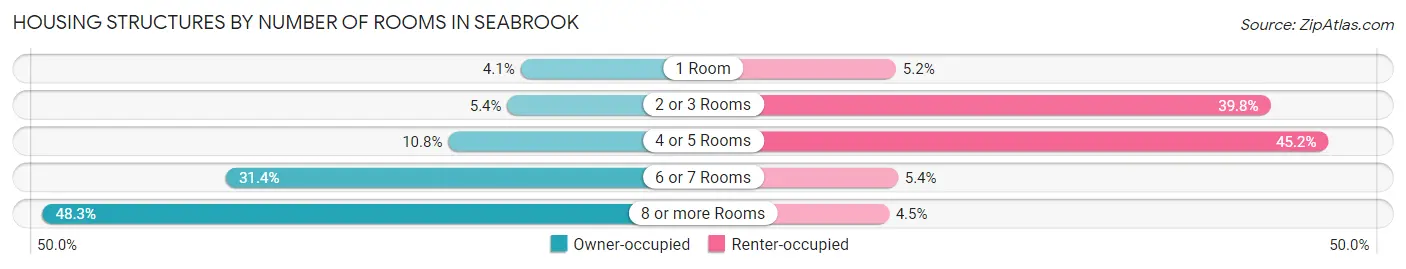
| Number of Rooms | Owner-occupied | Renter-occupied |
| 1 Room | 134 (4.1%) | 116 (5.2%) |
| 2 or 3 Rooms | 173 (5.3%) | 892 (39.8%) |
| 4 or 5 Rooms | 350 (10.8%) | 1,012 (45.2%) |
| 6 or 7 Rooms | 1,015 (31.4%) | 120 (5.3%) |
| 8 or more Rooms | 1,564 (48.3%) | 101 (4.5%) |
| Total | 3,236 (100.0%) | 2,241 (100.0%) |
Housing Structure by Heating Type in Seabrook
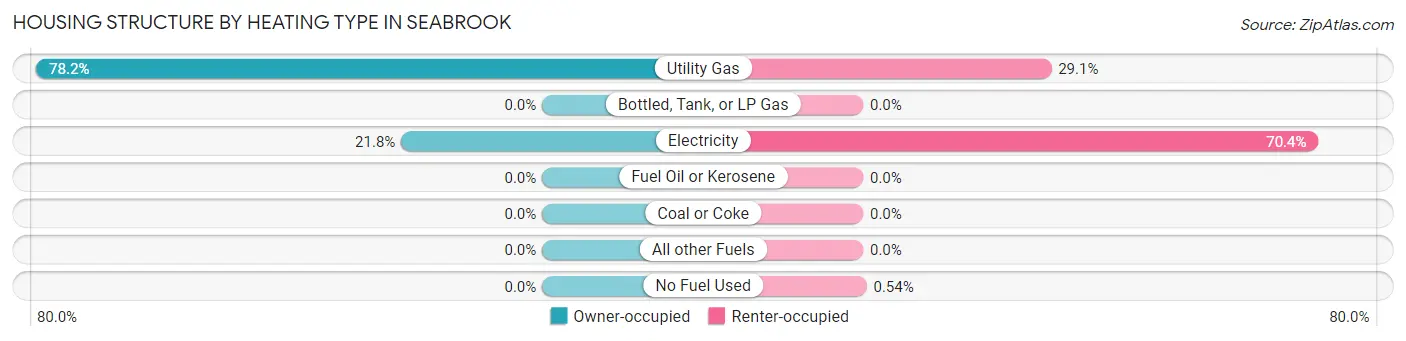
| Heating Type | Owner-occupied | Renter-occupied |
| Utility Gas | 2,531 (78.2%) | 652 (29.1%) |
| Bottled, Tank, or LP Gas | 0 (0.0%) | 0 (0.0%) |
| Electricity | 705 (21.8%) | 1,577 (70.4%) |
| Fuel Oil or Kerosene | 0 (0.0%) | 0 (0.0%) |
| Coal or Coke | 0 (0.0%) | 0 (0.0%) |
| All other Fuels | 0 (0.0%) | 0 (0.0%) |
| No Fuel Used | 0 (0.0%) | 12 (0.5%) |
| Total | 3,236 (100.0%) | 2,241 (100.0%) |
Household Vehicle Usage in Seabrook
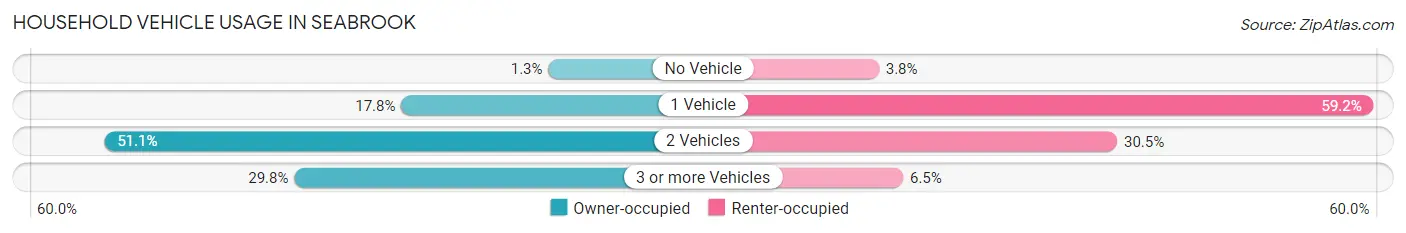
| Vehicles per Household | Owner-occupied | Renter-occupied |
| No Vehicle | 43 (1.3%) | 85 (3.8%) |
| 1 Vehicle | 576 (17.8%) | 1,327 (59.2%) |
| 2 Vehicles | 1,653 (51.1%) | 683 (30.5%) |
| 3 or more Vehicles | 964 (29.8%) | 146 (6.5%) |
| Total | 3,236 (100.0%) | 2,241 (100.0%) |
Real Estate & Mortgages in Seabrook
Real Estate and Mortgage Overview in Seabrook
| Characteristic | Without Mortgage | With Mortgage |
| Housing Units | 1,278 | 1,958 |
| Median Property Value | $247,600 | $323,000 |
| Median Household Income | $96,154 | $1,229 |
| Monthly Housing Costs | $829 | $515 |
| Real Estate Taxes | $3,695 | $41 |
Property Value by Mortgage Status in Seabrook
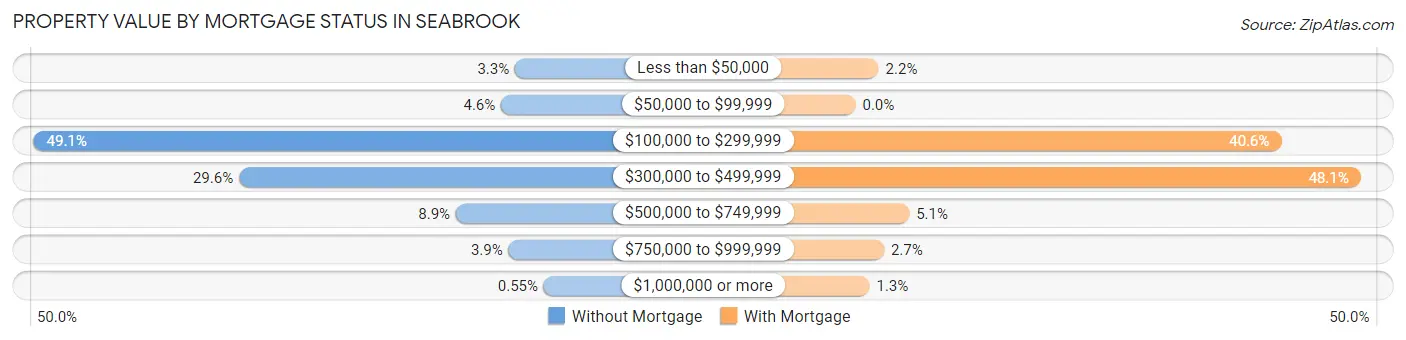
| Property Value | Without Mortgage | With Mortgage |
| Less than $50,000 | 42 (3.3%) | 43 (2.2%) |
| $50,000 to $99,999 | 59 (4.6%) | 0 (0.0%) |
| $100,000 to $299,999 | 628 (49.1%) | 794 (40.6%) |
| $300,000 to $499,999 | 378 (29.6%) | 942 (48.1%) |
| $500,000 to $749,999 | 114 (8.9%) | 100 (5.1%) |
| $750,000 to $999,999 | 50 (3.9%) | 53 (2.7%) |
| $1,000,000 or more | 7 (0.5%) | 26 (1.3%) |
| Total | 1,278 (100.0%) | 1,958 (100.0%) |
Household Income by Mortgage Status in Seabrook
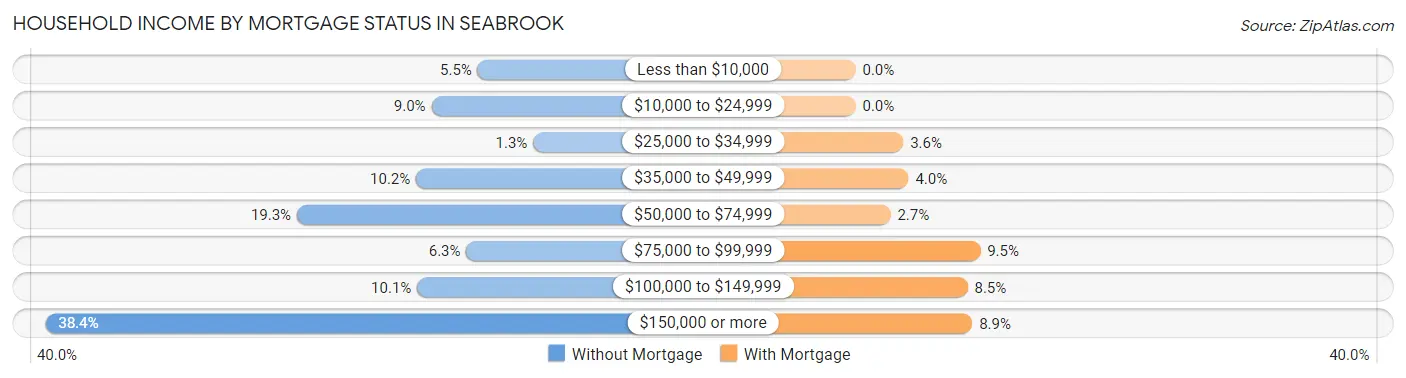
| Household Income | Without Mortgage | With Mortgage |
| Less than $10,000 | 70 (5.5%) | 0 (0.0%) |
| $10,000 to $24,999 | 115 (9.0%) | 0 (0.0%) |
| $25,000 to $34,999 | 16 (1.3%) | 71 (3.6%) |
| $35,000 to $49,999 | 130 (10.2%) | 79 (4.0%) |
| $50,000 to $74,999 | 246 (19.3%) | 52 (2.7%) |
| $75,000 to $99,999 | 81 (6.3%) | 186 (9.5%) |
| $100,000 to $149,999 | 129 (10.1%) | 167 (8.5%) |
| $150,000 or more | 491 (38.4%) | 174 (8.9%) |
| Total | 1,278 (100.0%) | 1,958 (100.0%) |
Property Value to Household Income Ratio in Seabrook
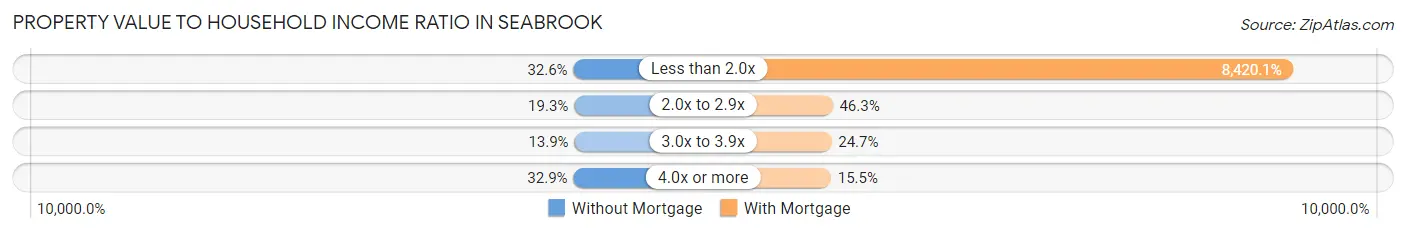
| Value-to-Income Ratio | Without Mortgage | With Mortgage |
| Less than 2.0x | 417 (32.6%) | 164,866 (8,420.1%) |
| 2.0x to 2.9x | 247 (19.3%) | 907 (46.3%) |
| 3.0x to 3.9x | 178 (13.9%) | 484 (24.7%) |
| 4.0x or more | 421 (32.9%) | 304 (15.5%) |
| Total | 1,278 (100.0%) | 1,958 (100.0%) |
Real Estate Taxes by Mortgage Status in Seabrook
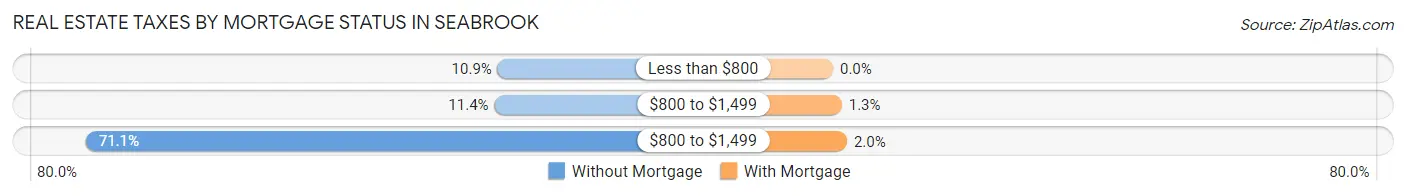
| Property Taxes | Without Mortgage | With Mortgage |
| Less than $800 | 139 (10.9%) | 0 (0.0%) |
| $800 to $1,499 | 145 (11.4%) | 25 (1.3%) |
| $800 to $1,499 | 908 (71.1%) | 40 (2.0%) |
| Total | 1,278 (100.0%) | 1,958 (100.0%) |
Health & Disability in Seabrook
Health Insurance Coverage by Age in Seabrook
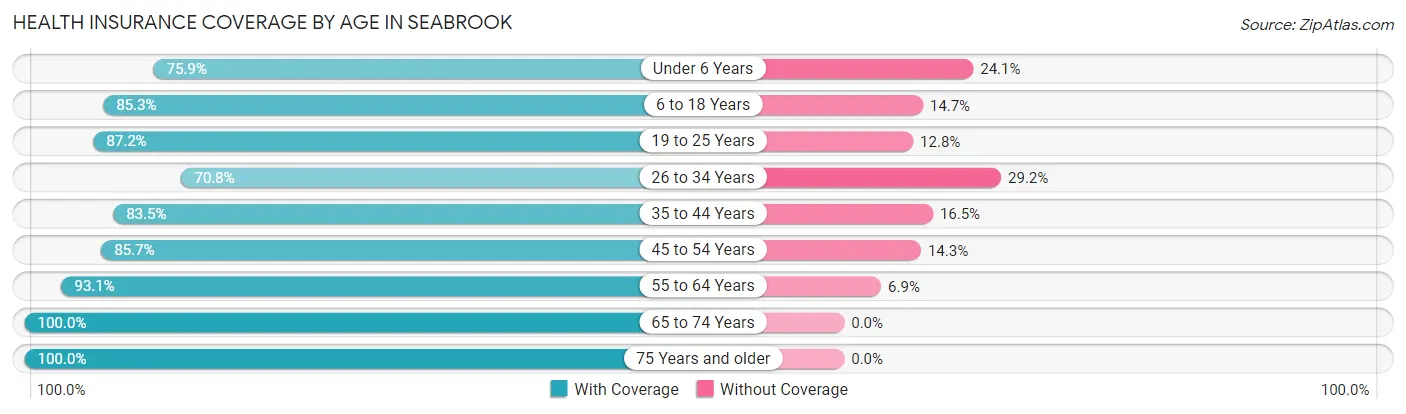
| Age Bracket | With Coverage | Without Coverage |
| Under 6 Years | 824 (75.9%) | 261 (24.1%) |
| 6 to 18 Years | 1,833 (85.3%) | 315 (14.7%) |
| 19 to 25 Years | 1,290 (87.2%) | 190 (12.8%) |
| 26 to 34 Years | 1,486 (70.8%) | 614 (29.2%) |
| 35 to 44 Years | 1,278 (83.5%) | 253 (16.5%) |
| 45 to 54 Years | 1,624 (85.7%) | 271 (14.3%) |
| 55 to 64 Years | 1,436 (93.1%) | 106 (6.9%) |
| 65 to 74 Years | 1,232 (100.0%) | 0 (0.0%) |
| 75 Years and older | 528 (100.0%) | 0 (0.0%) |
| Total | 11,531 (85.2%) | 2,010 (14.8%) |
Health Insurance Coverage by Citizenship Status in Seabrook
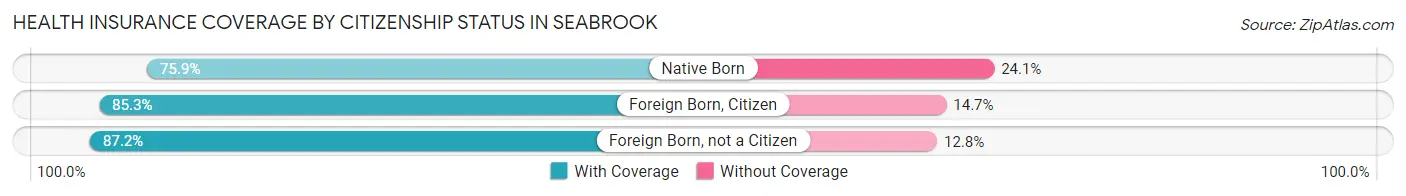
| Citizenship Status | With Coverage | Without Coverage |
| Native Born | 824 (75.9%) | 261 (24.1%) |
| Foreign Born, Citizen | 1,833 (85.3%) | 315 (14.7%) |
| Foreign Born, not a Citizen | 1,290 (87.2%) | 190 (12.8%) |
Health Insurance Coverage by Household Income in Seabrook
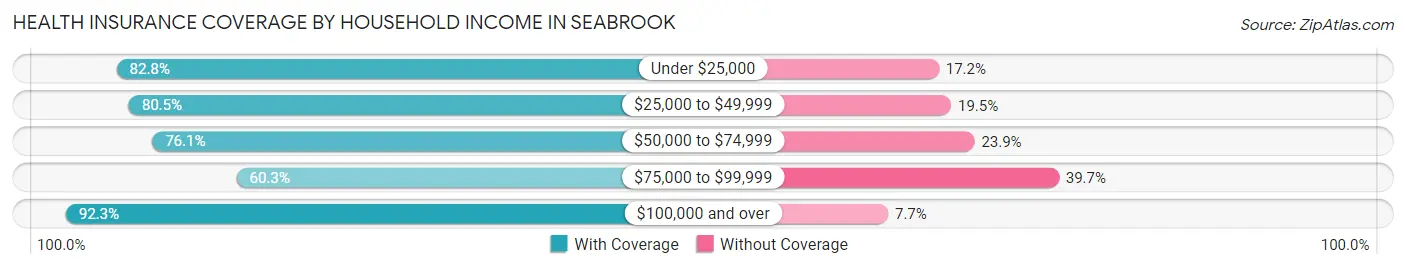
| Household Income | With Coverage | Without Coverage |
| Under $25,000 | 672 (82.8%) | 140 (17.2%) |
| $25,000 to $49,999 | 1,829 (80.5%) | 444 (19.5%) |
| $50,000 to $74,999 | 1,263 (76.1%) | 397 (23.9%) |
| $75,000 to $99,999 | 657 (60.3%) | 433 (39.7%) |
| $100,000 and over | 7,110 (92.3%) | 596 (7.7%) |
Public vs Private Health Insurance Coverage by Age in Seabrook
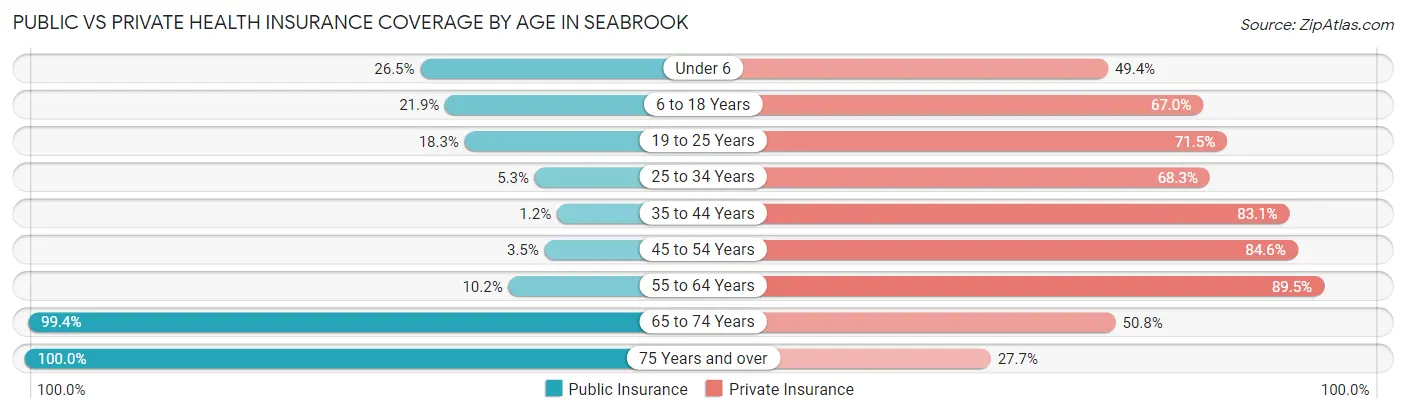
| Age Bracket | Public Insurance | Private Insurance |
| Under 6 | 288 (26.5%) | 536 (49.4%) |
| 6 to 18 Years | 471 (21.9%) | 1,440 (67.0%) |
| 19 to 25 Years | 271 (18.3%) | 1,058 (71.5%) |
| 25 to 34 Years | 111 (5.3%) | 1,434 (68.3%) |
| 35 to 44 Years | 18 (1.2%) | 1,272 (83.1%) |
| 45 to 54 Years | 66 (3.5%) | 1,603 (84.6%) |
| 55 to 64 Years | 157 (10.2%) | 1,380 (89.5%) |
| 65 to 74 Years | 1,224 (99.4%) | 626 (50.8%) |
| 75 Years and over | 528 (100.0%) | 146 (27.7%) |
| Total | 3,134 (23.1%) | 9,495 (70.1%) |
Disability Status by Sex by Age in Seabrook
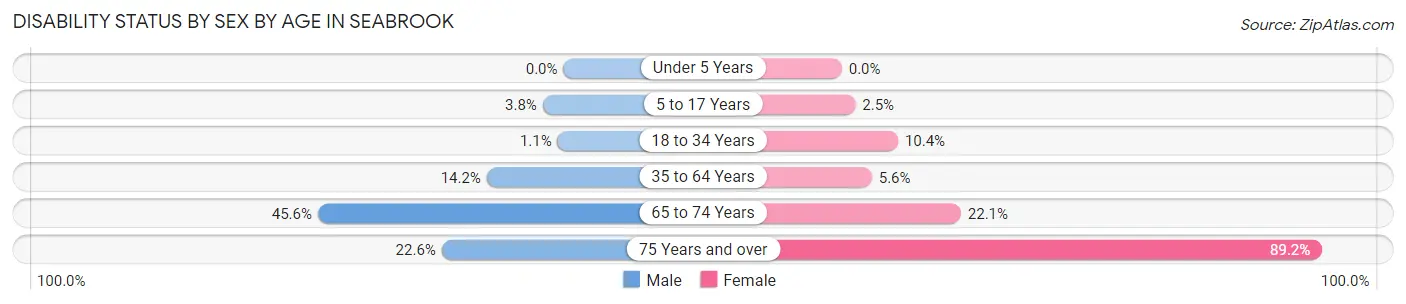
| Age Bracket | Male | Female |
| Under 5 Years | 0 (0.0%) | 0 (0.0%) |
| 5 to 17 Years | 31 (3.8%) | 36 (2.5%) |
| 18 to 34 Years | 22 (1.1%) | 165 (10.4%) |
| 35 to 64 Years | 347 (14.2%) | 141 (5.6%) |
| 65 to 74 Years | 314 (45.6%) | 120 (22.1%) |
| 75 Years and over | 61 (22.6%) | 230 (89.1%) |
Disability Class by Sex by Age in Seabrook
Disability Class: Hearing Difficulty
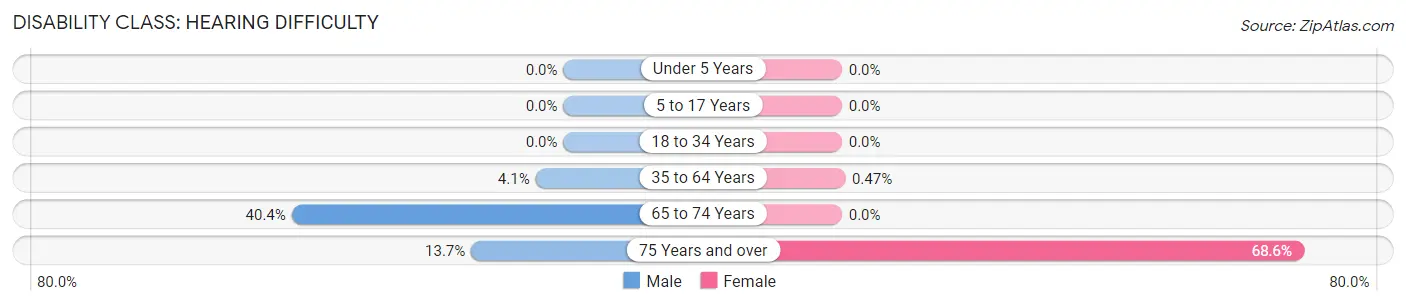
| Age Bracket | Male | Female |
| Under 5 Years | 0 (0.0%) | 0 (0.0%) |
| 5 to 17 Years | 0 (0.0%) | 0 (0.0%) |
| 18 to 34 Years | 0 (0.0%) | 0 (0.0%) |
| 35 to 64 Years | 101 (4.1%) | 12 (0.5%) |
| 65 to 74 Years | 278 (40.4%) | 0 (0.0%) |
| 75 Years and over | 37 (13.7%) | 177 (68.6%) |
Disability Class: Vision Difficulty
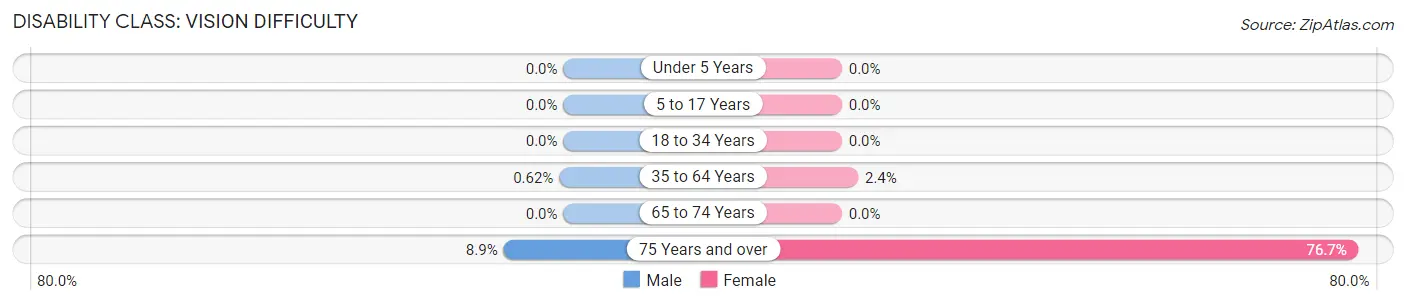
| Age Bracket | Male | Female |
| Under 5 Years | 0 (0.0%) | 0 (0.0%) |
| 5 to 17 Years | 0 (0.0%) | 0 (0.0%) |
| 18 to 34 Years | 0 (0.0%) | 0 (0.0%) |
| 35 to 64 Years | 15 (0.6%) | 61 (2.4%) |
| 65 to 74 Years | 0 (0.0%) | 0 (0.0%) |
| 75 Years and over | 24 (8.9%) | 198 (76.7%) |
Disability Class: Cognitive Difficulty
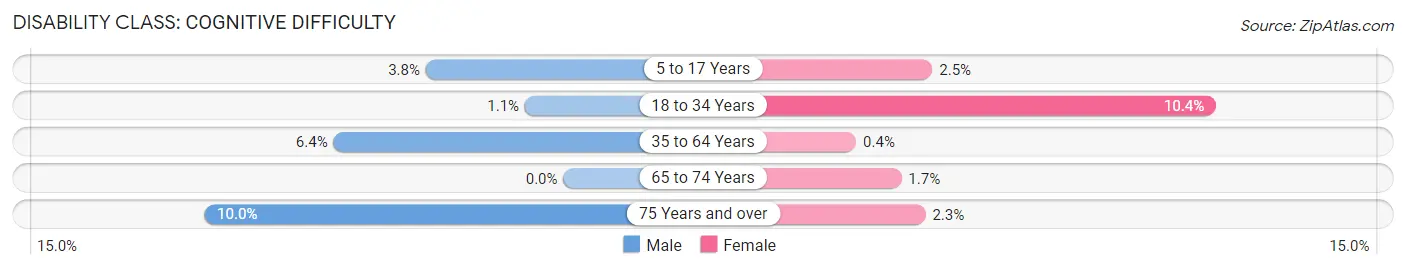
| Age Bracket | Male | Female |
| 5 to 17 Years | 31 (3.8%) | 36 (2.5%) |
| 18 to 34 Years | 22 (1.1%) | 165 (10.4%) |
| 35 to 64 Years | 156 (6.4%) | 10 (0.4%) |
| 65 to 74 Years | 0 (0.0%) | 9 (1.7%) |
| 75 Years and over | 27 (10.0%) | 6 (2.3%) |
Disability Class: Ambulatory Difficulty
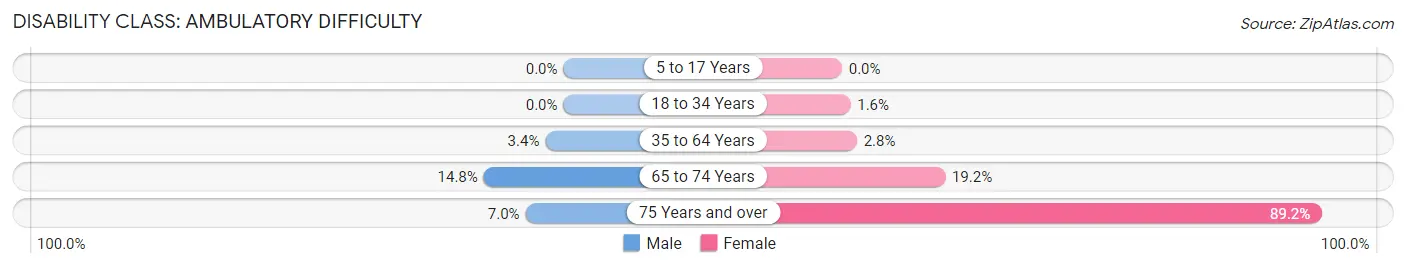
| Age Bracket | Male | Female |
| 5 to 17 Years | 0 (0.0%) | 0 (0.0%) |
| 18 to 34 Years | 0 (0.0%) | 25 (1.6%) |
| 35 to 64 Years | 82 (3.4%) | 70 (2.8%) |
| 65 to 74 Years | 102 (14.8%) | 104 (19.2%) |
| 75 Years and over | 19 (7.0%) | 230 (89.1%) |
Disability Class: Self-Care Difficulty
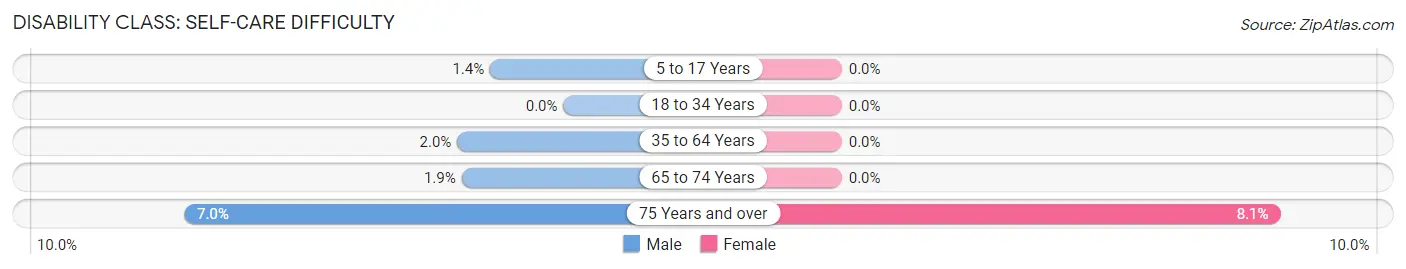
| Age Bracket | Male | Female |
| 5 to 17 Years | 11 (1.4%) | 0 (0.0%) |
| 18 to 34 Years | 0 (0.0%) | 0 (0.0%) |
| 35 to 64 Years | 48 (2.0%) | 0 (0.0%) |
| 65 to 74 Years | 13 (1.9%) | 0 (0.0%) |
| 75 Years and over | 19 (7.0%) | 21 (8.1%) |
Technology Access in Seabrook
Computing Device Access in Seabrook
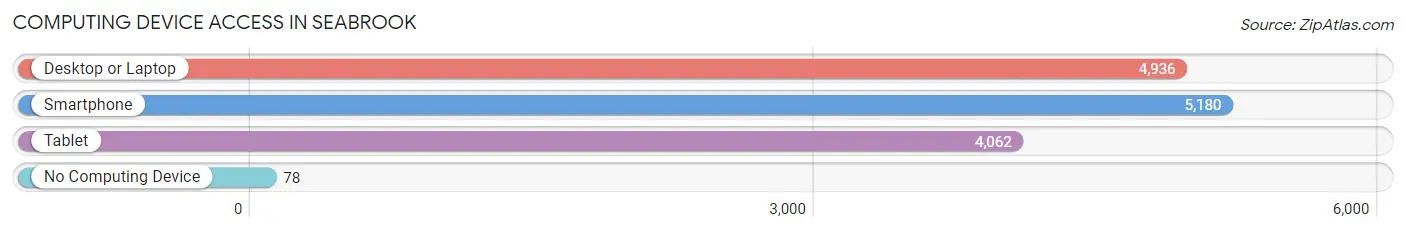
| Device Type | # Households | % Households |
| Desktop or Laptop | 4,936 | 90.1% |
| Smartphone | 5,180 | 94.6% |
| Tablet | 4,062 | 74.2% |
| No Computing Device | 78 | 1.4% |
| Total | 5,477 | 100.0% |
Internet Access in Seabrook
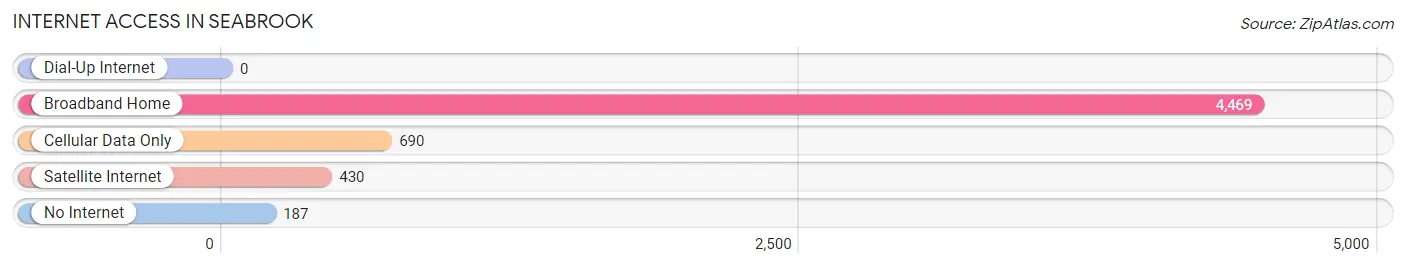
| Internet Type | # Households | % Households |
| Dial-Up Internet | 0 | 0.0% |
| Broadband Home | 4,469 | 81.6% |
| Cellular Data Only | 690 | 12.6% |
| Satellite Internet | 430 | 7.9% |
| No Internet | 187 | 3.4% |
| Total | 5,477 | 100.0% |
Seabrook Summary
Seabrook, Texas is a city located in Harris County, Texas, United States. It is part of the Houston–The Woodlands–Sugar Land metropolitan area. The population was 11,952 at the 2010 census.
History
The area that is now Seabrook was originally inhabited by the Karankawa Indians. The first European settlers arrived in the area in the early 1800s. The town was founded in 1838 by William Seabrook, a settler from England. Seabrook was a successful farmer and rancher, and he established a large plantation in the area.
In the late 1800s, the town began to grow as a fishing and shrimping center. The first post office was established in 1891. In the early 1900s, the town was incorporated and the first mayor was elected.
In the 1950s, the town began to experience rapid growth due to the development of the nearby Johnson Space Center. The town was officially incorporated in 1961.
Geography
Seabrook is located in southeastern Harris County at 29°37′N 95°3′W (29.619, -95.051). It is bordered to the north by the city of Houston, to the east by the city of Pasadena, to the south by the city of Kemah, and to the west by the city of League City.
The city has a total area of 8.2 square miles (21.2 km2), of which 8.1 square miles (21.0 km2) is land and 0.1 square miles (0.2 km2) (1.25%) is water.
Economy
Seabrook's economy is largely based on the oil and gas industry. The city is home to several oil and gas companies, including Shell Oil Company, Chevron Corporation, and ExxonMobil.
The city is also home to several manufacturing companies, including the Seabrook Shipyard, which builds and repairs ships for the U.S. Navy.
The city is also home to several retail stores restaurants and other businesses
Demographics
As of the 2010 census, there were 11,952 people, 4,717 households, and 3,092 families residing in the city. The population density was 1,478.2 people per square mile (571.2/km2). There were 5,093 housing units at an average density of 627.3 per square mile (242.2/km2). The racial makeup of the city was 79.2% White, 8.2% African American, 0.5% Native American, 4.2% Asian, 0.1% Pacific Islander, 5.2% from other races, and 2.7% from two or more races. Hispanic or Latino of any race were 16.7% of the population.
There were 4,717 households, out of which 33.2% had children under the age of 18 living with them, 48.2% were married couples living together, 13.2% had a female householder with no husband present, and 33.2% were non-families. 27.2% of all households were made up of individuals, and 8.2% had someone living alone who was 65 years of age or older. The average household size was 2.51 and the average family size was 3.09.
In the city, the population was spread out, with 25.2% under the age of 18, 8.2% from 18 to 24, 32.2% from 25 to 44, 22.2% from 45 to 64, and 12.2% who were 65 years of age or older. The median age was 36 years. For every 100 females, there were 97.2 males. For every 100 females age 18 and over, there were 94.2 males.
The median income for a household in the city was $50,945, and the median income for a family was $60,945. Males had a median income of $41,945 versus $31,945 for females. The per capita income for the city was $24,945. About 6.2% of families and 8.2% of the population were below the poverty line, including 10.2% of those under age 18 and 8.2% of those age 65 or over.
Common Questions
What is Per Capita Income in Seabrook?
Per Capita income in Seabrook is $51,065.
What is the Median Family Income in Seabrook?
Median Family Income in Seabrook is $144,432.
What is the Median Household income in Seabrook?
Median Household Income in Seabrook is $96,223.
What is Income or Wage Gap in Seabrook?
Income or Wage Gap in Seabrook is 44.0%.
Women in Seabrook earn 56.0 cents for every dollar earned by a man.
What is Inequality or Gini Index in Seabrook?
Inequality or Gini Index in Seabrook is 0.44.
What is the Total Population of Seabrook?
Total Population of Seabrook is 13,558.
What is the Total Male Population of Seabrook?
Total Male Population of Seabrook is 6,733.
What is the Total Female Population of Seabrook?
Total Female Population of Seabrook is 6,825.
What is the Ratio of Males per 100 Females in Seabrook?
There are 98.65 Males per 100 Females in Seabrook.
What is the Ratio of Females per 100 Males in Seabrook?
There are 101.37 Females per 100 Males in Seabrook.
What is the Median Population Age in Seabrook?
Median Population Age in Seabrook is 34.8 Years.
What is the Average Family Size in Seabrook
Average Family Size in Seabrook is 3.2 People.
What is the Average Household Size in Seabrook
Average Household Size in Seabrook is 2.5 People.
How Large is the Labor Force in Seabrook?
There are 7,582 People in the Labor Forcein in Seabrook.
What is the Percentage of People in the Labor Force in Seabrook?
70.3% of People are in the Labor Force in Seabrook.
What is the Unemployment Rate in Seabrook?
Unemployment Rate in Seabrook is 3.8%.