Dimmitt, TX Map & Demographics
Dimmitt Map
Dimmitt Overview
$24,998
PER CAPITA INCOME
$66,719
AVG FAMILY INCOME
$64,848
AVG HOUSEHOLD INCOME
34.9%
WAGE / INCOME GAP [ % ]
65.1¢/ $1
WAGE / INCOME GAP [ $ ]
0.41
INEQUALITY / GINI INDEX
4,169
TOTAL POPULATION
2,098
MALE POPULATION
2,071
FEMALE POPULATION
101.30
MALES / 100 FEMALES
98.71
FEMALES / 100 MALES
31.0
MEDIAN AGE
3.7
AVG FAMILY SIZE
3.1
AVG HOUSEHOLD SIZE
2,187
LABOR FORCE [ PEOPLE ]
71.8%
PERCENT IN LABOR FORCE
2.9%
UNEMPLOYMENT RATE
Dimmitt Zip Codes
Dimmitt Area Codes
Income in Dimmitt
Income Overview in Dimmitt
Per Capita Income in Dimmitt is $24,998, while median incomes of families and households are $66,719 and $64,848 respectively.
| Characteristic | Number | Measure |
| Per Capita Income | 4,169 | $24,998 |
| Median Family Income | 1,042 | $66,719 |
| Mean Family Income | 1,042 | $78,574 |
| Median Household Income | 1,305 | $64,848 |
| Mean Household Income | 1,305 | $73,836 |
| Income Deficit | 1,042 | $0 |
| Wage / Income Gap (%) | 4,169 | 34.89% |
| Wage / Income Gap ($) | 4,169 | 65.11¢ per $1 |
| Gini / Inequality Index | 4,169 | 0.41 |
Earnings by Sex in Dimmitt
Average Earnings in Dimmitt are $34,677, $41,622 for men and $27,102 for women, a difference of 34.9%.
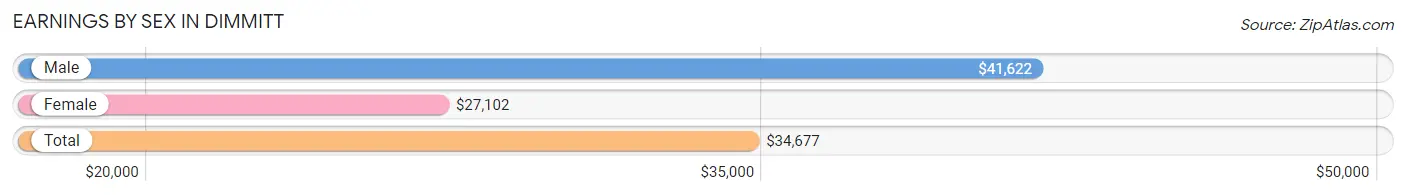
| Sex | Number | Average Earnings |
| Male | 1,266 (56.5%) | $41,622 |
| Female | 974 (43.5%) | $27,102 |
| Total | 2,240 (100.0%) | $34,677 |
Earnings by Sex by Income Bracket in Dimmitt
The most common earnings brackets in Dimmitt are $5,000 to $7,499 for men (210 | 16.6%) and $7,500 to $9,999 for women (147 | 15.1%).
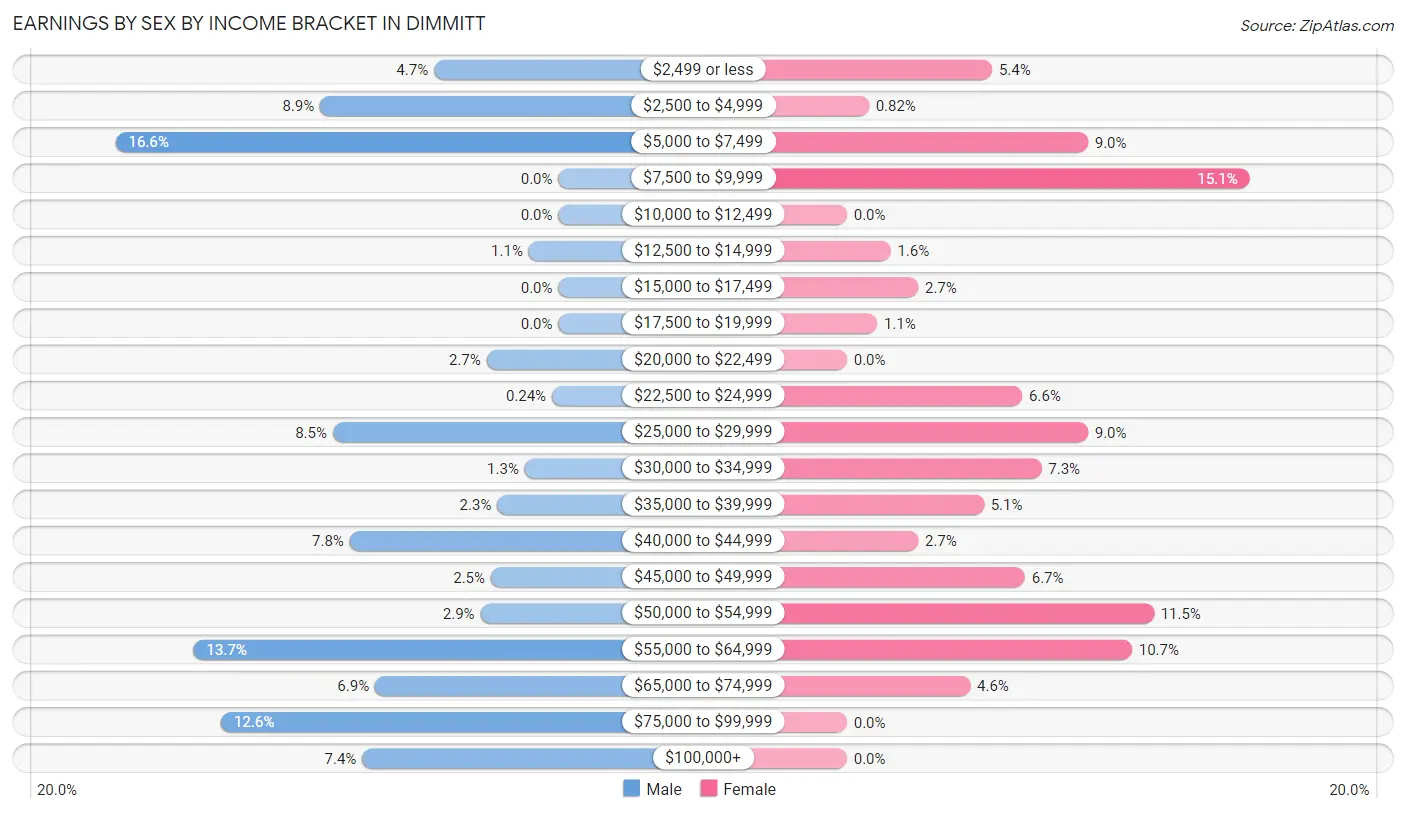
| Income | Male | Female |
| $2,499 or less | 59 (4.7%) | 53 (5.4%) |
| $2,500 to $4,999 | 113 (8.9%) | 8 (0.8%) |
| $5,000 to $7,499 | 210 (16.6%) | 88 (9.0%) |
| $7,500 to $9,999 | 0 (0.0%) | 147 (15.1%) |
| $10,000 to $12,499 | 0 (0.0%) | 0 (0.0%) |
| $12,500 to $14,999 | 14 (1.1%) | 16 (1.6%) |
| $15,000 to $17,499 | 0 (0.0%) | 26 (2.7%) |
| $17,500 to $19,999 | 0 (0.0%) | 11 (1.1%) |
| $20,000 to $22,499 | 34 (2.7%) | 0 (0.0%) |
| $22,500 to $24,999 | 3 (0.2%) | 64 (6.6%) |
| $25,000 to $29,999 | 107 (8.5%) | 88 (9.0%) |
| $30,000 to $34,999 | 16 (1.3%) | 71 (7.3%) |
| $35,000 to $39,999 | 29 (2.3%) | 50 (5.1%) |
| $40,000 to $44,999 | 99 (7.8%) | 26 (2.7%) |
| $45,000 to $49,999 | 32 (2.5%) | 65 (6.7%) |
| $50,000 to $54,999 | 37 (2.9%) | 112 (11.5%) |
| $55,000 to $64,999 | 173 (13.7%) | 104 (10.7%) |
| $65,000 to $74,999 | 87 (6.9%) | 45 (4.6%) |
| $75,000 to $99,999 | 160 (12.6%) | 0 (0.0%) |
| $100,000+ | 93 (7.3%) | 0 (0.0%) |
| Total | 1,266 (100.0%) | 974 (100.0%) |
Earnings by Sex by Educational Attainment in Dimmitt
Average earnings in Dimmitt are $50,608 for men and $27,263 for women, a difference of 46.1%. Men with an educational attainment of bachelor's degree enjoy the highest average annual earnings of $97,900, while those with high school diploma education earn the least with $61,938. Women with an educational attainment of bachelor's degree earn the most with the average annual earnings of $51,130, while those with less than high school education have the smallest earnings of $23,981.
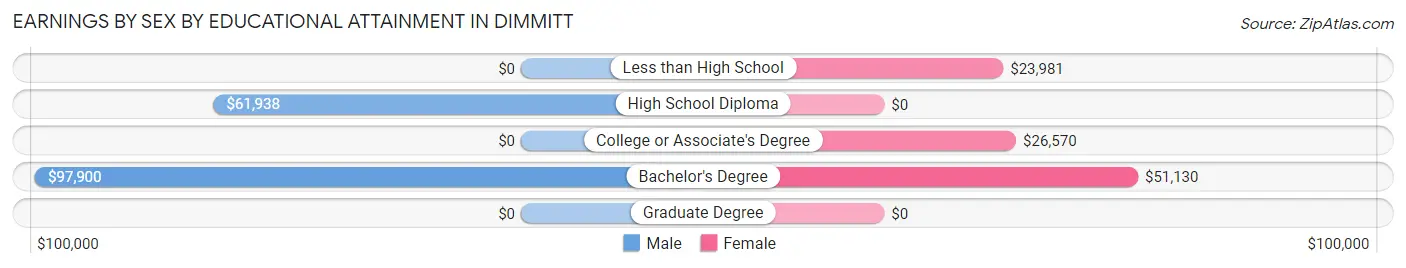
| Educational Attainment | Male Income | Female Income |
| Less than High School | - | - |
| High School Diploma | $61,938 | $0 |
| College or Associate's Degree | - | - |
| Bachelor's Degree | $97,900 | $51,130 |
| Graduate Degree | - | - |
| Total | $50,608 | $27,263 |
Family Income in Dimmitt
Family Income Brackets in Dimmitt
According to the Dimmitt family income data, there are 220 families falling into the $75,000 to $99,999 income range, which is the most common income bracket and makes up 21.1% of all families. Conversely, the $200,000+ income bracket is the least frequent group with only 42 families (4.0%) belonging to this category.
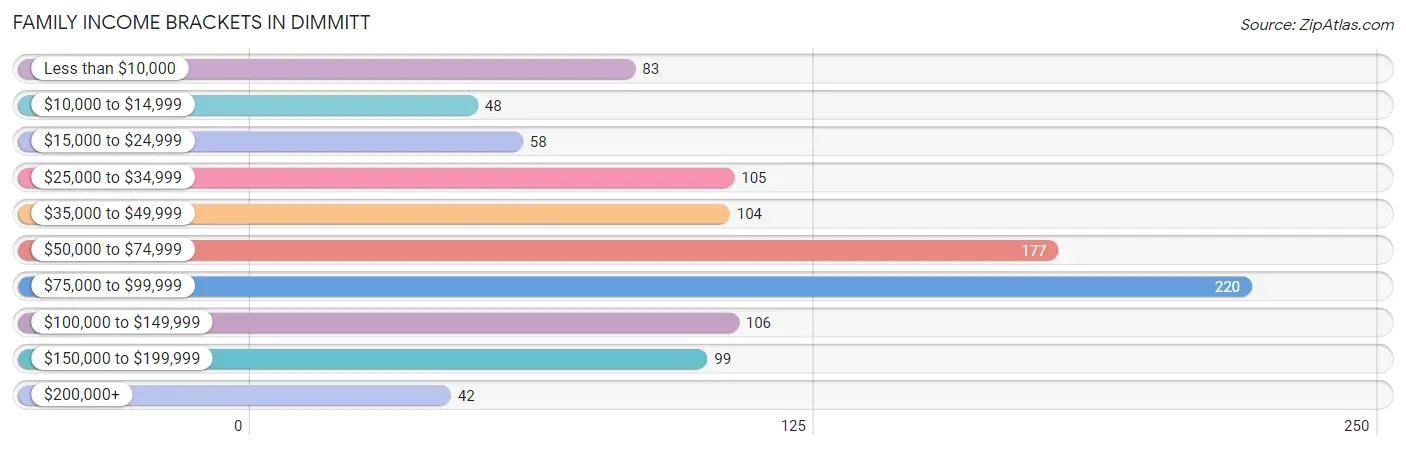
| Income Bracket | # Families | % Families |
| Less than $10,000 | 83 | 8.0% |
| $10,000 to $14,999 | 48 | 4.6% |
| $15,000 to $24,999 | 58 | 5.6% |
| $25,000 to $34,999 | 105 | 10.1% |
| $35,000 to $49,999 | 104 | 10.0% |
| $50,000 to $74,999 | 177 | 17.0% |
| $75,000 to $99,999 | 220 | 21.1% |
| $100,000 to $149,999 | 106 | 10.2% |
| $150,000 to $199,999 | 99 | 9.5% |
| $200,000+ | 42 | 4.0% |
Family Income by Famaliy Size in Dimmitt
4-person families (252 | 24.2%) account for the highest median family income in Dimmitt with $80,530 per family, while 2-person families (438 | 42.0%) have the highest median income of $21,202 per family member.
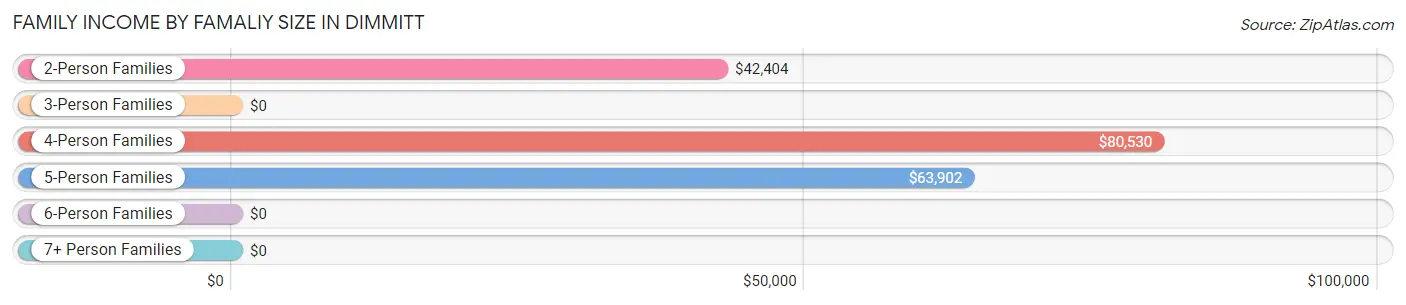
| Income Bracket | # Families | Median Income |
| 2-Person Families | 438 (42.0%) | $42,404 |
| 3-Person Families | 219 (21.0%) | $0 |
| 4-Person Families | 252 (24.2%) | $80,530 |
| 5-Person Families | 98 (9.4%) | $63,902 |
| 6-Person Families | 8 (0.8%) | $0 |
| 7+ Person Families | 27 (2.6%) | $0 |
| Total | 1,042 (100.0%) | $66,719 |
Family Income by Number of Earners in Dimmitt
The median family income in Dimmitt is $66,719, with families comprising 3+ earners (123) having the highest median family income of $98,274, while families with 1 earner (245) have the lowest median family income of $35,129, accounting for 11.8% and 23.5% of families, respectively.
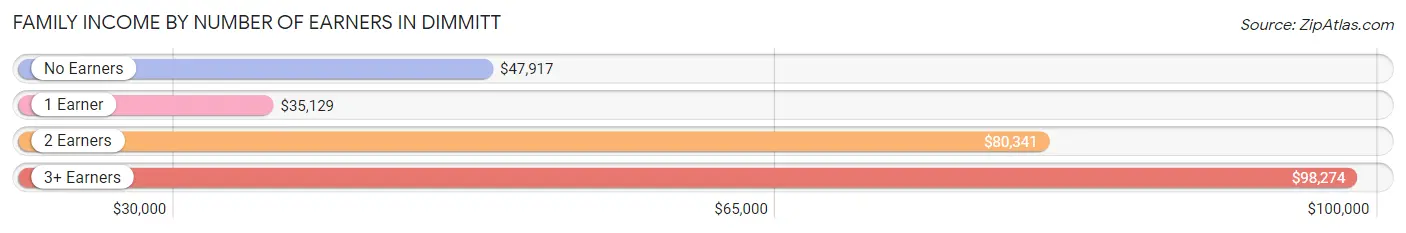
| Number of Earners | # Families | Median Income |
| No Earners | 105 (10.1%) | $47,917 |
| 1 Earner | 245 (23.5%) | $35,129 |
| 2 Earners | 569 (54.6%) | $80,341 |
| 3+ Earners | 123 (11.8%) | $98,274 |
| Total | 1,042 (100.0%) | $66,719 |
Household Income in Dimmitt
Household Income Brackets in Dimmitt
With 301 households falling in the category, the $75,000 to $99,999 income range is the most frequent in Dimmitt, accounting for 23.1% of all households. In contrast, only 42 households (3.2%) fall into the $200,000+ income bracket, making it the least populous group.
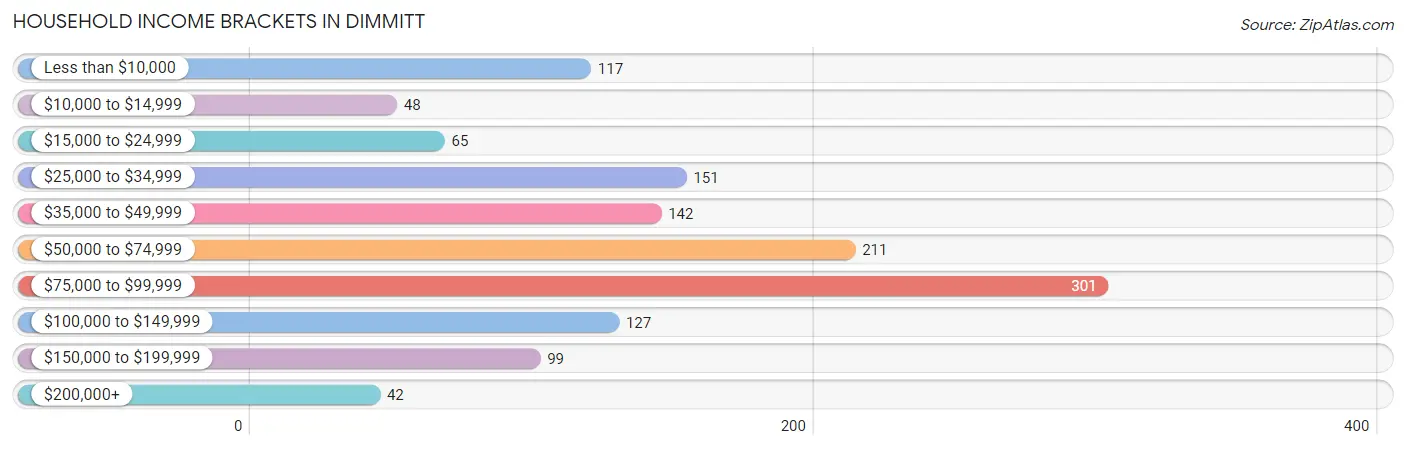
| Income Bracket | # Households | % Households |
| Less than $10,000 | 117 | 9.0% |
| $10,000 to $14,999 | 48 | 3.7% |
| $15,000 to $24,999 | 65 | 5.0% |
| $25,000 to $34,999 | 151 | 11.6% |
| $35,000 to $49,999 | 142 | 10.9% |
| $50,000 to $74,999 | 211 | 16.2% |
| $75,000 to $99,999 | 301 | 23.1% |
| $100,000 to $149,999 | 127 | 9.7% |
| $150,000 to $199,999 | 99 | 7.6% |
| $200,000+ | 42 | 3.2% |
Household Income by Householder Age in Dimmitt
The median household income in Dimmitt is $64,848, with the highest median household income of $83,518 found in the 25 to 44 years age bracket for the primary householder. A total of 499 households (38.2%) fall into this category. Meanwhile, the 15 to 24 years age bracket for the primary householder has the lowest median household income of $0, with 23 households (1.8%) in this group.
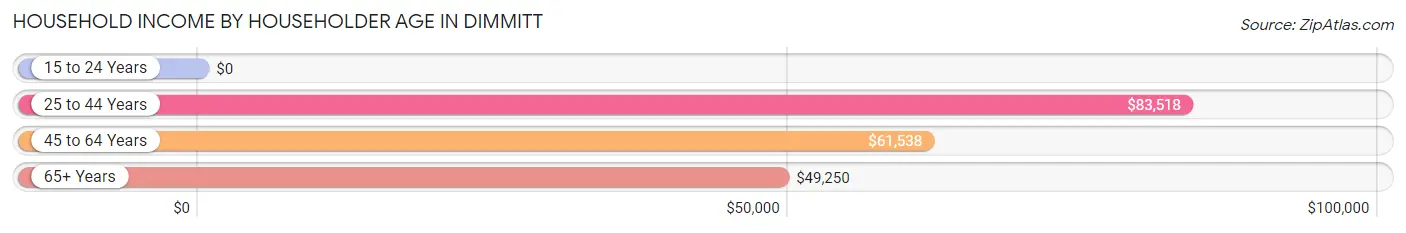
| Income Bracket | # Households | Median Income |
| 15 to 24 Years | 23 (1.8%) | $0 |
| 25 to 44 Years | 499 (38.2%) | $83,518 |
| 45 to 64 Years | 444 (34.0%) | $61,538 |
| 65+ Years | 339 (26.0%) | $49,250 |
| Total | 1,305 (100.0%) | $64,848 |
Poverty in Dimmitt
Income Below Poverty by Sex and Age in Dimmitt
With 11.9% poverty level for males and 10.8% for females among the residents of Dimmitt, 75 year old and over males and 35 to 44 year old females are the most vulnerable to poverty, with 25 males (33.8%) and 84 females (38.9%) in their respective age groups living below the poverty level.
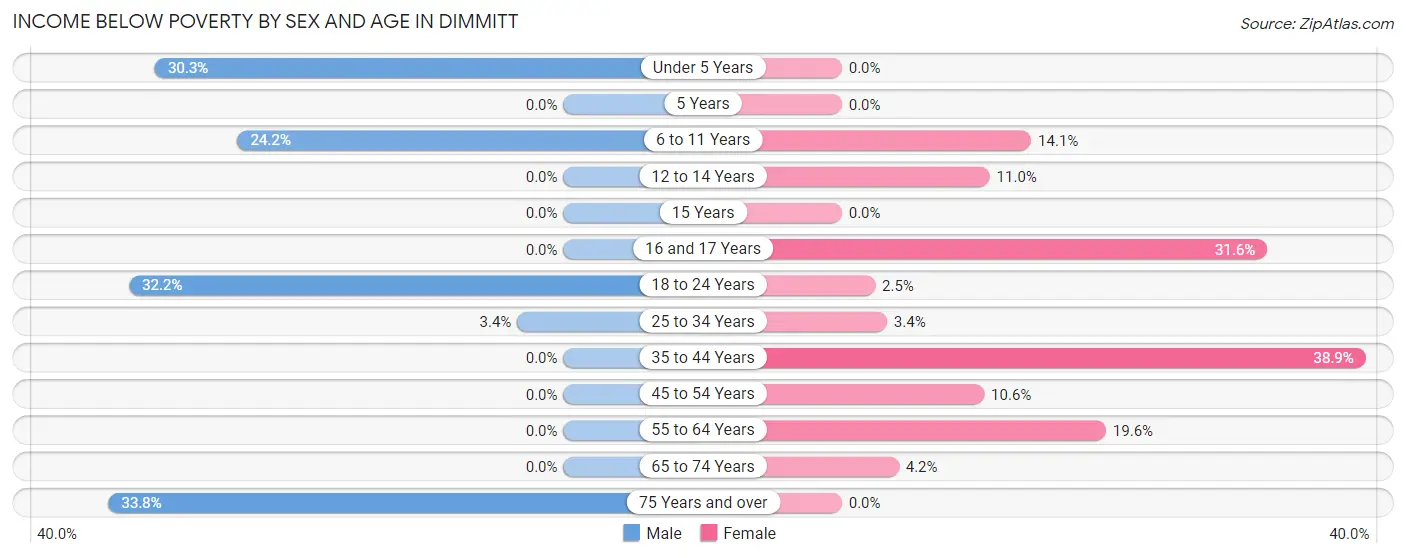
| Age Bracket | Male | Female |
| Under 5 Years | 57 (30.3%) | 0 (0.0%) |
| 5 Years | 0 (0.0%) | 0 (0.0%) |
| 6 to 11 Years | 75 (24.2%) | 27 (14.1%) |
| 12 to 14 Years | 0 (0.0%) | 9 (11.0%) |
| 15 Years | 0 (0.0%) | 0 (0.0%) |
| 16 and 17 Years | 0 (0.0%) | 12 (31.6%) |
| 18 to 24 Years | 79 (32.2%) | 7 (2.5%) |
| 25 to 34 Years | 11 (3.4%) | 7 (3.4%) |
| 35 to 44 Years | 0 (0.0%) | 84 (38.9%) |
| 45 to 54 Years | 0 (0.0%) | 24 (10.6%) |
| 55 to 64 Years | 0 (0.0%) | 40 (19.6%) |
| 65 to 74 Years | 0 (0.0%) | 9 (4.2%) |
| 75 Years and over | 25 (33.8%) | 0 (0.0%) |
| Total | 247 (11.9%) | 219 (10.8%) |
Income Above Poverty by Sex and Age in Dimmitt
According to the poverty statistics in Dimmitt, males aged 12 to 14 years and females aged under 5 years are the age groups that are most secure financially, with 100.0% of males and 100.0% of females in these age groups living above the poverty line.
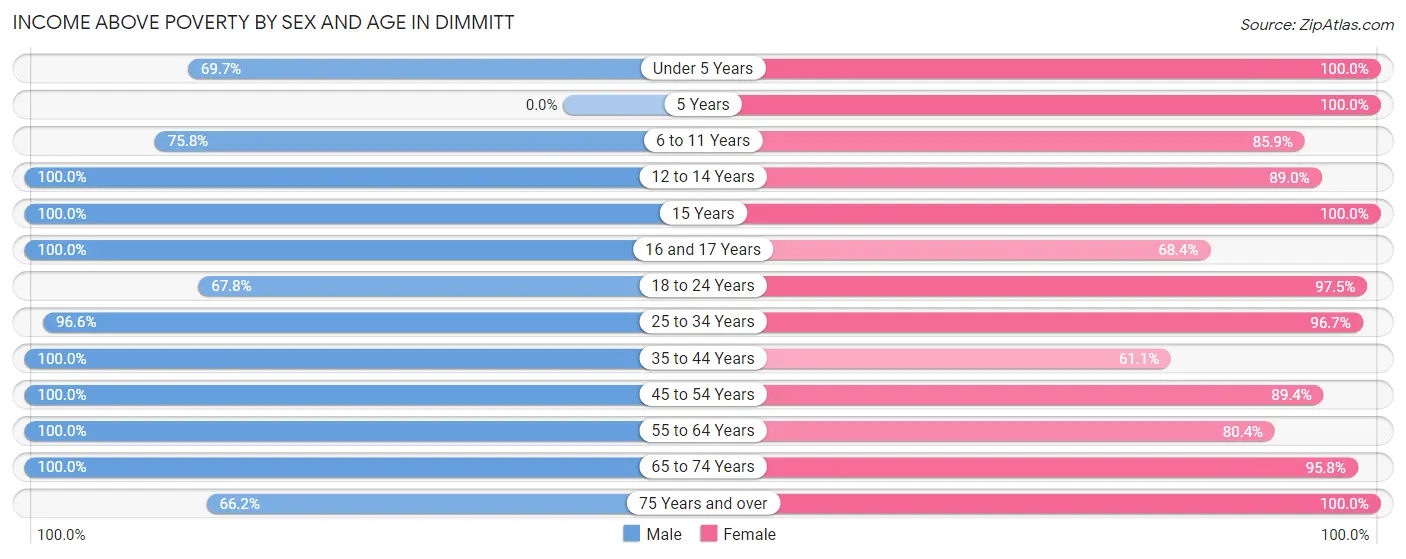
| Age Bracket | Male | Female |
| Under 5 Years | 131 (69.7%) | 126 (100.0%) |
| 5 Years | 0 (0.0%) | 49 (100.0%) |
| 6 to 11 Years | 235 (75.8%) | 165 (85.9%) |
| 12 to 14 Years | 40 (100.0%) | 73 (89.0%) |
| 15 Years | 63 (100.0%) | 73 (100.0%) |
| 16 and 17 Years | 32 (100.0%) | 26 (68.4%) |
| 18 to 24 Years | 166 (67.8%) | 276 (97.5%) |
| 25 to 34 Years | 310 (96.6%) | 202 (96.7%) |
| 35 to 44 Years | 173 (100.0%) | 132 (61.1%) |
| 45 to 54 Years | 173 (100.0%) | 203 (89.4%) |
| 55 to 64 Years | 207 (100.0%) | 164 (80.4%) |
| 65 to 74 Years | 255 (100.0%) | 204 (95.8%) |
| 75 Years and over | 49 (66.2%) | 123 (100.0%) |
| Total | 1,834 (88.1%) | 1,816 (89.2%) |
Income Below Poverty Among Married-Couple Families in Dimmitt
The poverty statistics for married-couple families in Dimmitt show that 1.0% or 7 of the total 695 families live below the poverty line. Families with no children have the highest poverty rate of 1.9%, comprising of 7 families. On the other hand, families with 1 or 2 children have the lowest poverty rate of 0.0%, which includes 0 families.
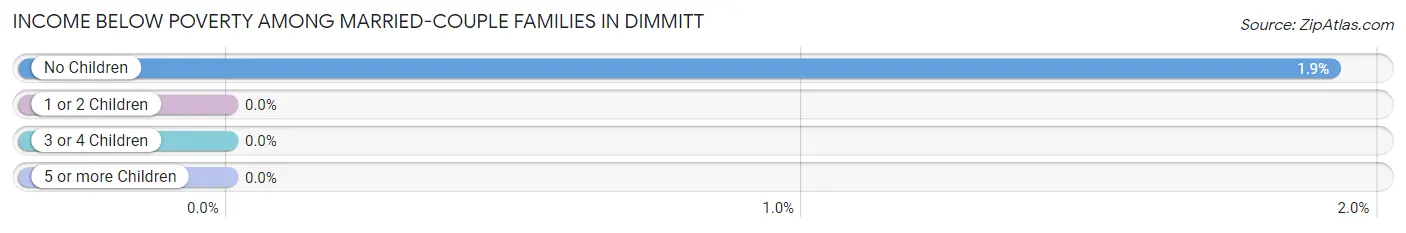
| Children | Above Poverty | Below Poverty |
| No Children | 358 (98.1%) | 7 (1.9%) |
| 1 or 2 Children | 256 (100.0%) | 0 (0.0%) |
| 3 or 4 Children | 74 (100.0%) | 0 (0.0%) |
| 5 or more Children | 0 (0.0%) | 0 (0.0%) |
| Total | 688 (99.0%) | 7 (1.0%) |
Income Below Poverty Among Single-Parent Households in Dimmitt
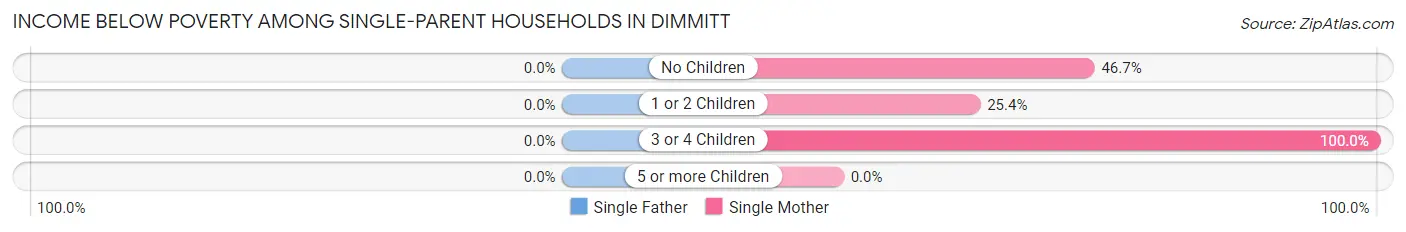
| Children | Single Father | Single Mother |
| No Children | 0 (0.0%) | 64 (46.7%) |
| 1 or 2 Children | 0 (0.0%) | 29 (25.4%) |
| 3 or 4 Children | 0 (0.0%) | 62 (100.0%) |
| 5 or more Children | 0 (0.0%) | 0 (0.0%) |
| Total | 0 (0.0%) | 155 (49.5%) |
Income Below Poverty Among Married-Couple vs Single-Parent Households in Dimmitt
The poverty data for Dimmitt shows that 7 of the married-couple family households (1.0%) and 155 of the single-parent households (44.7%) are living below the poverty level. Within the married-couple family households, those with no children have the highest poverty rate, with 7 households (1.9%) falling below the poverty line. Among the single-parent households, those with 3 or 4 children have the highest poverty rate, with 62 household (100.0%) living below poverty.
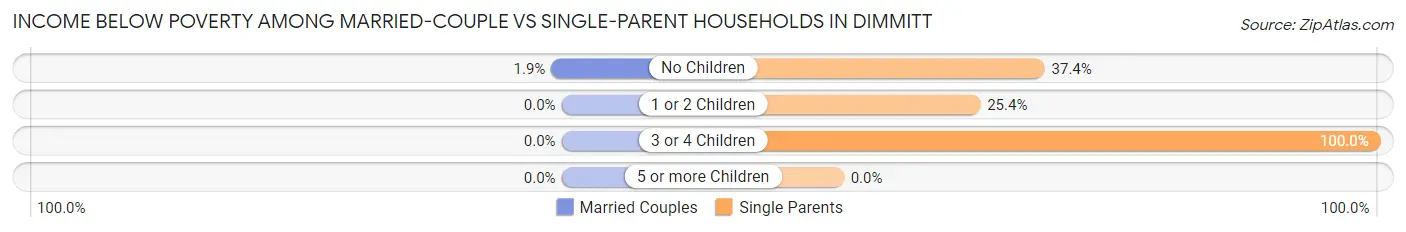
| Children | Married-Couple Families | Single-Parent Households |
| No Children | 7 (1.9%) | 64 (37.4%) |
| 1 or 2 Children | 0 (0.0%) | 29 (25.4%) |
| 3 or 4 Children | 0 (0.0%) | 62 (100.0%) |
| 5 or more Children | 0 (0.0%) | 0 (0.0%) |
| Total | 7 (1.0%) | 155 (44.7%) |
Race in Dimmitt
The most populous races in Dimmitt are Hispanic or Latino (3,146 | 75.5%), White / Caucasian (2,620 | 62.8%), and Two or more Races (1,075 | 25.8%).
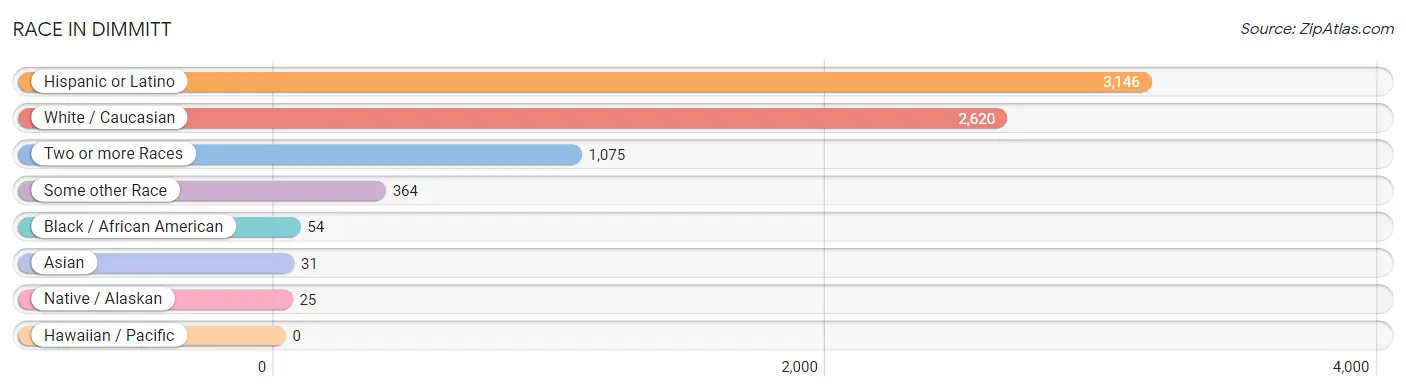
| Race | # Population | % Population |
| Asian | 31 | 0.7% |
| Black / African American | 54 | 1.3% |
| Hawaiian / Pacific | 0 | 0.0% |
| Hispanic or Latino | 3,146 | 75.5% |
| Native / Alaskan | 25 | 0.6% |
| White / Caucasian | 2,620 | 62.8% |
| Two or more Races | 1,075 | 25.8% |
| Some other Race | 364 | 8.7% |
| Total | 4,169 | 100.0% |
Ancestry in Dimmitt
The most populous ancestries reported in Dimmitt are Mexican (2,667 | 64.0%), Spaniard (422 | 10.1%), German (270 | 6.5%), American (178 | 4.3%), and English (113 | 2.7%), together accounting for 87.5% of all Dimmitt residents.
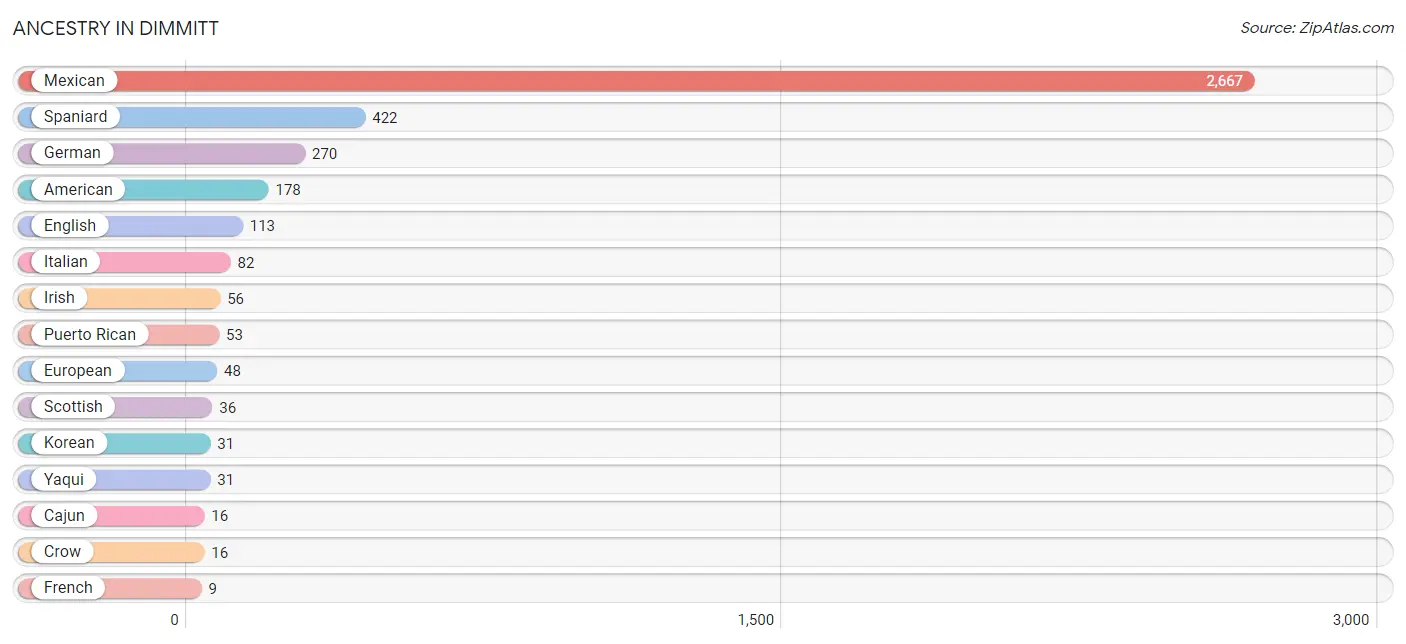
| Ancestry | # Population | % Population |
| African | 3 | 0.1% |
| American | 178 | 4.3% |
| Cajun | 16 | 0.4% |
| Choctaw | 4 | 0.1% |
| Crow | 16 | 0.4% |
| English | 113 | 2.7% |
| European | 48 | 1.1% |
| French | 9 | 0.2% |
| French American Indian | 5 | 0.1% |
| German | 270 | 6.5% |
| Irish | 56 | 1.3% |
| Italian | 82 | 2.0% |
| Korean | 31 | 0.7% |
| Mexican | 2,667 | 64.0% |
| Puerto Rican | 53 | 1.3% |
| Scottish | 36 | 0.9% |
| Spaniard | 422 | 10.1% |
| Subsaharan African | 3 | 0.1% |
| Yaqui | 31 | 0.7% | View All 19 Rows |
Immigrants in Dimmitt
The most numerous immigrant groups reported in Dimmitt came from Latin America (587 | 14.1%), Central America (571 | 13.7%), Mexico (571 | 13.7%), Asia (31 | 0.7%), and Philippines (31 | 0.7%), together accounting for 43.0% of all Dimmitt residents.
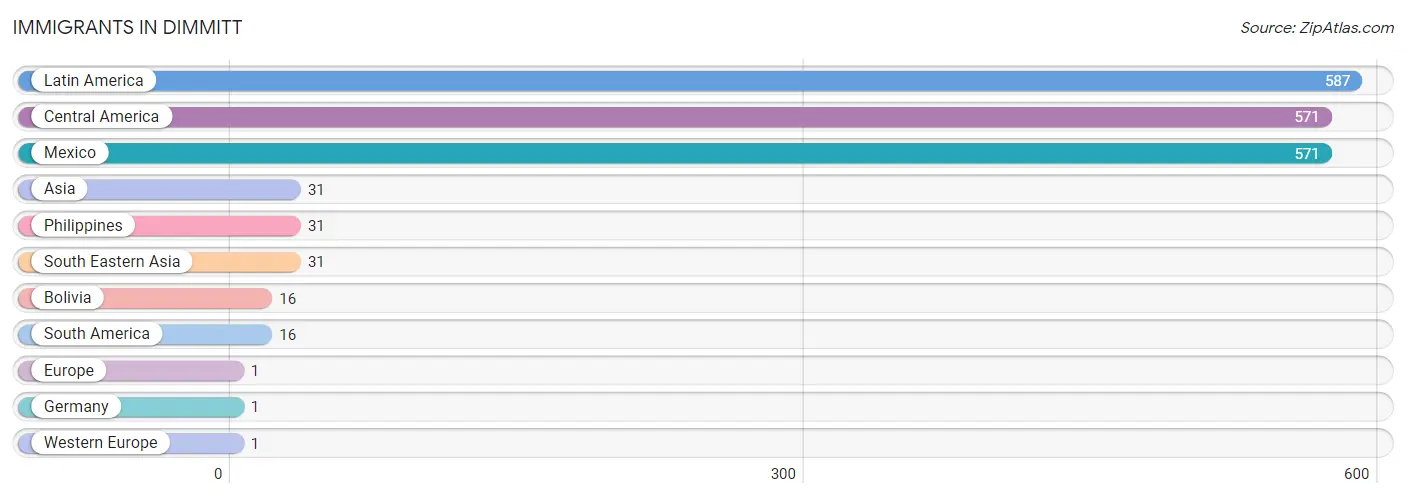
| Immigration Origin | # Population | % Population |
| Asia | 31 | 0.7% |
| Bolivia | 16 | 0.4% |
| Central America | 571 | 13.7% |
| Europe | 1 | 0.0% |
| Germany | 1 | 0.0% |
| Latin America | 587 | 14.1% |
| Mexico | 571 | 13.7% |
| Philippines | 31 | 0.7% |
| South America | 16 | 0.4% |
| South Eastern Asia | 31 | 0.7% |
| Western Europe | 1 | 0.0% | View All 11 Rows |
Sex and Age in Dimmitt
Sex and Age in Dimmitt
The most populous age groups in Dimmitt are 15 to 19 Years (242 | 11.5%) for men and 15 to 19 Years (211 | 10.2%) for women.
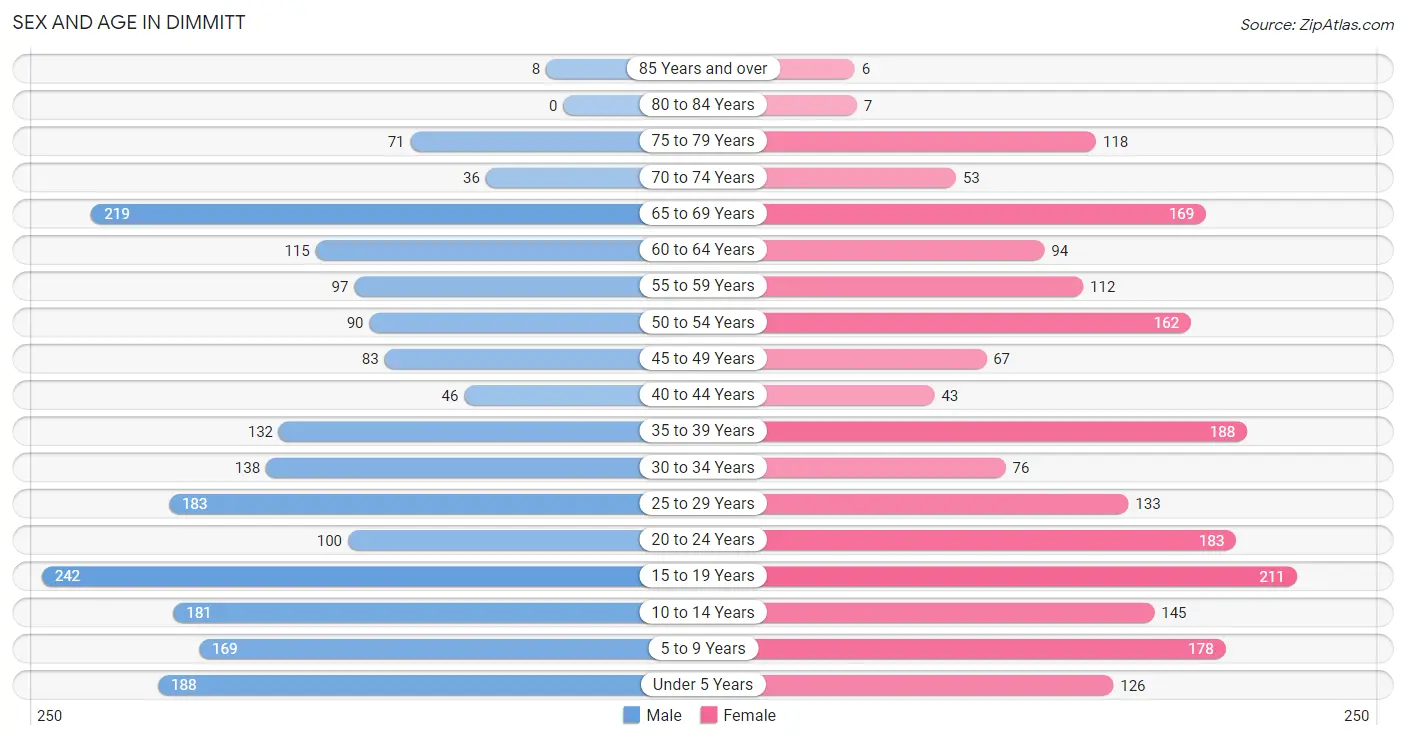
| Age Bracket | Male | Female |
| Under 5 Years | 188 (9.0%) | 126 (6.1%) |
| 5 to 9 Years | 169 (8.1%) | 178 (8.6%) |
| 10 to 14 Years | 181 (8.6%) | 145 (7.0%) |
| 15 to 19 Years | 242 (11.5%) | 211 (10.2%) |
| 20 to 24 Years | 100 (4.8%) | 183 (8.8%) |
| 25 to 29 Years | 183 (8.7%) | 133 (6.4%) |
| 30 to 34 Years | 138 (6.6%) | 76 (3.7%) |
| 35 to 39 Years | 132 (6.3%) | 188 (9.1%) |
| 40 to 44 Years | 46 (2.2%) | 43 (2.1%) |
| 45 to 49 Years | 83 (4.0%) | 67 (3.2%) |
| 50 to 54 Years | 90 (4.3%) | 162 (7.8%) |
| 55 to 59 Years | 97 (4.6%) | 112 (5.4%) |
| 60 to 64 Years | 115 (5.5%) | 94 (4.5%) |
| 65 to 69 Years | 219 (10.4%) | 169 (8.2%) |
| 70 to 74 Years | 36 (1.7%) | 53 (2.6%) |
| 75 to 79 Years | 71 (3.4%) | 118 (5.7%) |
| 80 to 84 Years | 0 (0.0%) | 7 (0.3%) |
| 85 Years and over | 8 (0.4%) | 6 (0.3%) |
| Total | 2,098 (100.0%) | 2,071 (100.0%) |
Families and Households in Dimmitt
Median Family Size in Dimmitt
The median family size in Dimmitt is 3.67 persons per family, with married-couple families (695 | 66.7%) accounting for the largest median family size of 3.85 persons per family. On the other hand, single female/mother families (313 | 30.0%) represent the smallest median family size with 3.25 persons per family.
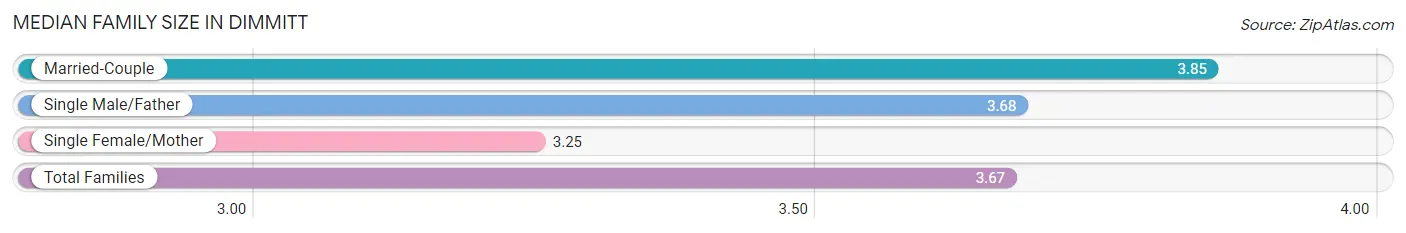
| Family Type | # Families | Family Size |
| Married-Couple | 695 (66.7%) | 3.85 |
| Single Male/Father | 34 (3.3%) | 3.68 |
| Single Female/Mother | 313 (30.0%) | 3.25 |
| Total Families | 1,042 (100.0%) | 3.67 |
Median Household Size in Dimmitt
The median household size in Dimmitt is 3.15 persons per household, with married-couple households (695 | 53.3%) accounting for the largest median household size of 3.85 persons per household. non-family households (263 | 20.2%) represent the smallest median household size with 1.06 persons per household.
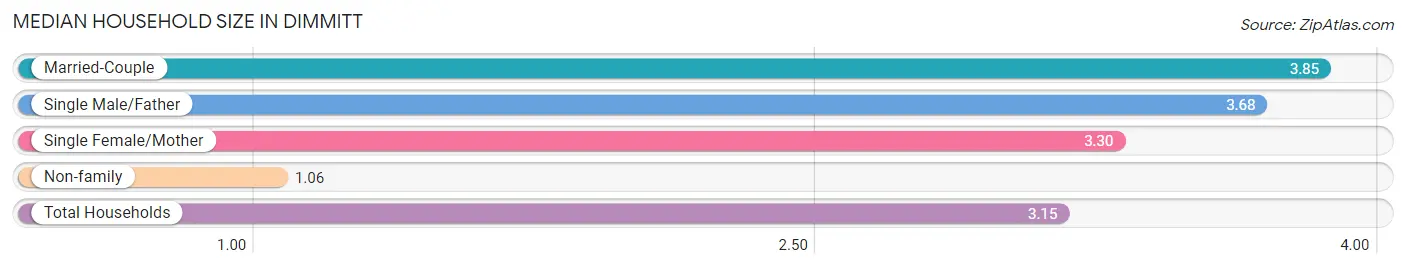
| Household Type | # Households | Household Size |
| Married-Couple | 695 (53.3%) | 3.85 |
| Single Male/Father | 34 (2.6%) | 3.68 |
| Single Female/Mother | 313 (24.0%) | 3.30 |
| Non-family | 263 (20.2%) | 1.06 |
| Total Households | 1,305 (100.0%) | 3.15 |
Household Size by Marriage Status in Dimmitt
Out of a total of 1,305 households in Dimmitt, 1,042 (79.8%) are family households, while 263 (20.2%) are nonfamily households. The most numerous type of family households are 2-person households, comprising 426, and the most common type of nonfamily households are 1-person households, comprising 250.
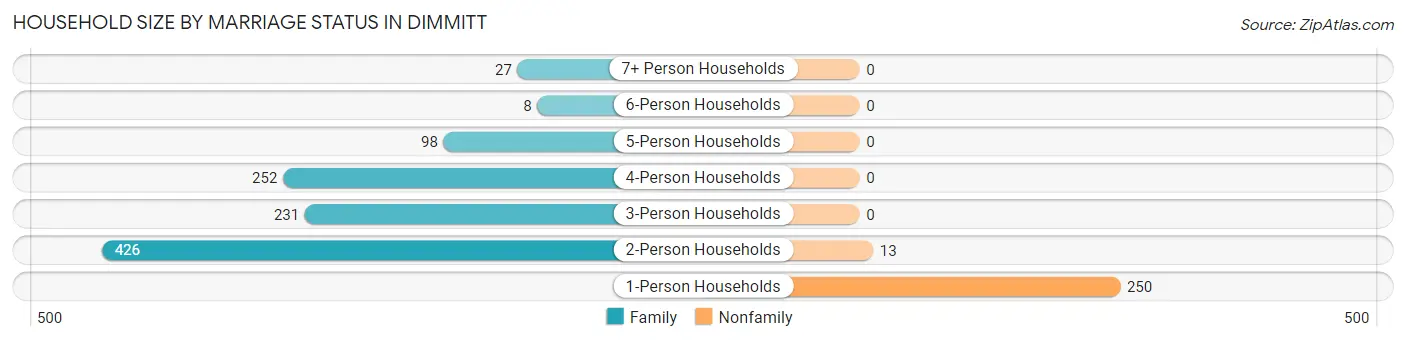
| Household Size | Family Households | Nonfamily Households |
| 1-Person Households | - | 250 (19.2%) |
| 2-Person Households | 426 (32.6%) | 13 (1.0%) |
| 3-Person Households | 231 (17.7%) | 0 (0.0%) |
| 4-Person Households | 252 (19.3%) | 0 (0.0%) |
| 5-Person Households | 98 (7.5%) | 0 (0.0%) |
| 6-Person Households | 8 (0.6%) | 0 (0.0%) |
| 7+ Person Households | 27 (2.1%) | 0 (0.0%) |
| Total | 1,042 (79.8%) | 263 (20.2%) |
Female Fertility in Dimmitt
Fertility by Age in Dimmitt
Average fertility rate in Dimmitt is 41.0 births per 1,000 women. Women in the age bracket of 20 to 34 years have the highest fertility rate with 105.0 births per 1,000 women. Women in the age bracket of 20 to 34 years acount for 100.0% of all women with births.
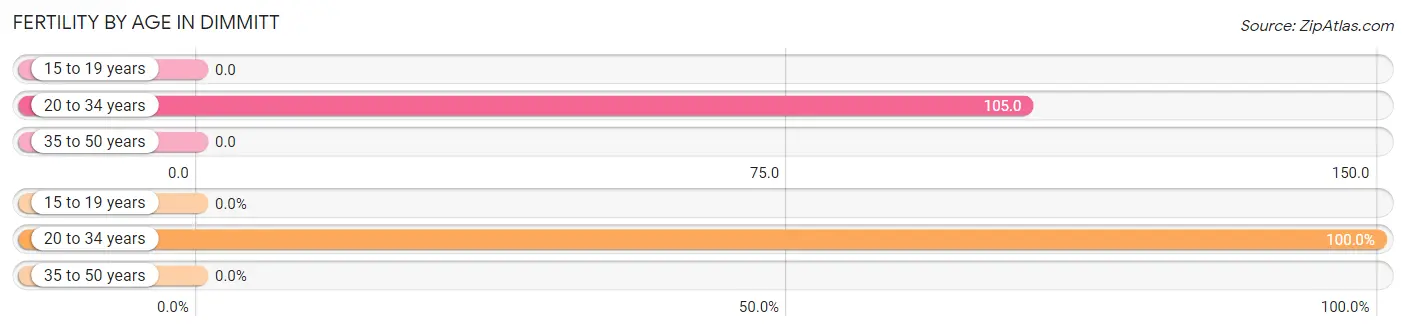
| Age Bracket | Women with Births | Births / 1,000 Women |
| 15 to 19 years | 0 (0.0%) | 0.0 |
| 20 to 34 years | 41 (100.0%) | 105.0 |
| 35 to 50 years | 0 (0.0%) | 0.0 |
| Total | 41 (100.0%) | 41.0 |
Fertility by Age by Marriage Status in Dimmitt
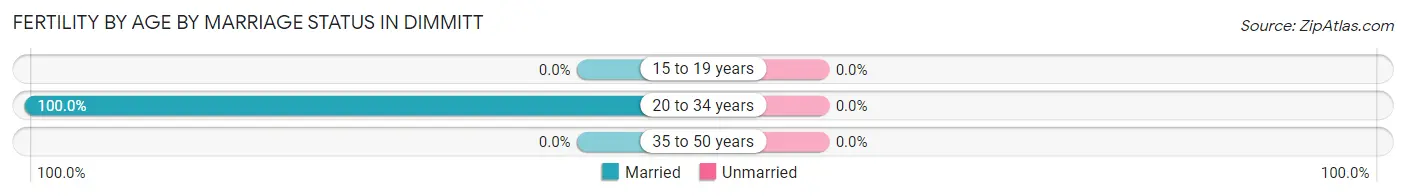
| Age Bracket | Married | Unmarried |
| 15 to 19 years | 0 (0.0%) | 0 (0.0%) |
| 20 to 34 years | 41 (100.0%) | 0 (0.0%) |
| 35 to 50 years | 0 (0.0%) | 0 (0.0%) |
| Total | 41 (100.0%) | 0 (0.0%) |
Fertility by Education in Dimmitt
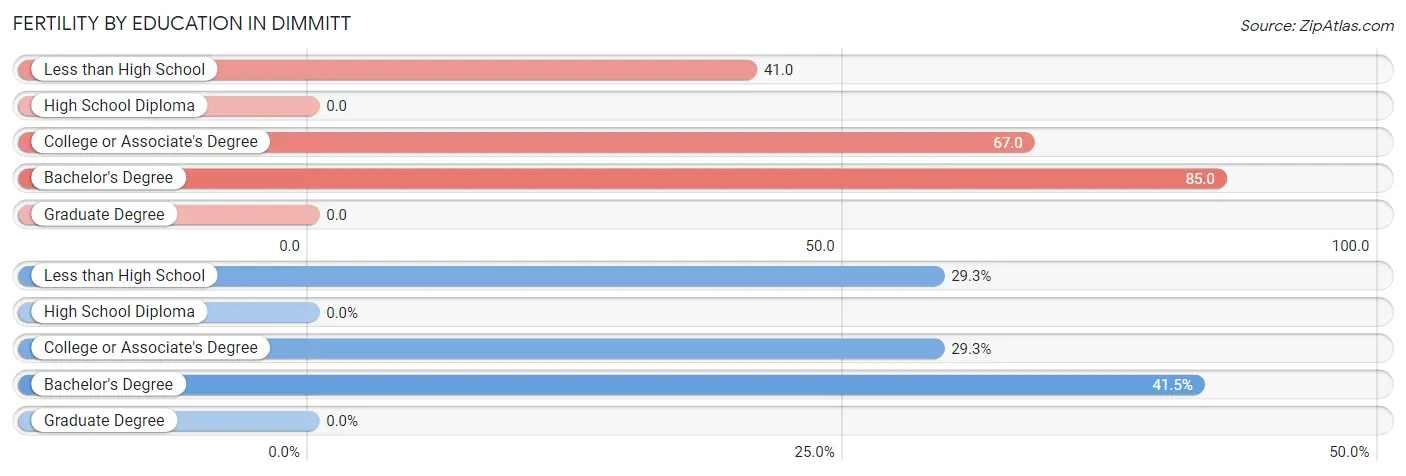
| Educational Attainment | Women with Births | Births / 1,000 Women |
| Less than High School | 12 (29.3%) | 41.0 |
| High School Diploma | 0 (0.0%) | 0.0 |
| College or Associate's Degree | 12 (29.3%) | 67.0 |
| Bachelor's Degree | 17 (41.5%) | 85.0 |
| Graduate Degree | 0 (0.0%) | 0.0 |
| Total | 41 (100.0%) | 41.0 |
Fertility by Education by Marriage Status in Dimmitt
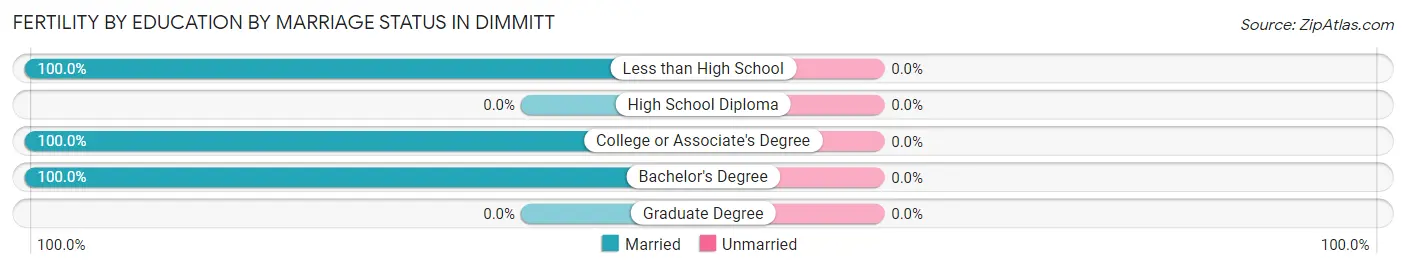
| Educational Attainment | Married | Unmarried |
| Less than High School | 12 (100.0%) | 0 (0.0%) |
| High School Diploma | 0 (0.0%) | 0 (0.0%) |
| College or Associate's Degree | 12 (100.0%) | 0 (0.0%) |
| Bachelor's Degree | 17 (100.0%) | 0 (0.0%) |
| Graduate Degree | 0 (0.0%) | 0 (0.0%) |
| Total | 41 (100.0%) | 0 (0.0%) |
Employment Characteristics in Dimmitt
Employment by Class of Employer in Dimmitt
Among the 2,053 employed individuals in Dimmitt, private company employees (1,533 | 74.7%), state government employees (177 | 8.6%), and local government employees (166 | 8.1%) make up the most common classes of employment.
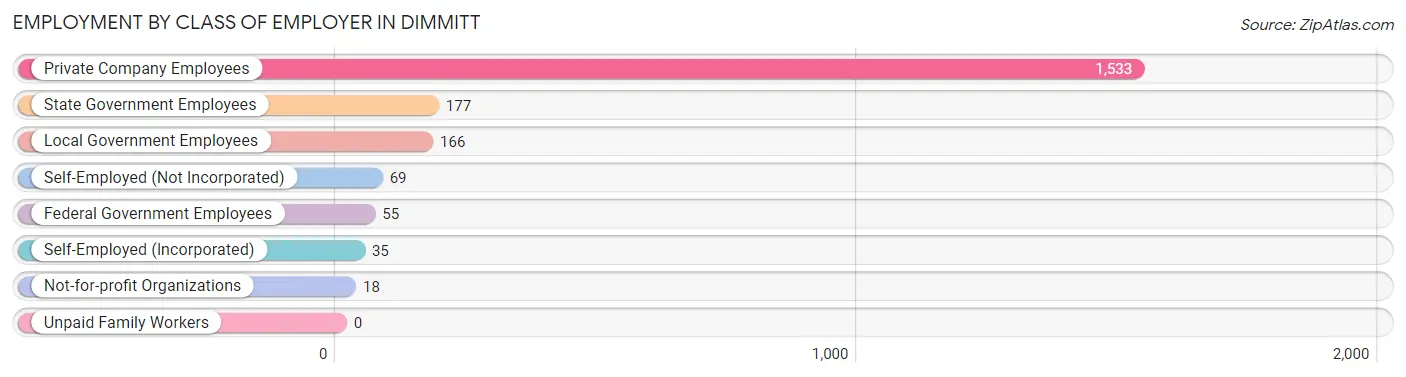
| Employer Class | # Employees | % Employees |
| Private Company Employees | 1,533 | 74.7% |
| Self-Employed (Incorporated) | 35 | 1.7% |
| Self-Employed (Not Incorporated) | 69 | 3.4% |
| Not-for-profit Organizations | 18 | 0.9% |
| Local Government Employees | 166 | 8.1% |
| State Government Employees | 177 | 8.6% |
| Federal Government Employees | 55 | 2.7% |
| Unpaid Family Workers | 0 | 0.0% |
| Total | 2,053 | 100.0% |
Employment Status by Age in Dimmitt
According to the labor force statistics for Dimmitt, out of the total population over 16 years of age (3,046), 71.8% or 2,187 individuals are in the labor force, with 2.9% or 63 of them unemployed. The age group with the highest labor force participation rate is 25 to 29 years, with 94.0% or 297 individuals in the labor force. Within the labor force, the 35 to 44 years age range has the highest percentage of unemployed individuals, with 15.8% or 55 of them being unemployed.
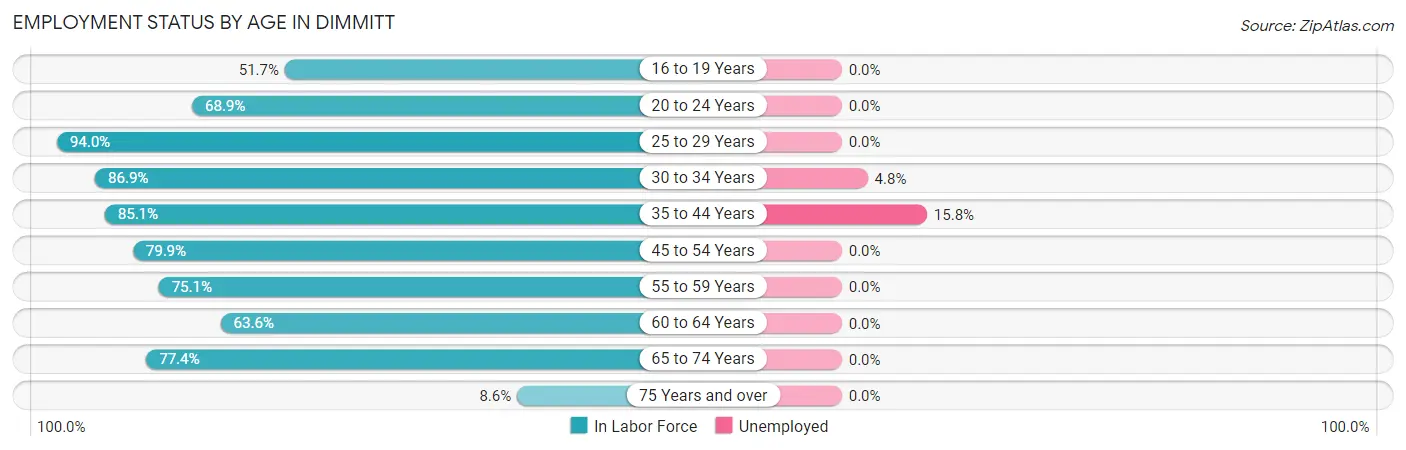
| Age Bracket | In Labor Force | Unemployed |
| 16 to 19 Years | 164 (51.7%) | 0 (0.0%) |
| 20 to 24 Years | 195 (68.9%) | 0 (0.0%) |
| 25 to 29 Years | 297 (94.0%) | 0 (0.0%) |
| 30 to 34 Years | 186 (86.9%) | 9 (4.8%) |
| 35 to 44 Years | 348 (85.1%) | 55 (15.8%) |
| 45 to 54 Years | 321 (79.9%) | 0 (0.0%) |
| 55 to 59 Years | 157 (75.1%) | 0 (0.0%) |
| 60 to 64 Years | 133 (63.6%) | 0 (0.0%) |
| 65 to 74 Years | 369 (77.4%) | 0 (0.0%) |
| 75 Years and over | 18 (8.6%) | 0 (0.0%) |
| Total | 2,187 (71.8%) | 63 (2.9%) |
Employment Status by Educational Attainment in Dimmitt
According to labor force statistics for Dimmitt, 82.0% of individuals (1,442) out of the total population between 25 and 64 years of age (1,759) are in the labor force, with 4.4% or 63 of them being unemployed. The group with the highest labor force participation rate are those with the educational attainment of high school diploma, with 89.5% or 616 individuals in the labor force. Within the labor force, individuals with bachelor's degree or higher education have the highest percentage of unemployment, with 13.7% or 55 of them being unemployed.
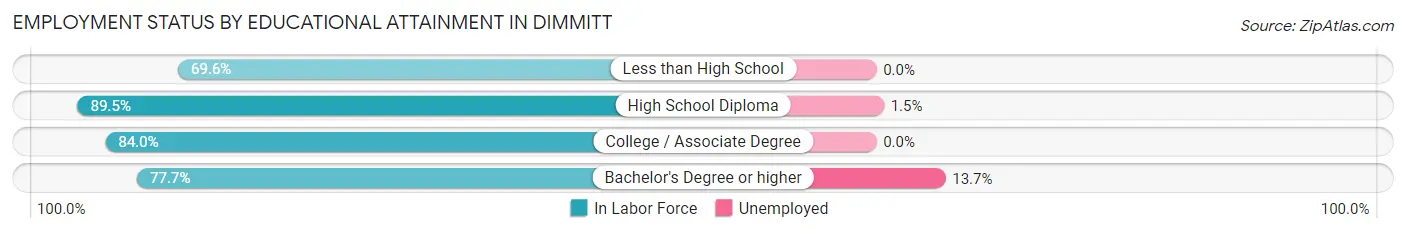
| Educational Attainment | In Labor Force | Unemployed |
| Less than High School | 199 (69.6%) | 0 (0.0%) |
| High School Diploma | 616 (89.5%) | 10 (1.5%) |
| College / Associate Degree | 226 (84.0%) | 0 (0.0%) |
| Bachelor's Degree or higher | 401 (77.7%) | 71 (13.7%) |
| Total | 1,442 (82.0%) | 77 (4.4%) |
Employment Occupations by Sex in Dimmitt
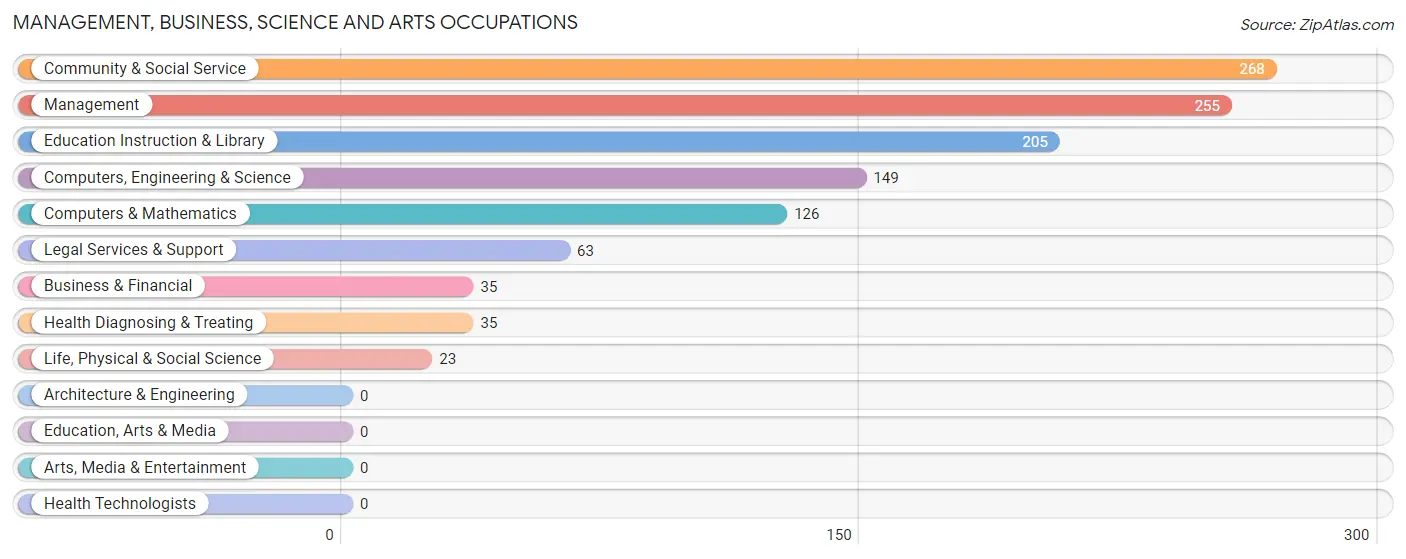
Management, Business, Science and Arts Occupations
The most common Management, Business, Science and Arts occupations in Dimmitt are Community & Social Service (268 | 12.6%), Management (255 | 12.0%), Education Instruction & Library (205 | 9.7%), Computers, Engineering & Science (149 | 7.0%), and Computers & Mathematics (126 | 5.9%).
Management, Business, Science and Arts Occupations by Sex
Within the Management, Business, Science and Arts occupations in Dimmitt, the most male-oriented occupations are Life, Physical & Social Science (100.0%), Computers, Engineering & Science (80.5%), and Computers & Mathematics (77.0%), while the most female-oriented occupations are Business & Financial (100.0%), Legal Services & Support (100.0%), and Health Diagnosing & Treating (100.0%).
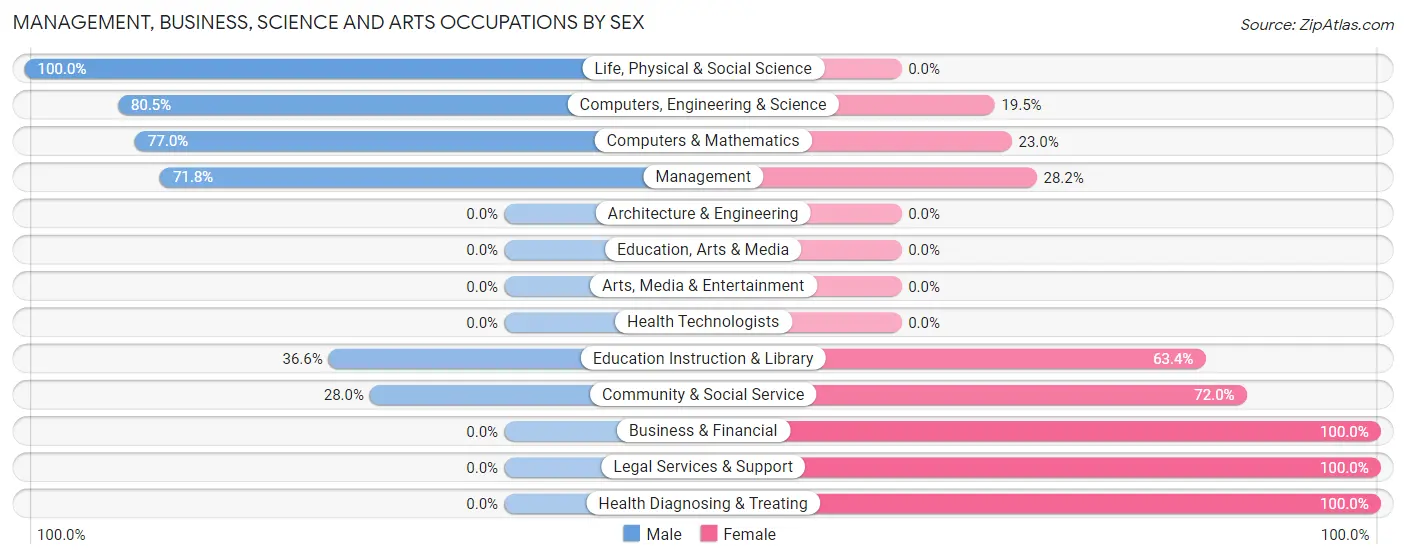
| Occupation | Male | Female |
| Management | 183 (71.8%) | 72 (28.2%) |
| Business & Financial | 0 (0.0%) | 35 (100.0%) |
| Computers, Engineering & Science | 120 (80.5%) | 29 (19.5%) |
| Computers & Mathematics | 97 (77.0%) | 29 (23.0%) |
| Architecture & Engineering | 0 (0.0%) | 0 (0.0%) |
| Life, Physical & Social Science | 23 (100.0%) | 0 (0.0%) |
| Community & Social Service | 75 (28.0%) | 193 (72.0%) |
| Education, Arts & Media | 0 (0.0%) | 0 (0.0%) |
| Legal Services & Support | 0 (0.0%) | 63 (100.0%) |
| Education Instruction & Library | 75 (36.6%) | 130 (63.4%) |
| Arts, Media & Entertainment | 0 (0.0%) | 0 (0.0%) |
| Health Diagnosing & Treating | 0 (0.0%) | 35 (100.0%) |
| Health Technologists | 0 (0.0%) | 0 (0.0%) |
| Total (Category) | 378 (50.9%) | 364 (49.1%) |
| Total (Overall) | 1,235 (58.2%) | 889 (41.8%) |
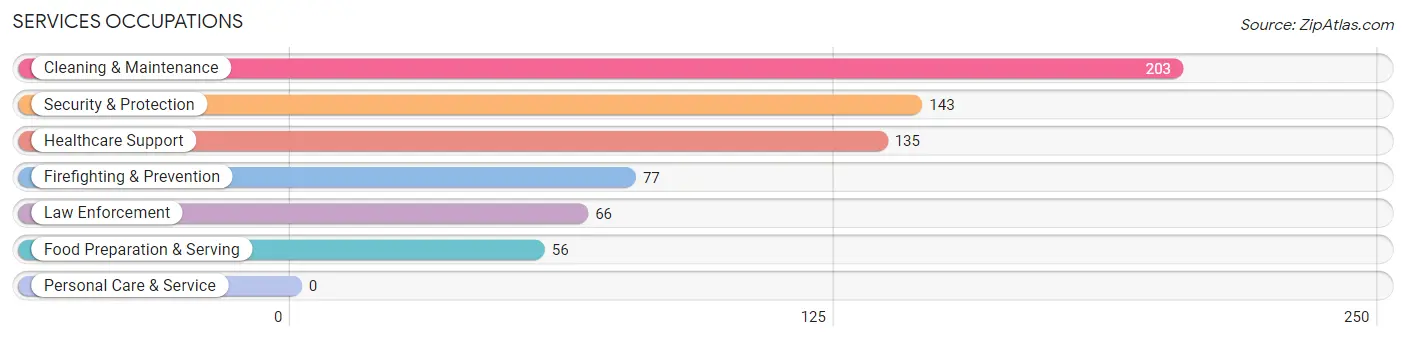
Services Occupations
The most common Services occupations in Dimmitt are Cleaning & Maintenance (203 | 9.6%), Security & Protection (143 | 6.7%), Healthcare Support (135 | 6.4%), Firefighting & Prevention (77 | 3.6%), and Law Enforcement (66 | 3.1%).
Services Occupations by Sex
Within the Services occupations in Dimmitt, the most male-oriented occupations are Firefighting & Prevention (100.0%), Cleaning & Maintenance (85.7%), and Security & Protection (74.1%), while the most female-oriented occupations are Healthcare Support (100.0%), Law Enforcement (56.1%), and Food Preparation & Serving (32.1%).
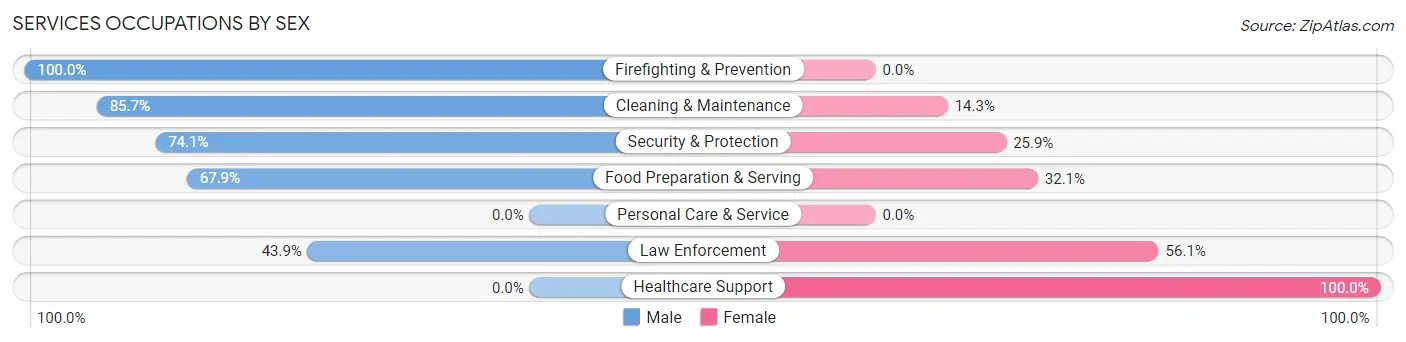
| Occupation | Male | Female |
| Healthcare Support | 0 (0.0%) | 135 (100.0%) |
| Security & Protection | 106 (74.1%) | 37 (25.9%) |
| Firefighting & Prevention | 77 (100.0%) | 0 (0.0%) |
| Law Enforcement | 29 (43.9%) | 37 (56.1%) |
| Food Preparation & Serving | 38 (67.9%) | 18 (32.1%) |
| Cleaning & Maintenance | 174 (85.7%) | 29 (14.3%) |
| Personal Care & Service | 0 (0.0%) | 0 (0.0%) |
| Total (Category) | 318 (59.2%) | 219 (40.8%) |
| Total (Overall) | 1,235 (58.2%) | 889 (41.8%) |
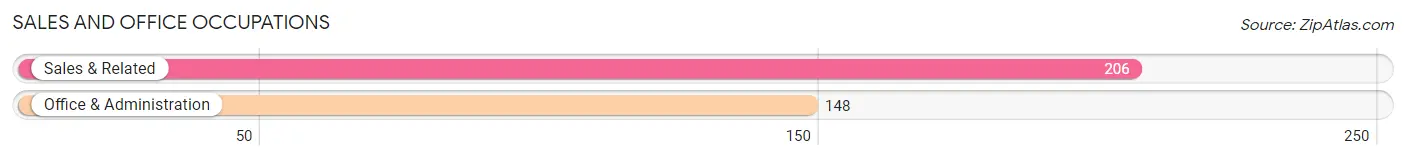
Sales and Office Occupations
The most common Sales and Office occupations in Dimmitt are Sales & Related (206 | 9.7%), and Office & Administration (148 | 7.0%).
Sales and Office Occupations by Sex
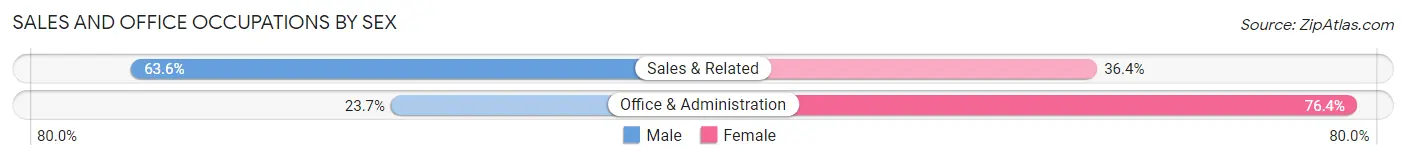
| Occupation | Male | Female |
| Sales & Related | 131 (63.6%) | 75 (36.4%) |
| Office & Administration | 35 (23.6%) | 113 (76.3%) |
| Total (Category) | 166 (46.9%) | 188 (53.1%) |
| Total (Overall) | 1,235 (58.2%) | 889 (41.8%) |
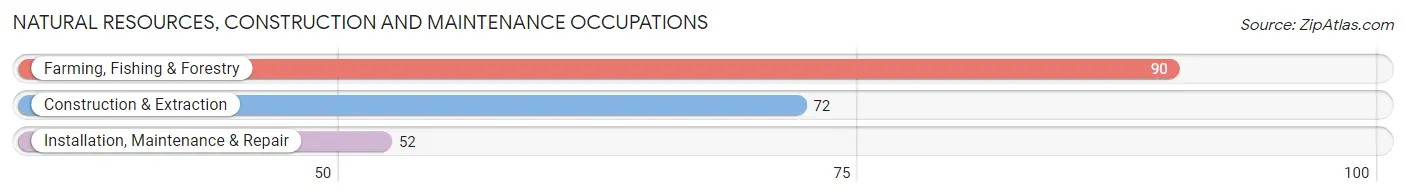
Natural Resources, Construction and Maintenance Occupations
The most common Natural Resources, Construction and Maintenance occupations in Dimmitt are Farming, Fishing & Forestry (90 | 4.2%), Construction & Extraction (72 | 3.4%), and Installation, Maintenance & Repair (52 | 2.5%).
Natural Resources, Construction and Maintenance Occupations by Sex
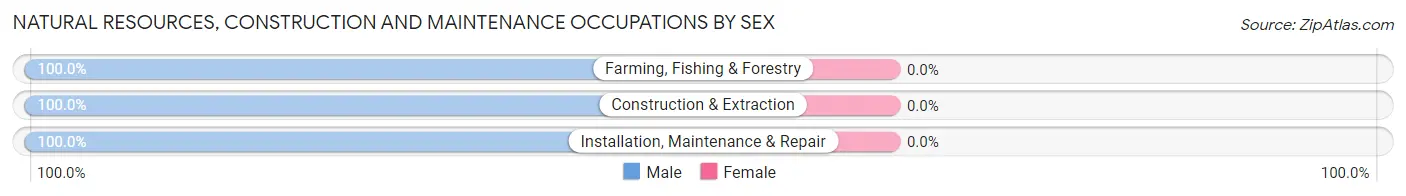
| Occupation | Male | Female |
| Farming, Fishing & Forestry | 90 (100.0%) | 0 (0.0%) |
| Construction & Extraction | 72 (100.0%) | 0 (0.0%) |
| Installation, Maintenance & Repair | 52 (100.0%) | 0 (0.0%) |
| Total (Category) | 214 (100.0%) | 0 (0.0%) |
| Total (Overall) | 1,235 (58.2%) | 889 (41.8%) |
Production, Transportation and Moving Occupations
The most common Production, Transportation and Moving occupations in Dimmitt are Production (180 | 8.5%), Material Moving (77 | 3.6%), and Transportation (20 | 0.9%).
Production, Transportation and Moving Occupations by Sex
| Occupation | Male | Female |
| Production | 70 (38.9%) | 110 (61.1%) |
| Transportation | 20 (100.0%) | 0 (0.0%) |
| Material Moving | 69 (89.6%) | 8 (10.4%) |
| Total (Category) | 159 (57.4%) | 118 (42.6%) |
| Total (Overall) | 1,235 (58.2%) | 889 (41.8%) |
Employment Industries by Sex in Dimmitt
Employment Industries in Dimmitt
The major employment industries in Dimmitt include Retail Trade (449 | 21.1%), Manufacturing (244 | 11.5%), Health Care & Social Assistance (214 | 10.1%), Educational Services (210 | 9.9%), and Agriculture, Fishing & Hunting (169 | 8.0%).
Employment Industries by Sex in Dimmitt
The Dimmitt industries that see more men than women are Construction (100.0%), Utilities (100.0%), and Real Estate, Rental & Leasing (100.0%), whereas the industries that tend to have a higher number of women are Finance & Insurance (100.0%), Health Care & Social Assistance (100.0%), and Professional & Scientific (81.8%).
| Industry | Male | Female |
| Agriculture, Fishing & Hunting | 161 (95.3%) | 8 (4.7%) |
| Mining, Quarrying, & Extraction | 0 (0.0%) | 0 (0.0%) |
| Construction | 137 (100.0%) | 0 (0.0%) |
| Manufacturing | 151 (61.9%) | 93 (38.1%) |
| Wholesale Trade | 88 (87.1%) | 13 (12.9%) |
| Retail Trade | 362 (80.6%) | 87 (19.4%) |
| Transportation & Warehousing | 8 (38.1%) | 13 (61.9%) |
| Utilities | 22 (100.0%) | 0 (0.0%) |
| Information | 0 (0.0%) | 0 (0.0%) |
| Finance & Insurance | 0 (0.0%) | 68 (100.0%) |
| Real Estate, Rental & Leasing | 6 (100.0%) | 0 (0.0%) |
| Professional & Scientific | 30 (18.2%) | 135 (81.8%) |
| Enterprise Management | 0 (0.0%) | 0 (0.0%) |
| Administrative & Support | 85 (73.3%) | 31 (26.7%) |
| Educational Services | 88 (41.9%) | 122 (58.1%) |
| Health Care & Social Assistance | 0 (0.0%) | 214 (100.0%) |
| Arts, Entertainment & Recreation | 0 (0.0%) | 0 (0.0%) |
| Accommodation & Food Services | 38 (46.3%) | 44 (53.7%) |
| Public Administration | 54 (54.0%) | 46 (46.0%) |
| Total | 1,235 (58.2%) | 889 (41.8%) |
Education in Dimmitt
School Enrollment in Dimmitt
The most common levels of schooling among the 1,243 students in Dimmitt are high school (376 | 30.2%), elementary school (324 | 26.1%), and middle school (305 | 24.5%).
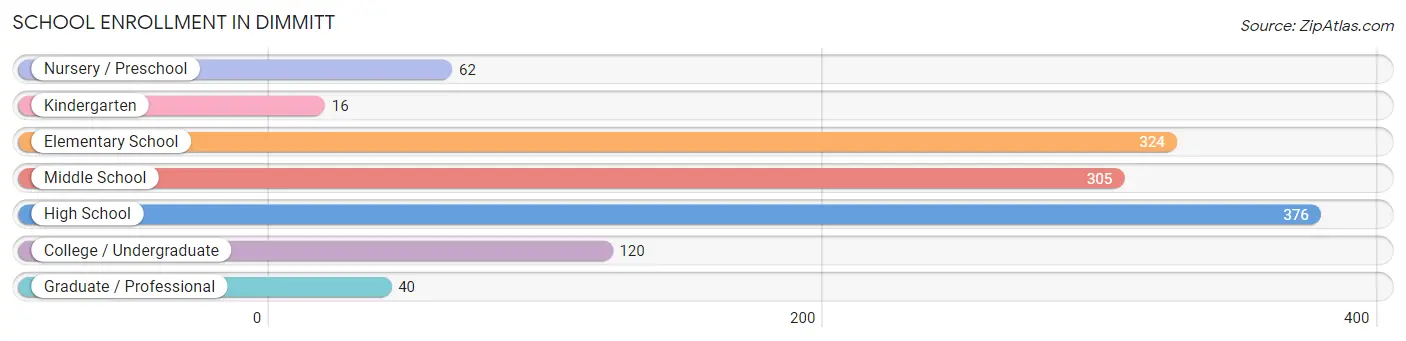
| School Level | # Students | % Students |
| Nursery / Preschool | 62 | 5.0% |
| Kindergarten | 16 | 1.3% |
| Elementary School | 324 | 26.1% |
| Middle School | 305 | 24.5% |
| High School | 376 | 30.2% |
| College / Undergraduate | 120 | 9.7% |
| Graduate / Professional | 40 | 3.2% |
| Total | 1,243 | 100.0% |
School Enrollment by Age by Funding Source in Dimmitt
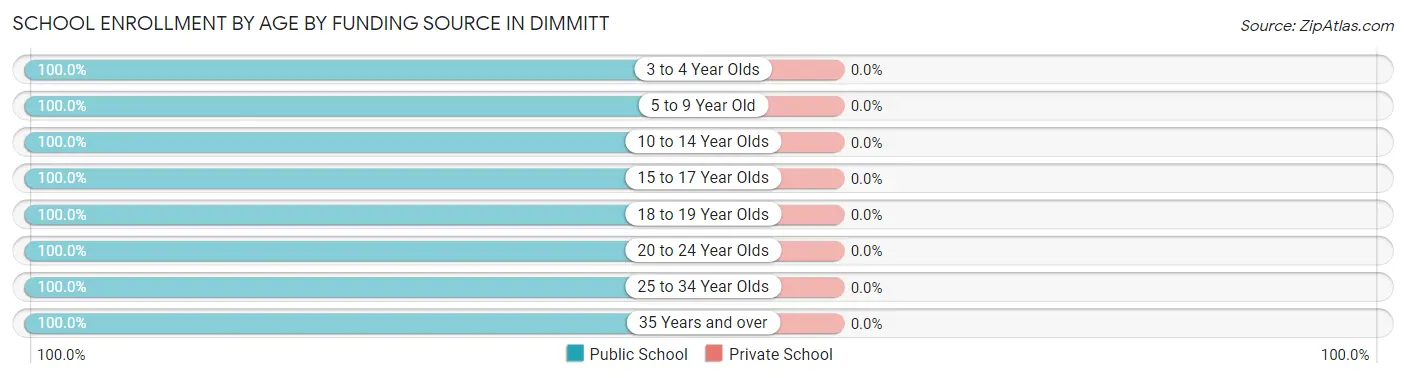
| Age Bracket | Public School | Private School |
| 3 to 4 Year Olds | 13 (100.0%) | 0 (0.0%) |
| 5 to 9 Year Old | 347 (100.0%) | 0 (0.0%) |
| 10 to 14 Year Olds | 326 (100.0%) | 0 (0.0%) |
| 15 to 17 Year Olds | 206 (100.0%) | 0 (0.0%) |
| 18 to 19 Year Olds | 168 (100.0%) | 0 (0.0%) |
| 20 to 24 Year Olds | 45 (100.0%) | 0 (0.0%) |
| 25 to 34 Year Olds | 102 (100.0%) | 0 (0.0%) |
| 35 Years and over | 36 (100.0%) | 0 (0.0%) |
| Total | 1,243 (100.0%) | 0 (0.0%) |
Educational Attainment by Field of Study in Dimmitt
Education (140 | 21.9%), psychology (119 | 18.6%), bio, nature & agricultural (106 | 16.6%), social sciences (63 | 9.9%), and arts & humanities (63 | 9.9%) are the most common fields of study among 638 individuals in Dimmitt who have obtained a bachelor's degree or higher.
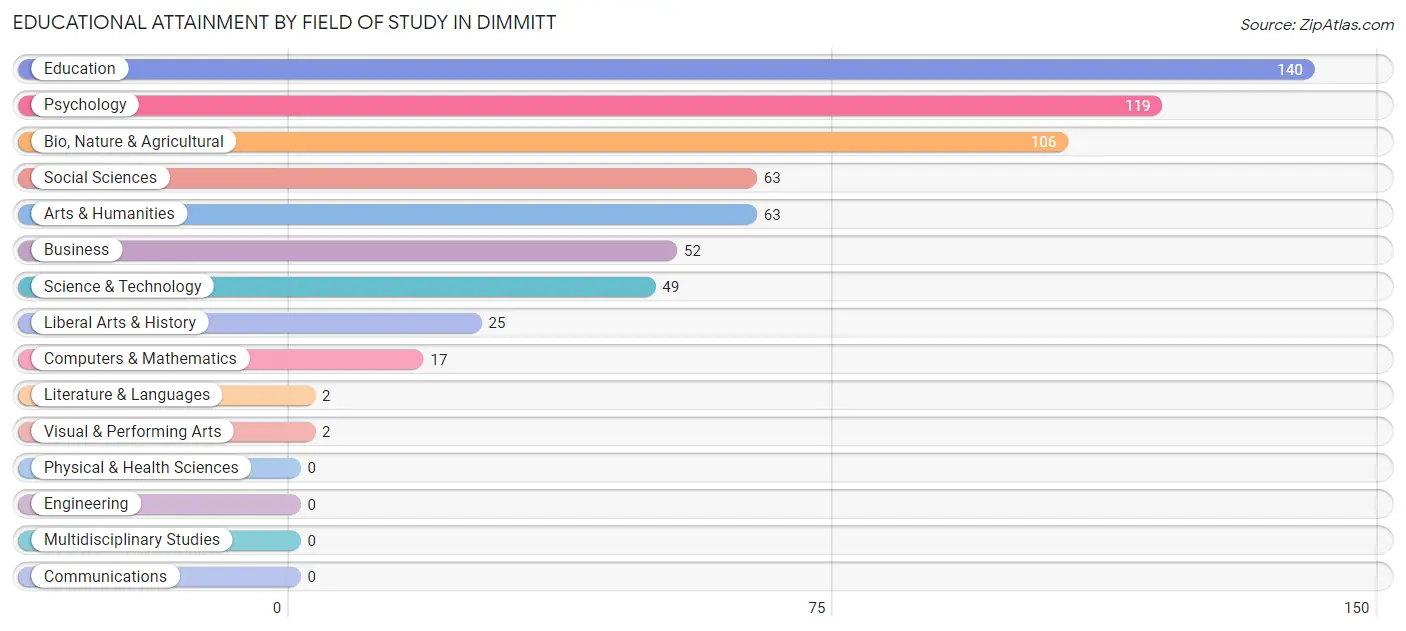
| Field of Study | # Graduates | % Graduates |
| Computers & Mathematics | 17 | 2.7% |
| Bio, Nature & Agricultural | 106 | 16.6% |
| Physical & Health Sciences | 0 | 0.0% |
| Psychology | 119 | 18.6% |
| Social Sciences | 63 | 9.9% |
| Engineering | 0 | 0.0% |
| Multidisciplinary Studies | 0 | 0.0% |
| Science & Technology | 49 | 7.7% |
| Business | 52 | 8.2% |
| Education | 140 | 21.9% |
| Literature & Languages | 2 | 0.3% |
| Liberal Arts & History | 25 | 3.9% |
| Visual & Performing Arts | 2 | 0.3% |
| Communications | 0 | 0.0% |
| Arts & Humanities | 63 | 9.9% |
| Total | 638 | 100.0% |
Transportation & Commute in Dimmitt
Vehicle Availability by Sex in Dimmitt
The most prevalent vehicle ownership categories in Dimmitt are males with 1 vehicle (352, accounting for 29.4%) and females with 1 vehicle (348, making up 41.2%).
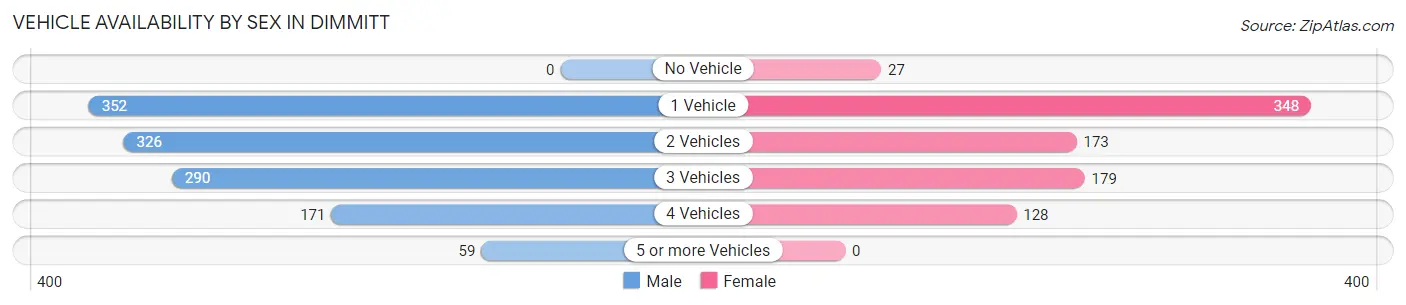
| Vehicles Available | Male | Female |
| No Vehicle | 0 (0.0%) | 27 (3.2%) |
| 1 Vehicle | 352 (29.4%) | 348 (40.7%) |
| 2 Vehicles | 326 (27.2%) | 173 (20.2%) |
| 3 Vehicles | 290 (24.2%) | 179 (20.9%) |
| 4 Vehicles | 171 (14.3%) | 128 (15.0%) |
| 5 or more Vehicles | 59 (4.9%) | 0 (0.0%) |
| Total | 1,198 (100.0%) | 855 (100.0%) |
Commute Time in Dimmitt
The most frequently occuring commute durations in Dimmitt are 5 to 9 minutes (802 commuters, 39.1%), less than 5 minutes (302 commuters, 14.7%), and 15 to 19 minutes (248 commuters, 12.1%).
| Commute Time | # Commuters | % Commuters |
| Less than 5 Minutes | 302 | 14.7% |
| 5 to 9 Minutes | 802 | 39.1% |
| 10 to 14 Minutes | 151 | 7.4% |
| 15 to 19 Minutes | 248 | 12.1% |
| 20 to 24 Minutes | 40 | 1.9% |
| 25 to 29 Minutes | 121 | 5.9% |
| 30 to 34 Minutes | 158 | 7.7% |
| 35 to 39 Minutes | 0 | 0.0% |
| 40 to 44 Minutes | 12 | 0.6% |
| 45 to 59 Minutes | 129 | 6.3% |
| 60 to 89 Minutes | 90 | 4.4% |
| 90 or more Minutes | 0 | 0.0% |
Commute Time by Sex in Dimmitt
The most common commute times in Dimmitt are 5 to 9 minutes (443 commuters, 37.0%) for males and 5 to 9 minutes (359 commuters, 42.0%) for females.
| Commute Time | Male | Female |
| Less than 5 Minutes | 139 (11.6%) | 163 (19.1%) |
| 5 to 9 Minutes | 443 (37.0%) | 359 (42.0%) |
| 10 to 14 Minutes | 138 (11.5%) | 13 (1.5%) |
| 15 to 19 Minutes | 155 (12.9%) | 93 (10.9%) |
| 20 to 24 Minutes | 40 (3.3%) | 0 (0.0%) |
| 25 to 29 Minutes | 82 (6.8%) | 39 (4.6%) |
| 30 to 34 Minutes | 78 (6.5%) | 80 (9.4%) |
| 35 to 39 Minutes | 0 (0.0%) | 0 (0.0%) |
| 40 to 44 Minutes | 12 (1.0%) | 0 (0.0%) |
| 45 to 59 Minutes | 33 (2.8%) | 96 (11.2%) |
| 60 to 89 Minutes | 78 (6.5%) | 12 (1.4%) |
| 90 or more Minutes | 0 (0.0%) | 0 (0.0%) |
Time of Departure to Work by Sex in Dimmitt
The most frequent times of departure to work in Dimmitt are 4:00 PM to 11:59 PM (223, 18.6%) for males and 7:30 AM to 7:59 AM (236, 27.6%) for females.
| Time of Departure | Male | Female |
| 12:00 AM to 4:59 AM | 114 (9.5%) | 78 (9.1%) |
| 5:00 AM to 5:29 AM | 87 (7.3%) | 72 (8.4%) |
| 5:30 AM to 5:59 AM | 75 (6.3%) | 0 (0.0%) |
| 6:00 AM to 6:29 AM | 167 (13.9%) | 0 (0.0%) |
| 6:30 AM to 6:59 AM | 98 (8.2%) | 73 (8.5%) |
| 7:00 AM to 7:29 AM | 153 (12.8%) | 38 (4.4%) |
| 7:30 AM to 7:59 AM | 92 (7.7%) | 236 (27.6%) |
| 8:00 AM to 8:29 AM | 58 (4.8%) | 116 (13.6%) |
| 8:30 AM to 8:59 AM | 14 (1.2%) | 42 (4.9%) |
| 9:00 AM to 9:59 AM | 77 (6.4%) | 100 (11.7%) |
| 10:00 AM to 10:59 AM | 0 (0.0%) | 0 (0.0%) |
| 11:00 AM to 11:59 AM | 0 (0.0%) | 0 (0.0%) |
| 12:00 PM to 3:59 PM | 40 (3.3%) | 41 (4.8%) |
| 4:00 PM to 11:59 PM | 223 (18.6%) | 59 (6.9%) |
| Total | 1,198 (100.0%) | 855 (100.0%) |
Housing Occupancy in Dimmitt
Occupancy by Ownership in Dimmitt
Of the total 1,305 dwellings in Dimmitt, owner-occupied units account for 764 (58.5%), while renter-occupied units make up 541 (41.5%).
| Occupancy | # Housing Units | % Housing Units |
| Owner Occupied Housing Units | 764 | 58.5% |
| Renter-Occupied Housing Units | 541 | 41.5% |
| Total Occupied Housing Units | 1,305 | 100.0% |
Occupancy by Household Size in Dimmitt
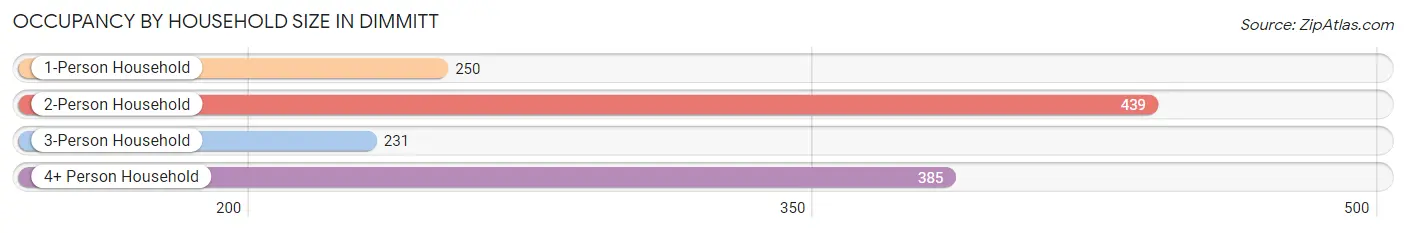
| Household Size | # Housing Units | % Housing Units |
| 1-Person Household | 250 | 19.2% |
| 2-Person Household | 439 | 33.6% |
| 3-Person Household | 231 | 17.7% |
| 4+ Person Household | 385 | 29.5% |
| Total Housing Units | 1,305 | 100.0% |
Occupancy by Ownership by Household Size in Dimmitt
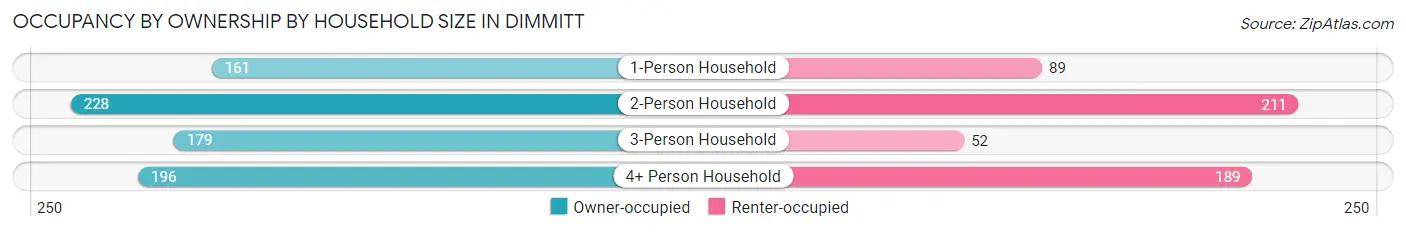
| Household Size | Owner-occupied | Renter-occupied |
| 1-Person Household | 161 (64.4%) | 89 (35.6%) |
| 2-Person Household | 228 (51.9%) | 211 (48.1%) |
| 3-Person Household | 179 (77.5%) | 52 (22.5%) |
| 4+ Person Household | 196 (50.9%) | 189 (49.1%) |
| Total Housing Units | 764 (58.5%) | 541 (41.5%) |
Occupancy by Educational Attainment in Dimmitt
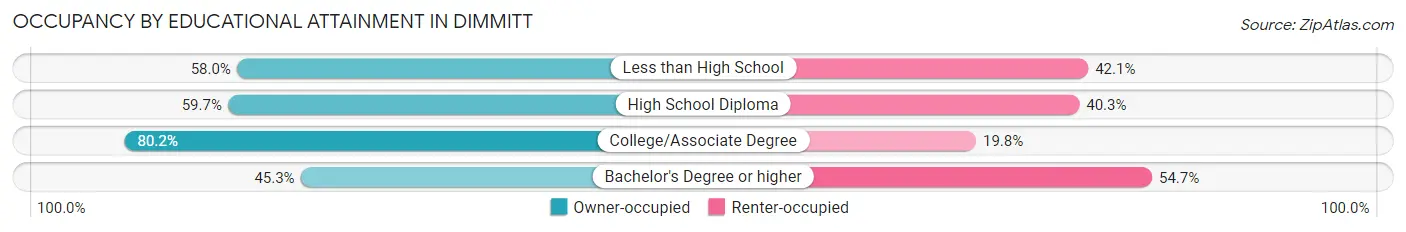
| Household Size | Owner-occupied | Renter-occupied |
| Less than High School | 113 (58.0%) | 82 (42.0%) |
| High School Diploma | 307 (59.7%) | 207 (40.3%) |
| College/Associate Degree | 170 (80.2%) | 42 (19.8%) |
| Bachelor's Degree or higher | 174 (45.3%) | 210 (54.7%) |
Occupancy by Age of Householder in Dimmitt
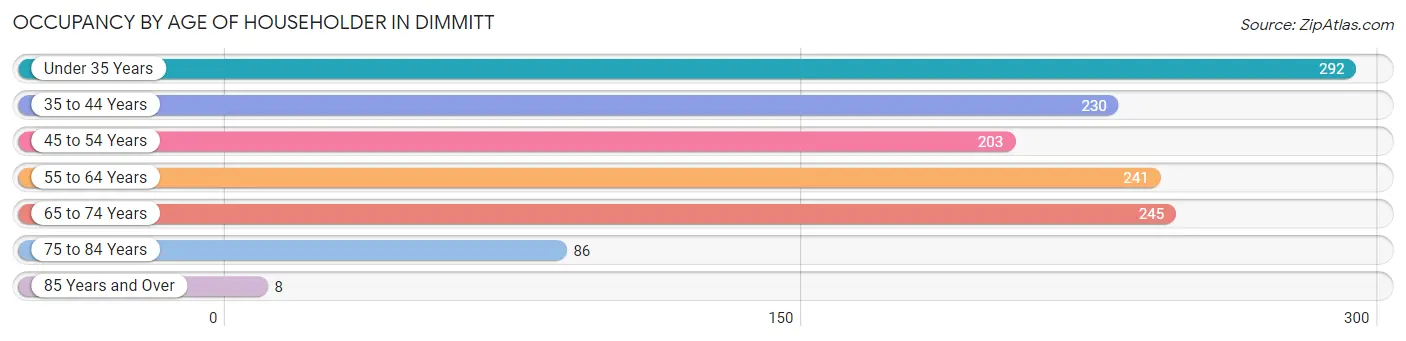
| Age Bracket | # Households | % Households |
| Under 35 Years | 292 | 22.4% |
| 35 to 44 Years | 230 | 17.6% |
| 45 to 54 Years | 203 | 15.6% |
| 55 to 64 Years | 241 | 18.5% |
| 65 to 74 Years | 245 | 18.8% |
| 75 to 84 Years | 86 | 6.6% |
| 85 Years and Over | 8 | 0.6% |
| Total | 1,305 | 100.0% |
Housing Finances in Dimmitt
Median Income by Occupancy in Dimmitt
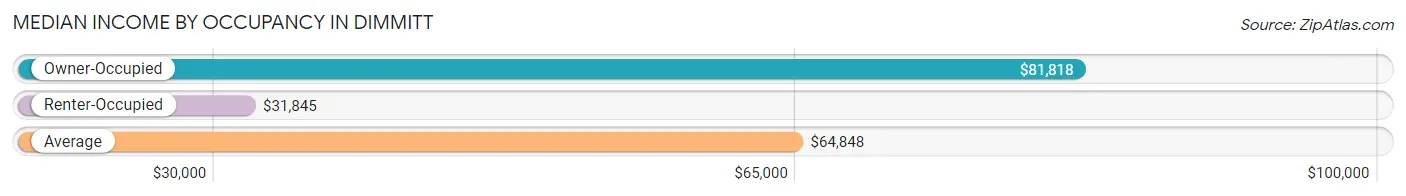
| Occupancy Type | # Households | Median Income |
| Owner-Occupied | 764 (58.5%) | $81,818 |
| Renter-Occupied | 541 (41.5%) | $31,845 |
| Average | 1,305 (100.0%) | $64,848 |
Occupancy by Householder Income Bracket in Dimmitt
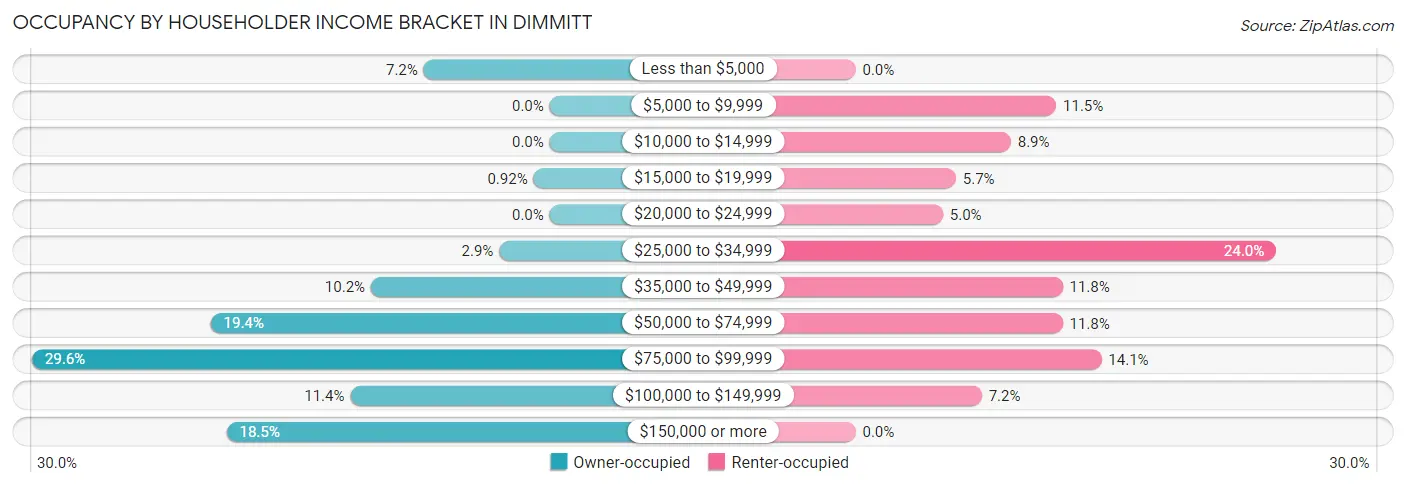
| Income Bracket | Owner-occupied | Renter-occupied |
| Less than $5,000 | 55 (7.2%) | 0 (0.0%) |
| $5,000 to $9,999 | 0 (0.0%) | 62 (11.5%) |
| $10,000 to $14,999 | 0 (0.0%) | 48 (8.9%) |
| $15,000 to $19,999 | 7 (0.9%) | 31 (5.7%) |
| $20,000 to $24,999 | 0 (0.0%) | 27 (5.0%) |
| $25,000 to $34,999 | 22 (2.9%) | 130 (24.0%) |
| $35,000 to $49,999 | 78 (10.2%) | 64 (11.8%) |
| $50,000 to $74,999 | 148 (19.4%) | 64 (11.8%) |
| $75,000 to $99,999 | 226 (29.6%) | 76 (14.1%) |
| $100,000 to $149,999 | 87 (11.4%) | 39 (7.2%) |
| $150,000 or more | 141 (18.5%) | 0 (0.0%) |
| Total | 764 (100.0%) | 541 (100.0%) |
Monthly Housing Cost Tiers in Dimmitt
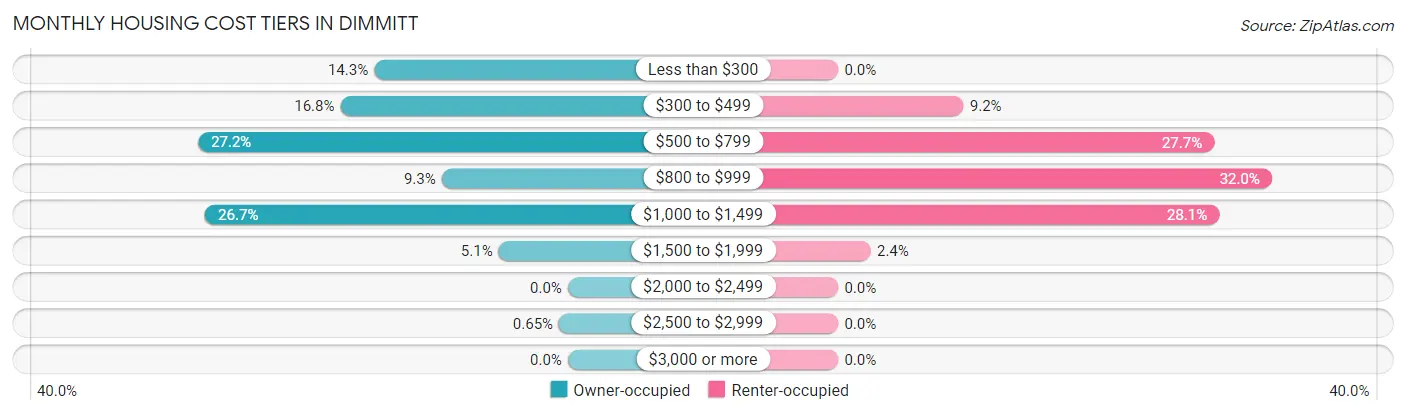
| Monthly Cost | Owner-occupied | Renter-occupied |
| Less than $300 | 109 (14.3%) | 0 (0.0%) |
| $300 to $499 | 128 (16.8%) | 50 (9.2%) |
| $500 to $799 | 208 (27.2%) | 150 (27.7%) |
| $800 to $999 | 71 (9.3%) | 173 (32.0%) |
| $1,000 to $1,499 | 204 (26.7%) | 152 (28.1%) |
| $1,500 to $1,999 | 39 (5.1%) | 13 (2.4%) |
| $2,000 to $2,499 | 0 (0.0%) | 0 (0.0%) |
| $2,500 to $2,999 | 5 (0.6%) | 0 (0.0%) |
| $3,000 or more | 0 (0.0%) | 0 (0.0%) |
| Total | 764 (100.0%) | 541 (100.0%) |
Physical Housing Characteristics in Dimmitt
Housing Structures in Dimmitt
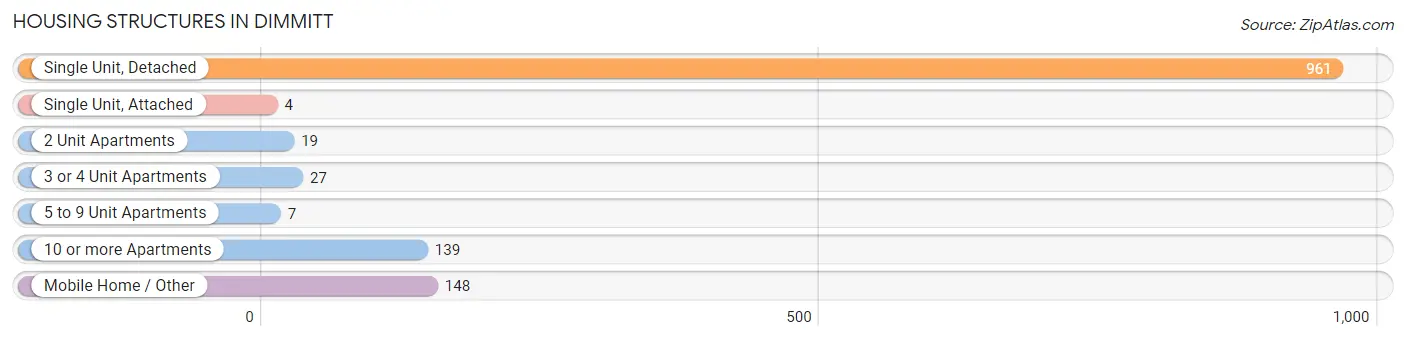
| Structure Type | # Housing Units | % Housing Units |
| Single Unit, Detached | 961 | 73.6% |
| Single Unit, Attached | 4 | 0.3% |
| 2 Unit Apartments | 19 | 1.5% |
| 3 or 4 Unit Apartments | 27 | 2.1% |
| 5 to 9 Unit Apartments | 7 | 0.5% |
| 10 or more Apartments | 139 | 10.6% |
| Mobile Home / Other | 148 | 11.3% |
| Total | 1,305 | 100.0% |
Housing Structures by Occupancy in Dimmitt
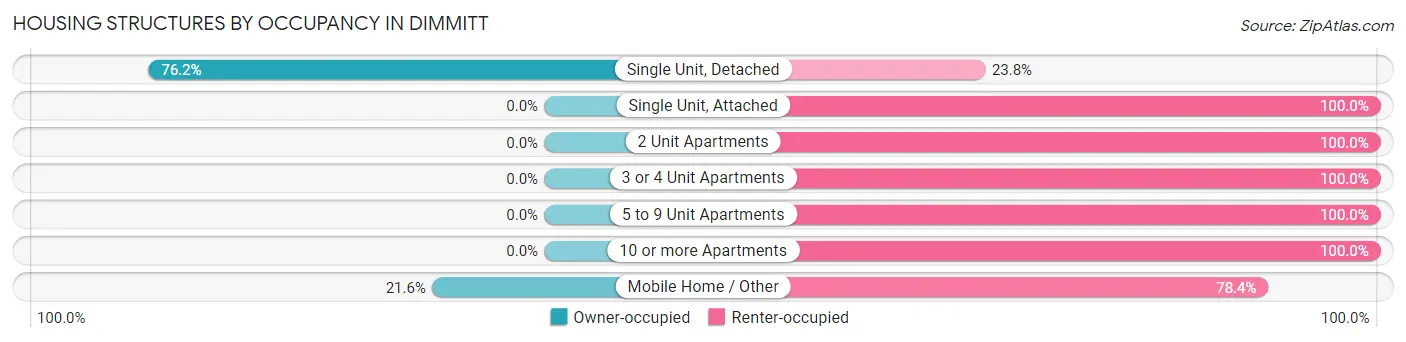
| Structure Type | Owner-occupied | Renter-occupied |
| Single Unit, Detached | 732 (76.2%) | 229 (23.8%) |
| Single Unit, Attached | 0 (0.0%) | 4 (100.0%) |
| 2 Unit Apartments | 0 (0.0%) | 19 (100.0%) |
| 3 or 4 Unit Apartments | 0 (0.0%) | 27 (100.0%) |
| 5 to 9 Unit Apartments | 0 (0.0%) | 7 (100.0%) |
| 10 or more Apartments | 0 (0.0%) | 139 (100.0%) |
| Mobile Home / Other | 32 (21.6%) | 116 (78.4%) |
| Total | 764 (58.5%) | 541 (41.5%) |
Housing Structures by Number of Rooms in Dimmitt
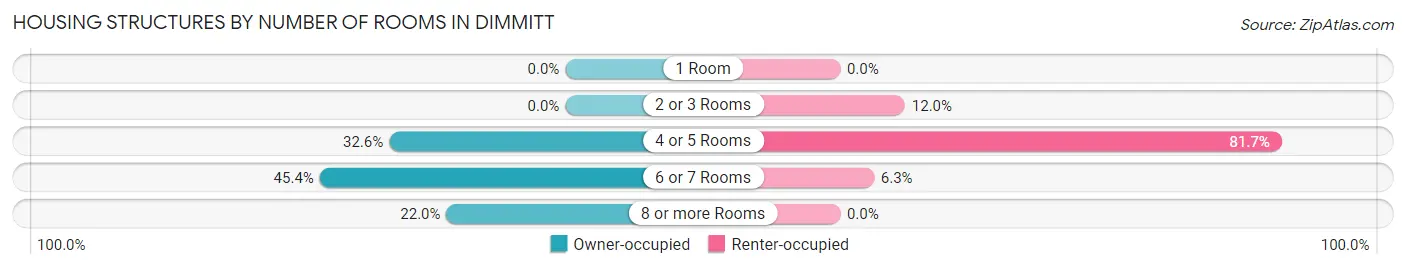
| Number of Rooms | Owner-occupied | Renter-occupied |
| 1 Room | 0 (0.0%) | 0 (0.0%) |
| 2 or 3 Rooms | 0 (0.0%) | 65 (12.0%) |
| 4 or 5 Rooms | 249 (32.6%) | 442 (81.7%) |
| 6 or 7 Rooms | 347 (45.4%) | 34 (6.3%) |
| 8 or more Rooms | 168 (22.0%) | 0 (0.0%) |
| Total | 764 (100.0%) | 541 (100.0%) |
Housing Structure by Heating Type in Dimmitt
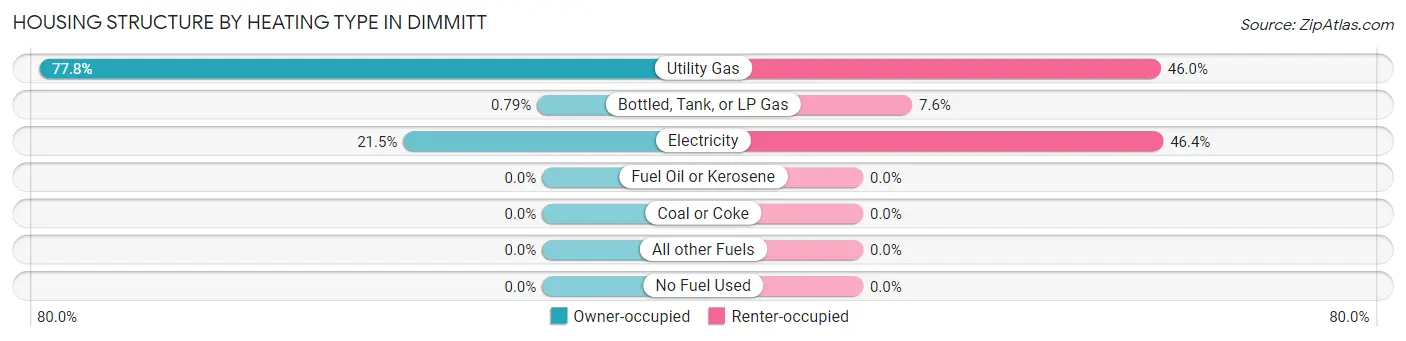
| Heating Type | Owner-occupied | Renter-occupied |
| Utility Gas | 594 (77.7%) | 249 (46.0%) |
| Bottled, Tank, or LP Gas | 6 (0.8%) | 41 (7.6%) |
| Electricity | 164 (21.5%) | 251 (46.4%) |
| Fuel Oil or Kerosene | 0 (0.0%) | 0 (0.0%) |
| Coal or Coke | 0 (0.0%) | 0 (0.0%) |
| All other Fuels | 0 (0.0%) | 0 (0.0%) |
| No Fuel Used | 0 (0.0%) | 0 (0.0%) |
| Total | 764 (100.0%) | 541 (100.0%) |
Household Vehicle Usage in Dimmitt
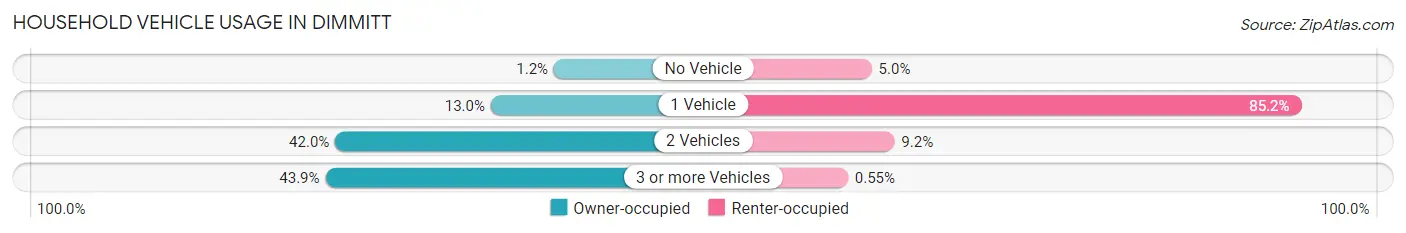
| Vehicles per Household | Owner-occupied | Renter-occupied |
| No Vehicle | 9 (1.2%) | 27 (5.0%) |
| 1 Vehicle | 99 (13.0%) | 461 (85.2%) |
| 2 Vehicles | 321 (42.0%) | 50 (9.2%) |
| 3 or more Vehicles | 335 (43.9%) | 3 (0.5%) |
| Total | 764 (100.0%) | 541 (100.0%) |
Real Estate & Mortgages in Dimmitt
Real Estate and Mortgage Overview in Dimmitt
| Characteristic | Without Mortgage | With Mortgage |
| Housing Units | 453 | 311 |
| Median Property Value | $90,900 | $108,100 |
| Median Household Income | $72,194 | $101 |
| Monthly Housing Costs | $473 | $0 |
| Real Estate Taxes | - | - |
Property Value by Mortgage Status in Dimmitt
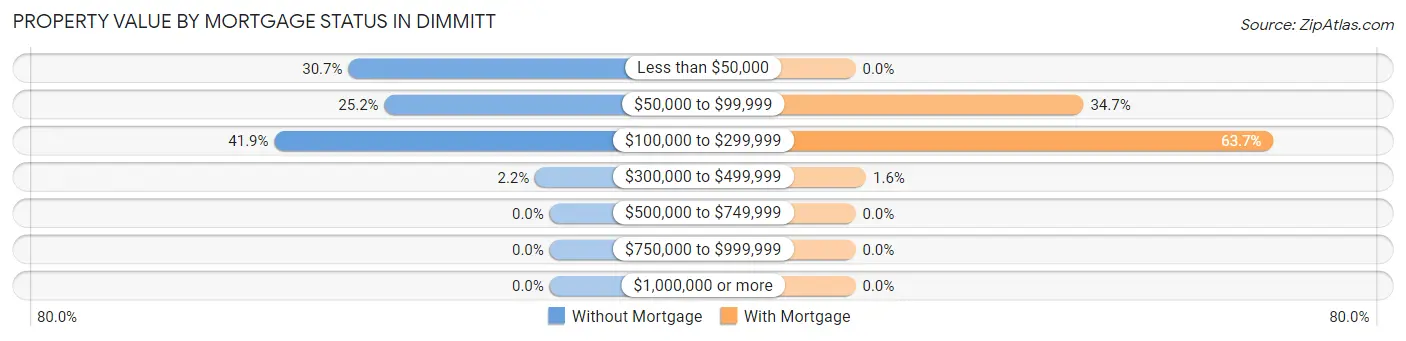
| Property Value | Without Mortgage | With Mortgage |
| Less than $50,000 | 139 (30.7%) | 0 (0.0%) |
| $50,000 to $99,999 | 114 (25.2%) | 108 (34.7%) |
| $100,000 to $299,999 | 190 (41.9%) | 198 (63.7%) |
| $300,000 to $499,999 | 10 (2.2%) | 5 (1.6%) |
| $500,000 to $749,999 | 0 (0.0%) | 0 (0.0%) |
| $750,000 to $999,999 | 0 (0.0%) | 0 (0.0%) |
| $1,000,000 or more | 0 (0.0%) | 0 (0.0%) |
| Total | 453 (100.0%) | 311 (100.0%) |
Household Income by Mortgage Status in Dimmitt
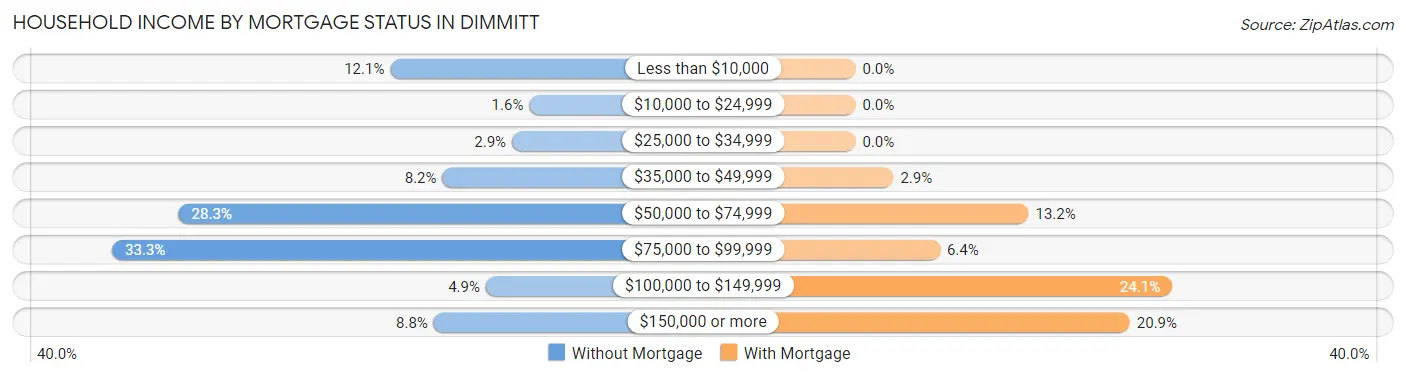
| Household Income | Without Mortgage | With Mortgage |
| Less than $10,000 | 55 (12.1%) | 0 (0.0%) |
| $10,000 to $24,999 | 7 (1.5%) | 0 (0.0%) |
| $25,000 to $34,999 | 13 (2.9%) | 0 (0.0%) |
| $35,000 to $49,999 | 37 (8.2%) | 9 (2.9%) |
| $50,000 to $74,999 | 128 (28.3%) | 41 (13.2%) |
| $75,000 to $99,999 | 151 (33.3%) | 20 (6.4%) |
| $100,000 to $149,999 | 22 (4.9%) | 75 (24.1%) |
| $150,000 or more | 40 (8.8%) | 65 (20.9%) |
| Total | 453 (100.0%) | 311 (100.0%) |
Property Value to Household Income Ratio in Dimmitt
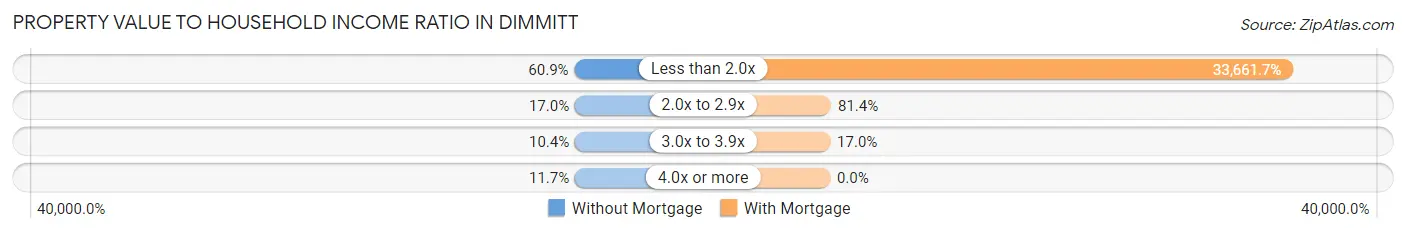
| Value-to-Income Ratio | Without Mortgage | With Mortgage |
| Less than 2.0x | 276 (60.9%) | 104,688 (33,661.7%) |
| 2.0x to 2.9x | 77 (17.0%) | 253 (81.4%) |
| 3.0x to 3.9x | 47 (10.4%) | 53 (17.0%) |
| 4.0x or more | 53 (11.7%) | 0 (0.0%) |
| Total | 453 (100.0%) | 311 (100.0%) |
Real Estate Taxes by Mortgage Status in Dimmitt
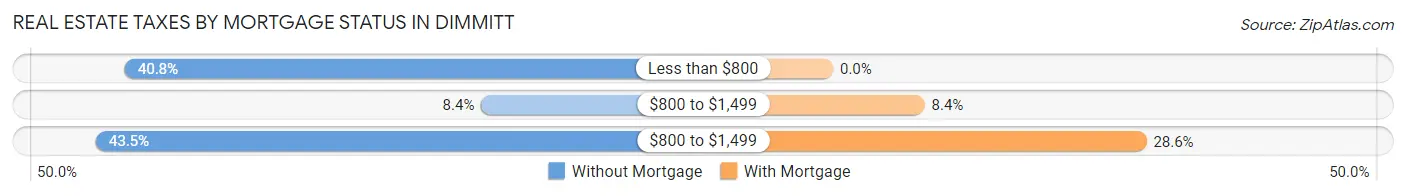
| Property Taxes | Without Mortgage | With Mortgage |
| Less than $800 | 185 (40.8%) | 0 (0.0%) |
| $800 to $1,499 | 38 (8.4%) | 26 (8.4%) |
| $800 to $1,499 | 197 (43.5%) | 89 (28.6%) |
| Total | 453 (100.0%) | 311 (100.0%) |
Health & Disability in Dimmitt
Health Insurance Coverage by Age in Dimmitt
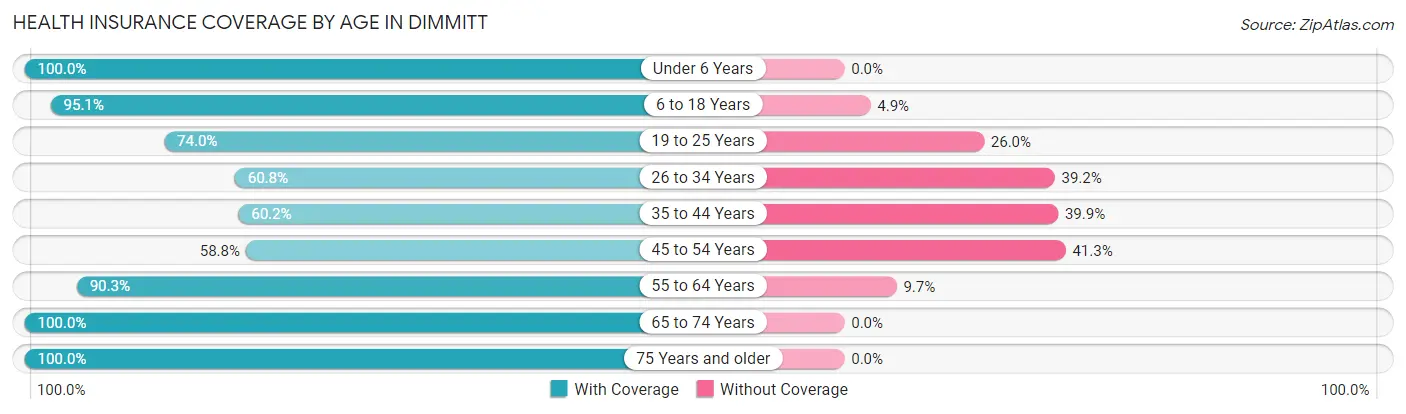
| Age Bracket | With Coverage | Without Coverage |
| Under 6 Years | 363 (100.0%) | 0 (0.0%) |
| 6 to 18 Years | 921 (95.1%) | 47 (4.9%) |
| 19 to 25 Years | 324 (74.0%) | 114 (26.0%) |
| 26 to 34 Years | 293 (60.8%) | 189 (39.2%) |
| 35 to 44 Years | 234 (60.2%) | 155 (39.9%) |
| 45 to 54 Years | 235 (58.8%) | 165 (41.2%) |
| 55 to 64 Years | 371 (90.3%) | 40 (9.7%) |
| 65 to 74 Years | 468 (100.0%) | 0 (0.0%) |
| 75 Years and older | 197 (100.0%) | 0 (0.0%) |
| Total | 3,406 (82.8%) | 710 (17.2%) |
Health Insurance Coverage by Citizenship Status in Dimmitt
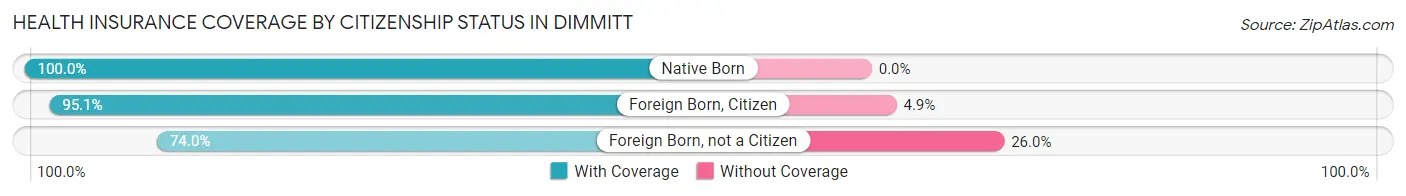
| Citizenship Status | With Coverage | Without Coverage |
| Native Born | 363 (100.0%) | 0 (0.0%) |
| Foreign Born, Citizen | 921 (95.1%) | 47 (4.9%) |
| Foreign Born, not a Citizen | 324 (74.0%) | 114 (26.0%) |
Health Insurance Coverage by Household Income in Dimmitt
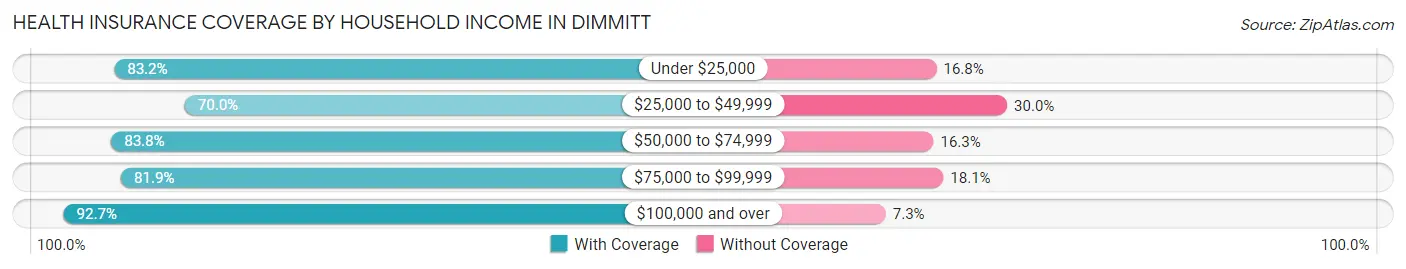
| Household Income | With Coverage | Without Coverage |
| Under $25,000 | 475 (83.2%) | 96 (16.8%) |
| $25,000 to $49,999 | 503 (70.0%) | 216 (30.0%) |
| $50,000 to $74,999 | 675 (83.8%) | 131 (16.3%) |
| $75,000 to $99,999 | 905 (81.9%) | 200 (18.1%) |
| $100,000 and over | 848 (92.7%) | 67 (7.3%) |
Public vs Private Health Insurance Coverage by Age in Dimmitt
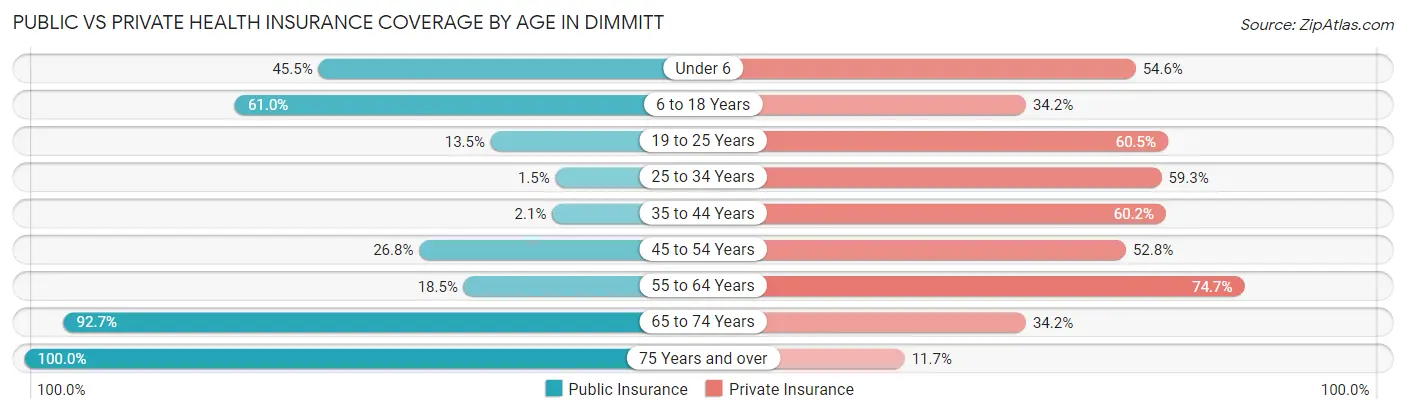
| Age Bracket | Public Insurance | Private Insurance |
| Under 6 | 165 (45.5%) | 198 (54.5%) |
| 6 to 18 Years | 590 (61.0%) | 331 (34.2%) |
| 19 to 25 Years | 59 (13.5%) | 265 (60.5%) |
| 25 to 34 Years | 7 (1.5%) | 286 (59.3%) |
| 35 to 44 Years | 8 (2.1%) | 234 (60.2%) |
| 45 to 54 Years | 107 (26.8%) | 211 (52.7%) |
| 55 to 64 Years | 76 (18.5%) | 307 (74.7%) |
| 65 to 74 Years | 434 (92.7%) | 160 (34.2%) |
| 75 Years and over | 197 (100.0%) | 23 (11.7%) |
| Total | 1,643 (39.9%) | 2,015 (49.0%) |
Disability Status by Sex by Age in Dimmitt
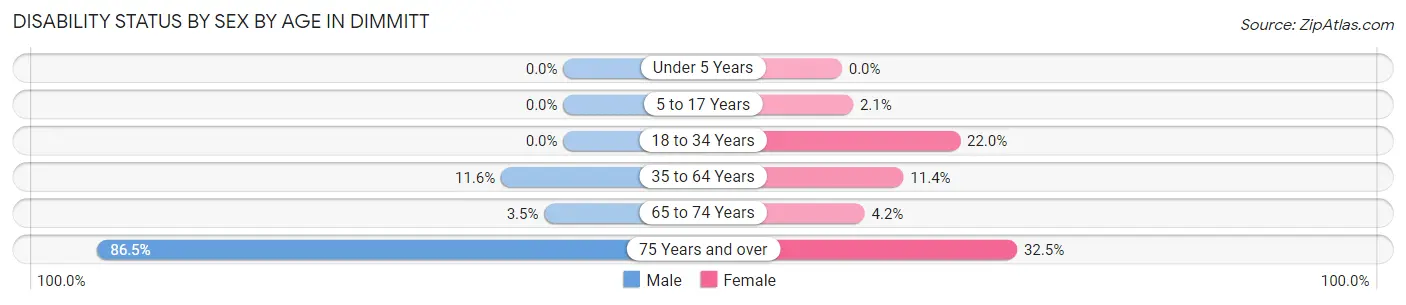
| Age Bracket | Male | Female |
| Under 5 Years | 0 (0.0%) | 0 (0.0%) |
| 5 to 17 Years | 0 (0.0%) | 9 (2.1%) |
| 18 to 34 Years | 0 (0.0%) | 108 (22.0%) |
| 35 to 64 Years | 64 (11.6%) | 74 (11.4%) |
| 65 to 74 Years | 9 (3.5%) | 9 (4.2%) |
| 75 Years and over | 64 (86.5%) | 40 (32.5%) |
Disability Class by Sex by Age in Dimmitt
Disability Class: Hearing Difficulty
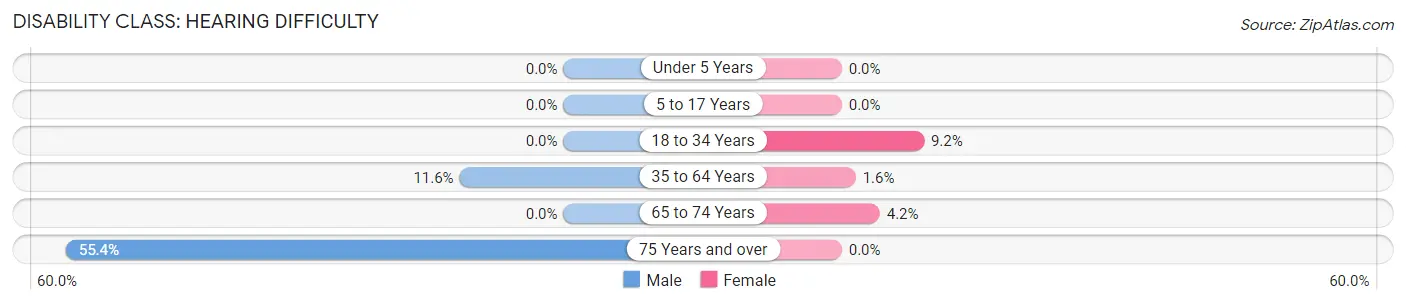
| Age Bracket | Male | Female |
| Under 5 Years | 0 (0.0%) | 0 (0.0%) |
| 5 to 17 Years | 0 (0.0%) | 0 (0.0%) |
| 18 to 34 Years | 0 (0.0%) | 45 (9.1%) |
| 35 to 64 Years | 64 (11.6%) | 10 (1.5%) |
| 65 to 74 Years | 0 (0.0%) | 9 (4.2%) |
| 75 Years and over | 41 (55.4%) | 0 (0.0%) |
Disability Class: Vision Difficulty
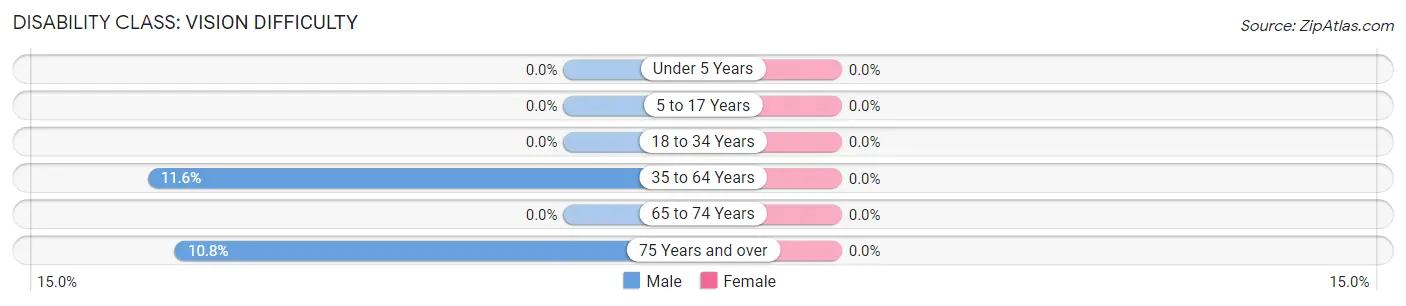
| Age Bracket | Male | Female |
| Under 5 Years | 0 (0.0%) | 0 (0.0%) |
| 5 to 17 Years | 0 (0.0%) | 0 (0.0%) |
| 18 to 34 Years | 0 (0.0%) | 0 (0.0%) |
| 35 to 64 Years | 64 (11.6%) | 0 (0.0%) |
| 65 to 74 Years | 0 (0.0%) | 0 (0.0%) |
| 75 Years and over | 8 (10.8%) | 0 (0.0%) |
Disability Class: Cognitive Difficulty
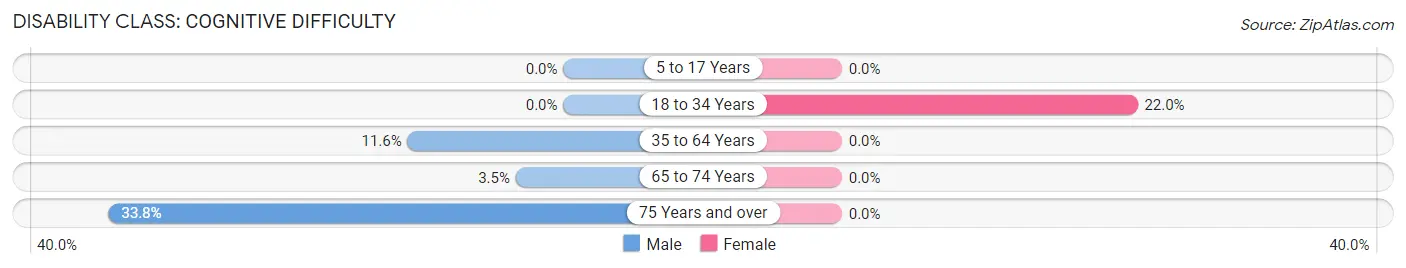
| Age Bracket | Male | Female |
| 5 to 17 Years | 0 (0.0%) | 0 (0.0%) |
| 18 to 34 Years | 0 (0.0%) | 108 (22.0%) |
| 35 to 64 Years | 64 (11.6%) | 0 (0.0%) |
| 65 to 74 Years | 9 (3.5%) | 0 (0.0%) |
| 75 Years and over | 25 (33.8%) | 0 (0.0%) |
Disability Class: Ambulatory Difficulty
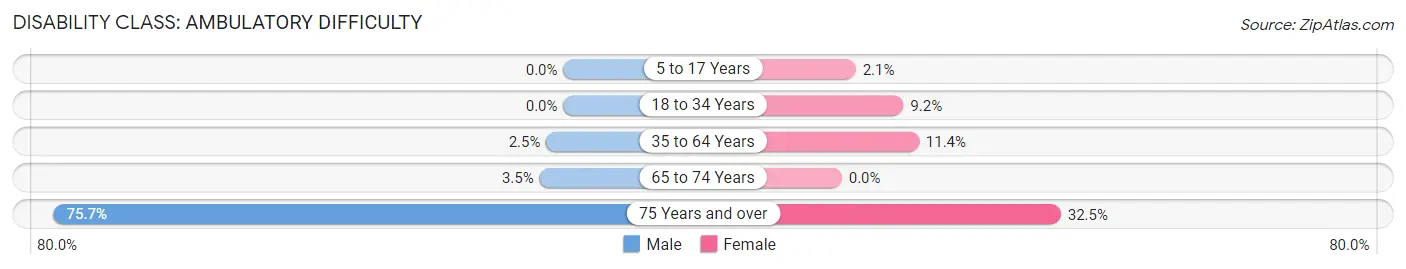
| Age Bracket | Male | Female |
| 5 to 17 Years | 0 (0.0%) | 9 (2.1%) |
| 18 to 34 Years | 0 (0.0%) | 45 (9.1%) |
| 35 to 64 Years | 14 (2.5%) | 74 (11.4%) |
| 65 to 74 Years | 9 (3.5%) | 0 (0.0%) |
| 75 Years and over | 56 (75.7%) | 40 (32.5%) |
Disability Class: Self-Care Difficulty
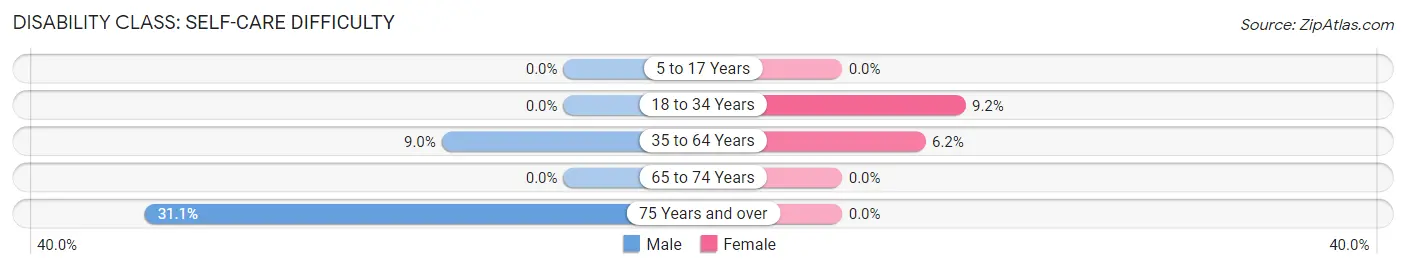
| Age Bracket | Male | Female |
| 5 to 17 Years | 0 (0.0%) | 0 (0.0%) |
| 18 to 34 Years | 0 (0.0%) | 45 (9.1%) |
| 35 to 64 Years | 50 (9.0%) | 40 (6.2%) |
| 65 to 74 Years | 0 (0.0%) | 0 (0.0%) |
| 75 Years and over | 23 (31.1%) | 0 (0.0%) |
Technology Access in Dimmitt
Computing Device Access in Dimmitt
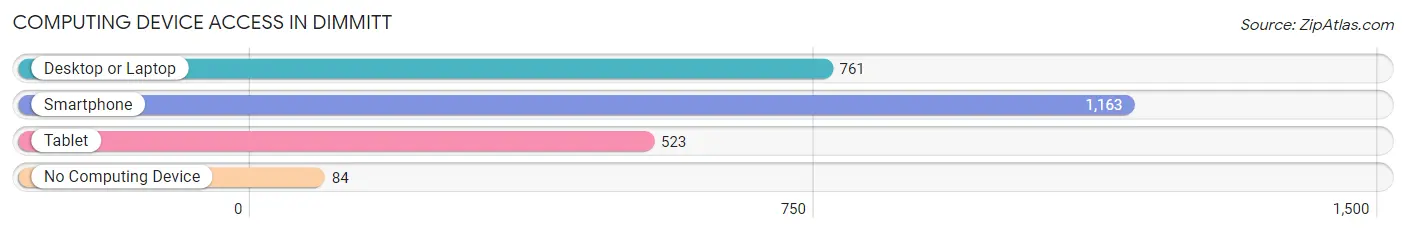
| Device Type | # Households | % Households |
| Desktop or Laptop | 761 | 58.3% |
| Smartphone | 1,163 | 89.1% |
| Tablet | 523 | 40.1% |
| No Computing Device | 84 | 6.4% |
| Total | 1,305 | 100.0% |
Internet Access in Dimmitt
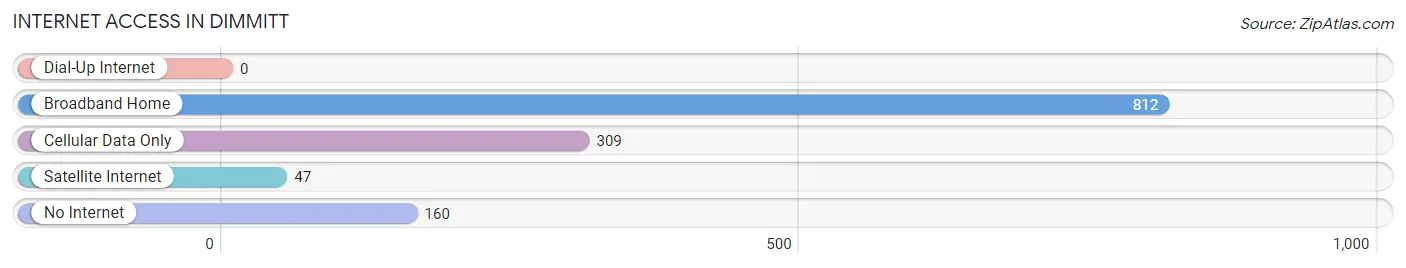
| Internet Type | # Households | % Households |
| Dial-Up Internet | 0 | 0.0% |
| Broadband Home | 812 | 62.2% |
| Cellular Data Only | 309 | 23.7% |
| Satellite Internet | 47 | 3.6% |
| No Internet | 160 | 12.3% |
| Total | 1,305 | 100.0% |
Dimmitt Summary
Dimmitt is a small town located in Castro County, Texas, United States. It is situated in the Texas Panhandle, approximately 30 miles north of Amarillo. The population of Dimmitt was 4,393 at the 2010 census.
History
The area around Dimmitt was first settled in the late 1800s by ranchers and farmers. The town was founded in 1906 and named after a local rancher, John Dimmitt. The town was incorporated in 1909 and quickly became a center for the local agricultural industry.
In the early 1900s, Dimmitt was a major stop on the Santa Fe Railroad. The railroad brought in new settlers and businesses, and the town grew rapidly. By the 1920s, Dimmitt had become a thriving agricultural center, with cotton, corn, and wheat being the main crops.
In the 1930s, the Great Depression hit the town hard. Many businesses closed and the population declined. However, the town was able to survive and slowly began to recover.
In the 1950s, the town experienced a resurgence. The local economy was bolstered by the discovery of oil and gas in the area. The town also benefited from the construction of the nearby Palo Duro Dam, which provided irrigation for the local farms.
Geography
Dimmitt is located in the Texas Panhandle, approximately 30 miles north of Amarillo. The town is situated on the Canadian River, which provides irrigation for the local farms. The town is surrounded by flat, open plains, with the Caprock Escarpment to the west.
The climate in Dimmitt is semi-arid, with hot summers and mild winters. The average annual temperature is 64°F, with an average high of 91°F in the summer and an average low of 37°F in the winter.
Economy
The economy of Dimmitt is largely based on agriculture. The town is home to several large farms, which produce cotton, corn, wheat, and other crops. The local economy is also supported by the oil and gas industry, as well as by the nearby Palo Duro Dam.
The town is also home to several small businesses, including restaurants, retail stores, and service providers.
Demographics
As of the 2010 census, the population of Dimmitt was 4,393. The racial makeup of the town was 79.3% White, 0.7% African American, 0.7% Native American, 0.2% Asian, 0.1% Pacific Islander, 16.7% from other races, and 2.3% from two or more races. Hispanic or Latino of any race were 44.2% of the population.
The median income for a household in Dimmitt was $30,938, and the median income for a family was $35,938. The per capita income for the town was $15,938. About 18.3% of families and 22.2% of the population were below the poverty line, including 28.3% of those under age 18 and 16.2% of those age 65 or over.
Common Questions
What is Per Capita Income in Dimmitt?
Per Capita income in Dimmitt is $24,998.
What is the Median Family Income in Dimmitt?
Median Family Income in Dimmitt is $66,719.
What is the Median Household income in Dimmitt?
Median Household Income in Dimmitt is $64,848.
What is Income or Wage Gap in Dimmitt?
Income or Wage Gap in Dimmitt is 34.9%.
Women in Dimmitt earn 65.1 cents for every dollar earned by a man.
What is Inequality or Gini Index in Dimmitt?
Inequality or Gini Index in Dimmitt is 0.41.
What is the Total Population of Dimmitt?
Total Population of Dimmitt is 4,169.
What is the Total Male Population of Dimmitt?
Total Male Population of Dimmitt is 2,098.
What is the Total Female Population of Dimmitt?
Total Female Population of Dimmitt is 2,071.
What is the Ratio of Males per 100 Females in Dimmitt?
There are 101.30 Males per 100 Females in Dimmitt.
What is the Ratio of Females per 100 Males in Dimmitt?
There are 98.71 Females per 100 Males in Dimmitt.
What is the Median Population Age in Dimmitt?
Median Population Age in Dimmitt is 31.0 Years.
What is the Average Family Size in Dimmitt
Average Family Size in Dimmitt is 3.7 People.
What is the Average Household Size in Dimmitt
Average Household Size in Dimmitt is 3.1 People.
How Large is the Labor Force in Dimmitt?
There are 2,187 People in the Labor Forcein in Dimmitt.
What is the Percentage of People in the Labor Force in Dimmitt?
71.8% of People are in the Labor Force in Dimmitt.
What is the Unemployment Rate in Dimmitt?
Unemployment Rate in Dimmitt is 2.9%.