Big Spring, TX Map & Demographics
Big Spring Map
Big Spring Overview
$28,762
PER CAPITA INCOME
$75,192
AVG FAMILY INCOME
$65,418
AVG HOUSEHOLD INCOME
52.4%
WAGE / INCOME GAP [ % ]
47.6¢/ $1
WAGE / INCOME GAP [ $ ]
0.43
INEQUALITY / GINI INDEX
25,949
TOTAL POPULATION
14,847
MALE POPULATION
11,102
FEMALE POPULATION
133.73
MALES / 100 FEMALES
74.78
FEMALES / 100 MALES
36.9
MEDIAN AGE
3.1
AVG FAMILY SIZE
2.5
AVG HOUSEHOLD SIZE
10,560
LABOR FORCE [ PEOPLE ]
50.3%
PERCENT IN LABOR FORCE
6.8%
UNEMPLOYMENT RATE
Big Spring Area Codes
Income in Big Spring
Income Overview in Big Spring
Per Capita Income in Big Spring is $28,762, while median incomes of families and households are $75,192 and $65,418 respectively.
| Characteristic | Number | Measure |
| Per Capita Income | 25,949 | $28,762 |
| Median Family Income | 5,550 | $75,192 |
| Mean Family Income | 5,550 | $88,059 |
| Median Household Income | 8,849 | $65,418 |
| Mean Household Income | 8,849 | $80,266 |
| Income Deficit | 5,550 | $0 |
| Wage / Income Gap (%) | 25,949 | 52.38% |
| Wage / Income Gap ($) | 25,949 | 47.62¢ per $1 |
| Gini / Inequality Index | 25,949 | 0.43 |
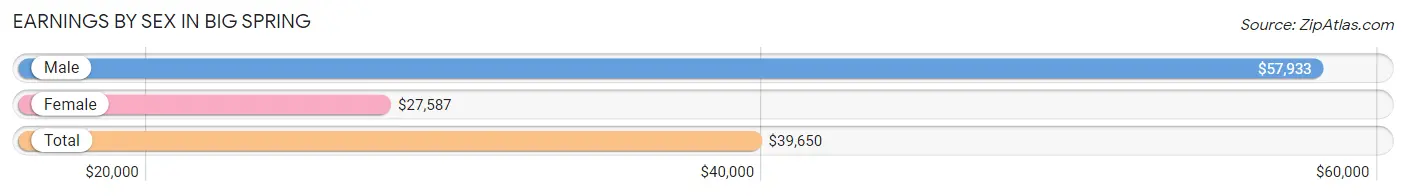
Earnings by Sex in Big Spring
Average Earnings in Big Spring are $39,650, $57,933 for men and $27,587 for women, a difference of 52.4%.
| Sex | Number | Average Earnings |
| Male | 6,794 (57.6%) | $57,933 |
| Female | 4,995 (42.4%) | $27,587 |
| Total | 11,789 (100.0%) | $39,650 |
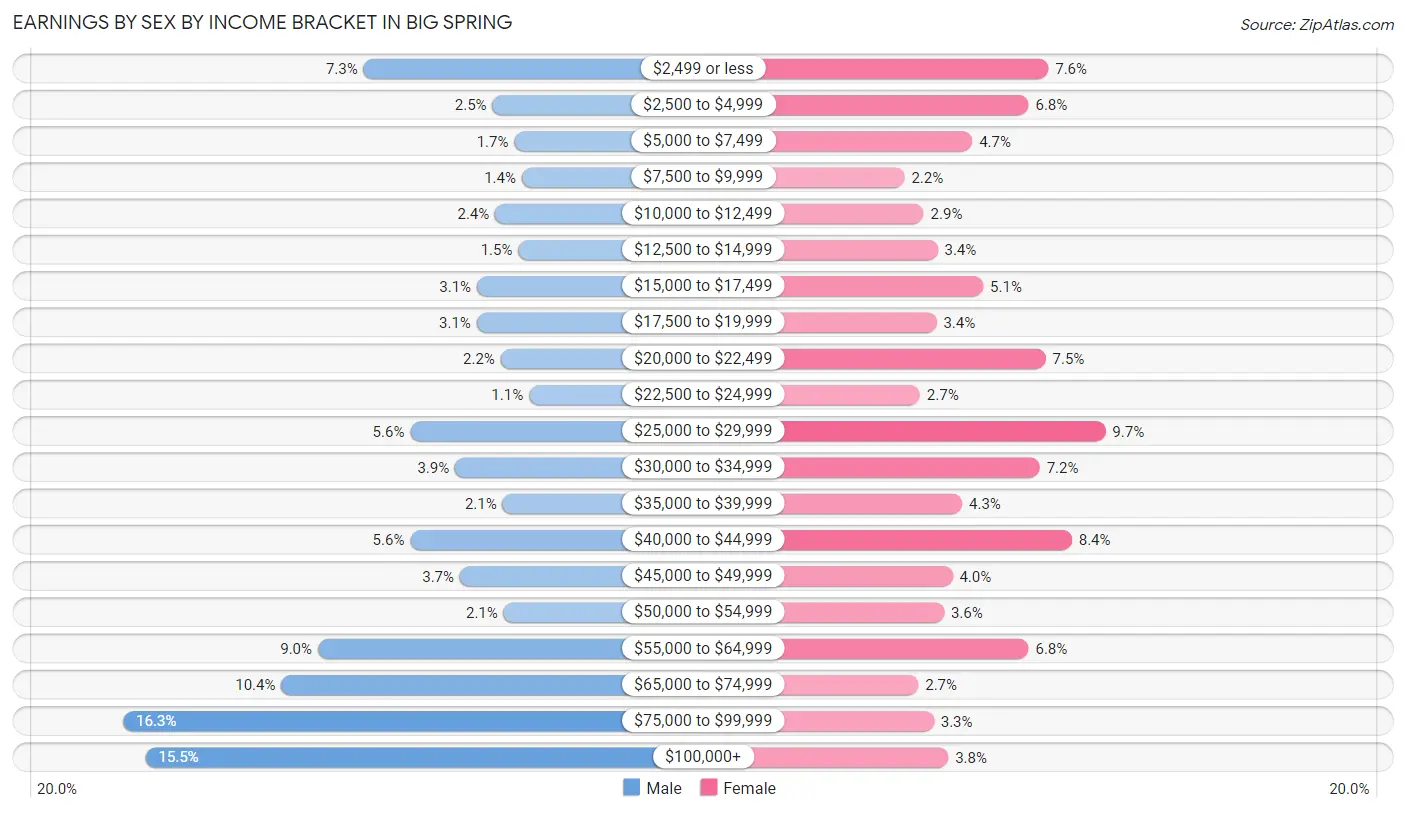
Earnings by Sex by Income Bracket in Big Spring
The most common earnings brackets in Big Spring are $75,000 to $99,999 for men (1,108 | 16.3%) and $25,000 to $29,999 for women (484 | 9.7%).
| Income | Male | Female |
| $2,499 or less | 496 (7.3%) | 377 (7.5%) |
| $2,500 to $4,999 | 168 (2.5%) | 340 (6.8%) |
| $5,000 to $7,499 | 112 (1.7%) | 235 (4.7%) |
| $7,500 to $9,999 | 93 (1.4%) | 108 (2.2%) |
| $10,000 to $12,499 | 161 (2.4%) | 144 (2.9%) |
| $12,500 to $14,999 | 102 (1.5%) | 170 (3.4%) |
| $15,000 to $17,499 | 207 (3.0%) | 255 (5.1%) |
| $17,500 to $19,999 | 208 (3.1%) | 168 (3.4%) |
| $20,000 to $22,499 | 147 (2.2%) | 372 (7.4%) |
| $22,500 to $24,999 | 75 (1.1%) | 137 (2.7%) |
| $25,000 to $29,999 | 377 (5.6%) | 484 (9.7%) |
| $30,000 to $34,999 | 263 (3.9%) | 361 (7.2%) |
| $35,000 to $39,999 | 142 (2.1%) | 216 (4.3%) |
| $40,000 to $44,999 | 377 (5.6%) | 421 (8.4%) |
| $45,000 to $49,999 | 251 (3.7%) | 198 (4.0%) |
| $50,000 to $54,999 | 139 (2.1%) | 182 (3.6%) |
| $55,000 to $64,999 | 612 (9.0%) | 340 (6.8%) |
| $65,000 to $74,999 | 705 (10.4%) | 134 (2.7%) |
| $75,000 to $99,999 | 1,108 (16.3%) | 163 (3.3%) |
| $100,000+ | 1,051 (15.5%) | 190 (3.8%) |
| Total | 6,794 (100.0%) | 4,995 (100.0%) |
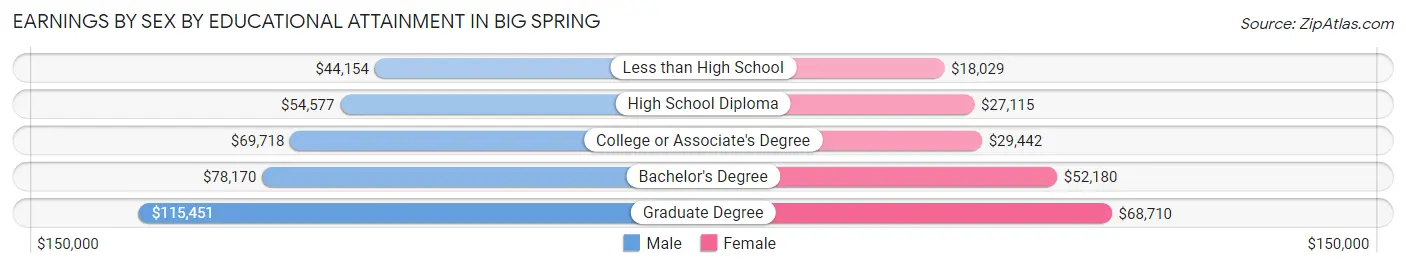
Earnings by Sex by Educational Attainment in Big Spring
Average earnings in Big Spring are $61,787 for men and $30,409 for women, a difference of 50.8%. Men with an educational attainment of graduate degree enjoy the highest average annual earnings of $115,451, while those with less than high school education earn the least with $44,154. Women with an educational attainment of graduate degree earn the most with the average annual earnings of $68,710, while those with less than high school education have the smallest earnings of $18,029.
| Educational Attainment | Male Income | Female Income |
| Less than High School | $44,154 | $18,029 |
| High School Diploma | $54,577 | $27,115 |
| College or Associate's Degree | $69,718 | $29,442 |
| Bachelor's Degree | $78,170 | $52,180 |
| Graduate Degree | $115,451 | $68,710 |
| Total | $61,787 | $30,409 |
Family Income in Big Spring
Family Income Brackets in Big Spring
According to the Big Spring family income data, there are 1,166 families falling into the $100,000 to $149,999 income range, which is the most common income bracket and makes up 21.0% of all families. Conversely, the $10,000 to $14,999 income bracket is the least frequent group with only 166 families (3.0%) belonging to this category.
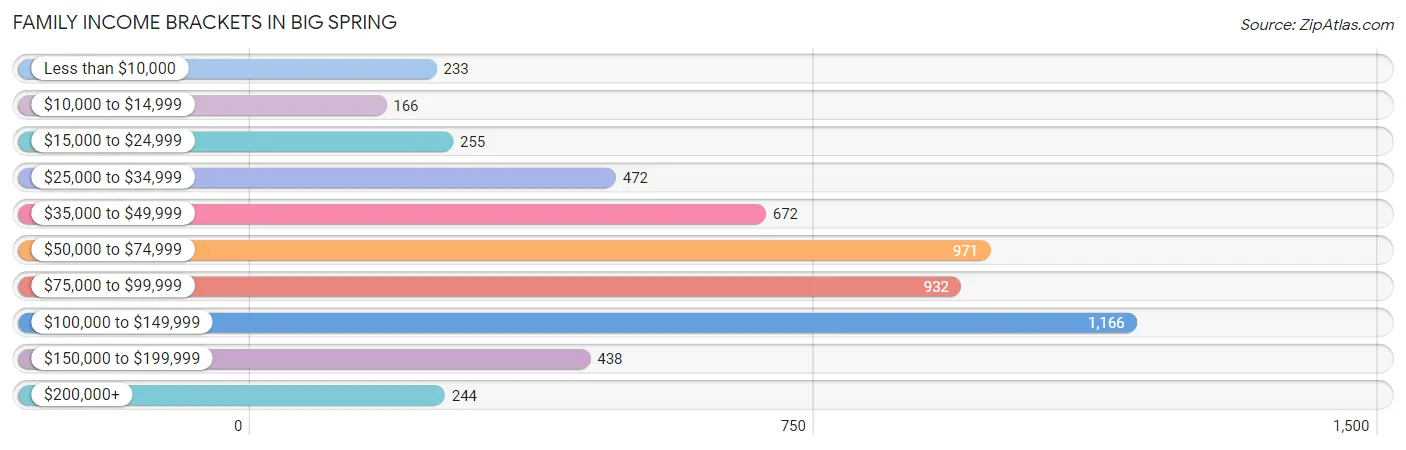
| Income Bracket | # Families | % Families |
| Less than $10,000 | 233 | 4.2% |
| $10,000 to $14,999 | 166 | 3.0% |
| $15,000 to $24,999 | 255 | 4.6% |
| $25,000 to $34,999 | 472 | 8.5% |
| $35,000 to $49,999 | 672 | 12.1% |
| $50,000 to $74,999 | 971 | 17.5% |
| $75,000 to $99,999 | 932 | 16.8% |
| $100,000 to $149,999 | 1,166 | 21.0% |
| $150,000 to $199,999 | 438 | 7.9% |
| $200,000+ | 244 | 4.4% |
Family Income by Famaliy Size in Big Spring
5-person families (711 | 12.8%) account for the highest median family income in Big Spring with $112,981 per family, while 2-person families (2,384 | 42.9%) have the highest median income of $35,802 per family member.
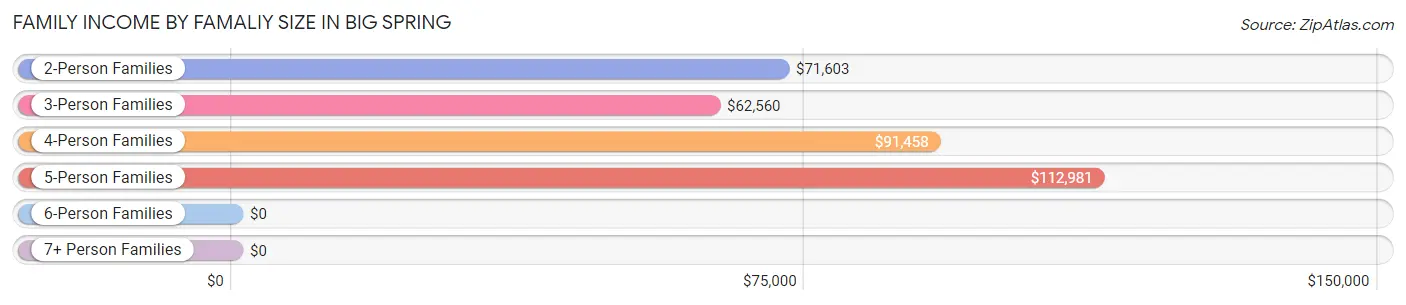
| Income Bracket | # Families | Median Income |
| 2-Person Families | 2,384 (42.9%) | $71,603 |
| 3-Person Families | 1,235 (22.3%) | $62,560 |
| 4-Person Families | 1,106 (19.9%) | $91,458 |
| 5-Person Families | 711 (12.8%) | $112,981 |
| 6-Person Families | 109 (2.0%) | $0 |
| 7+ Person Families | 5 (0.1%) | $0 |
| Total | 5,550 (100.0%) | $75,192 |
Family Income by Number of Earners in Big Spring
The median family income in Big Spring is $75,192, with families comprising 3+ earners (568) having the highest median family income of $122,532, while families with no earners (698) have the lowest median family income of $44,898, accounting for 10.2% and 12.6% of families, respectively.
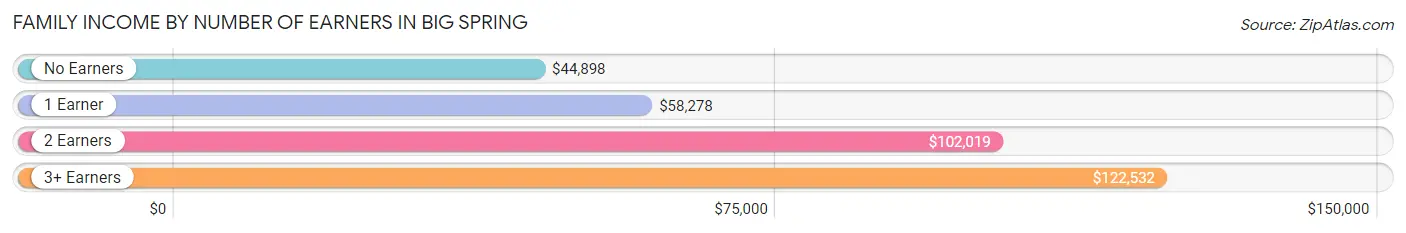
| Number of Earners | # Families | Median Income |
| No Earners | 698 (12.6%) | $44,898 |
| 1 Earner | 2,483 (44.7%) | $58,278 |
| 2 Earners | 1,801 (32.5%) | $102,019 |
| 3+ Earners | 568 (10.2%) | $122,532 |
| Total | 5,550 (100.0%) | $75,192 |
Household Income in Big Spring
Household Income Brackets in Big Spring
With 1,726 households falling in the category, the $50,000 to $74,999 income range is the most frequent in Big Spring, accounting for 19.5% of all households. In contrast, only 416 households (4.7%) fall into the $200,000+ income bracket, making it the least populous group.
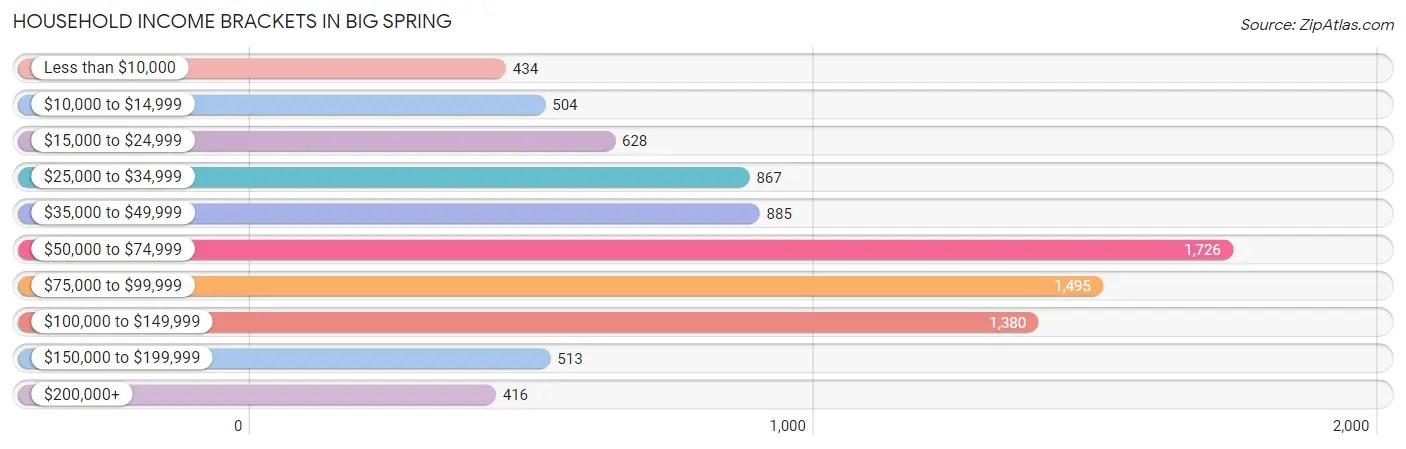
| Income Bracket | # Households | % Households |
| Less than $10,000 | 434 | 4.9% |
| $10,000 to $14,999 | 504 | 5.7% |
| $15,000 to $24,999 | 628 | 7.1% |
| $25,000 to $34,999 | 867 | 9.8% |
| $35,000 to $49,999 | 885 | 10.0% |
| $50,000 to $74,999 | 1,726 | 19.5% |
| $75,000 to $99,999 | 1,495 | 16.9% |
| $100,000 to $149,999 | 1,380 | 15.6% |
| $150,000 to $199,999 | 513 | 5.8% |
| $200,000+ | 416 | 4.7% |
Household Income by Householder Age in Big Spring
The median household income in Big Spring is $65,418, with the highest median household income of $76,900 found in the 25 to 44 years age bracket for the primary householder. A total of 3,218 households (36.4%) fall into this category. Meanwhile, the 65+ years age bracket for the primary householder has the lowest median household income of $45,110, with 1,675 households (18.9%) in this group.
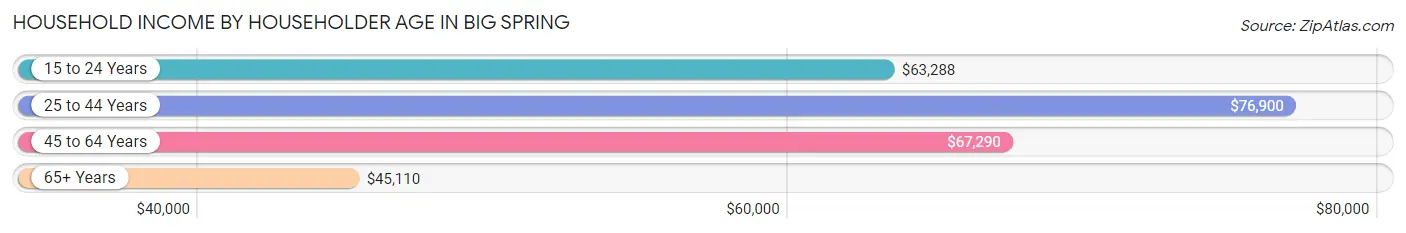
| Income Bracket | # Households | Median Income |
| 15 to 24 Years | 591 (6.7%) | $63,288 |
| 25 to 44 Years | 3,218 (36.4%) | $76,900 |
| 45 to 64 Years | 3,365 (38.0%) | $67,290 |
| 65+ Years | 1,675 (18.9%) | $45,110 |
| Total | 8,849 (100.0%) | $65,418 |
Poverty in Big Spring
Income Below Poverty by Sex and Age in Big Spring
With 15.0% poverty level for males and 20.4% for females among the residents of Big Spring, 15 year old males and 15 year old females are the most vulnerable to poverty, with 43 males (32.1%) and 41 females (50.0%) in their respective age groups living below the poverty level.
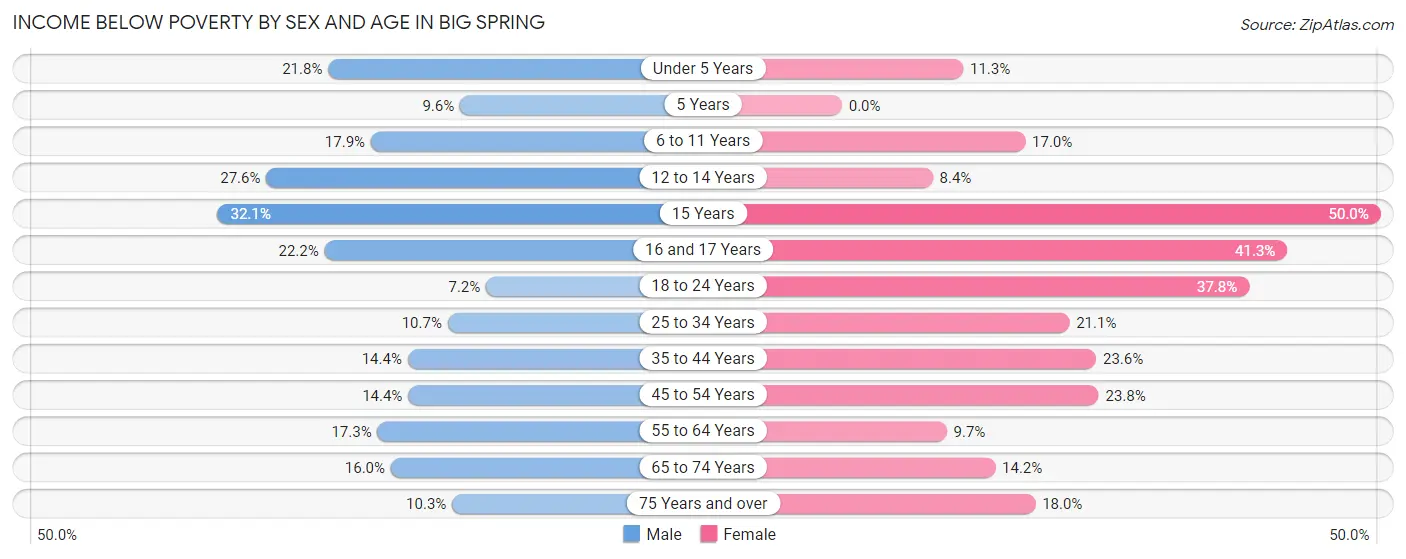
| Age Bracket | Male | Female |
| Under 5 Years | 161 (21.8%) | 91 (11.3%) |
| 5 Years | 14 (9.6%) | 0 (0.0%) |
| 6 to 11 Years | 194 (17.9%) | 171 (17.0%) |
| 12 to 14 Years | 118 (27.6%) | 28 (8.4%) |
| 15 Years | 43 (32.1%) | 41 (50.0%) |
| 16 and 17 Years | 76 (22.2%) | 93 (41.3%) |
| 18 to 24 Years | 78 (7.2%) | 404 (37.8%) |
| 25 to 34 Years | 190 (10.7%) | 347 (21.1%) |
| 35 to 44 Years | 203 (14.4%) | 396 (23.6%) |
| 45 to 54 Years | 261 (14.4%) | 289 (23.8%) |
| 55 to 64 Years | 201 (17.2%) | 117 (9.7%) |
| 65 to 74 Years | 113 (16.0%) | 115 (14.2%) |
| 75 Years and over | 52 (10.3%) | 100 (17.9%) |
| Total | 1,704 (15.0%) | 2,192 (20.4%) |
Income Above Poverty by Sex and Age in Big Spring
According to the poverty statistics in Big Spring, males aged 18 to 24 years and females aged 5 years are the age groups that are most secure financially, with 92.8% of males and 100.0% of females in these age groups living above the poverty line.
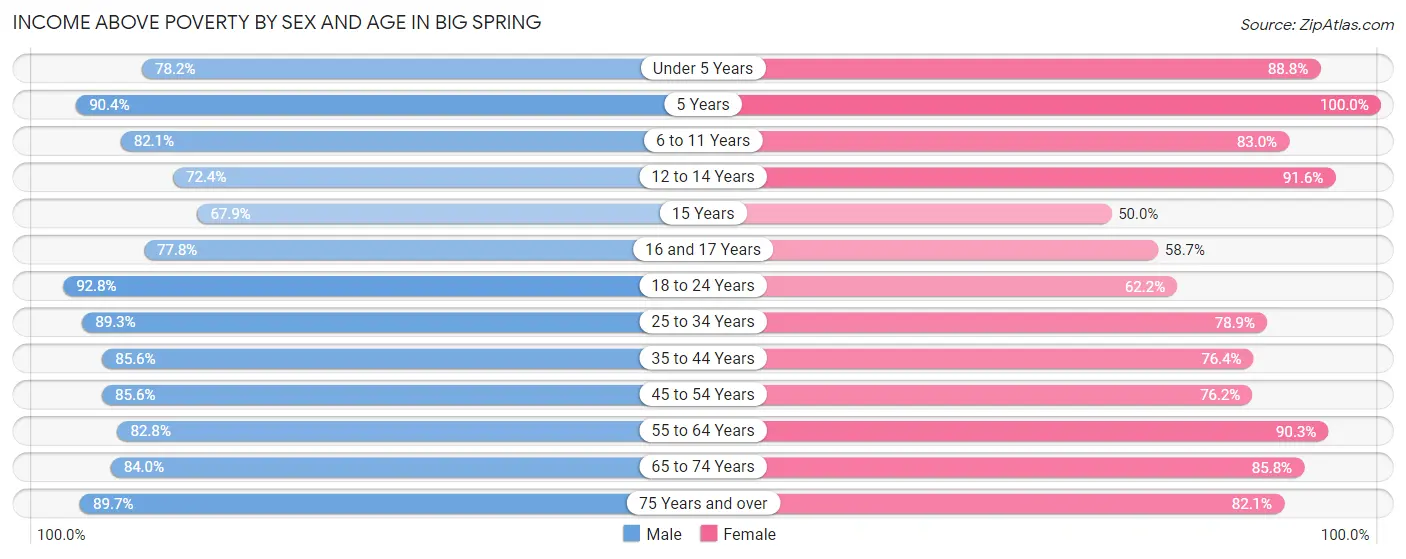
| Age Bracket | Male | Female |
| Under 5 Years | 577 (78.2%) | 718 (88.7%) |
| 5 Years | 132 (90.4%) | 121 (100.0%) |
| 6 to 11 Years | 892 (82.1%) | 834 (83.0%) |
| 12 to 14 Years | 310 (72.4%) | 304 (91.6%) |
| 15 Years | 91 (67.9%) | 41 (50.0%) |
| 16 and 17 Years | 267 (77.8%) | 132 (58.7%) |
| 18 to 24 Years | 1,010 (92.8%) | 665 (62.2%) |
| 25 to 34 Years | 1,580 (89.3%) | 1,297 (78.9%) |
| 35 to 44 Years | 1,203 (85.6%) | 1,282 (76.4%) |
| 45 to 54 Years | 1,552 (85.6%) | 924 (76.2%) |
| 55 to 64 Years | 964 (82.8%) | 1,086 (90.3%) |
| 65 to 74 Years | 593 (84.0%) | 693 (85.8%) |
| 75 Years and over | 452 (89.7%) | 457 (82.1%) |
| Total | 9,623 (85.0%) | 8,554 (79.6%) |
Income Below Poverty Among Married-Couple Families in Big Spring
The poverty statistics for married-couple families in Big Spring show that 6.4% or 240 of the total 3,745 families live below the poverty line. Families with 3 or 4 children have the highest poverty rate of 17.8%, comprising of 52 families. On the other hand, families with 1 or 2 children have the lowest poverty rate of 1.8%, which includes 28 families.
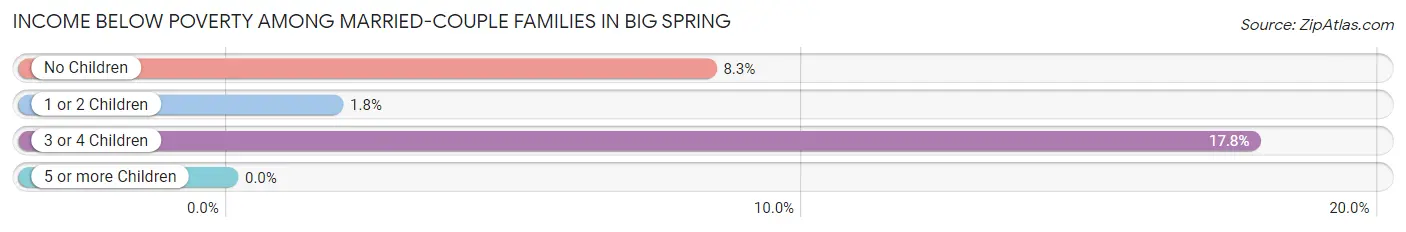
| Children | Above Poverty | Below Poverty |
| No Children | 1,760 (91.7%) | 160 (8.3%) |
| 1 or 2 Children | 1,505 (98.2%) | 28 (1.8%) |
| 3 or 4 Children | 240 (82.2%) | 52 (17.8%) |
| 5 or more Children | 0 (0.0%) | 0 (0.0%) |
| Total | 3,505 (93.6%) | 240 (6.4%) |
Income Below Poverty Among Single-Parent Households in Big Spring
According to the poverty data in Big Spring, 4.7% or 32 single-father households and 38.6% or 435 single-mother households are living below the poverty line. Among single-father households, those with 3 or 4 children have the highest poverty rate, with 32 households (35.6%) experiencing poverty. Likewise, among single-mother households, those with 5 or more children have the highest poverty rate, with 5 households (100.0%) falling below the poverty line.
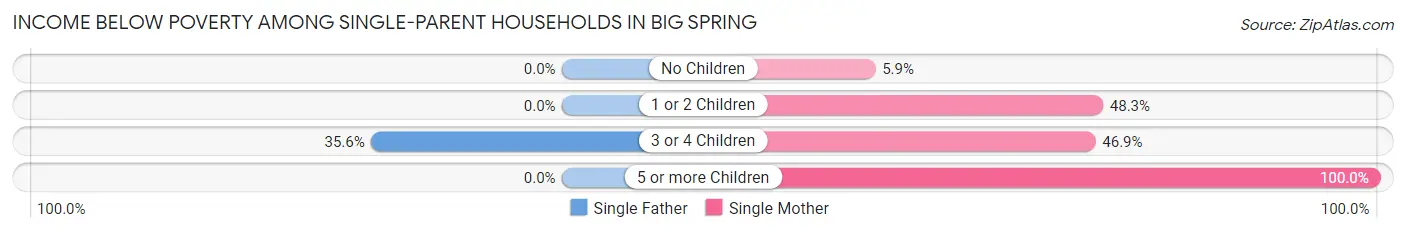
| Children | Single Father | Single Mother |
| No Children | 0 (0.0%) | 15 (5.9%) |
| 1 or 2 Children | 0 (0.0%) | 295 (48.3%) |
| 3 or 4 Children | 32 (35.6%) | 120 (46.9%) |
| 5 or more Children | 0 (0.0%) | 5 (100.0%) |
| Total | 32 (4.7%) | 435 (38.6%) |
Income Below Poverty Among Married-Couple vs Single-Parent Households in Big Spring
The poverty data for Big Spring shows that 240 of the married-couple family households (6.4%) and 467 of the single-parent households (25.9%) are living below the poverty level. Within the married-couple family households, those with 3 or 4 children have the highest poverty rate, with 52 households (17.8%) falling below the poverty line. Among the single-parent households, those with 5 or more children have the highest poverty rate, with 5 household (100.0%) living below poverty.
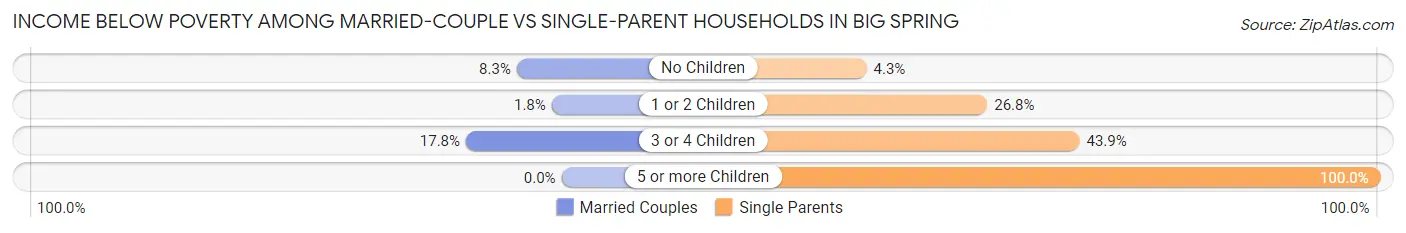
| Children | Married-Couple Families | Single-Parent Households |
| No Children | 160 (8.3%) | 15 (4.3%) |
| 1 or 2 Children | 28 (1.8%) | 295 (26.8%) |
| 3 or 4 Children | 52 (17.8%) | 152 (43.9%) |
| 5 or more Children | 0 (0.0%) | 5 (100.0%) |
| Total | 240 (6.4%) | 467 (25.9%) |
Race in Big Spring
The most populous races in Big Spring are White / Caucasian (18,306 | 70.6%), Hispanic or Latino (12,834 | 49.5%), and Two or more Races (2,852 | 11.0%).
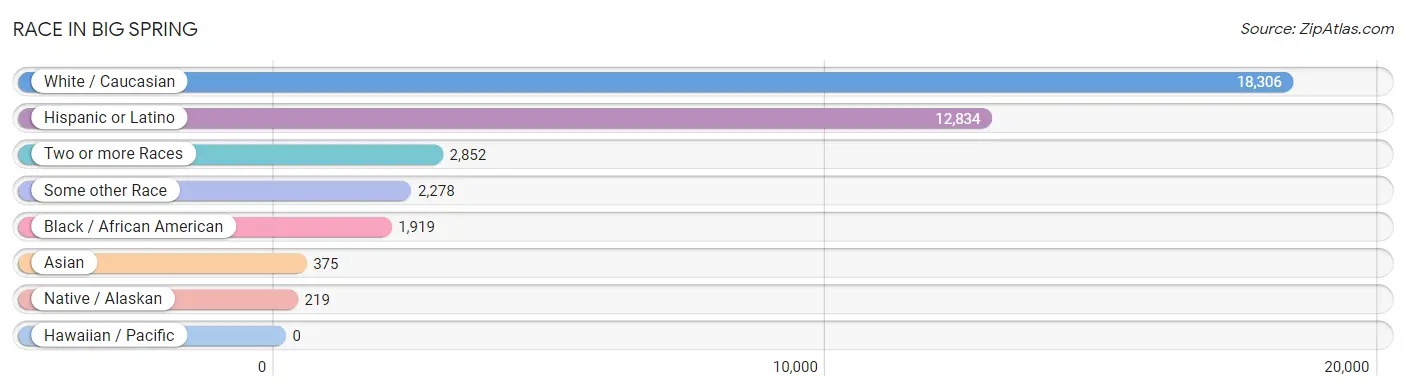
| Race | # Population | % Population |
| Asian | 375 | 1.5% |
| Black / African American | 1,919 | 7.4% |
| Hawaiian / Pacific | 0 | 0.0% |
| Hispanic or Latino | 12,834 | 49.5% |
| Native / Alaskan | 219 | 0.8% |
| White / Caucasian | 18,306 | 70.6% |
| Two or more Races | 2,852 | 11.0% |
| Some other Race | 2,278 | 8.8% |
| Total | 25,949 | 100.0% |
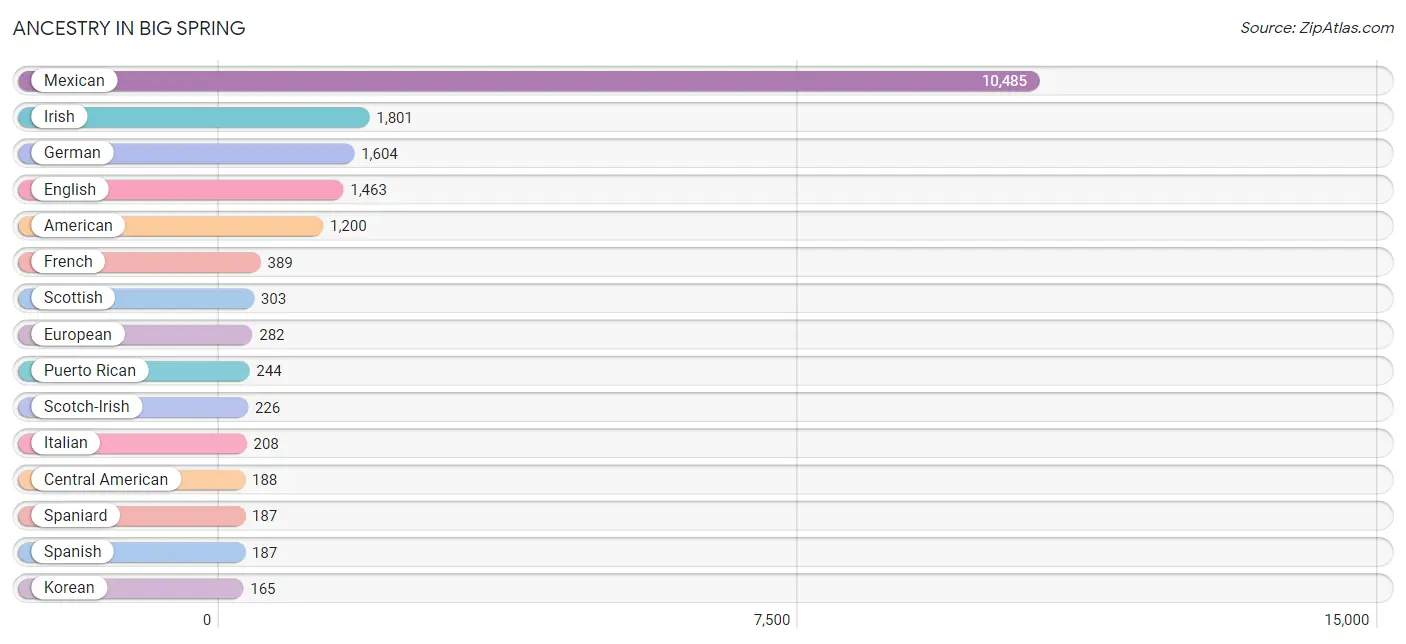
Ancestry in Big Spring
The most populous ancestries reported in Big Spring are Mexican (10,485 | 40.4%), Irish (1,801 | 6.9%), German (1,604 | 6.2%), English (1,463 | 5.6%), and American (1,200 | 4.6%), together accounting for 63.8% of all Big Spring residents.
| Ancestry | # Population | % Population |
| African | 58 | 0.2% |
| Albanian | 10 | 0.0% |
| American | 1,200 | 4.6% |
| Apache | 17 | 0.1% |
| Argentinean | 6 | 0.0% |
| Armenian | 6 | 0.0% |
| Austrian | 7 | 0.0% |
| Belgian | 10 | 0.0% |
| Blackfeet | 56 | 0.2% |
| Bolivian | 10 | 0.0% |
| British | 41 | 0.2% |
| Burmese | 86 | 0.3% |
| Canadian | 10 | 0.0% |
| Central American | 188 | 0.7% |
| Central American Indian | 1 | 0.0% |
| Cherokee | 101 | 0.4% |
| Chickasaw | 49 | 0.2% |
| Colombian | 35 | 0.1% |
| Comanche | 13 | 0.1% |
| Cuban | 47 | 0.2% |
| Czech | 10 | 0.0% |
| Danish | 49 | 0.2% |
| Dutch | 83 | 0.3% |
| English | 1,463 | 5.6% |
| European | 282 | 1.1% |
| French | 389 | 1.5% |
| French Canadian | 49 | 0.2% |
| German | 1,604 | 6.2% |
| Greek | 78 | 0.3% |
| Guatemalan | 111 | 0.4% |
| Honduran | 30 | 0.1% |
| Hungarian | 16 | 0.1% |
| Indian (Asian) | 30 | 0.1% |
| Irish | 1,801 | 6.9% |
| Israeli | 18 | 0.1% |
| Italian | 208 | 0.8% |
| Jamaican | 45 | 0.2% |
| Korean | 165 | 0.6% |
| Mexican | 10,485 | 40.4% |
| Mexican American Indian | 11 | 0.0% |
| Nicaraguan | 16 | 0.1% |
| Nigerian | 50 | 0.2% |
| Northern European | 16 | 0.1% |
| Norwegian | 74 | 0.3% |
| Pakistani | 52 | 0.2% |
| Polish | 147 | 0.6% |
| Puerto Rican | 244 | 0.9% |
| Russian | 36 | 0.1% |
| Salvadoran | 23 | 0.1% |
| Scandinavian | 30 | 0.1% |
| Scotch-Irish | 226 | 0.9% |
| Scottish | 303 | 1.2% |
| Slavic | 6 | 0.0% |
| South African | 6 | 0.0% |
| South American | 65 | 0.3% |
| Spaniard | 187 | 0.7% |
| Spanish | 187 | 0.7% |
| Spanish American | 12 | 0.1% |
| Subsaharan African | 153 | 0.6% |
| Swedish | 7 | 0.0% |
| Swiss | 11 | 0.0% |
| Thai | 8 | 0.0% |
| Ukrainian | 64 | 0.3% |
| Venezuelan | 14 | 0.1% |
| Vietnamese | 104 | 0.4% |
| Welsh | 74 | 0.3% | View All 66 Rows |
Immigrants in Big Spring
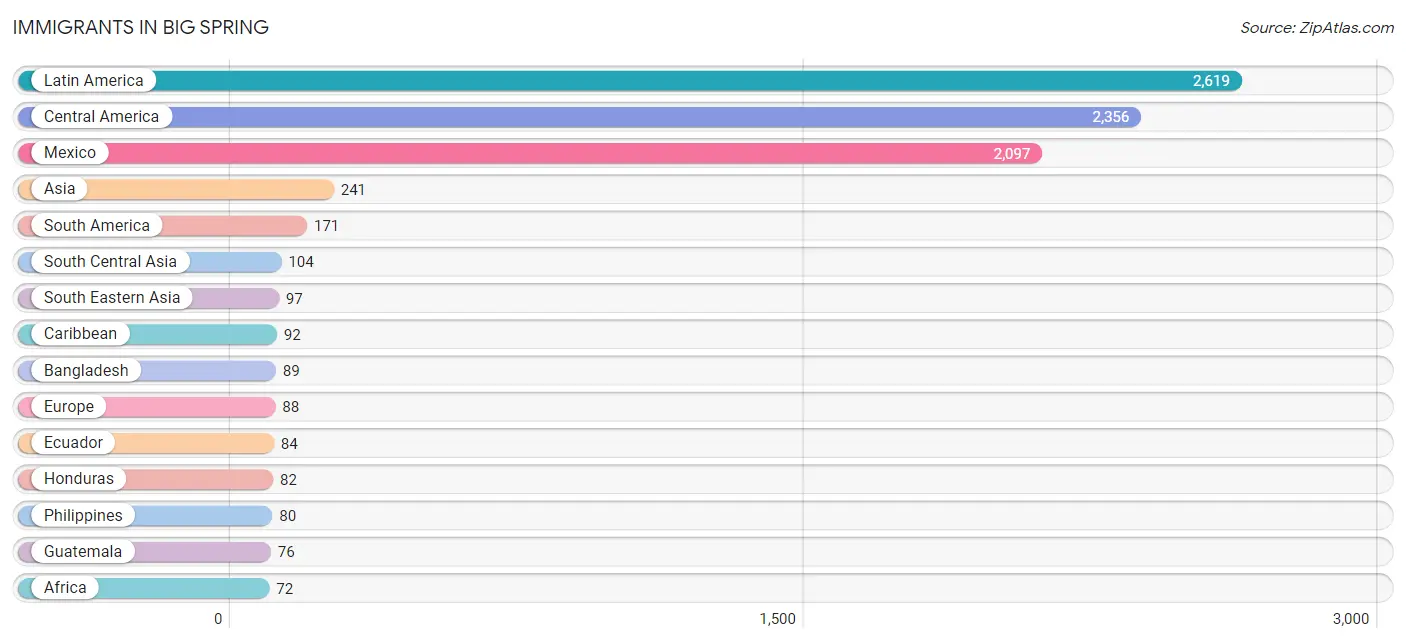
The most numerous immigrant groups reported in Big Spring came from Latin America (2,619 | 10.1%), Central America (2,356 | 9.1%), Mexico (2,097 | 8.1%), Asia (241 | 0.9%), and South America (171 | 0.7%), together accounting for 28.8% of all Big Spring residents.
| Immigration Origin | # Population | % Population |
| Africa | 72 | 0.3% |
| Albania | 10 | 0.0% |
| Argentina | 6 | 0.0% |
| Asia | 241 | 0.9% |
| Australia | 23 | 0.1% |
| Bahamas | 10 | 0.0% |
| Bangladesh | 89 | 0.3% |
| Belize | 19 | 0.1% |
| Bolivia | 10 | 0.0% |
| Cameroon | 39 | 0.2% |
| Caribbean | 92 | 0.4% |
| Central America | 2,356 | 9.1% |
| China | 13 | 0.1% |
| Colombia | 57 | 0.2% |
| Costa Rica | 6 | 0.0% |
| Cuba | 37 | 0.1% |
| Eastern Asia | 22 | 0.1% |
| Eastern Europe | 19 | 0.1% |
| Ecuador | 84 | 0.3% |
| El Salvador | 60 | 0.2% |
| Europe | 88 | 0.3% |
| France | 27 | 0.1% |
| Germany | 42 | 0.2% |
| Guatemala | 76 | 0.3% |
| Honduras | 82 | 0.3% |
| Hungary | 9 | 0.0% |
| India | 8 | 0.0% |
| Jamaica | 45 | 0.2% |
| Korea | 9 | 0.0% |
| Latin America | 2,619 | 10.1% |
| Mexico | 2,097 | 8.1% |
| Middle Africa | 39 | 0.2% |
| Nicaragua | 16 | 0.1% |
| Nigeria | 16 | 0.1% |
| Oceania | 46 | 0.2% |
| Pakistan | 7 | 0.0% |
| Philippines | 80 | 0.3% |
| South Africa | 6 | 0.0% |
| South America | 171 | 0.7% |
| South Central Asia | 104 | 0.4% |
| South Eastern Asia | 97 | 0.4% |
| Thailand | 17 | 0.1% |
| Venezuela | 14 | 0.1% |
| Western Africa | 27 | 0.1% |
| Western Europe | 69 | 0.3% | View All 45 Rows |
Sex and Age in Big Spring
Sex and Age in Big Spring
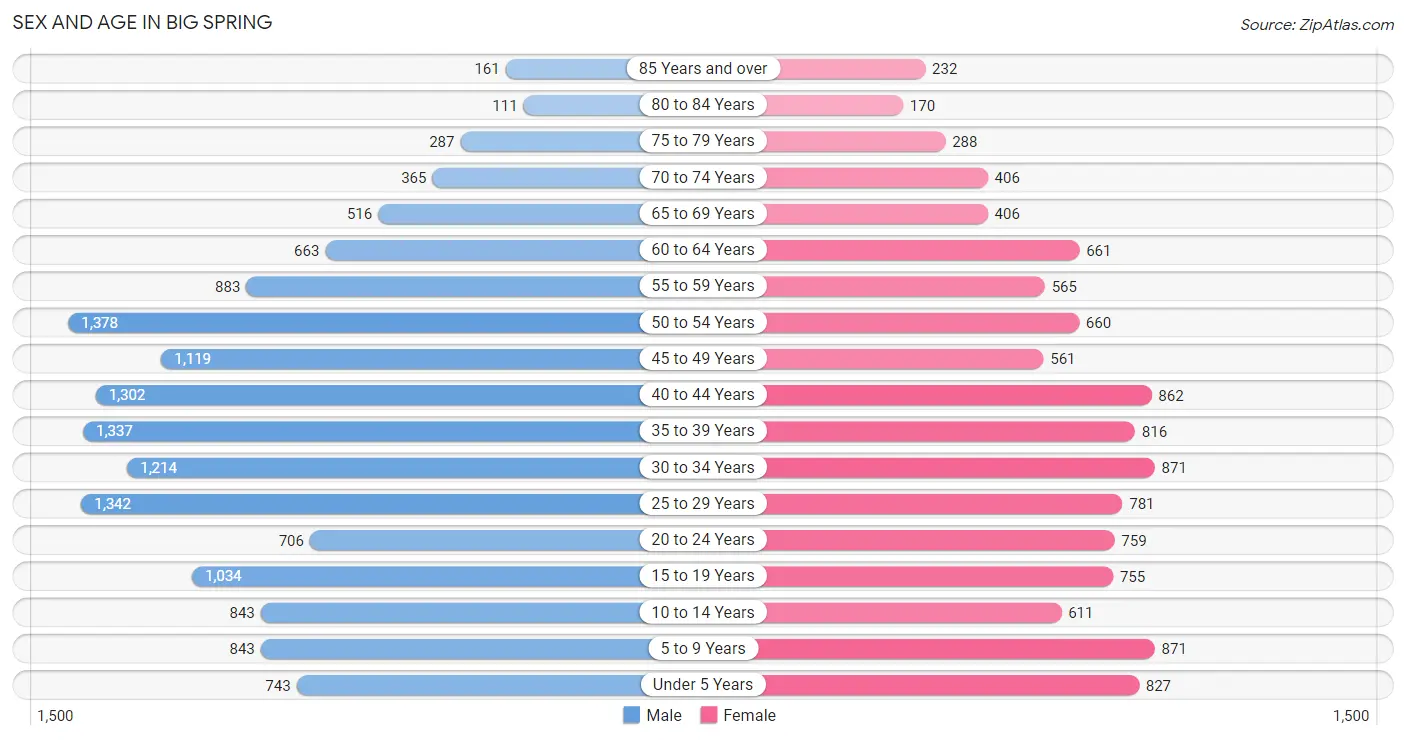
The most populous age groups in Big Spring are 50 to 54 Years (1,378 | 9.3%) for men and 5 to 9 Years (871 | 7.9%) for women.
| Age Bracket | Male | Female |
| Under 5 Years | 743 (5.0%) | 827 (7.4%) |
| 5 to 9 Years | 843 (5.7%) | 871 (7.9%) |
| 10 to 14 Years | 843 (5.7%) | 611 (5.5%) |
| 15 to 19 Years | 1,034 (7.0%) | 755 (6.8%) |
| 20 to 24 Years | 706 (4.8%) | 759 (6.8%) |
| 25 to 29 Years | 1,342 (9.0%) | 781 (7.0%) |
| 30 to 34 Years | 1,214 (8.2%) | 871 (7.9%) |
| 35 to 39 Years | 1,337 (9.0%) | 816 (7.3%) |
| 40 to 44 Years | 1,302 (8.8%) | 862 (7.8%) |
| 45 to 49 Years | 1,119 (7.5%) | 561 (5.1%) |
| 50 to 54 Years | 1,378 (9.3%) | 660 (5.9%) |
| 55 to 59 Years | 883 (5.9%) | 565 (5.1%) |
| 60 to 64 Years | 663 (4.5%) | 661 (5.9%) |
| 65 to 69 Years | 516 (3.5%) | 406 (3.7%) |
| 70 to 74 Years | 365 (2.5%) | 406 (3.7%) |
| 75 to 79 Years | 287 (1.9%) | 288 (2.6%) |
| 80 to 84 Years | 111 (0.7%) | 170 (1.5%) |
| 85 Years and over | 161 (1.1%) | 232 (2.1%) |
| Total | 14,847 (100.0%) | 11,102 (100.0%) |
Families and Households in Big Spring
Median Family Size in Big Spring
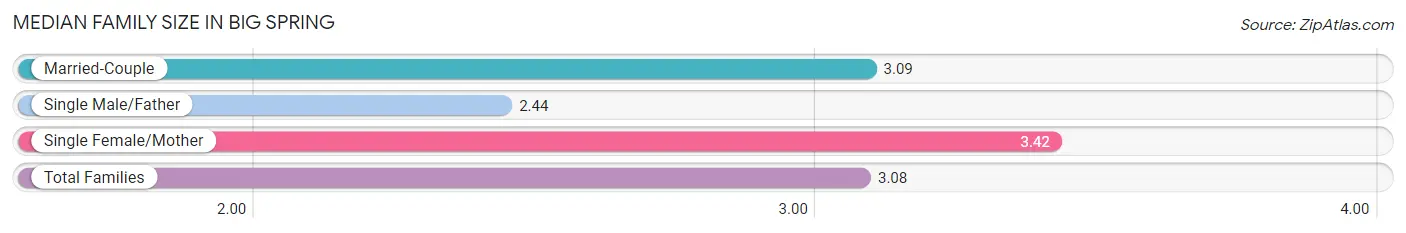
The median family size in Big Spring is 3.08 persons per family, with single female/mother families (1,127 | 20.3%) accounting for the largest median family size of 3.42 persons per family. On the other hand, single male/father families (678 | 12.2%) represent the smallest median family size with 2.44 persons per family.
| Family Type | # Families | Family Size |
| Married-Couple | 3,745 (67.5%) | 3.09 |
| Single Male/Father | 678 (12.2%) | 2.44 |
| Single Female/Mother | 1,127 (20.3%) | 3.42 |
| Total Families | 5,550 (100.0%) | 3.08 |
Median Household Size in Big Spring
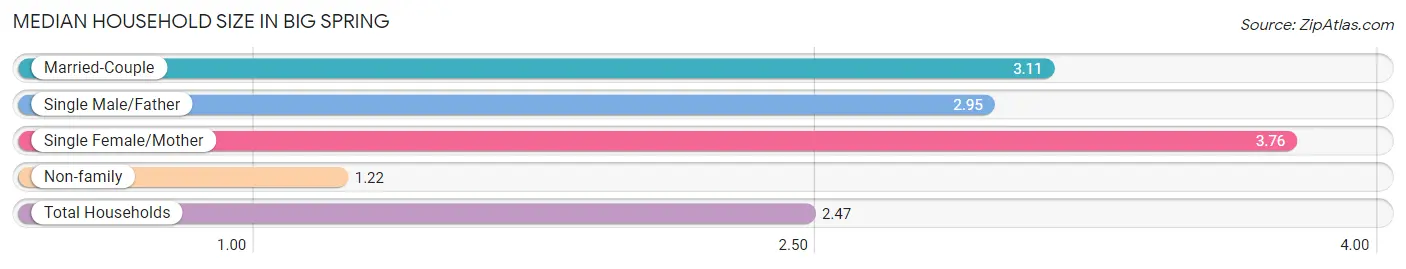
The median household size in Big Spring is 2.47 persons per household, with single female/mother households (1,127 | 12.7%) accounting for the largest median household size of 3.76 persons per household. non-family households (3,299 | 37.3%) represent the smallest median household size with 1.22 persons per household.
| Household Type | # Households | Household Size |
| Married-Couple | 3,745 (42.3%) | 3.11 |
| Single Male/Father | 678 (7.7%) | 2.95 |
| Single Female/Mother | 1,127 (12.7%) | 3.76 |
| Non-family | 3,299 (37.3%) | 1.22 |
| Total Households | 8,849 (100.0%) | 2.47 |
Household Size by Marriage Status in Big Spring
Out of a total of 8,849 households in Big Spring, 5,550 (62.7%) are family households, while 3,299 (37.3%) are nonfamily households. The most numerous type of family households are 2-person households, comprising 2,137, and the most common type of nonfamily households are 1-person households, comprising 2,998.
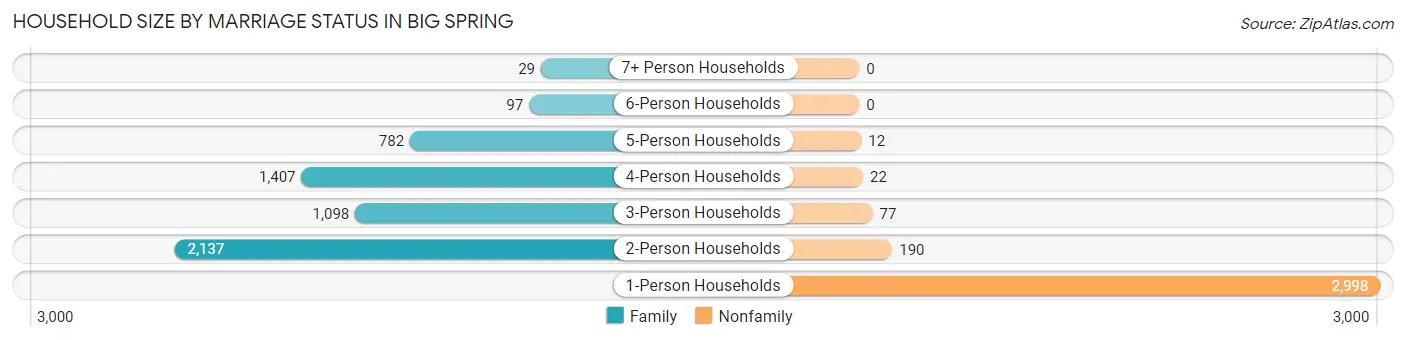
| Household Size | Family Households | Nonfamily Households |
| 1-Person Households | - | 2,998 (33.9%) |
| 2-Person Households | 2,137 (24.1%) | 190 (2.1%) |
| 3-Person Households | 1,098 (12.4%) | 77 (0.9%) |
| 4-Person Households | 1,407 (15.9%) | 22 (0.3%) |
| 5-Person Households | 782 (8.8%) | 12 (0.1%) |
| 6-Person Households | 97 (1.1%) | 0 (0.0%) |
| 7+ Person Households | 29 (0.3%) | 0 (0.0%) |
| Total | 5,550 (62.7%) | 3,299 (37.3%) |
Female Fertility in Big Spring
Fertility by Age in Big Spring
Average fertility rate in Big Spring is 100.0 births per 1,000 women. Women in the age bracket of 20 to 34 years have the highest fertility rate with 197.0 births per 1,000 women. Women in the age bracket of 20 to 34 years acount for 87.0% of all women with births.
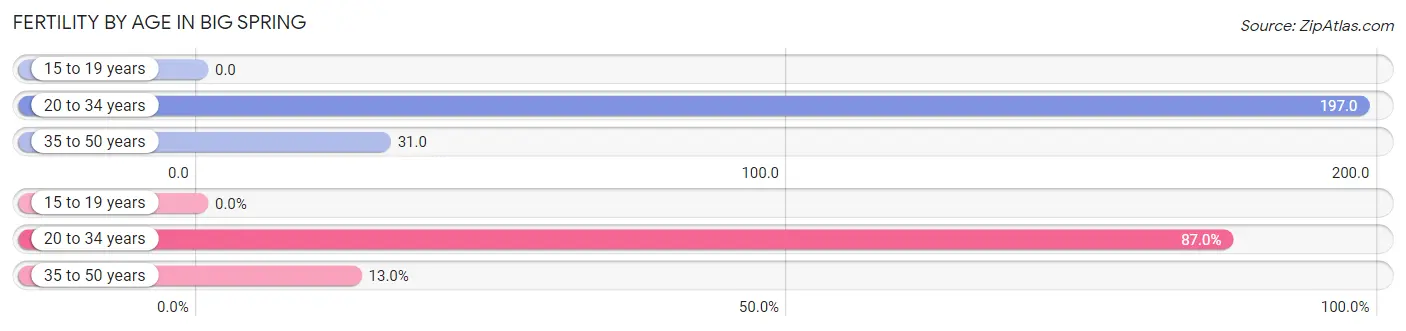
| Age Bracket | Women with Births | Births / 1,000 Women |
| 15 to 19 years | 0 (0.0%) | 0.0 |
| 20 to 34 years | 474 (87.0%) | 197.0 |
| 35 to 50 years | 71 (13.0%) | 31.0 |
| Total | 545 (100.0%) | 100.0 |
Fertility by Age by Marriage Status in Big Spring
40.9% of women with births (545) in Big Spring are married. The highest percentage of unmarried women with births falls into 20 to 34 years age bracket with 64.1% of them unmarried at the time of birth, while the lowest percentage of unmarried women with births belong to 35 to 50 years age bracket with 25.3% of them unmarried.
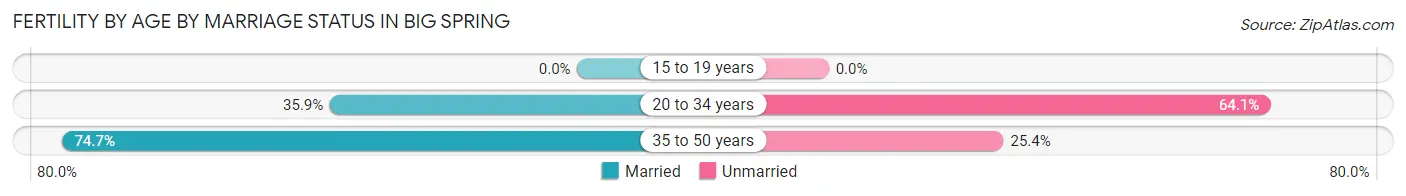
| Age Bracket | Married | Unmarried |
| 15 to 19 years | 0 (0.0%) | 0 (0.0%) |
| 20 to 34 years | 170 (35.9%) | 304 (64.1%) |
| 35 to 50 years | 53 (74.7%) | 18 (25.4%) |
| Total | 223 (40.9%) | 322 (59.1%) |
Fertility by Education in Big Spring
Average fertility rate in Big Spring is 100.0 births per 1,000 women. Women with the education attainment of high school diploma have the highest fertility rate of 151.0 births per 1,000 women, while women with the education attainment of less than high school have the lowest fertility at 41.0 births per 1,000 women. Women with the education attainment of high school diploma represent 49.5% of all women with births.
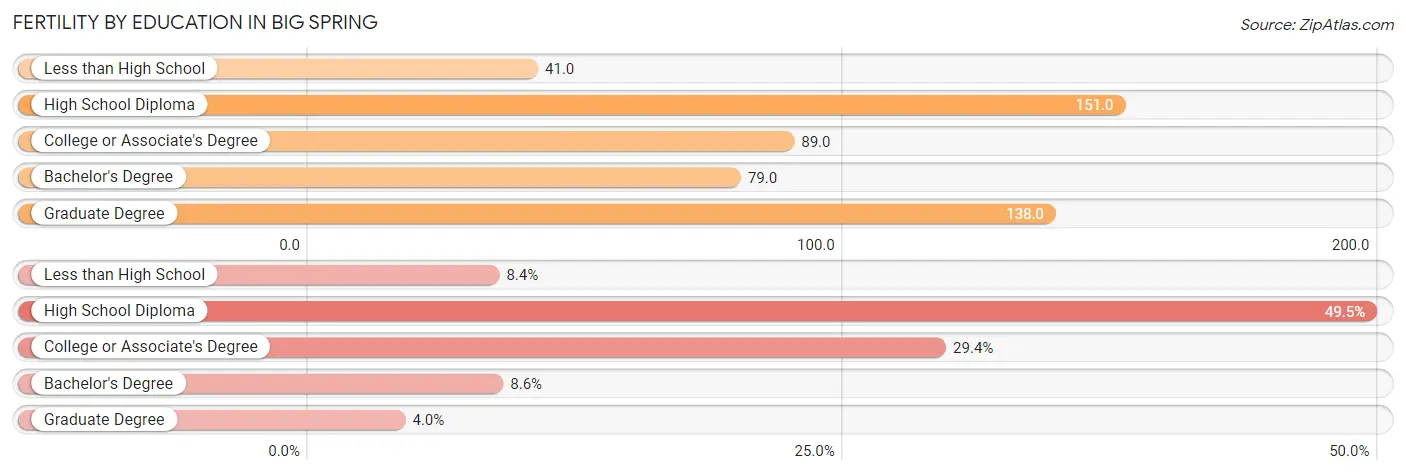
| Educational Attainment | Women with Births | Births / 1,000 Women |
| Less than High School | 46 (8.4%) | 41.0 |
| High School Diploma | 270 (49.5%) | 151.0 |
| College or Associate's Degree | 160 (29.4%) | 89.0 |
| Bachelor's Degree | 47 (8.6%) | 79.0 |
| Graduate Degree | 22 (4.0%) | 138.0 |
| Total | 545 (100.0%) | 100.0 |
Fertility by Education by Marriage Status in Big Spring
59.1% of women with births in Big Spring are unmarried. Women with the educational attainment of graduate degree are most likely to be married with 100.0% of them married at childbirth, while women with the educational attainment of college or associate's degree are least likely to be married with 70.0% of them unmarried at childbirth.
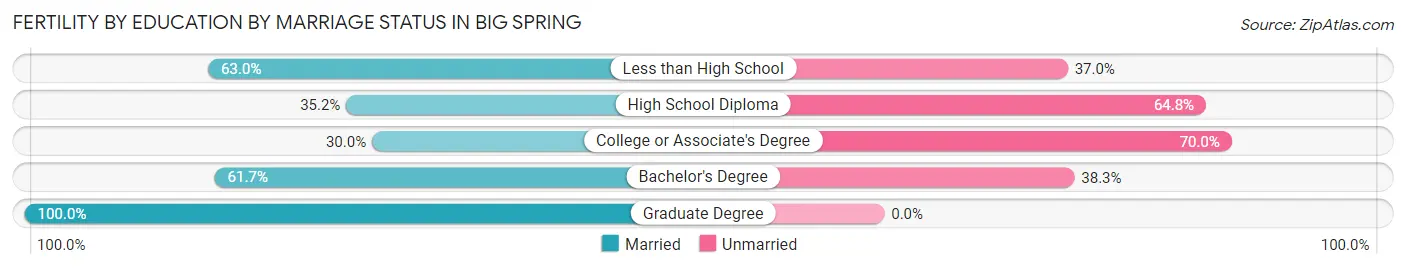
| Educational Attainment | Married | Unmarried |
| Less than High School | 29 (63.0%) | 17 (37.0%) |
| High School Diploma | 95 (35.2%) | 175 (64.8%) |
| College or Associate's Degree | 48 (30.0%) | 112 (70.0%) |
| Bachelor's Degree | 29 (61.7%) | 18 (38.3%) |
| Graduate Degree | 22 (100.0%) | 0 (0.0%) |
| Total | 223 (40.9%) | 322 (59.1%) |
Employment Characteristics in Big Spring
Employment by Class of Employer in Big Spring
Among the 9,771 employed individuals in Big Spring, private company employees (7,211 | 73.8%), local government employees (793 | 8.1%), and state government employees (429 | 4.4%) make up the most common classes of employment.
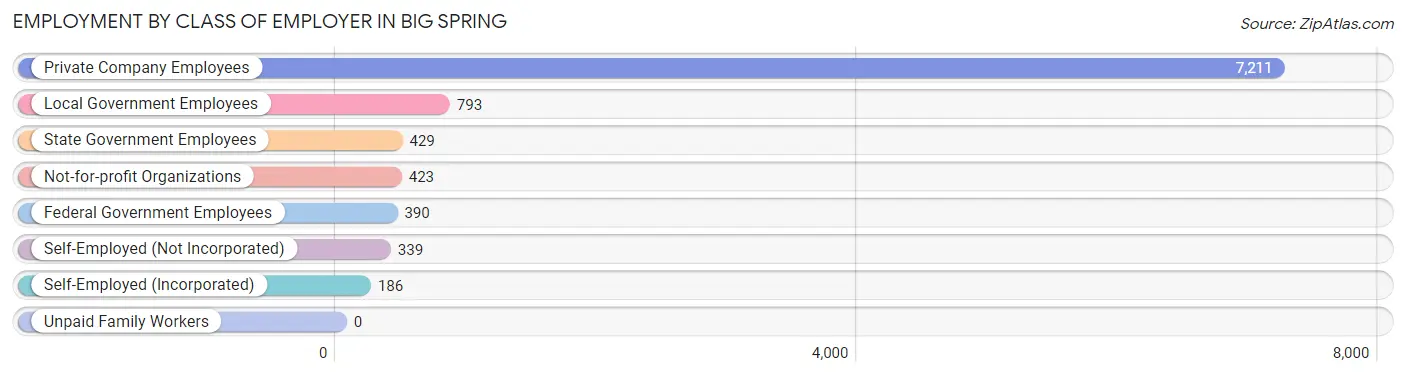
| Employer Class | # Employees | % Employees |
| Private Company Employees | 7,211 | 73.8% |
| Self-Employed (Incorporated) | 186 | 1.9% |
| Self-Employed (Not Incorporated) | 339 | 3.5% |
| Not-for-profit Organizations | 423 | 4.3% |
| Local Government Employees | 793 | 8.1% |
| State Government Employees | 429 | 4.4% |
| Federal Government Employees | 390 | 4.0% |
| Unpaid Family Workers | 0 | 0.0% |
| Total | 9,771 | 100.0% |
Employment Status by Age in Big Spring
According to the labor force statistics for Big Spring, out of the total population over 16 years of age (20,995), 50.3% or 10,560 individuals are in the labor force, with 6.8% or 718 of them unemployed. The age group with the highest labor force participation rate is 25 to 29 years, with 68.1% or 1,446 individuals in the labor force. Within the labor force, the 16 to 19 years age range has the highest percentage of unemployed individuals, with 36.6% or 185 of them being unemployed.
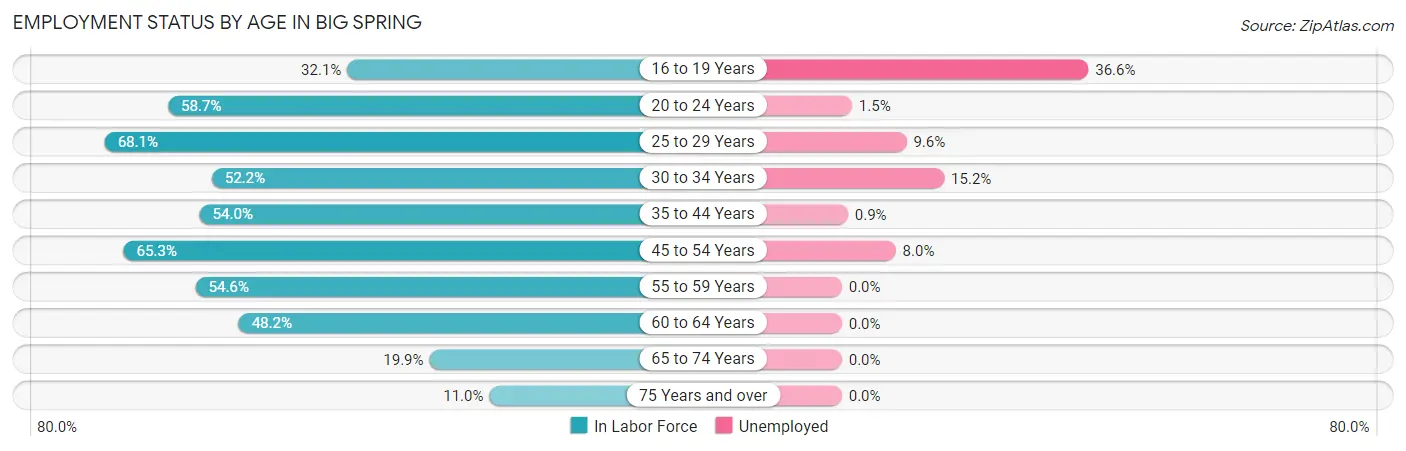
| Age Bracket | In Labor Force | Unemployed |
| 16 to 19 Years | 505 (32.1%) | 185 (36.6%) |
| 20 to 24 Years | 860 (58.7%) | 13 (1.5%) |
| 25 to 29 Years | 1,446 (68.1%) | 139 (9.6%) |
| 30 to 34 Years | 1,088 (52.2%) | 165 (15.2%) |
| 35 to 44 Years | 2,331 (54.0%) | 21 (0.9%) |
| 45 to 54 Years | 2,428 (65.3%) | 194 (8.0%) |
| 55 to 59 Years | 791 (54.6%) | 0 (0.0%) |
| 60 to 64 Years | 638 (48.2%) | 0 (0.0%) |
| 65 to 74 Years | 337 (19.9%) | 0 (0.0%) |
| 75 Years and over | 137 (11.0%) | 0 (0.0%) |
| Total | 10,560 (50.3%) | 718 (6.8%) |
Employment Status by Educational Attainment in Big Spring
According to labor force statistics for Big Spring, 58.1% of individuals (8,724) out of the total population between 25 and 64 years of age (15,015) are in the labor force, with 6.0% or 523 of them being unemployed. The group with the highest labor force participation rate are those with the educational attainment of bachelor's degree or higher, with 81.3% or 1,392 individuals in the labor force. Within the labor force, individuals with less than high school education have the highest percentage of unemployment, with 11.8% or 132 of them being unemployed.
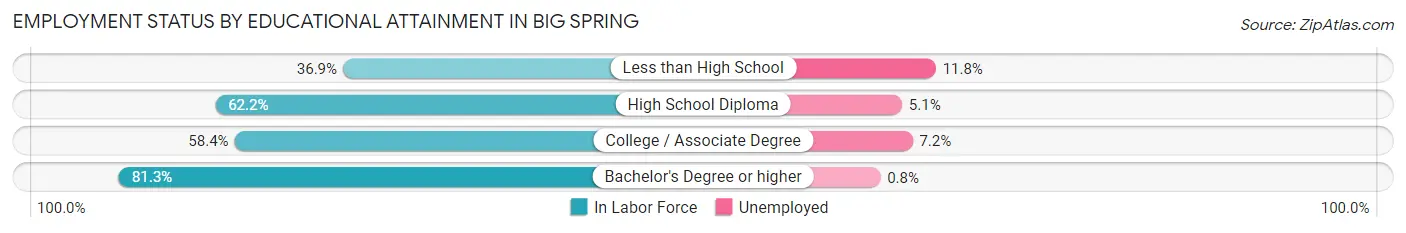
| Educational Attainment | In Labor Force | Unemployed |
| Less than High School | 1,116 (36.9%) | 357 (11.8%) |
| High School Diploma | 3,438 (62.2%) | 282 (5.1%) |
| College / Associate Degree | 2,775 (58.4%) | 342 (7.2%) |
| Bachelor's Degree or higher | 1,392 (81.3%) | 14 (0.8%) |
| Total | 8,724 (58.1%) | 901 (6.0%) |
Employment Occupations by Sex in Big Spring
Management, Business, Science and Arts Occupations
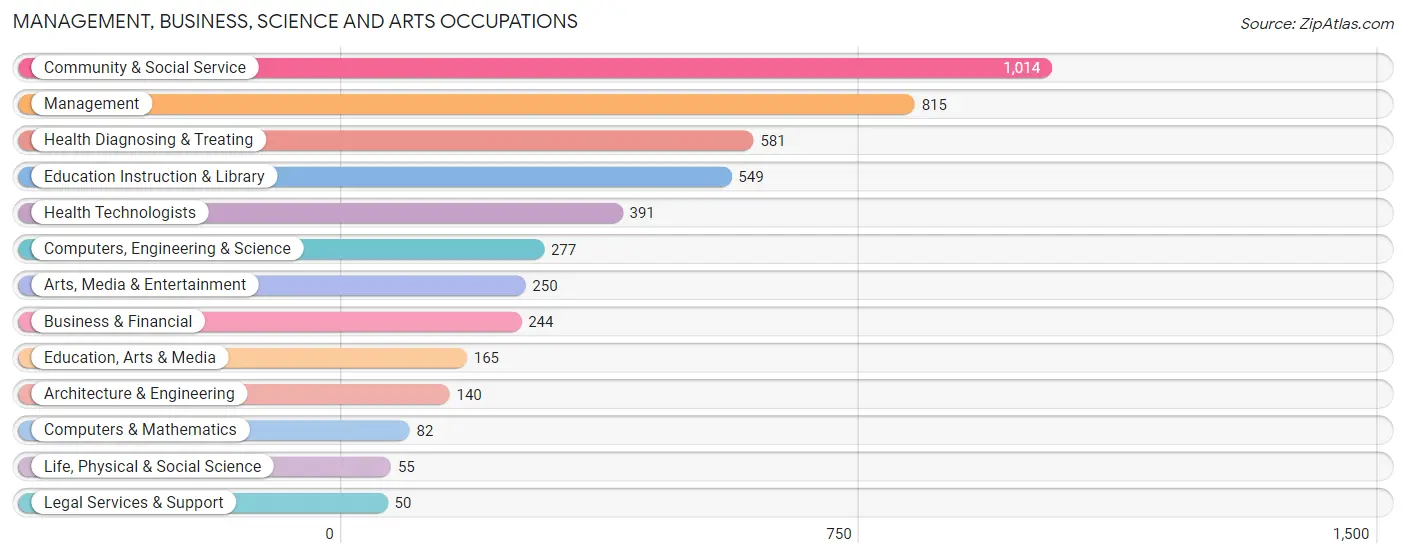
The most common Management, Business, Science and Arts occupations in Big Spring are Community & Social Service (1,014 | 10.3%), Management (815 | 8.3%), Health Diagnosing & Treating (581 | 5.9%), Education Instruction & Library (549 | 5.6%), and Health Technologists (391 | 4.0%).
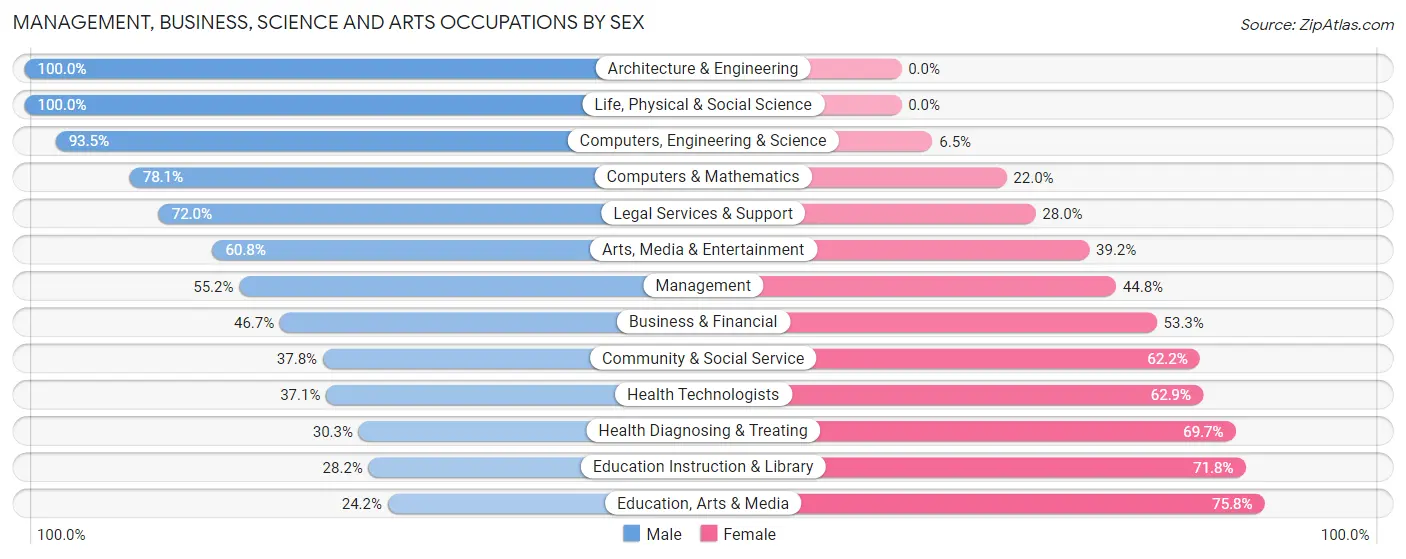
Management, Business, Science and Arts Occupations by Sex
Within the Management, Business, Science and Arts occupations in Big Spring, the most male-oriented occupations are Architecture & Engineering (100.0%), Life, Physical & Social Science (100.0%), and Computers, Engineering & Science (93.5%), while the most female-oriented occupations are Education, Arts & Media (75.8%), Education Instruction & Library (71.8%), and Health Diagnosing & Treating (69.7%).
| Occupation | Male | Female |
| Management | 450 (55.2%) | 365 (44.8%) |
| Business & Financial | 114 (46.7%) | 130 (53.3%) |
| Computers, Engineering & Science | 259 (93.5%) | 18 (6.5%) |
| Computers & Mathematics | 64 (78.0%) | 18 (22.0%) |
| Architecture & Engineering | 140 (100.0%) | 0 (0.0%) |
| Life, Physical & Social Science | 55 (100.0%) | 0 (0.0%) |
| Community & Social Service | 383 (37.8%) | 631 (62.2%) |
| Education, Arts & Media | 40 (24.2%) | 125 (75.8%) |
| Legal Services & Support | 36 (72.0%) | 14 (28.0%) |
| Education Instruction & Library | 155 (28.2%) | 394 (71.8%) |
| Arts, Media & Entertainment | 152 (60.8%) | 98 (39.2%) |
| Health Diagnosing & Treating | 176 (30.3%) | 405 (69.7%) |
| Health Technologists | 145 (37.1%) | 246 (62.9%) |
| Total (Category) | 1,382 (47.1%) | 1,549 (52.8%) |
| Total (Overall) | 5,741 (58.5%) | 4,072 (41.5%) |
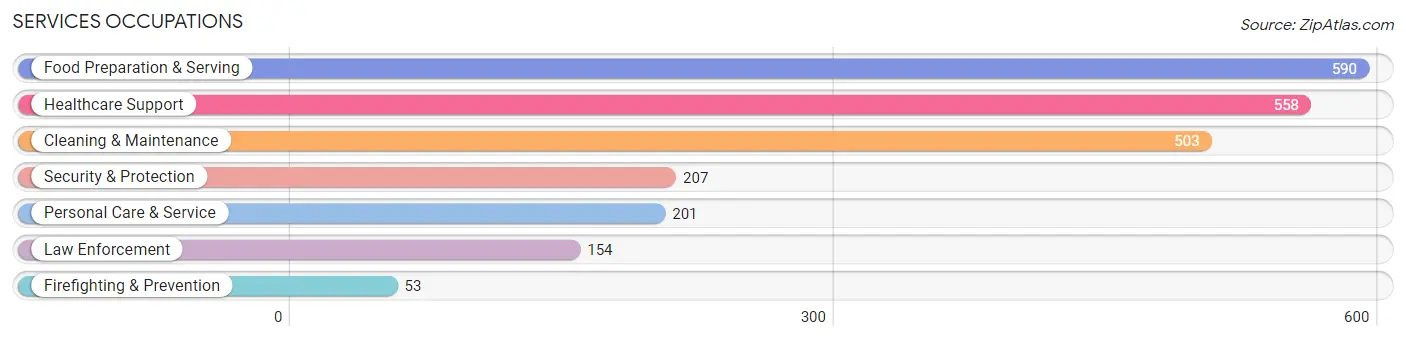
Services Occupations
The most common Services occupations in Big Spring are Food Preparation & Serving (590 | 6.0%), Healthcare Support (558 | 5.7%), Cleaning & Maintenance (503 | 5.1%), Security & Protection (207 | 2.1%), and Personal Care & Service (201 | 2.1%).
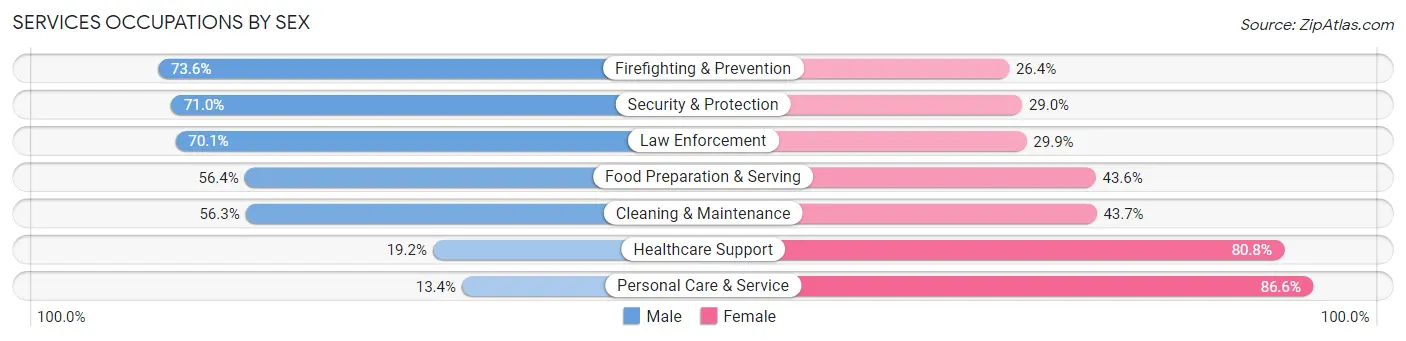
Services Occupations by Sex
Within the Services occupations in Big Spring, the most male-oriented occupations are Firefighting & Prevention (73.6%), Security & Protection (71.0%), and Law Enforcement (70.1%), while the most female-oriented occupations are Personal Care & Service (86.6%), Healthcare Support (80.8%), and Cleaning & Maintenance (43.7%).
| Occupation | Male | Female |
| Healthcare Support | 107 (19.2%) | 451 (80.8%) |
| Security & Protection | 147 (71.0%) | 60 (29.0%) |
| Firefighting & Prevention | 39 (73.6%) | 14 (26.4%) |
| Law Enforcement | 108 (70.1%) | 46 (29.9%) |
| Food Preparation & Serving | 333 (56.4%) | 257 (43.6%) |
| Cleaning & Maintenance | 283 (56.3%) | 220 (43.7%) |
| Personal Care & Service | 27 (13.4%) | 174 (86.6%) |
| Total (Category) | 897 (43.6%) | 1,162 (56.4%) |
| Total (Overall) | 5,741 (58.5%) | 4,072 (41.5%) |
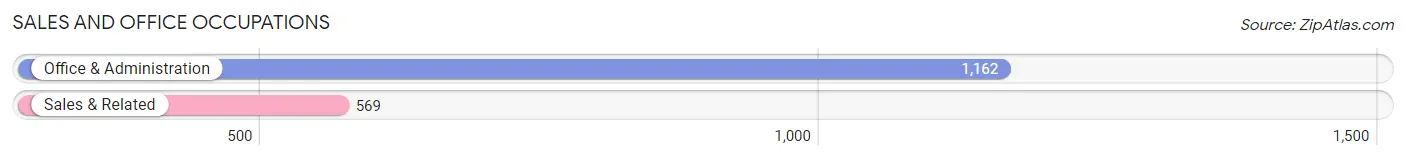
Sales and Office Occupations
The most common Sales and Office occupations in Big Spring are Office & Administration (1,162 | 11.8%), and Sales & Related (569 | 5.8%).
Sales and Office Occupations by Sex
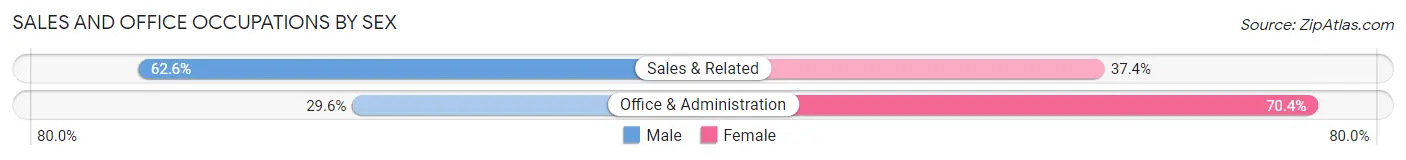
| Occupation | Male | Female |
| Sales & Related | 356 (62.6%) | 213 (37.4%) |
| Office & Administration | 344 (29.6%) | 818 (70.4%) |
| Total (Category) | 700 (40.4%) | 1,031 (59.6%) |
| Total (Overall) | 5,741 (58.5%) | 4,072 (41.5%) |
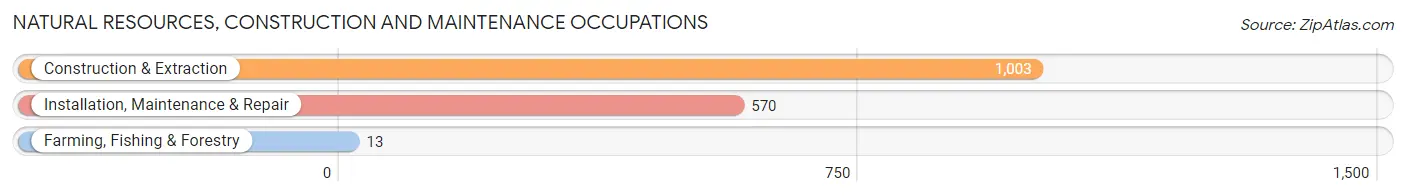
Natural Resources, Construction and Maintenance Occupations
The most common Natural Resources, Construction and Maintenance occupations in Big Spring are Construction & Extraction (1,003 | 10.2%), Installation, Maintenance & Repair (570 | 5.8%), and Farming, Fishing & Forestry (13 | 0.1%).
Natural Resources, Construction and Maintenance Occupations by Sex
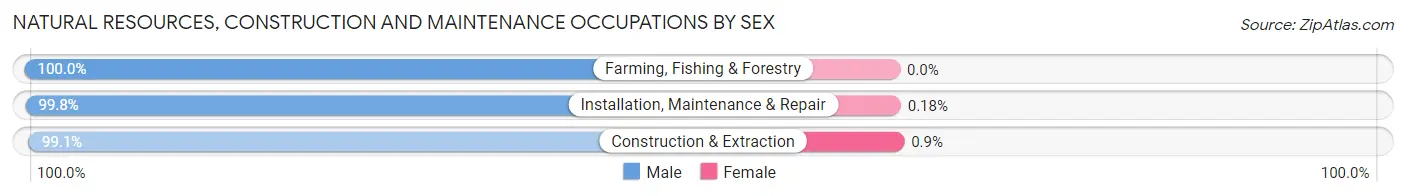
| Occupation | Male | Female |
| Farming, Fishing & Forestry | 13 (100.0%) | 0 (0.0%) |
| Construction & Extraction | 994 (99.1%) | 9 (0.9%) |
| Installation, Maintenance & Repair | 569 (99.8%) | 1 (0.2%) |
| Total (Category) | 1,576 (99.4%) | 10 (0.6%) |
| Total (Overall) | 5,741 (58.5%) | 4,072 (41.5%) |
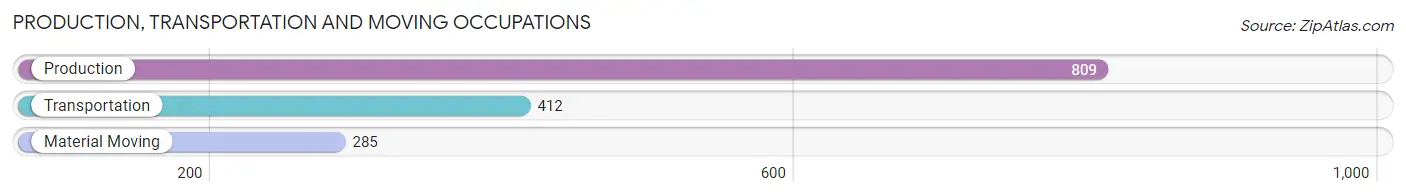
Production, Transportation and Moving Occupations
The most common Production, Transportation and Moving occupations in Big Spring are Production (809 | 8.2%), Transportation (412 | 4.2%), and Material Moving (285 | 2.9%).
Production, Transportation and Moving Occupations by Sex
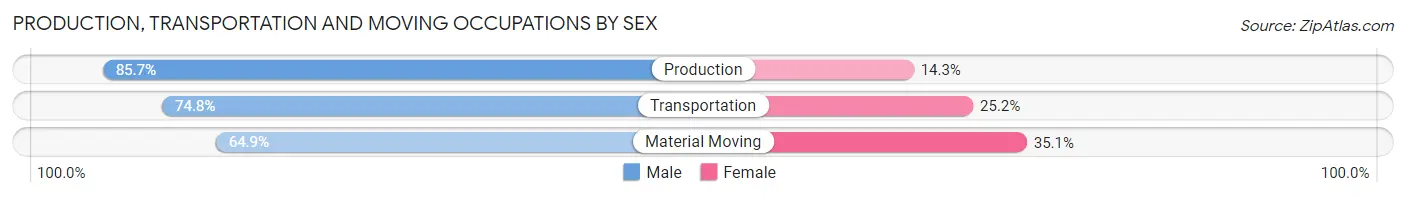
| Occupation | Male | Female |
| Production | 693 (85.7%) | 116 (14.3%) |
| Transportation | 308 (74.8%) | 104 (25.2%) |
| Material Moving | 185 (64.9%) | 100 (35.1%) |
| Total (Category) | 1,186 (78.7%) | 320 (21.2%) |
| Total (Overall) | 5,741 (58.5%) | 4,072 (41.5%) |
Employment Industries by Sex in Big Spring
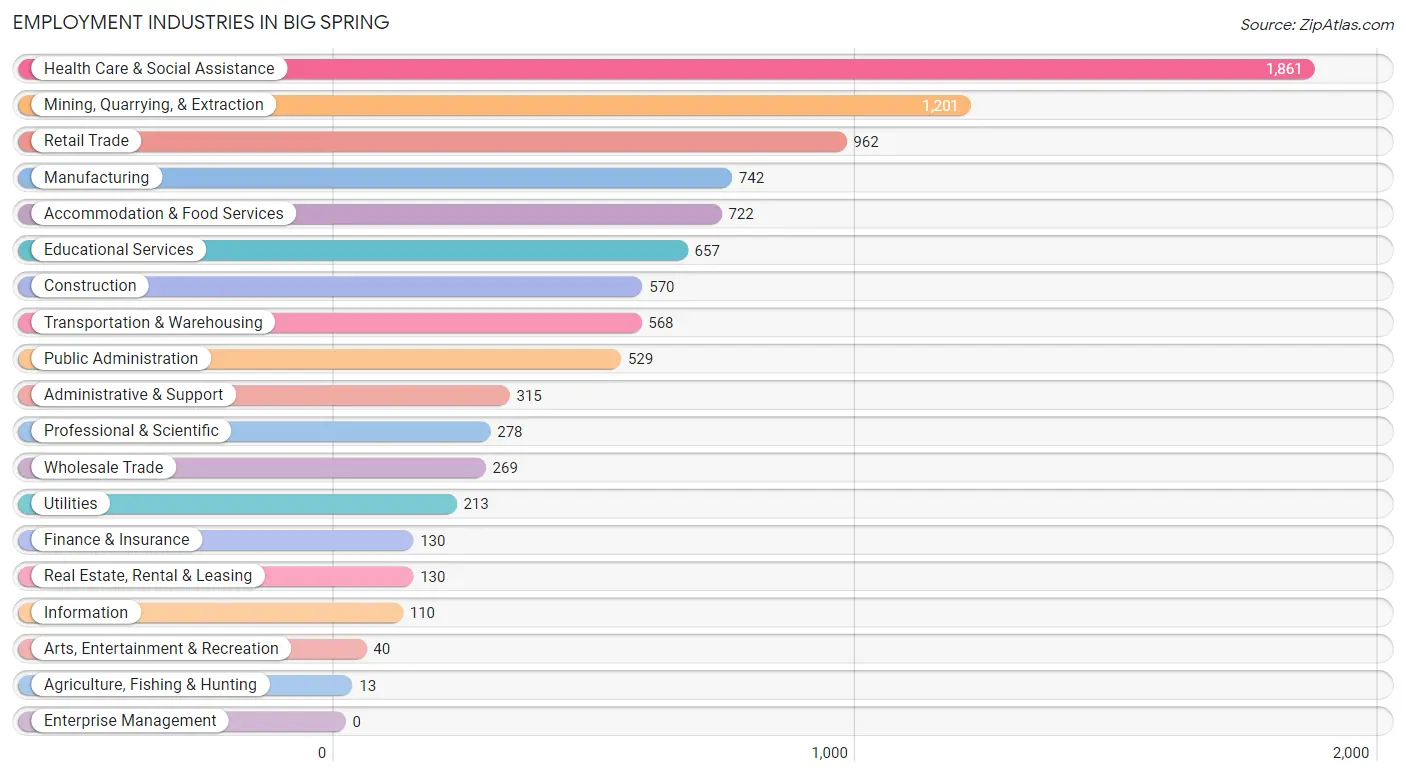
Employment Industries in Big Spring
The major employment industries in Big Spring include Health Care & Social Assistance (1,861 | 19.0%), Mining, Quarrying, & Extraction (1,201 | 12.2%), Retail Trade (962 | 9.8%), Manufacturing (742 | 7.6%), and Accommodation & Food Services (722 | 7.4%).
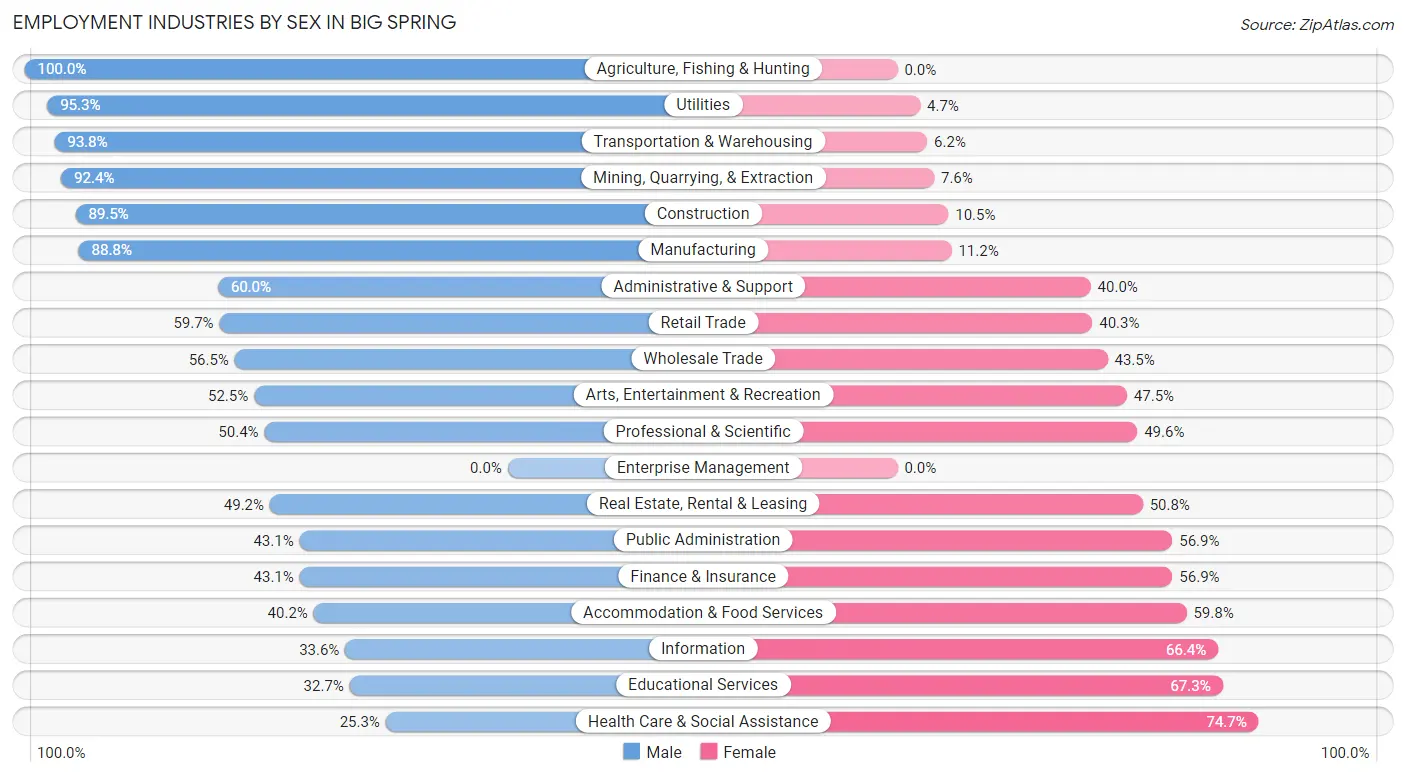
Employment Industries by Sex in Big Spring
The Big Spring industries that see more men than women are Agriculture, Fishing & Hunting (100.0%), Utilities (95.3%), and Transportation & Warehousing (93.8%), whereas the industries that tend to have a higher number of women are Health Care & Social Assistance (74.7%), Educational Services (67.3%), and Information (66.4%).
| Industry | Male | Female |
| Agriculture, Fishing & Hunting | 13 (100.0%) | 0 (0.0%) |
| Mining, Quarrying, & Extraction | 1,110 (92.4%) | 91 (7.6%) |
| Construction | 510 (89.5%) | 60 (10.5%) |
| Manufacturing | 659 (88.8%) | 83 (11.2%) |
| Wholesale Trade | 152 (56.5%) | 117 (43.5%) |
| Retail Trade | 574 (59.7%) | 388 (40.3%) |
| Transportation & Warehousing | 533 (93.8%) | 35 (6.2%) |
| Utilities | 203 (95.3%) | 10 (4.7%) |
| Information | 37 (33.6%) | 73 (66.4%) |
| Finance & Insurance | 56 (43.1%) | 74 (56.9%) |
| Real Estate, Rental & Leasing | 64 (49.2%) | 66 (50.8%) |
| Professional & Scientific | 140 (50.4%) | 138 (49.6%) |
| Enterprise Management | 0 (0.0%) | 0 (0.0%) |
| Administrative & Support | 189 (60.0%) | 126 (40.0%) |
| Educational Services | 215 (32.7%) | 442 (67.3%) |
| Health Care & Social Assistance | 470 (25.3%) | 1,391 (74.7%) |
| Arts, Entertainment & Recreation | 21 (52.5%) | 19 (47.5%) |
| Accommodation & Food Services | 290 (40.2%) | 432 (59.8%) |
| Public Administration | 228 (43.1%) | 301 (56.9%) |
| Total | 5,741 (58.5%) | 4,072 (41.5%) |
Education in Big Spring
School Enrollment in Big Spring
The most common levels of schooling among the 5,443 students in Big Spring are elementary school (1,463 | 26.9%), middle school (1,188 | 21.8%), and high school (1,116 | 20.5%).
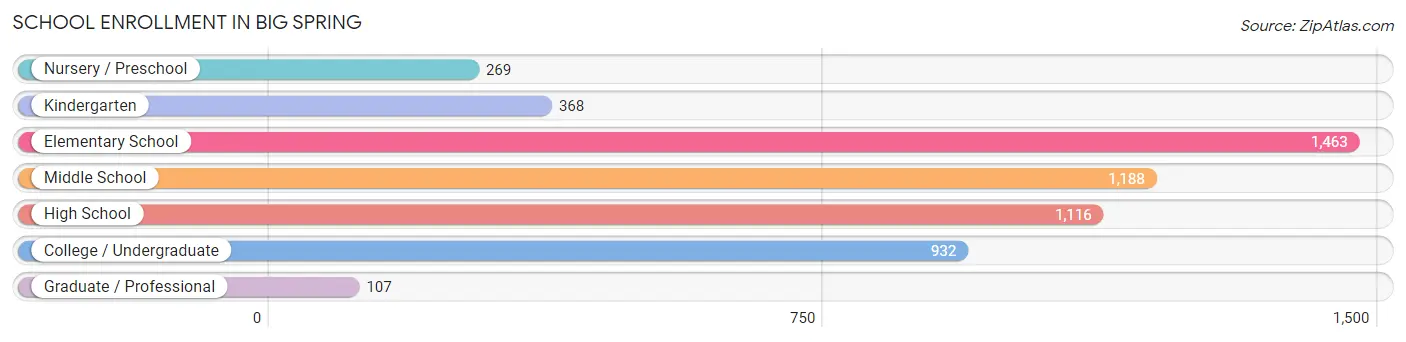
| School Level | # Students | % Students |
| Nursery / Preschool | 269 | 4.9% |
| Kindergarten | 368 | 6.8% |
| Elementary School | 1,463 | 26.9% |
| Middle School | 1,188 | 21.8% |
| High School | 1,116 | 20.5% |
| College / Undergraduate | 932 | 17.1% |
| Graduate / Professional | 107 | 2.0% |
| Total | 5,443 | 100.0% |
School Enrollment by Age by Funding Source in Big Spring
Out of a total of 5,443 students who are enrolled in schools in Big Spring, 860 (15.8%) attend a private institution, while the remaining 4,583 (84.2%) are enrolled in public schools. The age group of 15 to 17 year olds has the highest likelihood of being enrolled in private schools, with 202 (26.0% in the age bracket) enrolled. Conversely, the age group of 20 to 24 year olds has the lowest likelihood of being enrolled in a private school, with 335 (92.8% in the age bracket) attending a public institution.
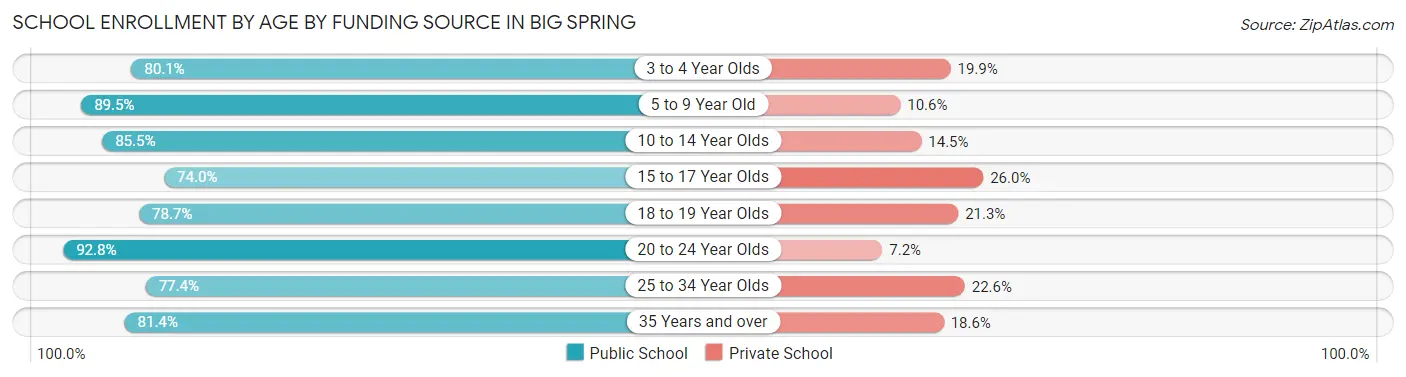
| Age Bracket | Public School | Private School |
| 3 to 4 Year Olds | 165 (80.1%) | 41 (19.9%) |
| 5 to 9 Year Old | 1,493 (89.4%) | 176 (10.5%) |
| 10 to 14 Year Olds | 1,224 (85.5%) | 207 (14.5%) |
| 15 to 17 Year Olds | 575 (74.0%) | 202 (26.0%) |
| 18 to 19 Year Olds | 472 (78.7%) | 128 (21.3%) |
| 20 to 24 Year Olds | 335 (92.8%) | 26 (7.2%) |
| 25 to 34 Year Olds | 151 (77.4%) | 44 (22.6%) |
| 35 Years and over | 166 (81.4%) | 38 (18.6%) |
| Total | 4,583 (84.2%) | 860 (15.8%) |
Educational Attainment by Field of Study in Big Spring
Business (437 | 18.5%), education (413 | 17.5%), science & technology (319 | 13.5%), liberal arts & history (164 | 7.0%), and arts & humanities (159 | 6.7%) are the most common fields of study among 2,361 individuals in Big Spring who have obtained a bachelor's degree or higher.
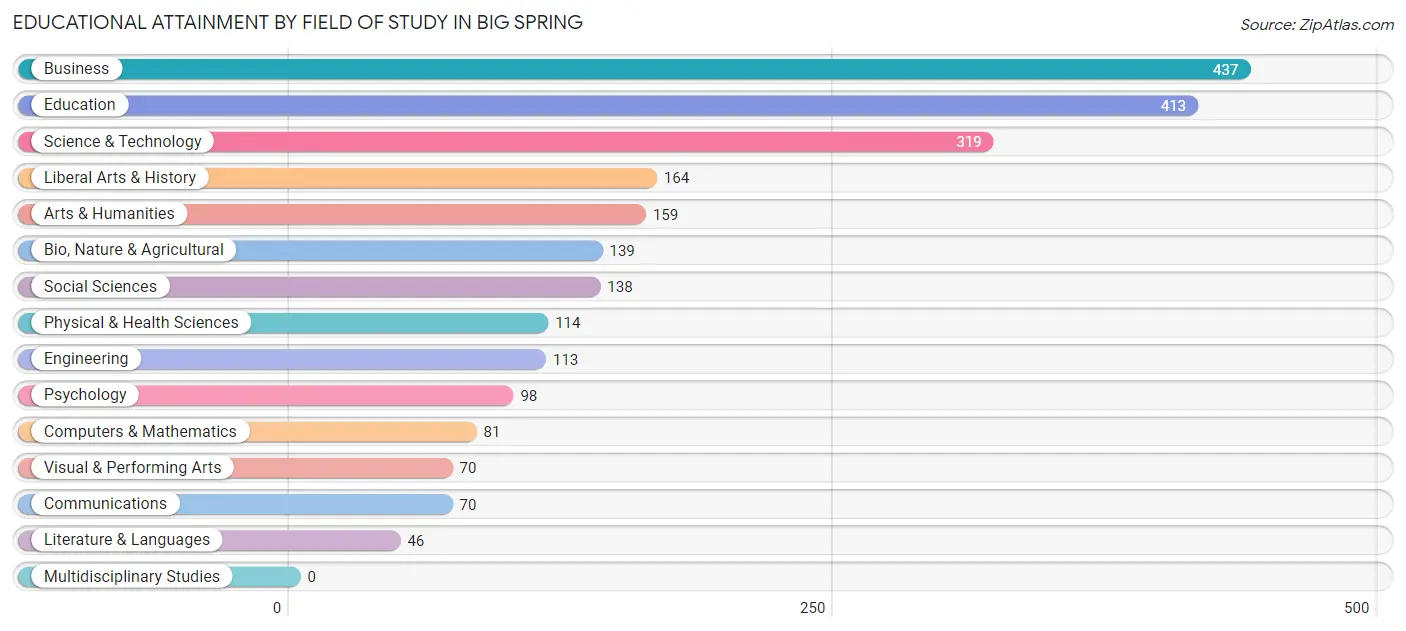
| Field of Study | # Graduates | % Graduates |
| Computers & Mathematics | 81 | 3.4% |
| Bio, Nature & Agricultural | 139 | 5.9% |
| Physical & Health Sciences | 114 | 4.8% |
| Psychology | 98 | 4.2% |
| Social Sciences | 138 | 5.8% |
| Engineering | 113 | 4.8% |
| Multidisciplinary Studies | 0 | 0.0% |
| Science & Technology | 319 | 13.5% |
| Business | 437 | 18.5% |
| Education | 413 | 17.5% |
| Literature & Languages | 46 | 1.9% |
| Liberal Arts & History | 164 | 7.0% |
| Visual & Performing Arts | 70 | 3.0% |
| Communications | 70 | 3.0% |
| Arts & Humanities | 159 | 6.7% |
| Total | 2,361 | 100.0% |
Transportation & Commute in Big Spring
Vehicle Availability by Sex in Big Spring
The most prevalent vehicle ownership categories in Big Spring are males with 2 vehicles (2,709, accounting for 48.1%) and females with 2 vehicles (1,442, making up 67.1%).
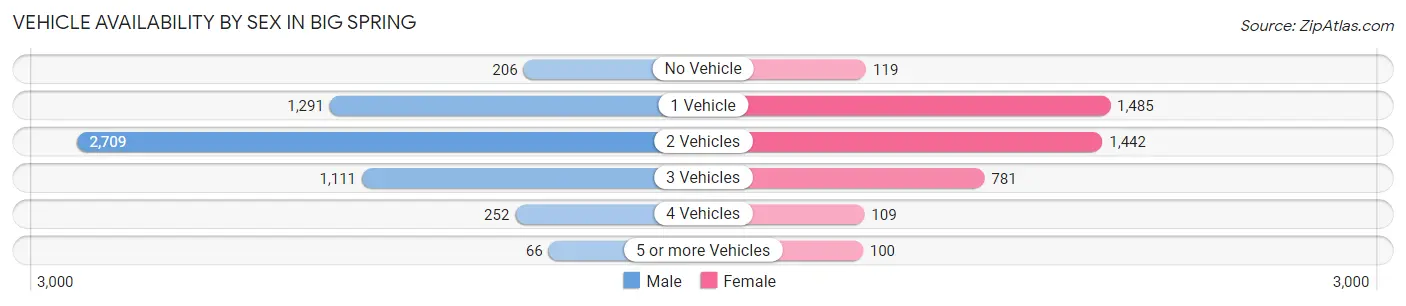
| Vehicles Available | Male | Female |
| No Vehicle | 206 (3.7%) | 119 (2.9%) |
| 1 Vehicle | 1,291 (22.9%) | 1,485 (36.8%) |
| 2 Vehicles | 2,709 (48.1%) | 1,442 (35.7%) |
| 3 Vehicles | 1,111 (19.7%) | 781 (19.4%) |
| 4 Vehicles | 252 (4.5%) | 109 (2.7%) |
| 5 or more Vehicles | 66 (1.2%) | 100 (2.5%) |
| Total | 5,635 (100.0%) | 4,036 (100.0%) |
Commute Time in Big Spring
The most frequently occuring commute durations in Big Spring are 10 to 14 minutes (2,792 commuters, 29.2%), 5 to 9 minutes (2,059 commuters, 21.6%), and 15 to 19 minutes (1,378 commuters, 14.4%).
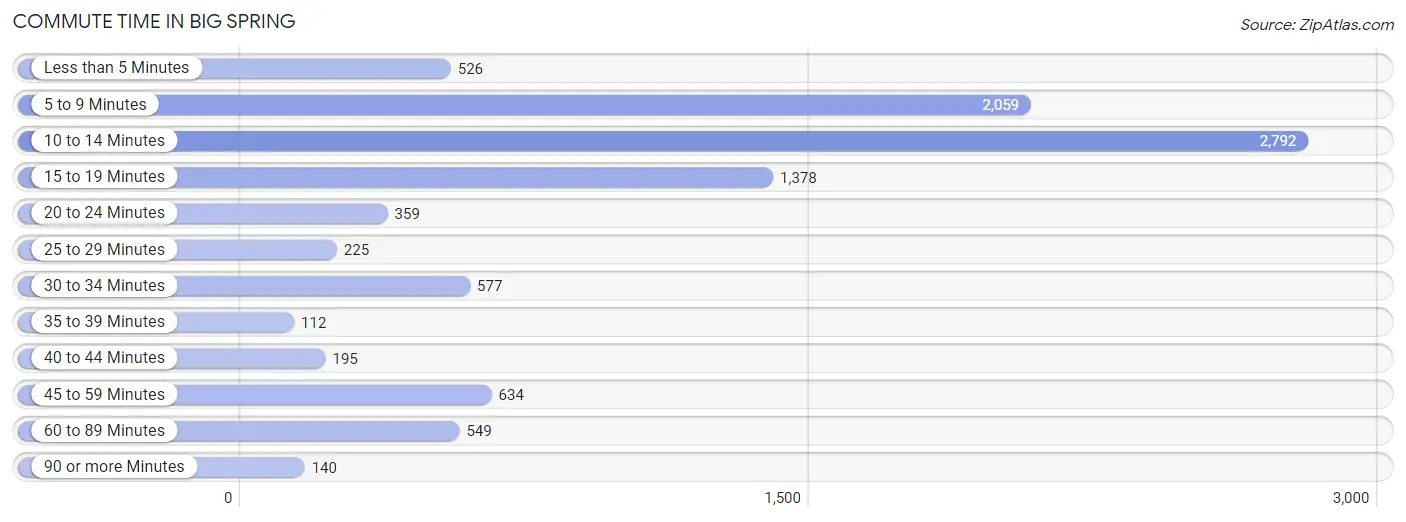
| Commute Time | # Commuters | % Commuters |
| Less than 5 Minutes | 526 | 5.5% |
| 5 to 9 Minutes | 2,059 | 21.6% |
| 10 to 14 Minutes | 2,792 | 29.2% |
| 15 to 19 Minutes | 1,378 | 14.4% |
| 20 to 24 Minutes | 359 | 3.8% |
| 25 to 29 Minutes | 225 | 2.4% |
| 30 to 34 Minutes | 577 | 6.0% |
| 35 to 39 Minutes | 112 | 1.2% |
| 40 to 44 Minutes | 195 | 2.0% |
| 45 to 59 Minutes | 634 | 6.6% |
| 60 to 89 Minutes | 549 | 5.8% |
| 90 or more Minutes | 140 | 1.5% |
Commute Time by Sex in Big Spring
The most common commute times in Big Spring are 10 to 14 minutes (1,544 commuters, 27.6%) for males and 10 to 14 minutes (1,248 commuters, 31.5%) for females.
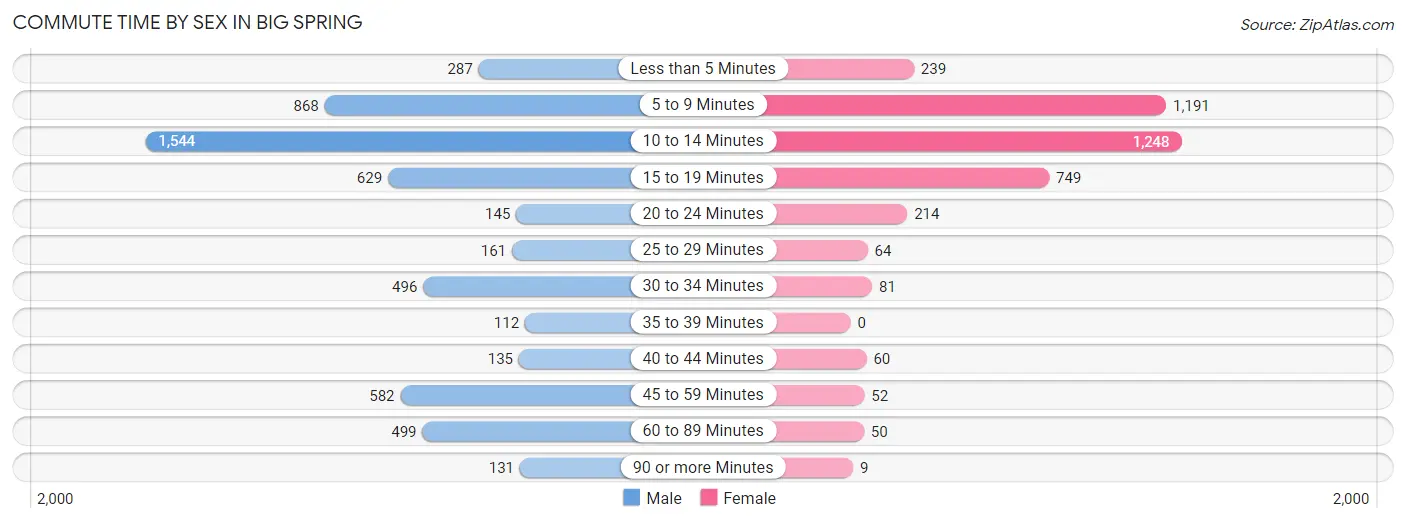
| Commute Time | Male | Female |
| Less than 5 Minutes | 287 (5.1%) | 239 (6.0%) |
| 5 to 9 Minutes | 868 (15.5%) | 1,191 (30.1%) |
| 10 to 14 Minutes | 1,544 (27.6%) | 1,248 (31.5%) |
| 15 to 19 Minutes | 629 (11.3%) | 749 (18.9%) |
| 20 to 24 Minutes | 145 (2.6%) | 214 (5.4%) |
| 25 to 29 Minutes | 161 (2.9%) | 64 (1.6%) |
| 30 to 34 Minutes | 496 (8.9%) | 81 (2.1%) |
| 35 to 39 Minutes | 112 (2.0%) | 0 (0.0%) |
| 40 to 44 Minutes | 135 (2.4%) | 60 (1.5%) |
| 45 to 59 Minutes | 582 (10.4%) | 52 (1.3%) |
| 60 to 89 Minutes | 499 (8.9%) | 50 (1.3%) |
| 90 or more Minutes | 131 (2.3%) | 9 (0.2%) |
Time of Departure to Work by Sex in Big Spring
The most frequent times of departure to work in Big Spring are 6:00 AM to 6:29 AM (819, 14.6%) for males and 7:30 AM to 7:59 AM (706, 17.8%) for females.
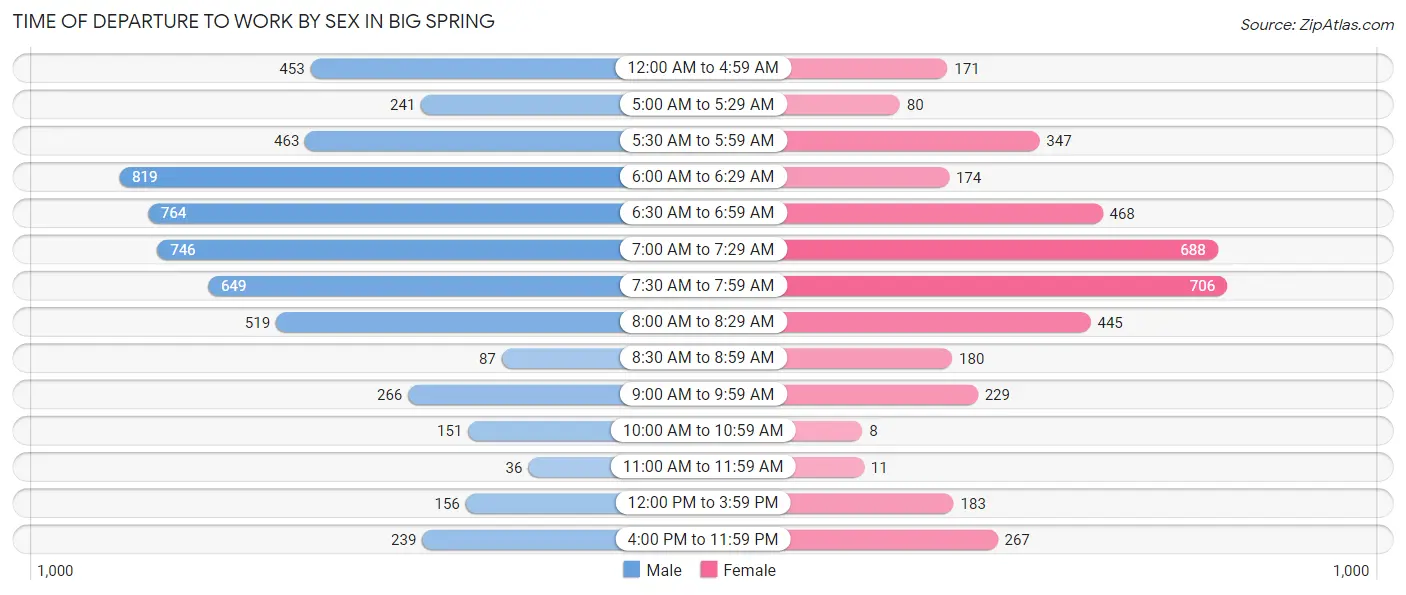
| Time of Departure | Male | Female |
| 12:00 AM to 4:59 AM | 453 (8.1%) | 171 (4.3%) |
| 5:00 AM to 5:29 AM | 241 (4.3%) | 80 (2.0%) |
| 5:30 AM to 5:59 AM | 463 (8.3%) | 347 (8.8%) |
| 6:00 AM to 6:29 AM | 819 (14.6%) | 174 (4.4%) |
| 6:30 AM to 6:59 AM | 764 (13.7%) | 468 (11.8%) |
| 7:00 AM to 7:29 AM | 746 (13.4%) | 688 (17.4%) |
| 7:30 AM to 7:59 AM | 649 (11.6%) | 706 (17.8%) |
| 8:00 AM to 8:29 AM | 519 (9.3%) | 445 (11.3%) |
| 8:30 AM to 8:59 AM | 87 (1.6%) | 180 (4.5%) |
| 9:00 AM to 9:59 AM | 266 (4.8%) | 229 (5.8%) |
| 10:00 AM to 10:59 AM | 151 (2.7%) | 8 (0.2%) |
| 11:00 AM to 11:59 AM | 36 (0.6%) | 11 (0.3%) |
| 12:00 PM to 3:59 PM | 156 (2.8%) | 183 (4.6%) |
| 4:00 PM to 11:59 PM | 239 (4.3%) | 267 (6.8%) |
| Total | 5,589 (100.0%) | 3,957 (100.0%) |
Housing Occupancy in Big Spring
Occupancy by Ownership in Big Spring
Of the total 8,849 dwellings in Big Spring, owner-occupied units account for 5,468 (61.8%), while renter-occupied units make up 3,381 (38.2%).
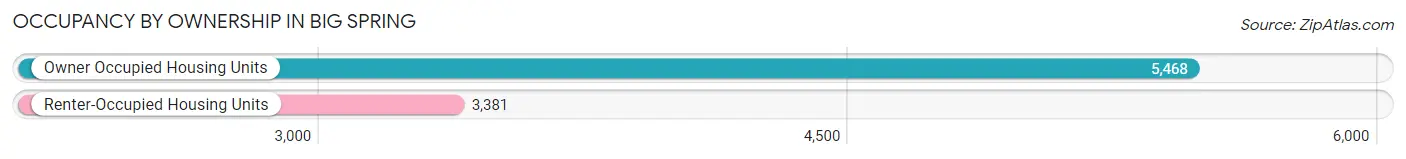
| Occupancy | # Housing Units | % Housing Units |
| Owner Occupied Housing Units | 5,468 | 61.8% |
| Renter-Occupied Housing Units | 3,381 | 38.2% |
| Total Occupied Housing Units | 8,849 | 100.0% |
Occupancy by Household Size in Big Spring
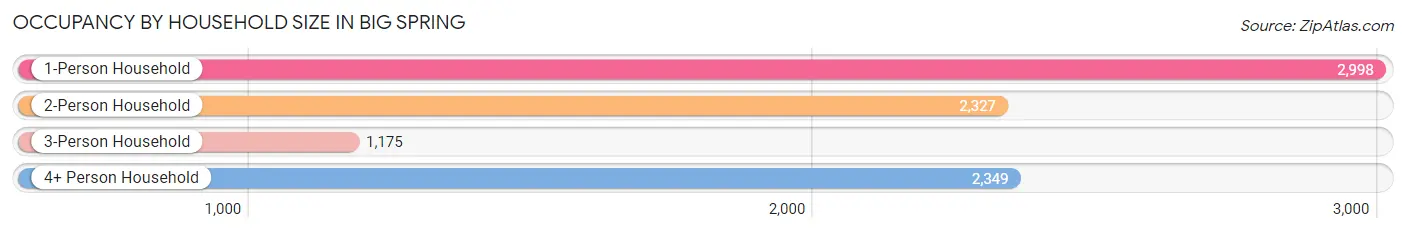
| Household Size | # Housing Units | % Housing Units |
| 1-Person Household | 2,998 | 33.9% |
| 2-Person Household | 2,327 | 26.3% |
| 3-Person Household | 1,175 | 13.3% |
| 4+ Person Household | 2,349 | 26.6% |
| Total Housing Units | 8,849 | 100.0% |
Occupancy by Ownership by Household Size in Big Spring
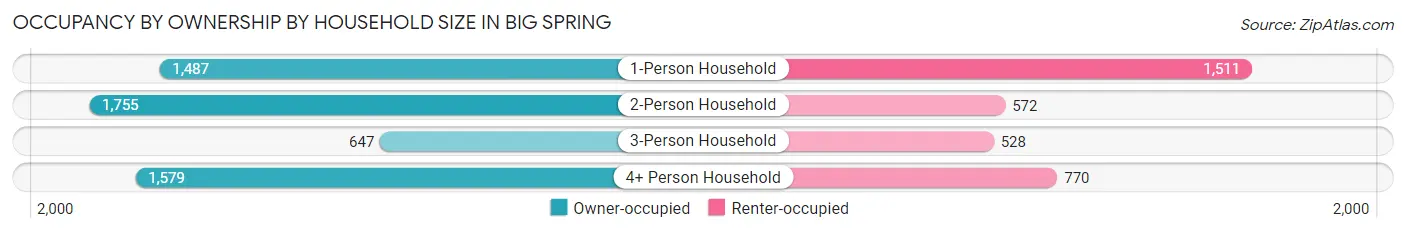
| Household Size | Owner-occupied | Renter-occupied |
| 1-Person Household | 1,487 (49.6%) | 1,511 (50.4%) |
| 2-Person Household | 1,755 (75.4%) | 572 (24.6%) |
| 3-Person Household | 647 (55.1%) | 528 (44.9%) |
| 4+ Person Household | 1,579 (67.2%) | 770 (32.8%) |
| Total Housing Units | 5,468 (61.8%) | 3,381 (38.2%) |
Occupancy by Educational Attainment in Big Spring
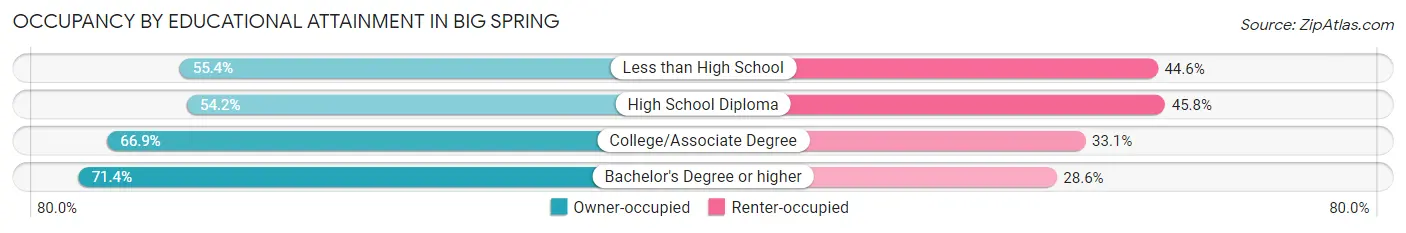
| Household Size | Owner-occupied | Renter-occupied |
| Less than High School | 618 (55.4%) | 498 (44.6%) |
| High School Diploma | 1,652 (54.2%) | 1,395 (45.8%) |
| College/Associate Degree | 2,179 (66.9%) | 1,080 (33.1%) |
| Bachelor's Degree or higher | 1,019 (71.4%) | 408 (28.6%) |
Occupancy by Age of Householder in Big Spring
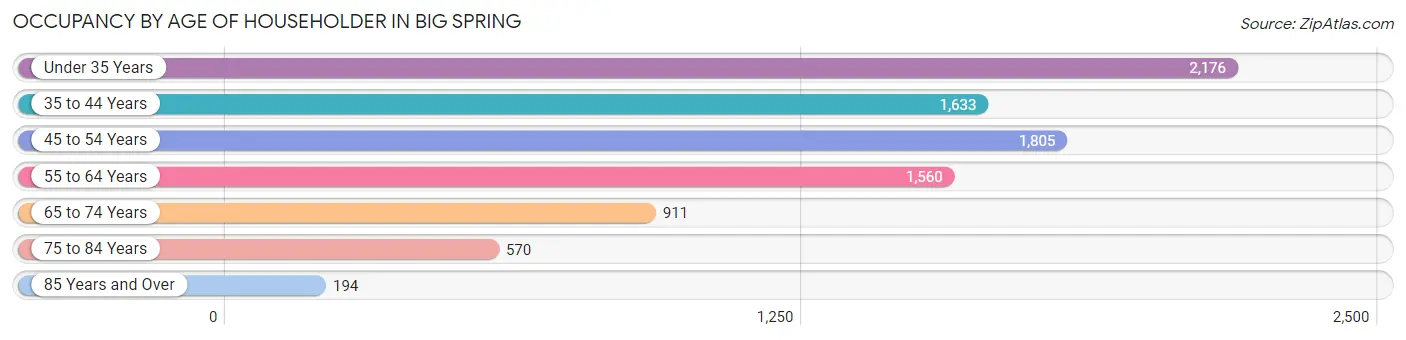
| Age Bracket | # Households | % Households |
| Under 35 Years | 2,176 | 24.6% |
| 35 to 44 Years | 1,633 | 18.4% |
| 45 to 54 Years | 1,805 | 20.4% |
| 55 to 64 Years | 1,560 | 17.6% |
| 65 to 74 Years | 911 | 10.3% |
| 75 to 84 Years | 570 | 6.4% |
| 85 Years and Over | 194 | 2.2% |
| Total | 8,849 | 100.0% |
Housing Finances in Big Spring
Median Income by Occupancy in Big Spring
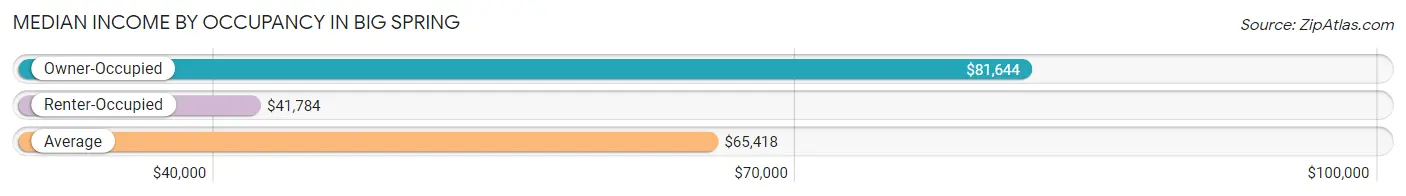
| Occupancy Type | # Households | Median Income |
| Owner-Occupied | 5,468 (61.8%) | $81,644 |
| Renter-Occupied | 3,381 (38.2%) | $41,784 |
| Average | 8,849 (100.0%) | $65,418 |
Occupancy by Householder Income Bracket in Big Spring
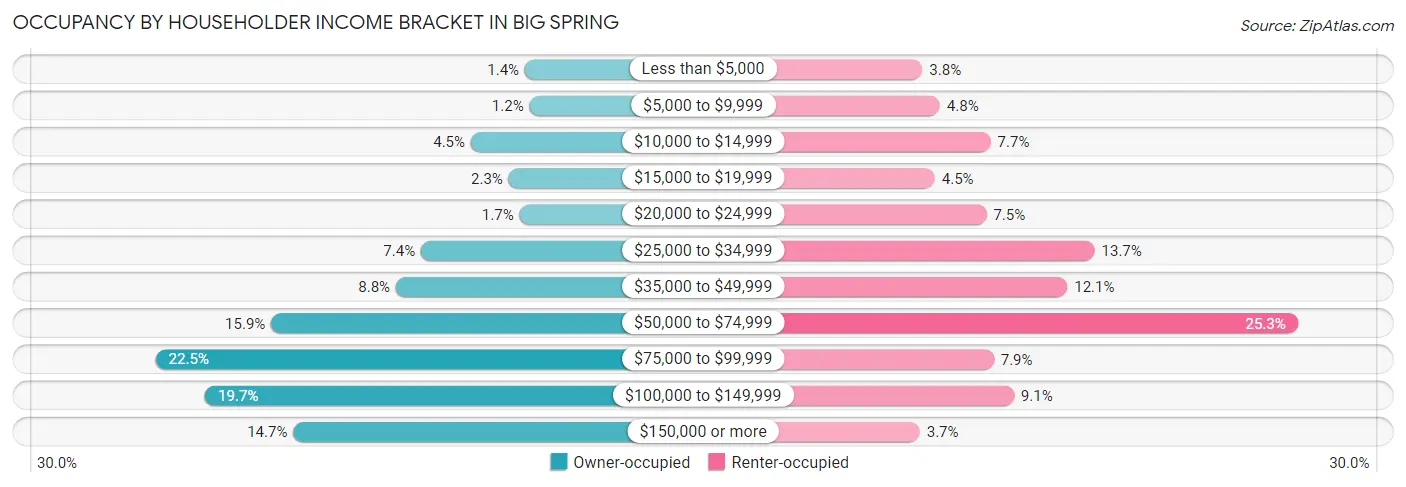
| Income Bracket | Owner-occupied | Renter-occupied |
| Less than $5,000 | 77 (1.4%) | 129 (3.8%) |
| $5,000 to $9,999 | 63 (1.1%) | 163 (4.8%) |
| $10,000 to $14,999 | 246 (4.5%) | 261 (7.7%) |
| $15,000 to $19,999 | 128 (2.3%) | 153 (4.5%) |
| $20,000 to $24,999 | 94 (1.7%) | 253 (7.5%) |
| $25,000 to $34,999 | 402 (7.3%) | 462 (13.7%) |
| $35,000 to $49,999 | 480 (8.8%) | 409 (12.1%) |
| $50,000 to $74,999 | 870 (15.9%) | 854 (25.3%) |
| $75,000 to $99,999 | 1,231 (22.5%) | 267 (7.9%) |
| $100,000 to $149,999 | 1,076 (19.7%) | 306 (9.0%) |
| $150,000 or more | 801 (14.6%) | 124 (3.7%) |
| Total | 5,468 (100.0%) | 3,381 (100.0%) |
Monthly Housing Cost Tiers in Big Spring
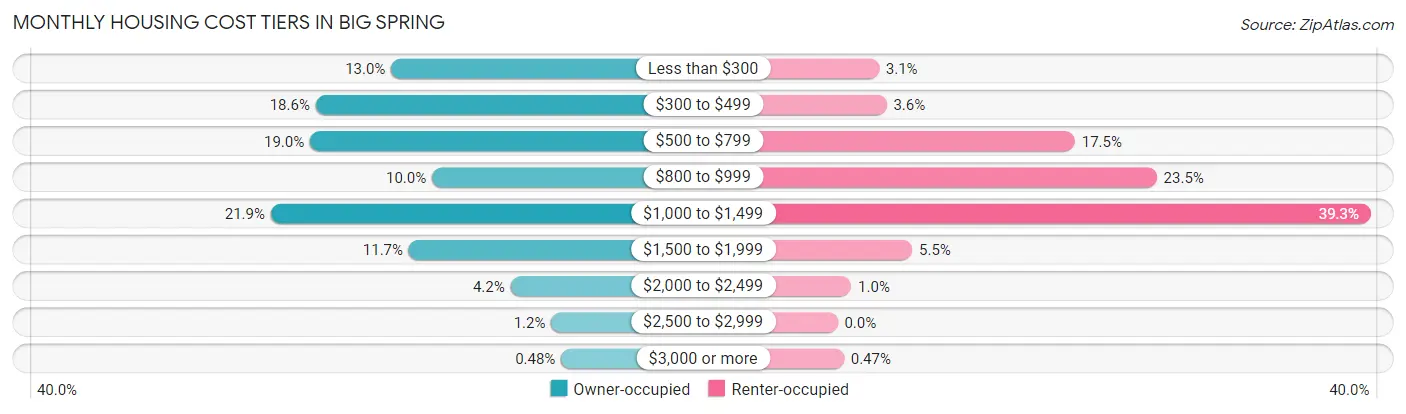
| Monthly Cost | Owner-occupied | Renter-occupied |
| Less than $300 | 711 (13.0%) | 103 (3.0%) |
| $300 to $499 | 1,015 (18.6%) | 122 (3.6%) |
| $500 to $799 | 1,038 (19.0%) | 591 (17.5%) |
| $800 to $999 | 546 (10.0%) | 795 (23.5%) |
| $1,000 to $1,499 | 1,196 (21.9%) | 1,328 (39.3%) |
| $1,500 to $1,999 | 640 (11.7%) | 186 (5.5%) |
| $2,000 to $2,499 | 230 (4.2%) | 34 (1.0%) |
| $2,500 to $2,999 | 66 (1.2%) | 0 (0.0%) |
| $3,000 or more | 26 (0.5%) | 16 (0.5%) |
| Total | 5,468 (100.0%) | 3,381 (100.0%) |
Physical Housing Characteristics in Big Spring
Housing Structures in Big Spring
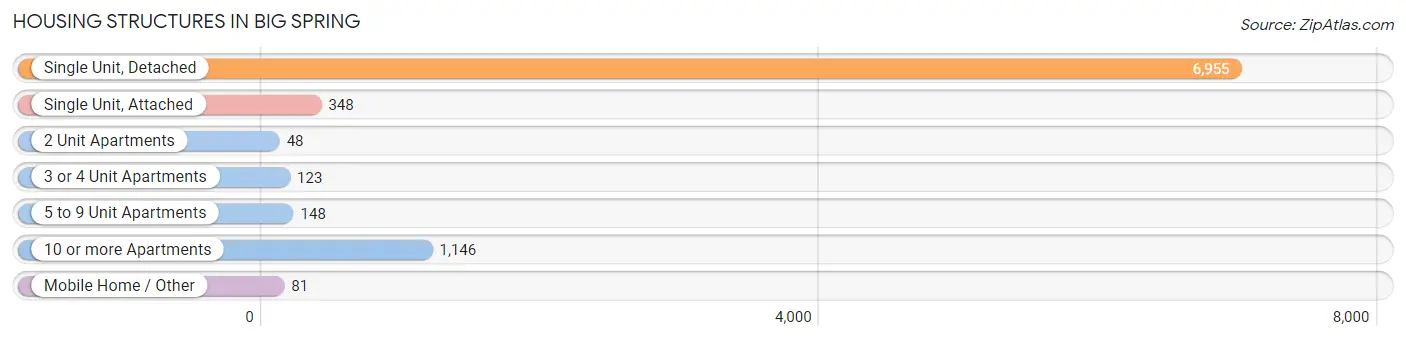
| Structure Type | # Housing Units | % Housing Units |
| Single Unit, Detached | 6,955 | 78.6% |
| Single Unit, Attached | 348 | 3.9% |
| 2 Unit Apartments | 48 | 0.5% |
| 3 or 4 Unit Apartments | 123 | 1.4% |
| 5 to 9 Unit Apartments | 148 | 1.7% |
| 10 or more Apartments | 1,146 | 13.0% |
| Mobile Home / Other | 81 | 0.9% |
| Total | 8,849 | 100.0% |
Housing Structures by Occupancy in Big Spring
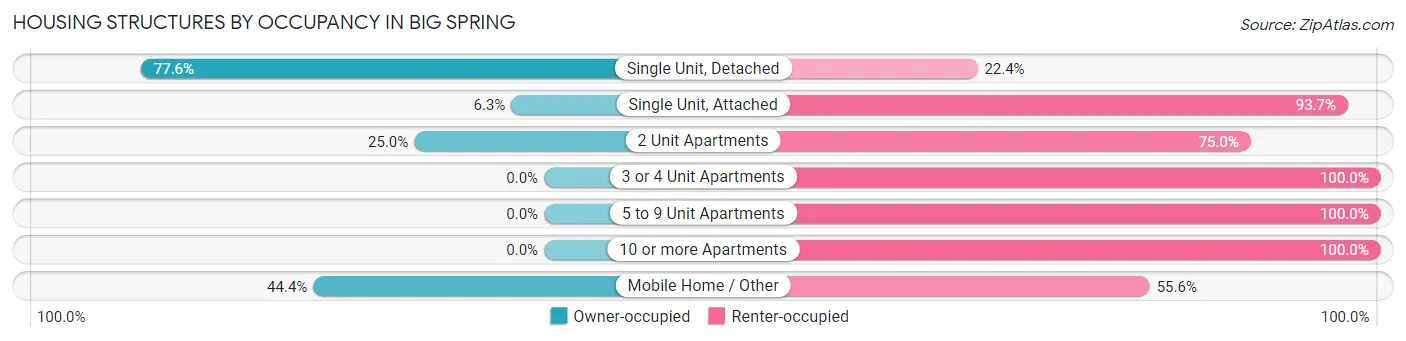
| Structure Type | Owner-occupied | Renter-occupied |
| Single Unit, Detached | 5,398 (77.6%) | 1,557 (22.4%) |
| Single Unit, Attached | 22 (6.3%) | 326 (93.7%) |
| 2 Unit Apartments | 12 (25.0%) | 36 (75.0%) |
| 3 or 4 Unit Apartments | 0 (0.0%) | 123 (100.0%) |
| 5 to 9 Unit Apartments | 0 (0.0%) | 148 (100.0%) |
| 10 or more Apartments | 0 (0.0%) | 1,146 (100.0%) |
| Mobile Home / Other | 36 (44.4%) | 45 (55.6%) |
| Total | 5,468 (61.8%) | 3,381 (38.2%) |
Housing Structures by Number of Rooms in Big Spring
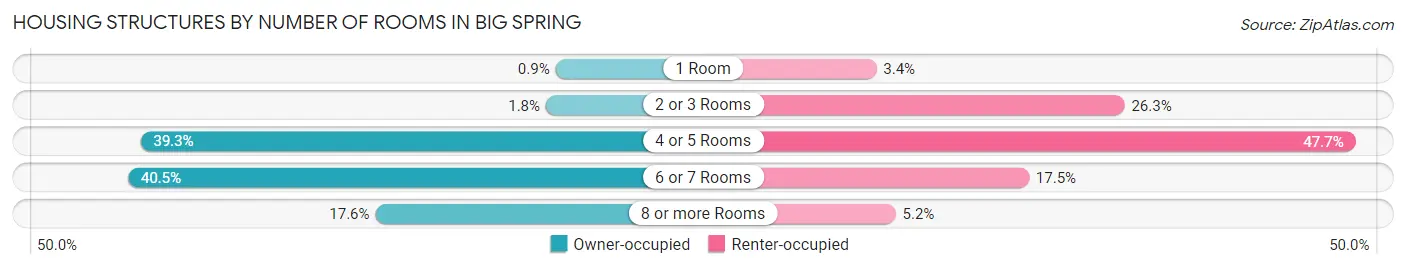
| Number of Rooms | Owner-occupied | Renter-occupied |
| 1 Room | 49 (0.9%) | 114 (3.4%) |
| 2 or 3 Rooms | 98 (1.8%) | 890 (26.3%) |
| 4 or 5 Rooms | 2,149 (39.3%) | 1,612 (47.7%) |
| 6 or 7 Rooms | 2,212 (40.5%) | 591 (17.5%) |
| 8 or more Rooms | 960 (17.6%) | 174 (5.1%) |
| Total | 5,468 (100.0%) | 3,381 (100.0%) |
Housing Structure by Heating Type in Big Spring
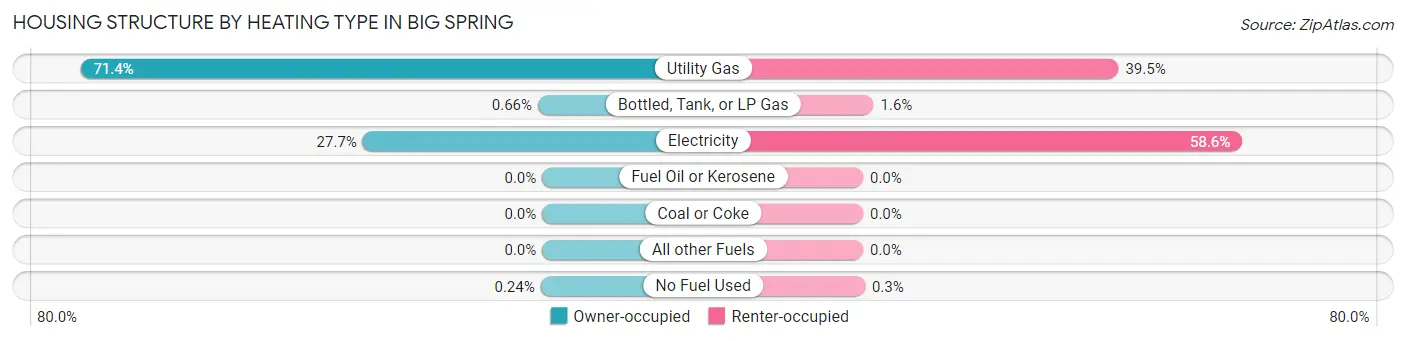
| Heating Type | Owner-occupied | Renter-occupied |
| Utility Gas | 3,902 (71.4%) | 1,335 (39.5%) |
| Bottled, Tank, or LP Gas | 36 (0.7%) | 55 (1.6%) |
| Electricity | 1,517 (27.7%) | 1,981 (58.6%) |
| Fuel Oil or Kerosene | 0 (0.0%) | 0 (0.0%) |
| Coal or Coke | 0 (0.0%) | 0 (0.0%) |
| All other Fuels | 0 (0.0%) | 0 (0.0%) |
| No Fuel Used | 13 (0.2%) | 10 (0.3%) |
| Total | 5,468 (100.0%) | 3,381 (100.0%) |
Household Vehicle Usage in Big Spring
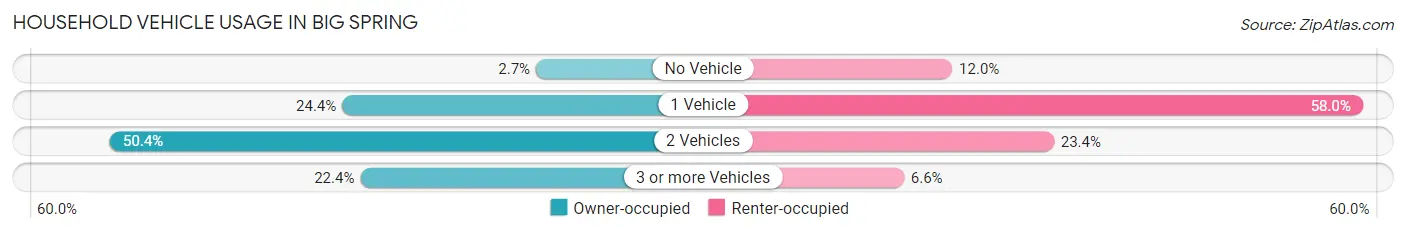
| Vehicles per Household | Owner-occupied | Renter-occupied |
| No Vehicle | 149 (2.7%) | 406 (12.0%) |
| 1 Vehicle | 1,336 (24.4%) | 1,961 (58.0%) |
| 2 Vehicles | 2,758 (50.4%) | 791 (23.4%) |
| 3 or more Vehicles | 1,225 (22.4%) | 223 (6.6%) |
| Total | 5,468 (100.0%) | 3,381 (100.0%) |
Real Estate & Mortgages in Big Spring
Real Estate and Mortgage Overview in Big Spring
| Characteristic | Without Mortgage | With Mortgage |
| Housing Units | 3,029 | 2,439 |
| Median Property Value | $100,100 | $152,900 |
| Median Household Income | $64,760 | $466 |
| Monthly Housing Costs | $444 | $26 |
| Real Estate Taxes | $1,345 | $361 |
Property Value by Mortgage Status in Big Spring
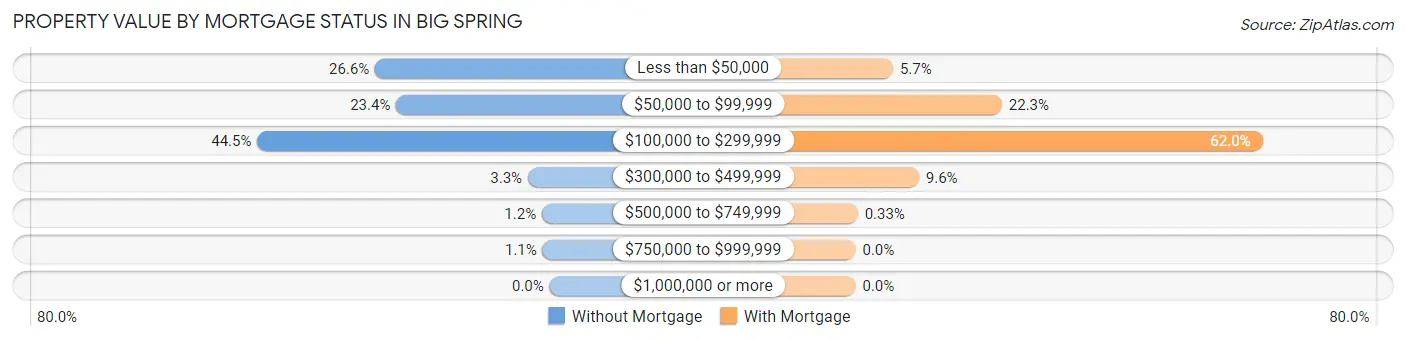
| Property Value | Without Mortgage | With Mortgage |
| Less than $50,000 | 805 (26.6%) | 139 (5.7%) |
| $50,000 to $99,999 | 708 (23.4%) | 544 (22.3%) |
| $100,000 to $299,999 | 1,349 (44.5%) | 1,513 (62.0%) |
| $300,000 to $499,999 | 100 (3.3%) | 235 (9.6%) |
| $500,000 to $749,999 | 35 (1.2%) | 8 (0.3%) |
| $750,000 to $999,999 | 32 (1.1%) | 0 (0.0%) |
| $1,000,000 or more | 0 (0.0%) | 0 (0.0%) |
| Total | 3,029 (100.0%) | 2,439 (100.0%) |
Household Income by Mortgage Status in Big Spring
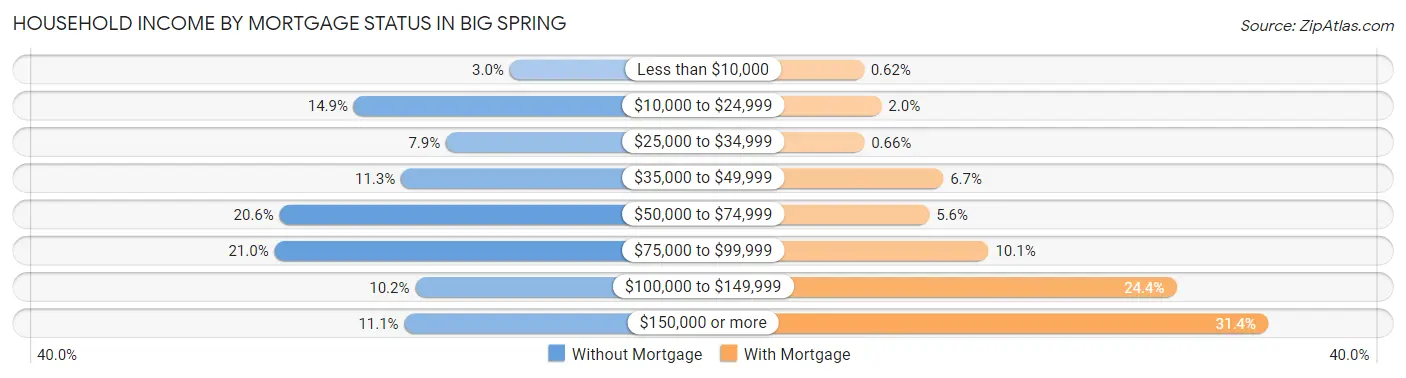
| Household Income | Without Mortgage | With Mortgage |
| Less than $10,000 | 92 (3.0%) | 15 (0.6%) |
| $10,000 to $24,999 | 452 (14.9%) | 48 (2.0%) |
| $25,000 to $34,999 | 239 (7.9%) | 16 (0.7%) |
| $35,000 to $49,999 | 343 (11.3%) | 163 (6.7%) |
| $50,000 to $74,999 | 623 (20.6%) | 137 (5.6%) |
| $75,000 to $99,999 | 635 (21.0%) | 247 (10.1%) |
| $100,000 to $149,999 | 310 (10.2%) | 596 (24.4%) |
| $150,000 or more | 335 (11.1%) | 766 (31.4%) |
| Total | 3,029 (100.0%) | 2,439 (100.0%) |
Property Value to Household Income Ratio in Big Spring
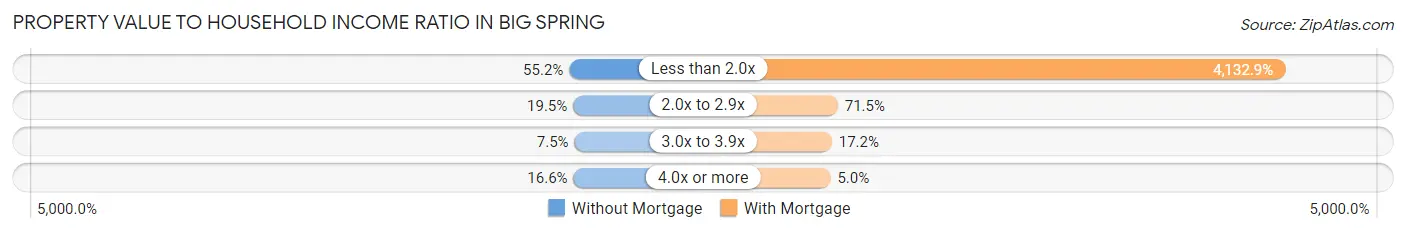
| Value-to-Income Ratio | Without Mortgage | With Mortgage |
| Less than 2.0x | 1,672 (55.2%) | 100,801 (4,132.9%) |
| 2.0x to 2.9x | 590 (19.5%) | 1,744 (71.5%) |
| 3.0x to 3.9x | 227 (7.5%) | 420 (17.2%) |
| 4.0x or more | 503 (16.6%) | 123 (5.0%) |
| Total | 3,029 (100.0%) | 2,439 (100.0%) |
Real Estate Taxes by Mortgage Status in Big Spring
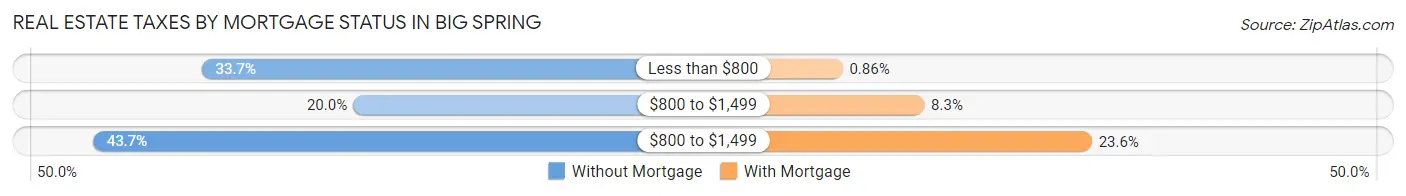
| Property Taxes | Without Mortgage | With Mortgage |
| Less than $800 | 1,022 (33.7%) | 21 (0.9%) |
| $800 to $1,499 | 606 (20.0%) | 203 (8.3%) |
| $800 to $1,499 | 1,323 (43.7%) | 576 (23.6%) |
| Total | 3,029 (100.0%) | 2,439 (100.0%) |
Health & Disability in Big Spring
Health Insurance Coverage by Age in Big Spring
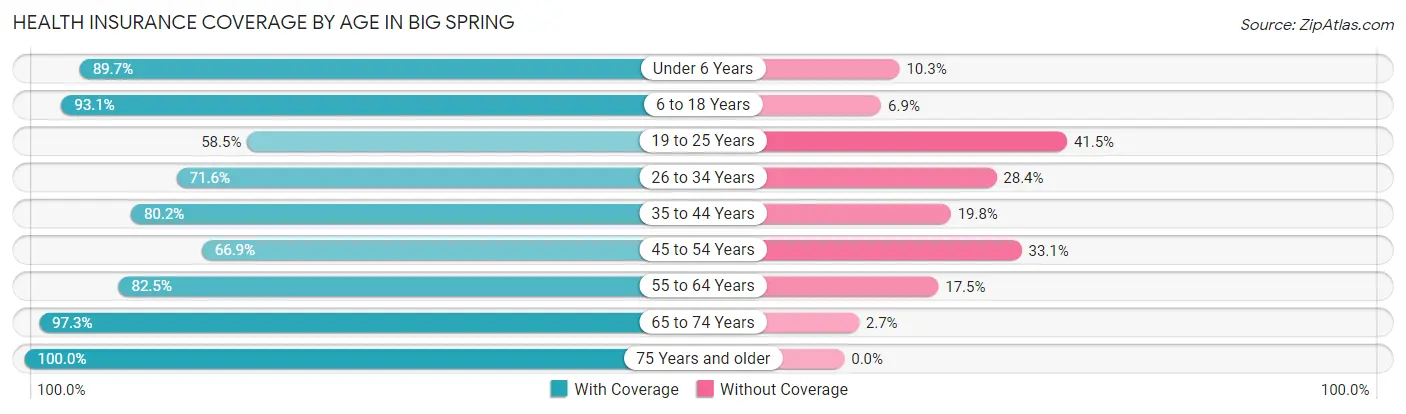
| Age Bracket | With Coverage | Without Coverage |
| Under 6 Years | 1,648 (89.7%) | 189 (10.3%) |
| 6 to 18 Years | 3,753 (93.1%) | 277 (6.9%) |
| 19 to 25 Years | 1,389 (58.5%) | 986 (41.5%) |
| 26 to 34 Years | 2,155 (71.6%) | 853 (28.4%) |
| 35 to 44 Years | 2,472 (80.2%) | 612 (19.8%) |
| 45 to 54 Years | 2,017 (66.9%) | 996 (33.1%) |
| 55 to 64 Years | 1,953 (82.5%) | 415 (17.5%) |
| 65 to 74 Years | 1,473 (97.3%) | 41 (2.7%) |
| 75 Years and older | 1,061 (100.0%) | 0 (0.0%) |
| Total | 17,921 (80.4%) | 4,369 (19.6%) |
Health Insurance Coverage by Citizenship Status in Big Spring
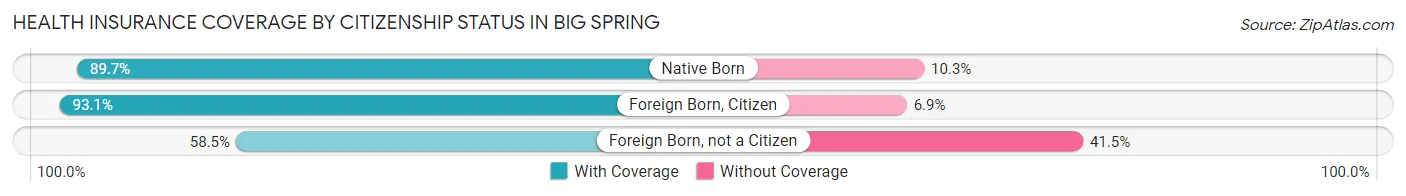
| Citizenship Status | With Coverage | Without Coverage |
| Native Born | 1,648 (89.7%) | 189 (10.3%) |
| Foreign Born, Citizen | 3,753 (93.1%) | 277 (6.9%) |
| Foreign Born, not a Citizen | 1,389 (58.5%) | 986 (41.5%) |
Health Insurance Coverage by Household Income in Big Spring
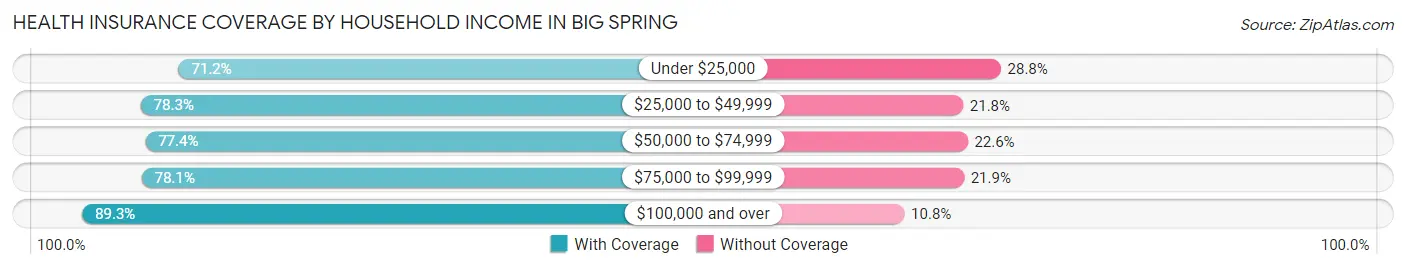
| Household Income | With Coverage | Without Coverage |
| Under $25,000 | 2,070 (71.2%) | 838 (28.8%) |
| $25,000 to $49,999 | 3,166 (78.2%) | 880 (21.7%) |
| $50,000 to $74,999 | 2,874 (77.4%) | 839 (22.6%) |
| $75,000 to $99,999 | 3,226 (78.1%) | 905 (21.9%) |
| $100,000 and over | 6,302 (89.2%) | 759 (10.7%) |
Public vs Private Health Insurance Coverage by Age in Big Spring
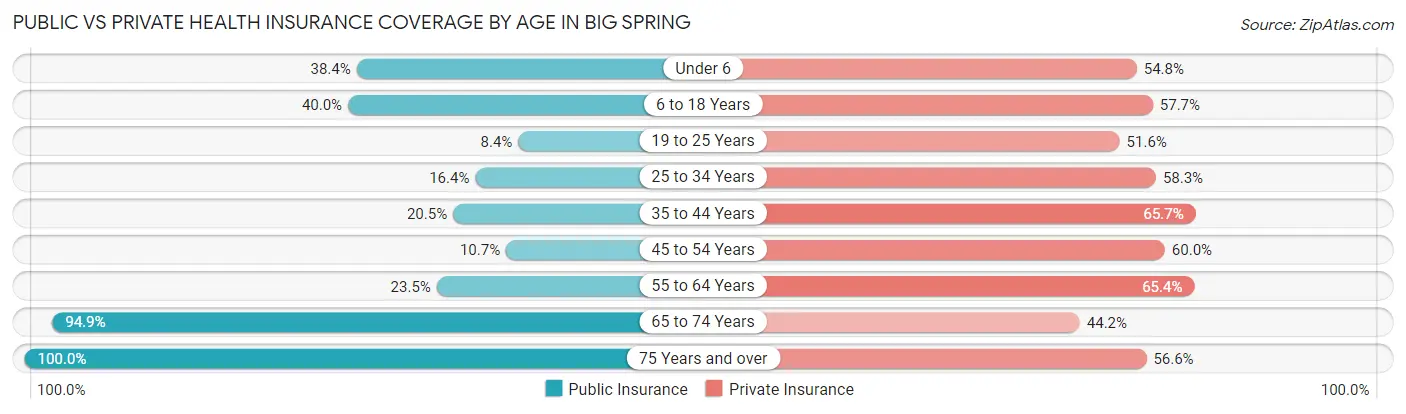
| Age Bracket | Public Insurance | Private Insurance |
| Under 6 | 705 (38.4%) | 1,006 (54.8%) |
| 6 to 18 Years | 1,611 (40.0%) | 2,327 (57.7%) |
| 19 to 25 Years | 199 (8.4%) | 1,225 (51.6%) |
| 25 to 34 Years | 492 (16.4%) | 1,754 (58.3%) |
| 35 to 44 Years | 632 (20.5%) | 2,025 (65.7%) |
| 45 to 54 Years | 321 (10.6%) | 1,807 (60.0%) |
| 55 to 64 Years | 557 (23.5%) | 1,549 (65.4%) |
| 65 to 74 Years | 1,436 (94.9%) | 669 (44.2%) |
| 75 Years and over | 1,061 (100.0%) | 600 (56.6%) |
| Total | 7,014 (31.5%) | 12,962 (58.2%) |
Disability Status by Sex by Age in Big Spring
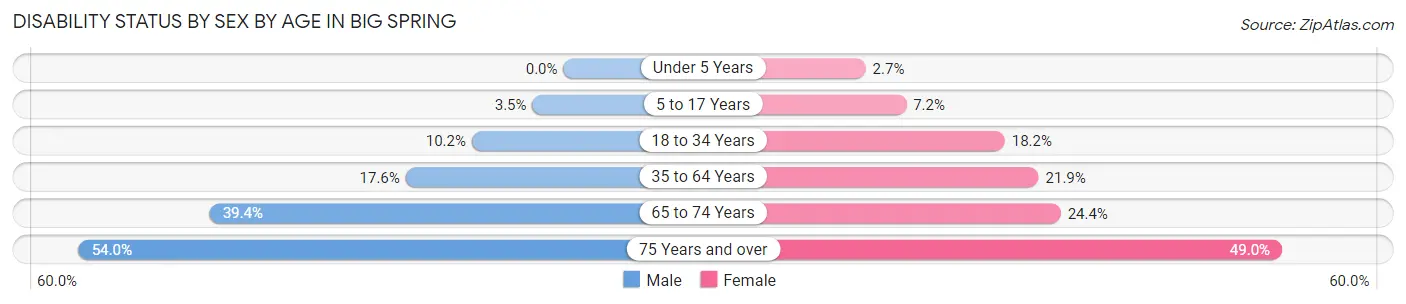
| Age Bracket | Male | Female |
| Under 5 Years | 0 (0.0%) | 22 (2.7%) |
| 5 to 17 Years | 74 (3.5%) | 128 (7.2%) |
| 18 to 34 Years | 298 (10.2%) | 513 (18.1%) |
| 35 to 64 Years | 772 (17.6%) | 892 (21.9%) |
| 65 to 74 Years | 278 (39.4%) | 197 (24.4%) |
| 75 Years and over | 272 (54.0%) | 273 (49.0%) |
Disability Class by Sex by Age in Big Spring
Disability Class: Hearing Difficulty
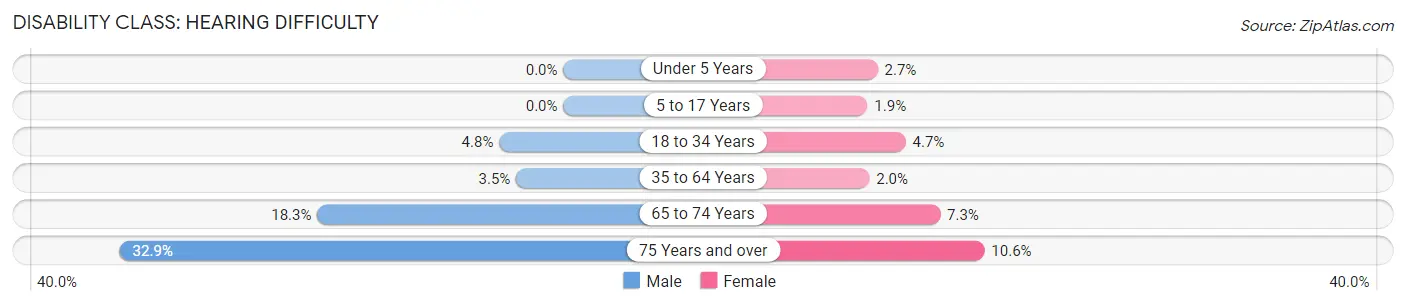
| Age Bracket | Male | Female |
| Under 5 Years | 0 (0.0%) | 22 (2.7%) |
| 5 to 17 Years | 0 (0.0%) | 34 (1.9%) |
| 18 to 34 Years | 139 (4.8%) | 134 (4.7%) |
| 35 to 64 Years | 154 (3.5%) | 83 (2.0%) |
| 65 to 74 Years | 129 (18.3%) | 59 (7.3%) |
| 75 Years and over | 166 (32.9%) | 59 (10.6%) |
Disability Class: Vision Difficulty
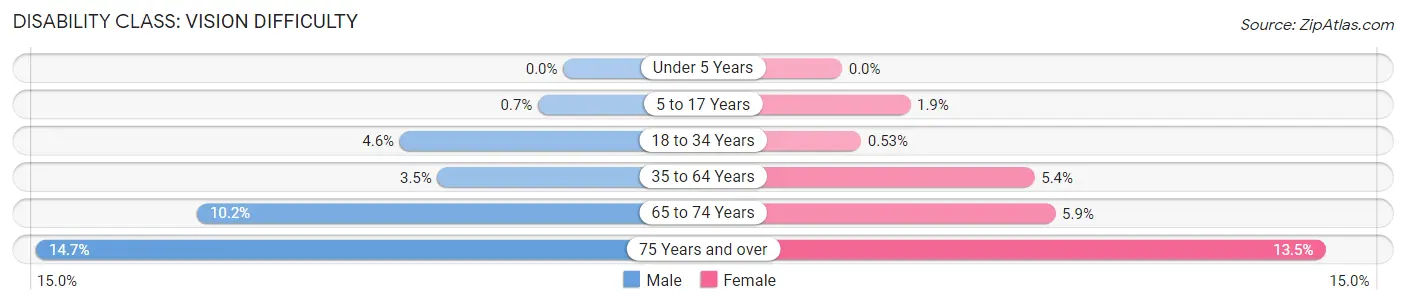
| Age Bracket | Male | Female |
| Under 5 Years | 0 (0.0%) | 0 (0.0%) |
| 5 to 17 Years | 15 (0.7%) | 34 (1.9%) |
| 18 to 34 Years | 133 (4.5%) | 15 (0.5%) |
| 35 to 64 Years | 154 (3.5%) | 218 (5.4%) |
| 65 to 74 Years | 72 (10.2%) | 48 (5.9%) |
| 75 Years and over | 74 (14.7%) | 75 (13.5%) |
Disability Class: Cognitive Difficulty
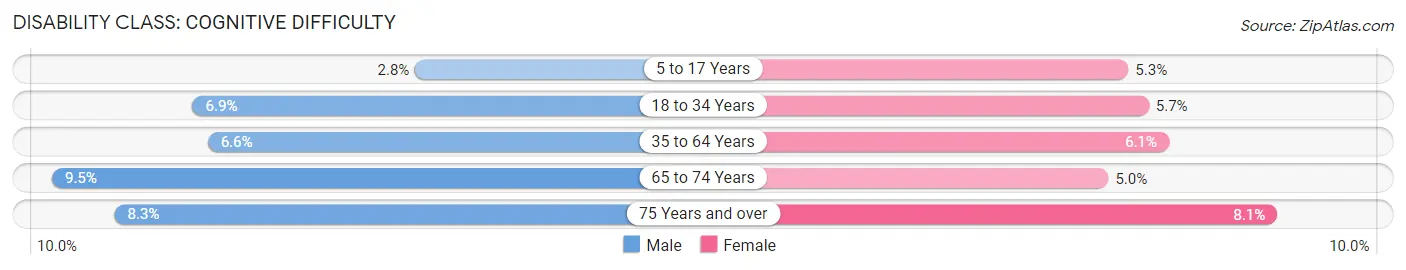
| Age Bracket | Male | Female |
| 5 to 17 Years | 59 (2.8%) | 95 (5.3%) |
| 18 to 34 Years | 201 (6.9%) | 161 (5.7%) |
| 35 to 64 Years | 290 (6.6%) | 247 (6.1%) |
| 65 to 74 Years | 67 (9.5%) | 40 (5.0%) |
| 75 Years and over | 42 (8.3%) | 45 (8.1%) |
Disability Class: Ambulatory Difficulty
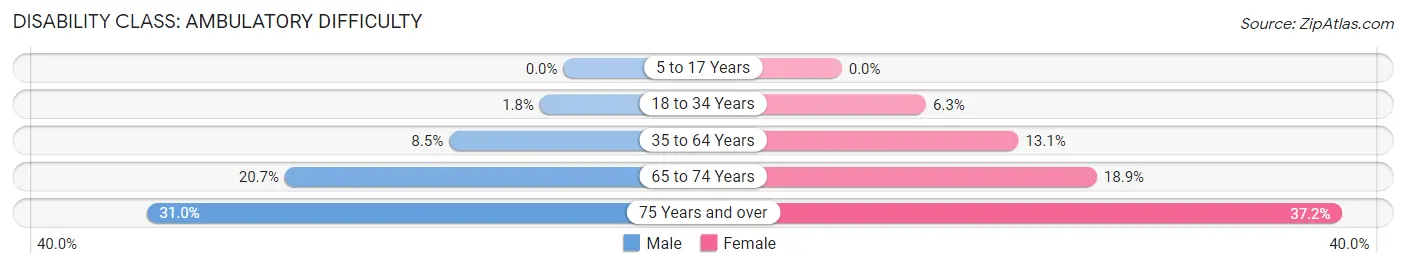
| Age Bracket | Male | Female |
| 5 to 17 Years | 0 (0.0%) | 0 (0.0%) |
| 18 to 34 Years | 51 (1.8%) | 177 (6.3%) |
| 35 to 64 Years | 373 (8.5%) | 534 (13.1%) |
| 65 to 74 Years | 146 (20.7%) | 153 (18.9%) |
| 75 Years and over | 156 (30.9%) | 207 (37.2%) |
Disability Class: Self-Care Difficulty
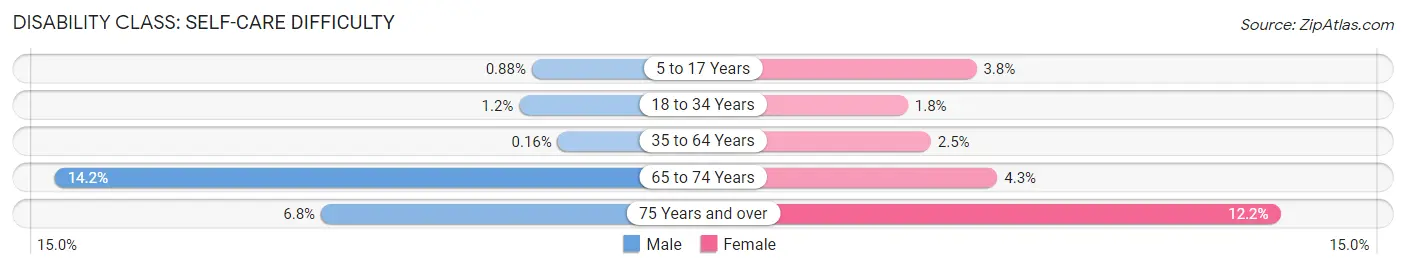
| Age Bracket | Male | Female |
| 5 to 17 Years | 19 (0.9%) | 67 (3.7%) |
| 18 to 34 Years | 36 (1.2%) | 52 (1.8%) |
| 35 to 64 Years | 7 (0.2%) | 101 (2.5%) |
| 65 to 74 Years | 100 (14.2%) | 35 (4.3%) |
| 75 Years and over | 34 (6.8%) | 68 (12.2%) |
Technology Access in Big Spring
Computing Device Access in Big Spring
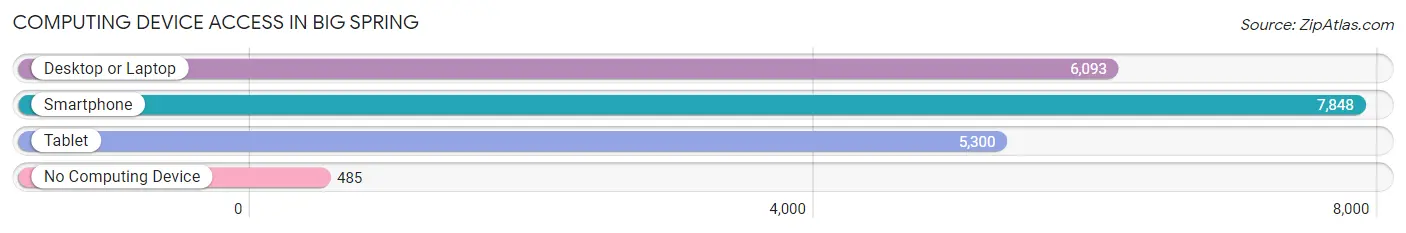
| Device Type | # Households | % Households |
| Desktop or Laptop | 6,093 | 68.9% |
| Smartphone | 7,848 | 88.7% |
| Tablet | 5,300 | 59.9% |
| No Computing Device | 485 | 5.5% |
| Total | 8,849 | 100.0% |
Internet Access in Big Spring
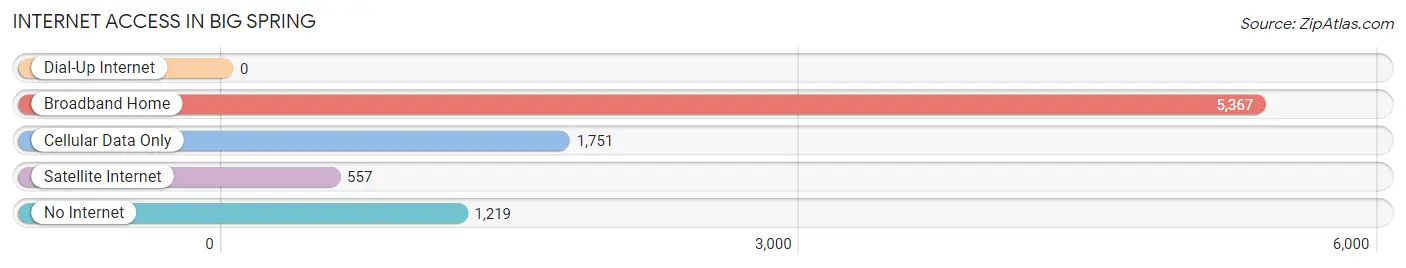
| Internet Type | # Households | % Households |
| Dial-Up Internet | 0 | 0.0% |
| Broadband Home | 5,367 | 60.7% |
| Cellular Data Only | 1,751 | 19.8% |
| Satellite Internet | 557 | 6.3% |
| No Internet | 1,219 | 13.8% |
| Total | 8,849 | 100.0% |
Big Spring Summary
Introduction
Big Spring is a city located in Howard County, Texas, United States. It is the county seat of Howard County and is located in the Permian Basin region of West Texas. The city is situated at the intersection of U.S. Highway 87 and Interstate 20, approximately 30 miles east of Midland and Odessa. As of the 2010 census, the population of Big Spring was 27,282.
History
Big Spring was founded in 1882 by the Texas and Pacific Railway Company. The city was named after a large spring that was located in the area. The spring was used by Native Americans and early settlers for its healing properties. The city quickly grew and by the early 1900s, it had become a major center for the oil and gas industry.
In the 1920s, Big Spring was a major stop on the Texas and Pacific Railway. The city was also home to a large military base, Big Spring Army Airfield, which was used during World War II. The base was closed in 1945 and the land was sold to the city.
Geography
Big Spring is located in the Permian Basin region of West Texas. The city is situated at the intersection of U.S. Highway 87 and Interstate 20, approximately 30 miles east of Midland and Odessa. The city is located in the foothills of the Caprock Escarpment, a geological formation that runs from the Texas Panhandle to the Big Bend region of West Texas.
The city has a total area of 16.2 square miles, of which 16.1 square miles is land and 0.1 square miles is water. The climate in Big Spring is semi-arid, with hot summers and mild winters. The average annual temperature is 64.3°F, with an average high of 91.2°F in July and an average low of 33.2°F in January.
Economy
Big Spring is a major center for the oil and gas industry. The city is home to several oil and gas companies, including Chevron, ConocoPhillips, and Halliburton. The city is also home to several manufacturing companies, including Big Spring Industries, which produces a variety of products, including furniture, clothing, and automotive parts.
The city is also home to several retail stores, including Walmart, Target, and Lowe's. The city is also home to several restaurants, including McDonald's, Burger King, and Sonic Drive-In.
Demographics
As of the 2010 census, the population of Big Spring was 27,282. The racial makeup of the city was 75.3% White, 5.2% African American, 0.7% Native American, 0.7% Asian, 0.1% Pacific Islander, 15.7% from other races, and 2.3% from two or more races. Hispanic or Latino of any race were 37.2% of the population.
The median income for a household in the city was $31,945, and the median income for a family was $37,945. The per capita income for the city was $17,845. About 17.2% of families and 20.7% of the population were below the poverty line, including 28.2% of those under age 18 and 11.2% of those age 65 or over.
Conclusion
Big Spring is a city located in Howard County, Texas, United States. It is the county seat of Howard County and is located in the Permian Basin region of West Texas. The city is situated at the intersection of U.S. Highway 87 and Interstate 20, approximately 30 miles east of Midland and Odessa. As of the 2010 census, the population of Big Spring was 27,282. The city is a major center for the oil and gas industry and is home to several manufacturing and retail companies. The racial makeup of the city was 75.3% White, 5.2% African American, 0.7% Native American, 0.7% Asian, 0.1% Pacific Islander, 15.7% from other races, and 2.3% from two or more races. The median income for a household in the city was $31,945, and the median income for a family was $37,945. About 17.2% of families and 20.7% of the population were below the poverty line.
Common Questions
What is Per Capita Income in Big Spring?
Per Capita income in Big Spring is $28,762.
What is the Median Family Income in Big Spring?
Median Family Income in Big Spring is $75,192.
What is the Median Household income in Big Spring?
Median Household Income in Big Spring is $65,418.
What is Income or Wage Gap in Big Spring?
Income or Wage Gap in Big Spring is 52.4%.
Women in Big Spring earn 47.6 cents for every dollar earned by a man.
What is Inequality or Gini Index in Big Spring?
Inequality or Gini Index in Big Spring is 0.43.
What is the Total Population of Big Spring?
Total Population of Big Spring is 25,949.
What is the Total Male Population of Big Spring?
Total Male Population of Big Spring is 14,847.
What is the Total Female Population of Big Spring?
Total Female Population of Big Spring is 11,102.
What is the Ratio of Males per 100 Females in Big Spring?
There are 133.73 Males per 100 Females in Big Spring.
What is the Ratio of Females per 100 Males in Big Spring?
There are 74.78 Females per 100 Males in Big Spring.
What is the Median Population Age in Big Spring?
Median Population Age in Big Spring is 36.9 Years.
What is the Average Family Size in Big Spring
Average Family Size in Big Spring is 3.1 People.
What is the Average Household Size in Big Spring
Average Household Size in Big Spring is 2.5 People.
How Large is the Labor Force in Big Spring?
There are 10,560 People in the Labor Forcein in Big Spring.
What is the Percentage of People in the Labor Force in Big Spring?
50.3% of People are in the Labor Force in Big Spring.
What is the Unemployment Rate in Big Spring?
Unemployment Rate in Big Spring is 6.8%.