Kerrville, TX Map & Demographics
Kerrville Map
Kerrville Overview
$33,733
PER CAPITA INCOME
$76,192
AVG FAMILY INCOME
$58,797
AVG HOUSEHOLD INCOME
17.7%
WAGE / INCOME GAP [ % ]
82.3¢/ $1
WAGE / INCOME GAP [ $ ]
0.45
INEQUALITY / GINI INDEX
24,333
TOTAL POPULATION
11,468
MALE POPULATION
12,865
FEMALE POPULATION
89.14
MALES / 100 FEMALES
112.18
FEMALES / 100 MALES
39.9
MEDIAN AGE
2.9
AVG FAMILY SIZE
2.3
AVG HOUSEHOLD SIZE
10,760
LABOR FORCE [ PEOPLE ]
54.7%
PERCENT IN LABOR FORCE
2.5%
UNEMPLOYMENT RATE
Kerrville Zip Codes
Kerrville Area Codes
Income in Kerrville
Income Overview in Kerrville
Per Capita Income in Kerrville is $33,733, while median incomes of families and households are $76,192 and $58,797 respectively.
| Characteristic | Number | Measure |
| Per Capita Income | 24,333 | $33,733 |
| Median Family Income | 6,195 | $76,192 |
| Mean Family Income | 6,195 | $99,462 |
| Median Household Income | 10,086 | $58,797 |
| Mean Household Income | 10,086 | $80,460 |
| Income Deficit | 6,195 | $0 |
| Wage / Income Gap (%) | 24,333 | 17.67% |
| Wage / Income Gap ($) | 24,333 | 82.33¢ per $1 |
| Gini / Inequality Index | 24,333 | 0.45 |
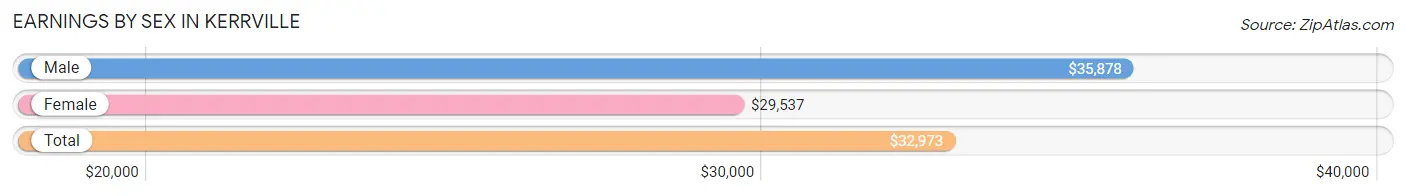
Earnings by Sex in Kerrville
Average Earnings in Kerrville are $32,973, $35,878 for men and $29,537 for women, a difference of 17.7%.
| Sex | Number | Average Earnings |
| Male | 5,784 (50.4%) | $35,878 |
| Female | 5,698 (49.6%) | $29,537 |
| Total | 11,482 (100.0%) | $32,973 |
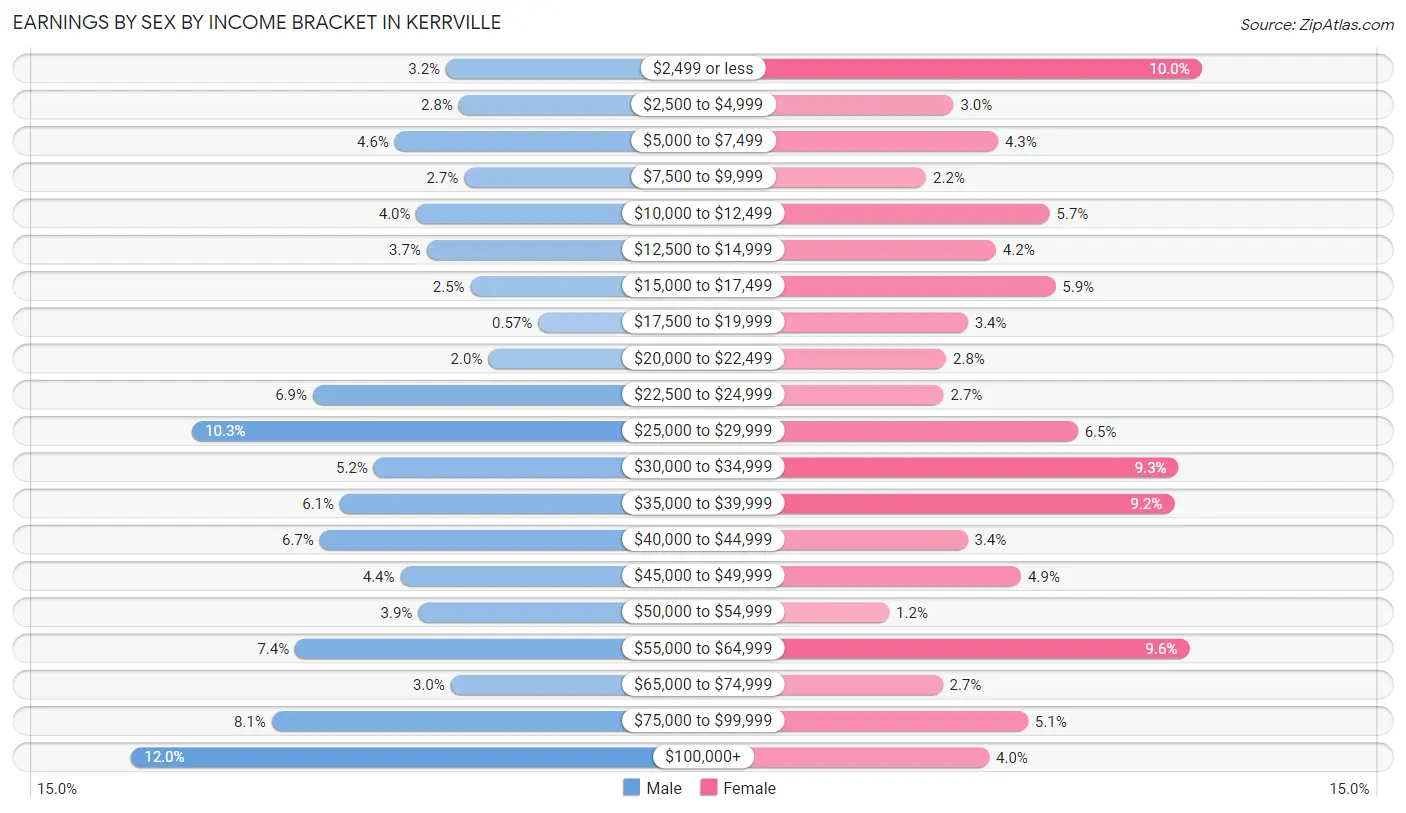
Earnings by Sex by Income Bracket in Kerrville
The most common earnings brackets in Kerrville are $100,000+ for men (694 | 12.0%) and $2,499 or less for women (568 | 10.0%).
| Income | Male | Female |
| $2,499 or less | 183 (3.2%) | 568 (10.0%) |
| $2,500 to $4,999 | 162 (2.8%) | 171 (3.0%) |
| $5,000 to $7,499 | 266 (4.6%) | 242 (4.3%) |
| $7,500 to $9,999 | 153 (2.6%) | 127 (2.2%) |
| $10,000 to $12,499 | 231 (4.0%) | 325 (5.7%) |
| $12,500 to $14,999 | 214 (3.7%) | 239 (4.2%) |
| $15,000 to $17,499 | 143 (2.5%) | 334 (5.9%) |
| $17,500 to $19,999 | 33 (0.6%) | 194 (3.4%) |
| $20,000 to $22,499 | 114 (2.0%) | 159 (2.8%) |
| $22,500 to $24,999 | 399 (6.9%) | 155 (2.7%) |
| $25,000 to $29,999 | 595 (10.3%) | 370 (6.5%) |
| $30,000 to $34,999 | 300 (5.2%) | 531 (9.3%) |
| $35,000 to $39,999 | 355 (6.1%) | 524 (9.2%) |
| $40,000 to $44,999 | 388 (6.7%) | 193 (3.4%) |
| $45,000 to $49,999 | 257 (4.4%) | 279 (4.9%) |
| $50,000 to $54,999 | 228 (3.9%) | 68 (1.2%) |
| $55,000 to $64,999 | 428 (7.4%) | 548 (9.6%) |
| $65,000 to $74,999 | 175 (3.0%) | 153 (2.7%) |
| $75,000 to $99,999 | 466 (8.1%) | 290 (5.1%) |
| $100,000+ | 694 (12.0%) | 228 (4.0%) |
| Total | 5,784 (100.0%) | 5,698 (100.0%) |
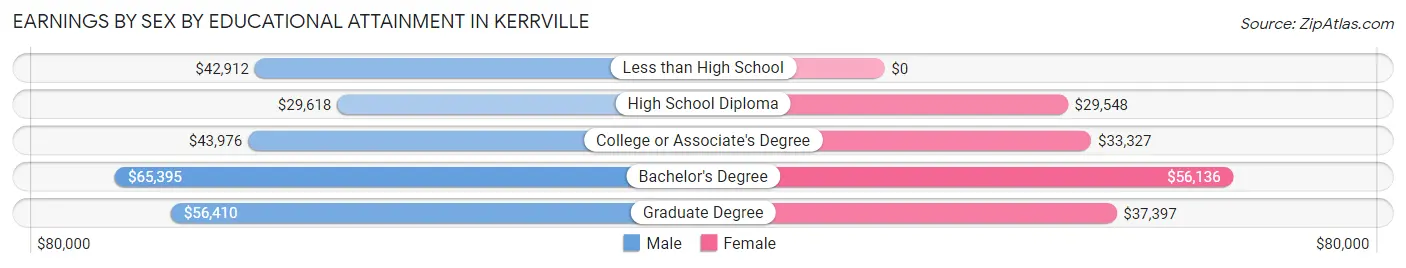
Earnings by Sex by Educational Attainment in Kerrville
Average earnings in Kerrville are $43,769 for men and $34,495 for women, a difference of 21.2%. Men with an educational attainment of bachelor's degree enjoy the highest average annual earnings of $65,395, while those with high school diploma education earn the least with $29,618. Women with an educational attainment of bachelor's degree earn the most with the average annual earnings of $56,136, while those with high school diploma education have the smallest earnings of $29,548.
| Educational Attainment | Male Income | Female Income |
| Less than High School | $42,912 | $0 |
| High School Diploma | $29,618 | $29,548 |
| College or Associate's Degree | $43,976 | $33,327 |
| Bachelor's Degree | $65,395 | $56,136 |
| Graduate Degree | $56,410 | $37,397 |
| Total | $43,769 | $34,495 |
Family Income in Kerrville
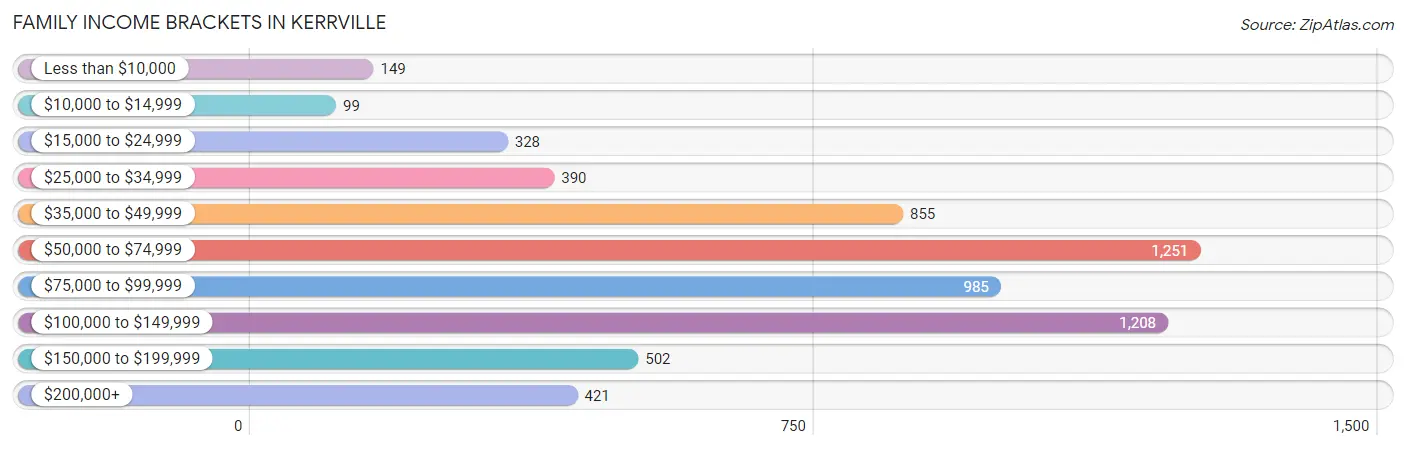
Family Income Brackets in Kerrville
According to the Kerrville family income data, there are 1,251 families falling into the $50,000 to $74,999 income range, which is the most common income bracket and makes up 20.2% of all families. Conversely, the $10,000 to $14,999 income bracket is the least frequent group with only 99 families (1.6%) belonging to this category.
| Income Bracket | # Families | % Families |
| Less than $10,000 | 149 | 2.4% |
| $10,000 to $14,999 | 99 | 1.6% |
| $15,000 to $24,999 | 328 | 5.3% |
| $25,000 to $34,999 | 390 | 6.3% |
| $35,000 to $49,999 | 855 | 13.8% |
| $50,000 to $74,999 | 1,251 | 20.2% |
| $75,000 to $99,999 | 985 | 15.9% |
| $100,000 to $149,999 | 1,208 | 19.5% |
| $150,000 to $199,999 | 502 | 8.1% |
| $200,000+ | 421 | 6.8% |
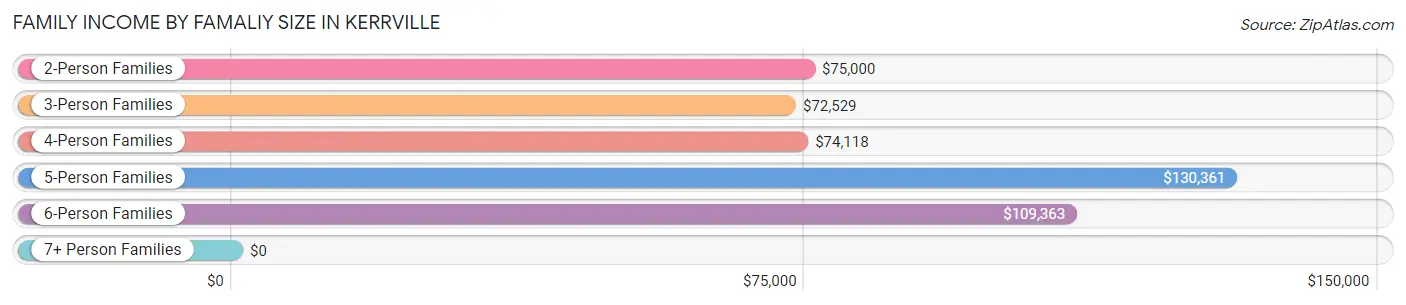
Family Income by Famaliy Size in Kerrville
5-person families (305 | 4.9%) account for the highest median family income in Kerrville with $130,361 per family, while 2-person families (3,686 | 59.5%) have the highest median income of $37,500 per family member.
| Income Bracket | # Families | Median Income |
| 2-Person Families | 3,686 (59.5%) | $75,000 |
| 3-Person Families | 1,211 (19.6%) | $72,529 |
| 4-Person Families | 690 (11.1%) | $74,118 |
| 5-Person Families | 305 (4.9%) | $130,361 |
| 6-Person Families | 261 (4.2%) | $109,363 |
| 7+ Person Families | 42 (0.7%) | $0 |
| Total | 6,195 (100.0%) | $76,192 |
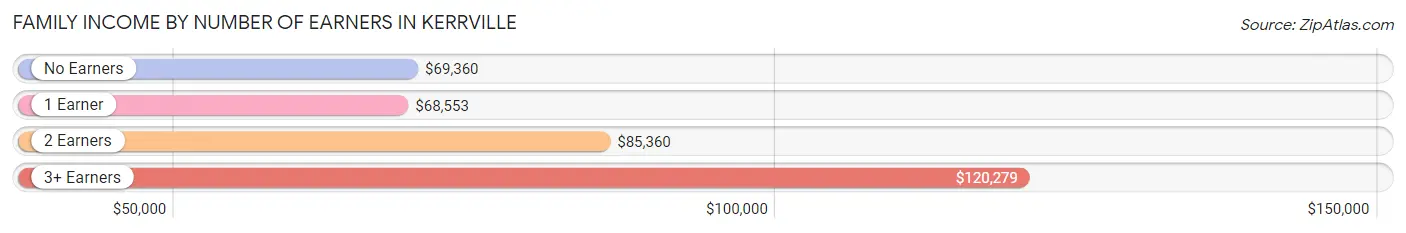
Family Income by Number of Earners in Kerrville
The median family income in Kerrville is $76,192, with families comprising 3+ earners (407) having the highest median family income of $120,279, while families with 1 earner (1,988) have the lowest median family income of $68,553, accounting for 6.6% and 32.1% of families, respectively.
| Number of Earners | # Families | Median Income |
| No Earners | 1,341 (21.6%) | $69,360 |
| 1 Earner | 1,988 (32.1%) | $68,553 |
| 2 Earners | 2,459 (39.7%) | $85,360 |
| 3+ Earners | 407 (6.6%) | $120,279 |
| Total | 6,195 (100.0%) | $76,192 |
Household Income in Kerrville
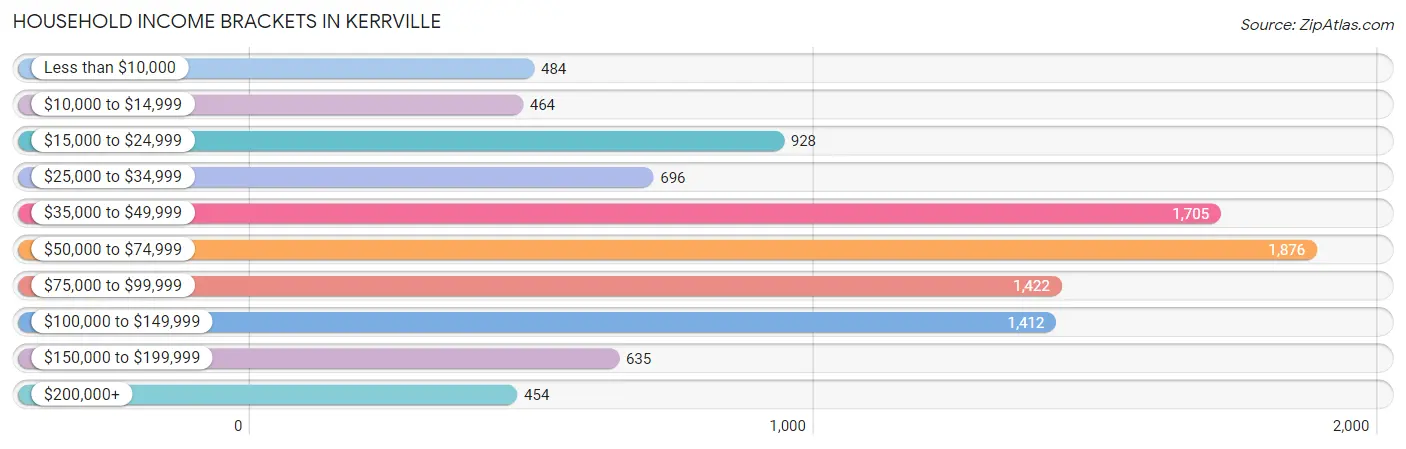
Household Income Brackets in Kerrville
With 1,876 households falling in the category, the $50,000 to $74,999 income range is the most frequent in Kerrville, accounting for 18.6% of all households. In contrast, only 454 households (4.5%) fall into the $200,000+ income bracket, making it the least populous group.
| Income Bracket | # Households | % Households |
| Less than $10,000 | 484 | 4.8% |
| $10,000 to $14,999 | 464 | 4.6% |
| $15,000 to $24,999 | 928 | 9.2% |
| $25,000 to $34,999 | 696 | 6.9% |
| $35,000 to $49,999 | 1,705 | 16.9% |
| $50,000 to $74,999 | 1,876 | 18.6% |
| $75,000 to $99,999 | 1,422 | 14.1% |
| $100,000 to $149,999 | 1,412 | 14.0% |
| $150,000 to $199,999 | 635 | 6.3% |
| $200,000+ | 454 | 4.5% |
Household Income by Householder Age in Kerrville
The median household income in Kerrville is $58,797, with the highest median household income of $71,786 found in the 45 to 64 years age bracket for the primary householder. A total of 2,474 households (24.5%) fall into this category. Meanwhile, the 15 to 24 years age bracket for the primary householder has the lowest median household income of $36,114, with 644 households (6.4%) in this group.
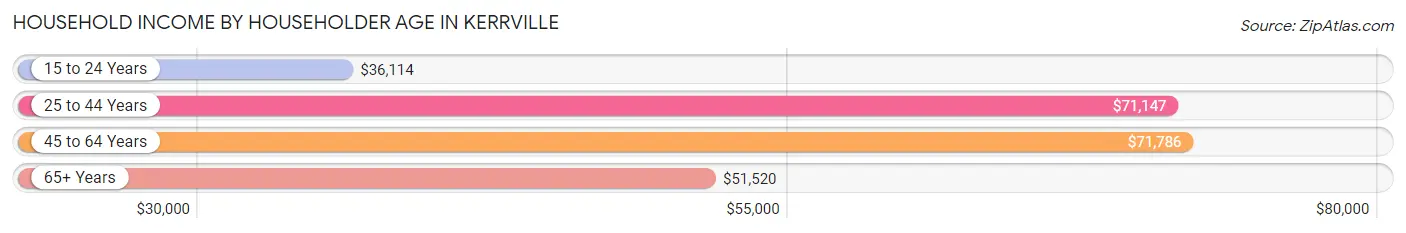
| Income Bracket | # Households | Median Income |
| 15 to 24 Years | 644 (6.4%) | $36,114 |
| 25 to 44 Years | 2,823 (28.0%) | $71,147 |
| 45 to 64 Years | 2,474 (24.5%) | $71,786 |
| 65+ Years | 4,145 (41.1%) | $51,520 |
| Total | 10,086 (100.0%) | $58,797 |
Poverty in Kerrville
Income Below Poverty by Sex and Age in Kerrville
With 15.0% poverty level for males and 15.5% for females among the residents of Kerrville, 16 and 17 year old males and 18 to 24 year old females are the most vulnerable to poverty, with 131 males (52.8%) and 311 females (26.9%) in their respective age groups living below the poverty level.
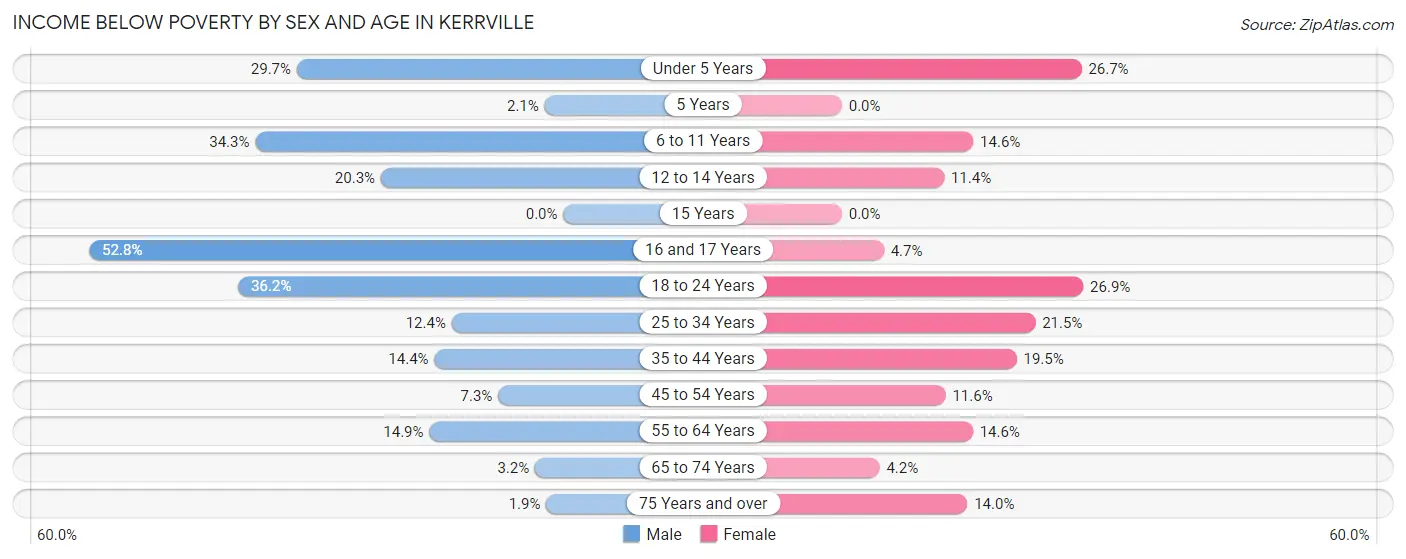
| Age Bracket | Male | Female |
| Under 5 Years | 249 (29.7%) | 221 (26.7%) |
| 5 Years | 6 (2.1%) | 0 (0.0%) |
| 6 to 11 Years | 188 (34.3%) | 141 (14.6%) |
| 12 to 14 Years | 101 (20.3%) | 38 (11.4%) |
| 15 Years | 0 (0.0%) | 0 (0.0%) |
| 16 and 17 Years | 131 (52.8%) | 14 (4.7%) |
| 18 to 24 Years | 288 (36.2%) | 311 (26.9%) |
| 25 to 34 Years | 192 (12.4%) | 289 (21.5%) |
| 35 to 44 Years | 143 (14.4%) | 237 (19.5%) |
| 45 to 54 Years | 83 (7.3%) | 124 (11.6%) |
| 55 to 64 Years | 167 (14.9%) | 171 (14.6%) |
| 65 to 74 Years | 42 (3.2%) | 67 (4.2%) |
| 75 Years and over | 25 (1.9%) | 258 (14.0%) |
| Total | 1,615 (15.0%) | 1,871 (15.5%) |
Income Above Poverty by Sex and Age in Kerrville
According to the poverty statistics in Kerrville, males aged 15 years and females aged 5 years are the age groups that are most secure financially, with 100.0% of males and 100.0% of females in these age groups living above the poverty line.
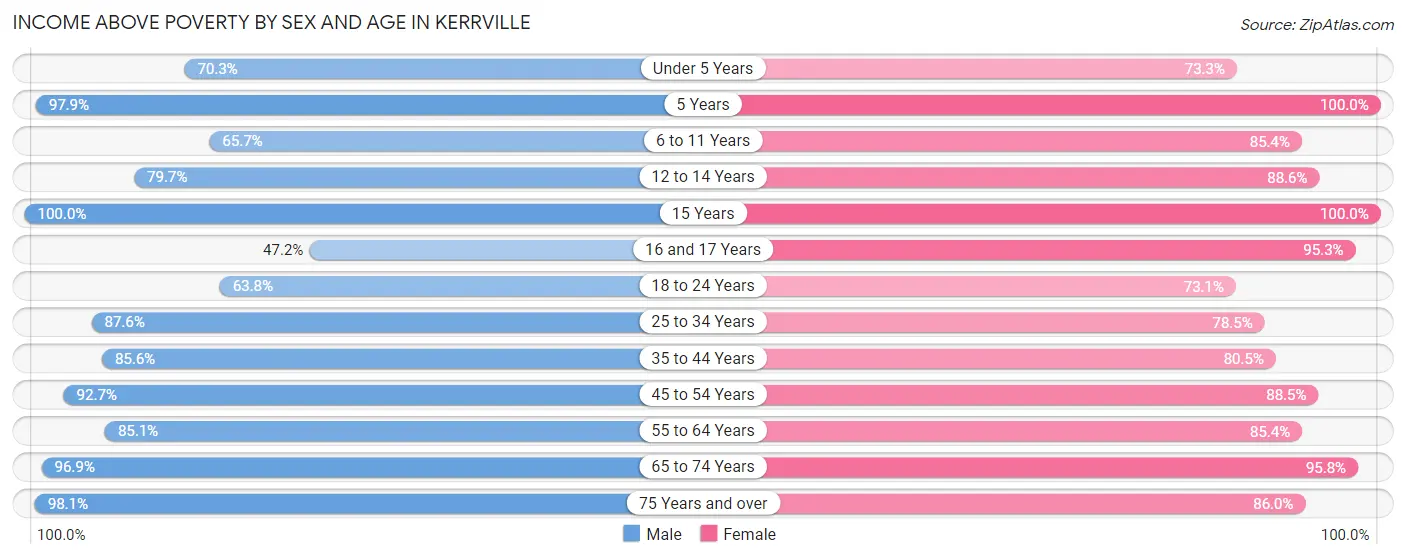
| Age Bracket | Male | Female |
| Under 5 Years | 590 (70.3%) | 607 (73.3%) |
| 5 Years | 281 (97.9%) | 140 (100.0%) |
| 6 to 11 Years | 360 (65.7%) | 823 (85.4%) |
| 12 to 14 Years | 396 (79.7%) | 296 (88.6%) |
| 15 Years | 88 (100.0%) | 110 (100.0%) |
| 16 and 17 Years | 117 (47.2%) | 286 (95.3%) |
| 18 to 24 Years | 507 (63.8%) | 846 (73.1%) |
| 25 to 34 Years | 1,353 (87.6%) | 1,053 (78.5%) |
| 35 to 44 Years | 853 (85.6%) | 981 (80.5%) |
| 45 to 54 Years | 1,060 (92.7%) | 950 (88.4%) |
| 55 to 64 Years | 952 (85.1%) | 1,002 (85.4%) |
| 65 to 74 Years | 1,292 (96.9%) | 1,528 (95.8%) |
| 75 Years and over | 1,292 (98.1%) | 1,589 (86.0%) |
| Total | 9,141 (85.0%) | 10,211 (84.5%) |
Income Below Poverty Among Married-Couple Families in Kerrville
The poverty statistics for married-couple families in Kerrville show that 3.9% or 168 of the total 4,335 families live below the poverty line. Families with 3 or 4 children have the highest poverty rate of 15.1%, comprising of 63 families. On the other hand, families with 5 or more children have the lowest poverty rate of 0.0%, which includes 0 families.
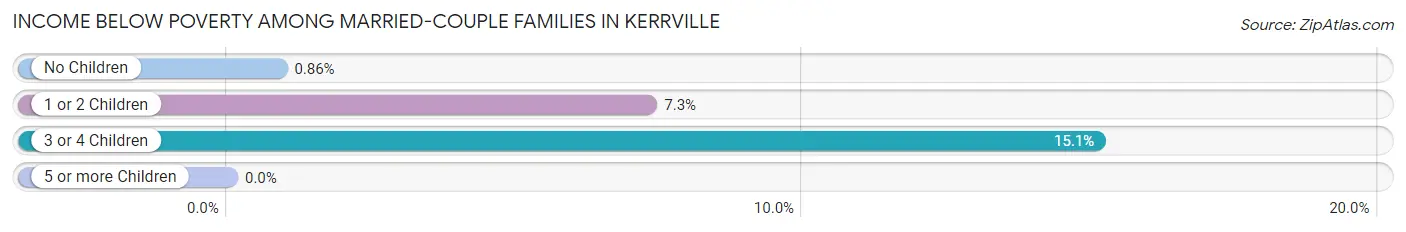
| Children | Above Poverty | Below Poverty |
| No Children | 2,768 (99.1%) | 24 (0.9%) |
| 1 or 2 Children | 1,029 (92.7%) | 81 (7.3%) |
| 3 or 4 Children | 354 (84.9%) | 63 (15.1%) |
| 5 or more Children | 16 (100.0%) | 0 (0.0%) |
| Total | 4,167 (96.1%) | 168 (3.9%) |
Income Below Poverty Among Single-Parent Households in Kerrville
According to the poverty data in Kerrville, 5.4% or 25 single-father households and 29.4% or 410 single-mother households are living below the poverty line. Among single-father households, those with 1 or 2 children have the highest poverty rate, with 25 households (11.0%) experiencing poverty. Likewise, among single-mother households, those with 1 or 2 children have the highest poverty rate, with 369 households (52.9%) falling below the poverty line.
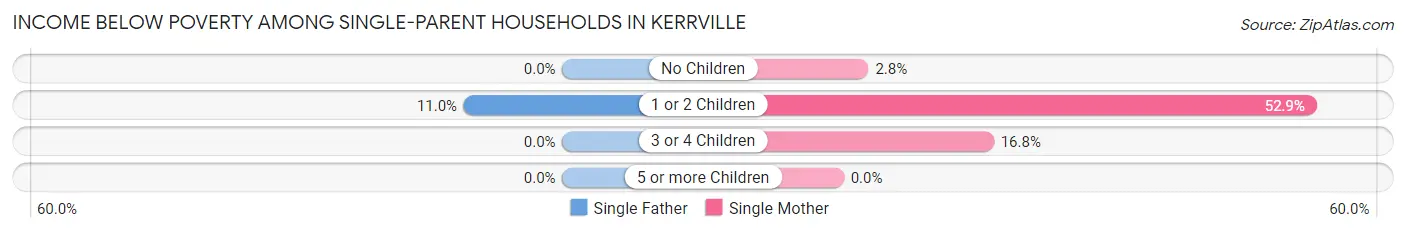
| Children | Single Father | Single Mother |
| No Children | 0 (0.0%) | 15 (2.8%) |
| 1 or 2 Children | 25 (11.0%) | 369 (52.9%) |
| 3 or 4 Children | 0 (0.0%) | 26 (16.8%) |
| 5 or more Children | 0 (0.0%) | 0 (0.0%) |
| Total | 25 (5.4%) | 410 (29.4%) |
Income Below Poverty Among Married-Couple vs Single-Parent Households in Kerrville
The poverty data for Kerrville shows that 168 of the married-couple family households (3.9%) and 435 of the single-parent households (23.4%) are living below the poverty level. Within the married-couple family households, those with 3 or 4 children have the highest poverty rate, with 63 households (15.1%) falling below the poverty line. Among the single-parent households, those with 1 or 2 children have the highest poverty rate, with 394 household (42.6%) living below poverty.
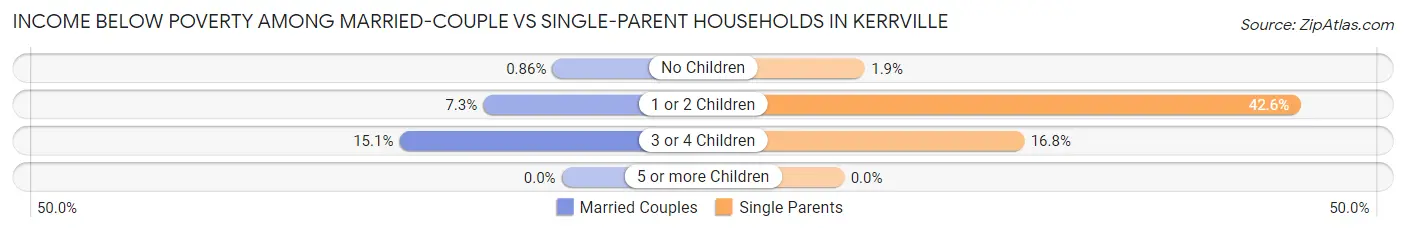
| Children | Married-Couple Families | Single-Parent Households |
| No Children | 24 (0.9%) | 15 (1.9%) |
| 1 or 2 Children | 81 (7.3%) | 394 (42.6%) |
| 3 or 4 Children | 63 (15.1%) | 26 (16.8%) |
| 5 or more Children | 0 (0.0%) | 0 (0.0%) |
| Total | 168 (3.9%) | 435 (23.4%) |
Race in Kerrville
The most populous races in Kerrville are White / Caucasian (18,537 | 76.2%), Hispanic or Latino (7,488 | 30.8%), and Two or more Races (2,624 | 10.8%).
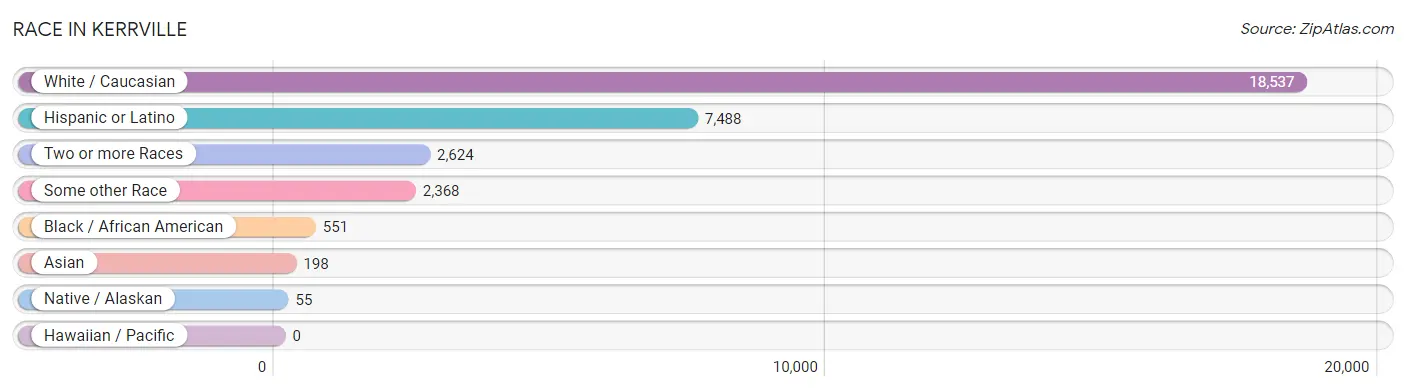
| Race | # Population | % Population |
| Asian | 198 | 0.8% |
| Black / African American | 551 | 2.3% |
| Hawaiian / Pacific | 0 | 0.0% |
| Hispanic or Latino | 7,488 | 30.8% |
| Native / Alaskan | 55 | 0.2% |
| White / Caucasian | 18,537 | 76.2% |
| Two or more Races | 2,624 | 10.8% |
| Some other Race | 2,368 | 9.7% |
| Total | 24,333 | 100.0% |
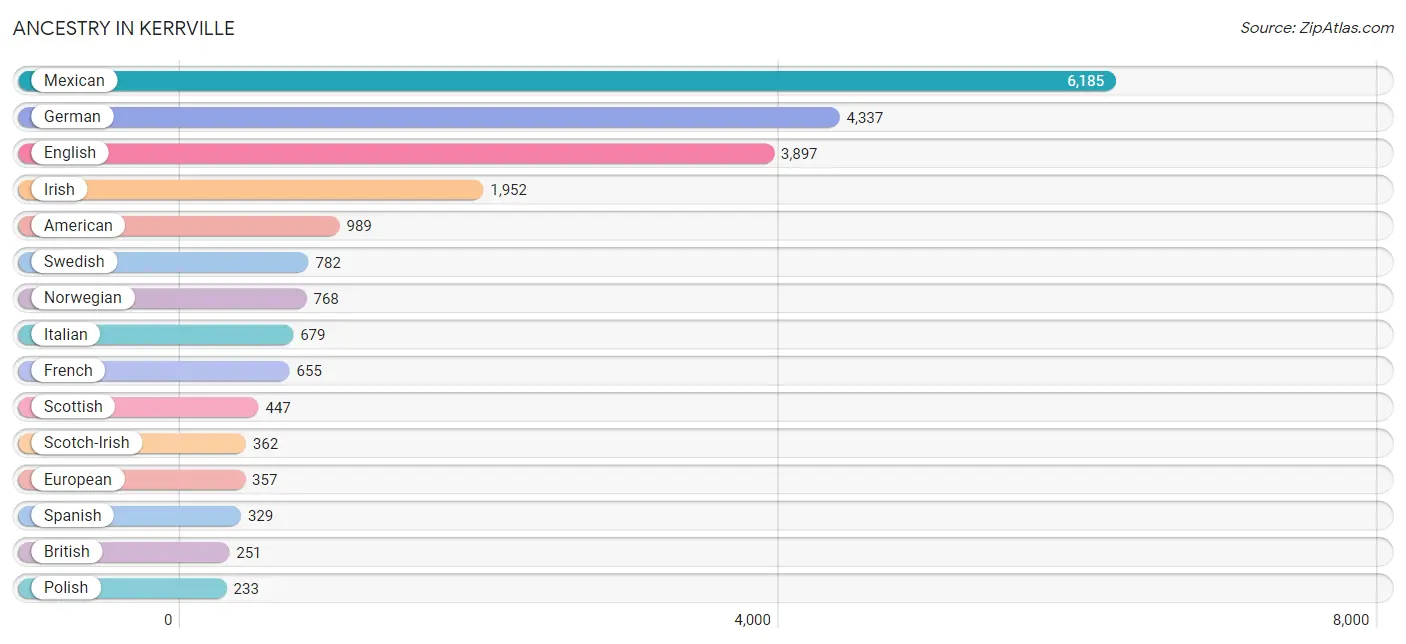
Ancestry in Kerrville
The most populous ancestries reported in Kerrville are Mexican (6,185 | 25.4%), German (4,337 | 17.8%), English (3,897 | 16.0%), Irish (1,952 | 8.0%), and American (989 | 4.1%), together accounting for 71.3% of all Kerrville residents.
| Ancestry | # Population | % Population |
| African | 156 | 0.6% |
| Albanian | 6 | 0.0% |
| Alsatian | 28 | 0.1% |
| American | 989 | 4.1% |
| Austrian | 24 | 0.1% |
| Belgian | 4 | 0.0% |
| Belizean | 18 | 0.1% |
| Bhutanese | 30 | 0.1% |
| Blackfeet | 14 | 0.1% |
| British | 251 | 1.0% |
| Burmese | 78 | 0.3% |
| Cajun | 7 | 0.0% |
| Canadian | 25 | 0.1% |
| Central American | 41 | 0.2% |
| Cherokee | 56 | 0.2% |
| Choctaw | 23 | 0.1% |
| Colombian | 41 | 0.2% |
| Comanche | 3 | 0.0% |
| Croatian | 32 | 0.1% |
| Cuban | 4 | 0.0% |
| Czech | 186 | 0.8% |
| Czechoslovakian | 9 | 0.0% |
| Danish | 72 | 0.3% |
| Dutch | 113 | 0.5% |
| Eastern European | 75 | 0.3% |
| Ecuadorian | 6 | 0.0% |
| English | 3,897 | 16.0% |
| Ethiopian | 4 | 0.0% |
| European | 357 | 1.5% |
| Filipino | 25 | 0.1% |
| French | 655 | 2.7% |
| French Canadian | 41 | 0.2% |
| German | 4,337 | 17.8% |
| Greek | 38 | 0.2% |
| Guatemalan | 3 | 0.0% |
| Hungarian | 11 | 0.1% |
| Indian (Asian) | 4 | 0.0% |
| Irish | 1,952 | 8.0% |
| Italian | 679 | 2.8% |
| Kiowa | 4 | 0.0% |
| Korean | 16 | 0.1% |
| Laotian | 27 | 0.1% |
| Macedonian | 4 | 0.0% |
| Mexican | 6,185 | 25.4% |
| Northern European | 83 | 0.3% |
| Norwegian | 768 | 3.2% |
| Panamanian | 8 | 0.0% |
| Polish | 233 | 1.0% |
| Puerto Rican | 63 | 0.3% |
| Romanian | 82 | 0.3% |
| Russian | 216 | 0.9% |
| Salvadoran | 30 | 0.1% |
| Scandinavian | 50 | 0.2% |
| Scotch-Irish | 362 | 1.5% |
| Scottish | 447 | 1.8% |
| Serbian | 9 | 0.0% |
| Sioux | 52 | 0.2% |
| South American | 53 | 0.2% |
| Spanish | 329 | 1.3% |
| Subsaharan African | 160 | 0.7% |
| Swedish | 782 | 3.2% |
| Swiss | 5 | 0.0% |
| Thai | 150 | 0.6% |
| Venezuelan | 6 | 0.0% |
| Vietnamese | 8 | 0.0% |
| Welsh | 225 | 0.9% | View All 66 Rows |
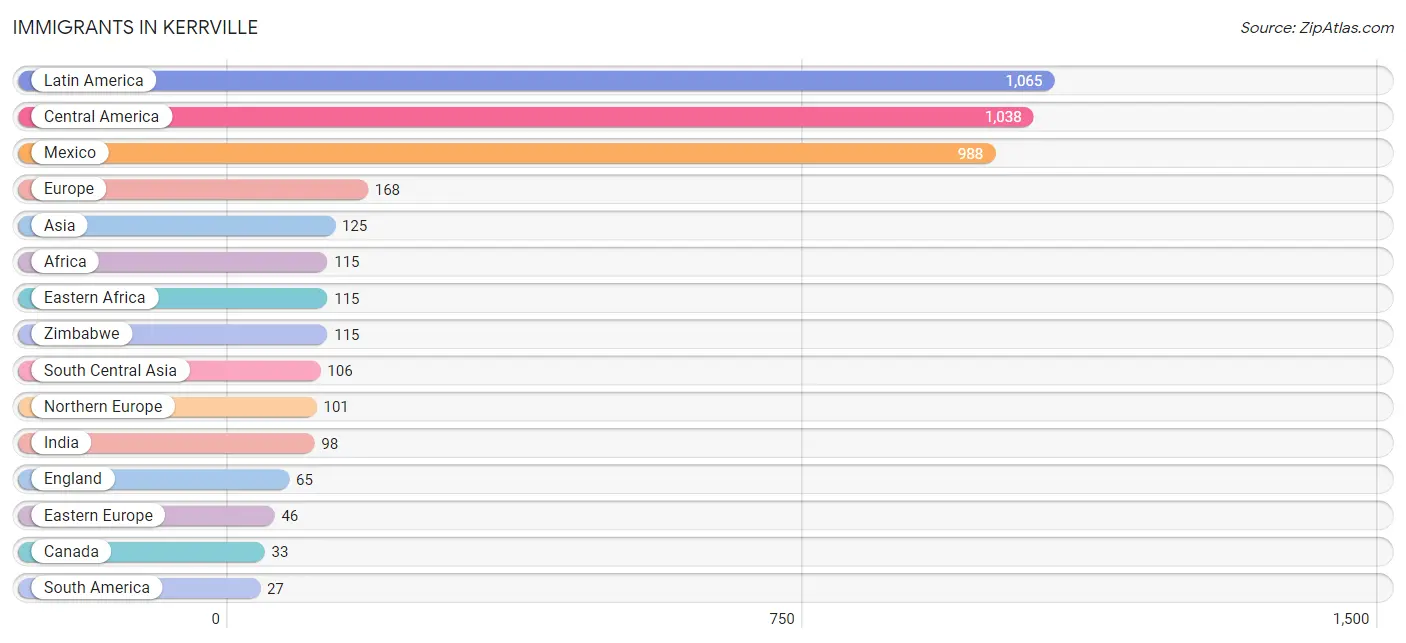
Immigrants in Kerrville
The most numerous immigrant groups reported in Kerrville came from Latin America (1,065 | 4.4%), Central America (1,038 | 4.3%), Mexico (988 | 4.1%), Europe (168 | 0.7%), and Asia (125 | 0.5%), together accounting for 13.9% of all Kerrville residents.
| Immigration Origin | # Population | % Population |
| Africa | 115 | 0.5% |
| Asia | 125 | 0.5% |
| Bangladesh | 8 | 0.0% |
| Belize | 18 | 0.1% |
| Bolivia | 6 | 0.0% |
| Canada | 33 | 0.1% |
| Central America | 1,038 | 4.3% |
| Colombia | 21 | 0.1% |
| Croatia | 24 | 0.1% |
| Eastern Africa | 115 | 0.5% |
| Eastern Asia | 6 | 0.0% |
| Eastern Europe | 46 | 0.2% |
| El Salvador | 21 | 0.1% |
| England | 65 | 0.3% |
| Europe | 168 | 0.7% |
| Germany | 21 | 0.1% |
| Guatemala | 3 | 0.0% |
| India | 98 | 0.4% |
| Japan | 6 | 0.0% |
| Latin America | 1,065 | 4.4% |
| Latvia | 5 | 0.0% |
| Mexico | 988 | 4.1% |
| North Macedonia | 4 | 0.0% |
| Northern Europe | 101 | 0.4% |
| Panama | 8 | 0.0% |
| Philippines | 13 | 0.1% |
| Poland | 13 | 0.1% |
| South America | 27 | 0.1% |
| South Central Asia | 106 | 0.4% |
| South Eastern Asia | 13 | 0.1% |
| Western Europe | 21 | 0.1% |
| Zimbabwe | 115 | 0.5% | View All 32 Rows |
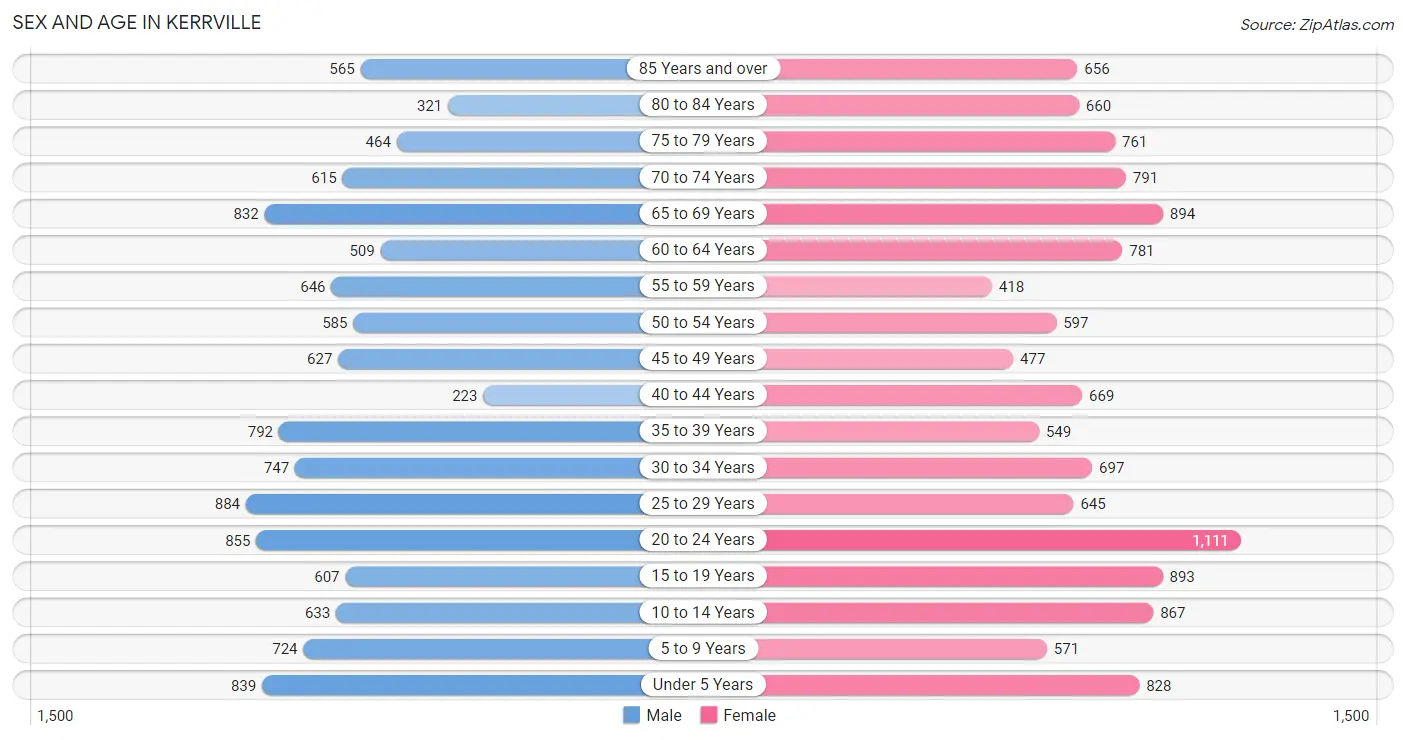
Sex and Age in Kerrville
Sex and Age in Kerrville
The most populous age groups in Kerrville are 25 to 29 Years (884 | 7.7%) for men and 20 to 24 Years (1,111 | 8.6%) for women.
| Age Bracket | Male | Female |
| Under 5 Years | 839 (7.3%) | 828 (6.4%) |
| 5 to 9 Years | 724 (6.3%) | 571 (4.4%) |
| 10 to 14 Years | 633 (5.5%) | 867 (6.7%) |
| 15 to 19 Years | 607 (5.3%) | 893 (6.9%) |
| 20 to 24 Years | 855 (7.5%) | 1,111 (8.6%) |
| 25 to 29 Years | 884 (7.7%) | 645 (5.0%) |
| 30 to 34 Years | 747 (6.5%) | 697 (5.4%) |
| 35 to 39 Years | 792 (6.9%) | 549 (4.3%) |
| 40 to 44 Years | 223 (1.9%) | 669 (5.2%) |
| 45 to 49 Years | 627 (5.5%) | 477 (3.7%) |
| 50 to 54 Years | 585 (5.1%) | 597 (4.6%) |
| 55 to 59 Years | 646 (5.6%) | 418 (3.3%) |
| 60 to 64 Years | 509 (4.4%) | 781 (6.1%) |
| 65 to 69 Years | 832 (7.2%) | 894 (7.0%) |
| 70 to 74 Years | 615 (5.4%) | 791 (6.1%) |
| 75 to 79 Years | 464 (4.1%) | 761 (5.9%) |
| 80 to 84 Years | 321 (2.8%) | 660 (5.1%) |
| 85 Years and over | 565 (4.9%) | 656 (5.1%) |
| Total | 11,468 (100.0%) | 12,865 (100.0%) |
Families and Households in Kerrville
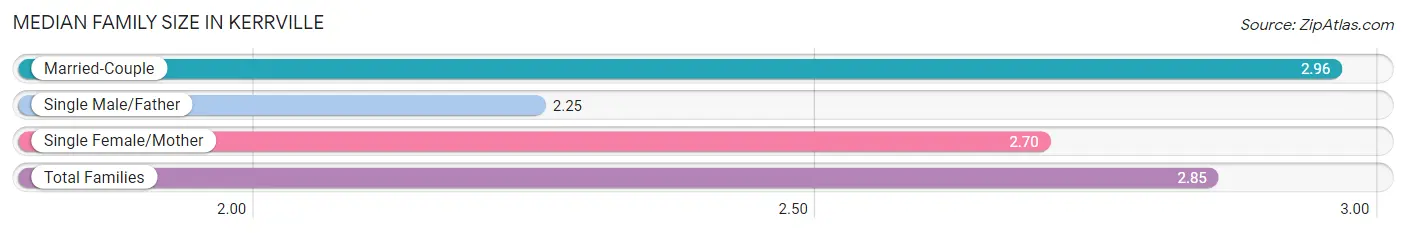
Median Family Size in Kerrville
The median family size in Kerrville is 2.85 persons per family, with married-couple families (4,335 | 70.0%) accounting for the largest median family size of 2.96 persons per family. On the other hand, single male/father families (466 | 7.5%) represent the smallest median family size with 2.25 persons per family.
| Family Type | # Families | Family Size |
| Married-Couple | 4,335 (70.0%) | 2.96 |
| Single Male/Father | 466 (7.5%) | 2.25 |
| Single Female/Mother | 1,394 (22.5%) | 2.70 |
| Total Families | 6,195 (100.0%) | 2.85 |
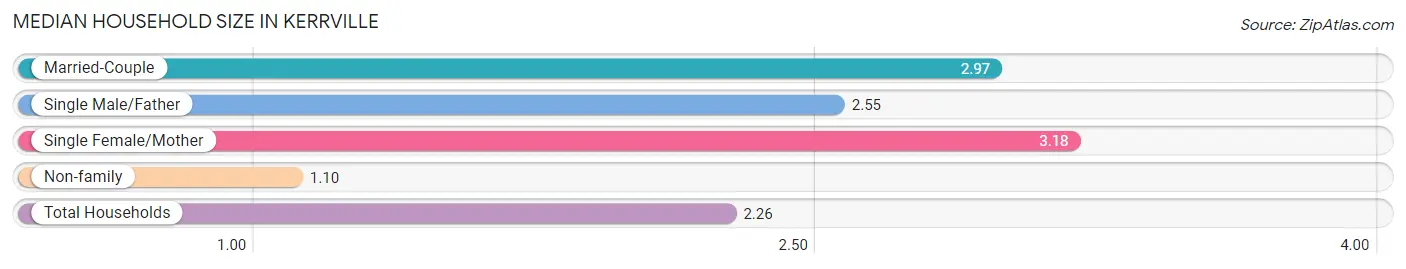
Median Household Size in Kerrville
The median household size in Kerrville is 2.26 persons per household, with single female/mother households (1,394 | 13.8%) accounting for the largest median household size of 3.18 persons per household. non-family households (3,891 | 38.6%) represent the smallest median household size with 1.10 persons per household.
| Household Type | # Households | Household Size |
| Married-Couple | 4,335 (43.0%) | 2.97 |
| Single Male/Father | 466 (4.6%) | 2.55 |
| Single Female/Mother | 1,394 (13.8%) | 3.18 |
| Non-family | 3,891 (38.6%) | 1.10 |
| Total Households | 10,086 (100.0%) | 2.26 |
Household Size by Marriage Status in Kerrville
Out of a total of 10,086 households in Kerrville, 6,195 (61.4%) are family households, while 3,891 (38.6%) are nonfamily households. The most numerous type of family households are 2-person households, comprising 3,370, and the most common type of nonfamily households are 1-person households, comprising 3,504.
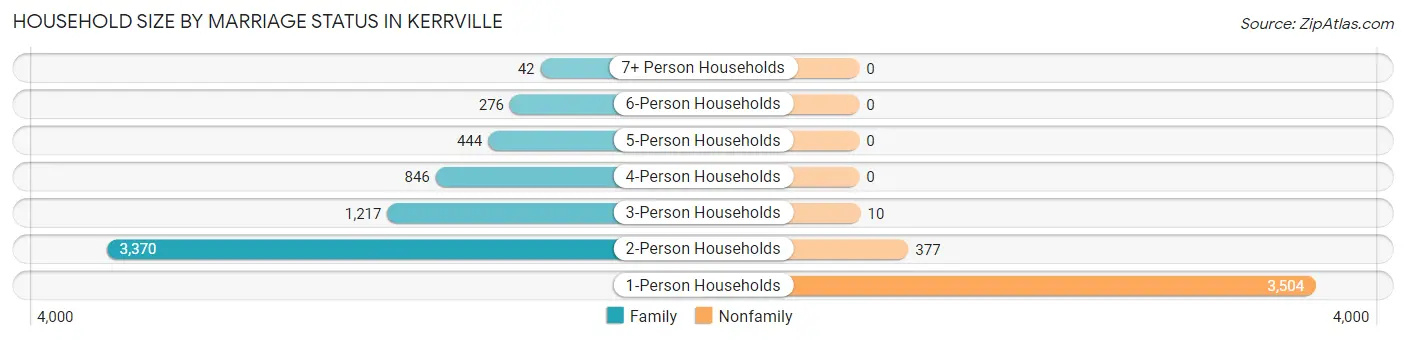
| Household Size | Family Households | Nonfamily Households |
| 1-Person Households | - | 3,504 (34.7%) |
| 2-Person Households | 3,370 (33.4%) | 377 (3.7%) |
| 3-Person Households | 1,217 (12.1%) | 10 (0.1%) |
| 4-Person Households | 846 (8.4%) | 0 (0.0%) |
| 5-Person Households | 444 (4.4%) | 0 (0.0%) |
| 6-Person Households | 276 (2.7%) | 0 (0.0%) |
| 7+ Person Households | 42 (0.4%) | 0 (0.0%) |
| Total | 6,195 (61.4%) | 3,891 (38.6%) |
Female Fertility in Kerrville
Fertility by Age in Kerrville
Average fertility rate in Kerrville is 99.0 births per 1,000 women. Women in the age bracket of 20 to 34 years have the highest fertility rate with 183.0 births per 1,000 women. Women in the age bracket of 20 to 34 years acount for 89.5% of all women with births.
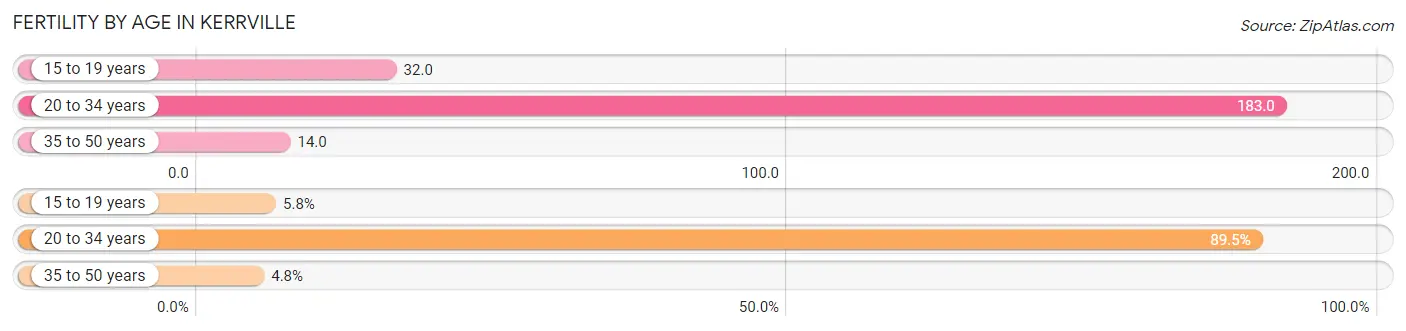
| Age Bracket | Women with Births | Births / 1,000 Women |
| 15 to 19 years | 29 (5.8%) | 32.0 |
| 20 to 34 years | 450 (89.5%) | 183.0 |
| 35 to 50 years | 24 (4.8%) | 14.0 |
| Total | 503 (100.0%) | 99.0 |
Fertility by Age by Marriage Status in Kerrville
56.1% of women with births (503) in Kerrville are married. The highest percentage of unmarried women with births falls into 20 to 34 years age bracket with 49.1% of them unmarried at the time of birth, while the lowest percentage of unmarried women with births belong to 15 to 19 years age bracket with 0.0% of them unmarried.
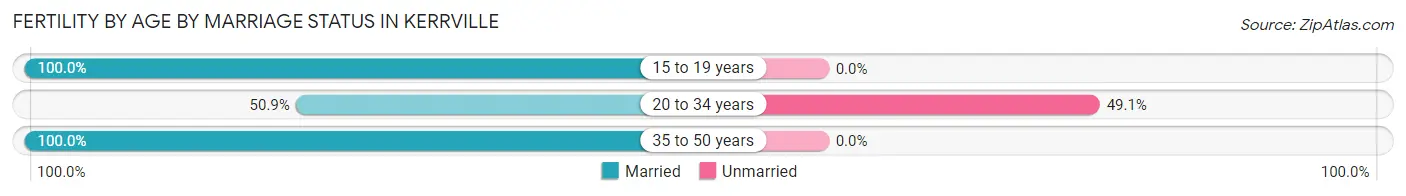
| Age Bracket | Married | Unmarried |
| 15 to 19 years | 29 (100.0%) | 0 (0.0%) |
| 20 to 34 years | 229 (50.9%) | 221 (49.1%) |
| 35 to 50 years | 24 (100.0%) | 0 (0.0%) |
| Total | 282 (56.1%) | 221 (43.9%) |
Fertility by Education in Kerrville
Average fertility rate in Kerrville is 99.0 births per 1,000 women. Women with the education attainment of less than high school have the highest fertility rate of 227.0 births per 1,000 women, while women with the education attainment of bachelor's degree have the lowest fertility at 27.0 births per 1,000 women. Women with the education attainment of less than high school represent 39.0% of all women with births.
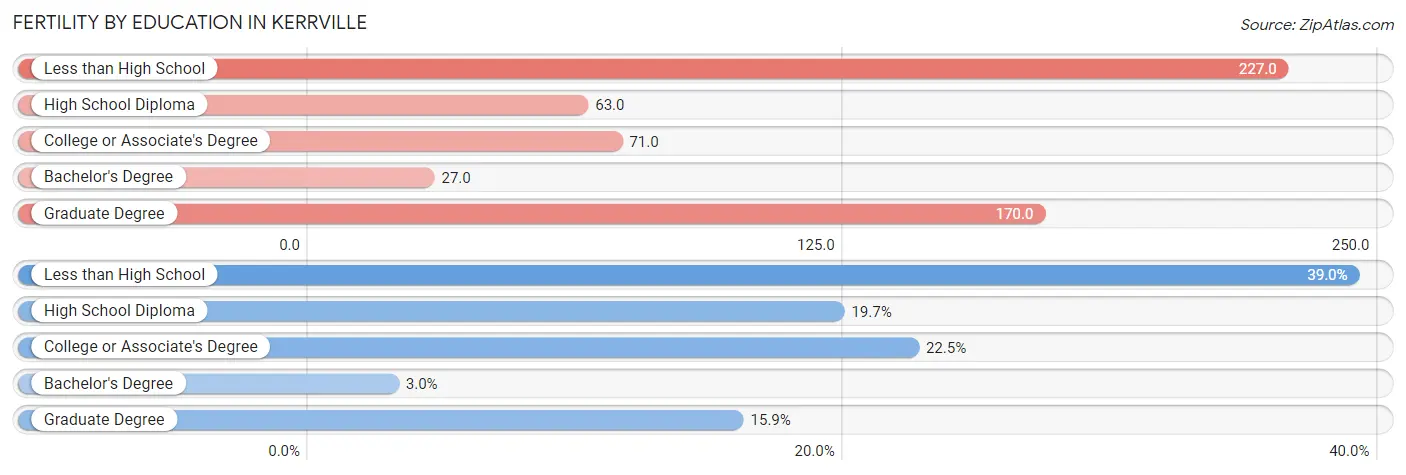
| Educational Attainment | Women with Births | Births / 1,000 Women |
| Less than High School | 196 (39.0%) | 227.0 |
| High School Diploma | 99 (19.7%) | 63.0 |
| College or Associate's Degree | 113 (22.5%) | 71.0 |
| Bachelor's Degree | 15 (3.0%) | 27.0 |
| Graduate Degree | 80 (15.9%) | 170.0 |
| Total | 503 (100.0%) | 99.0 |
Fertility by Education by Marriage Status in Kerrville
43.9% of women with births in Kerrville are unmarried. Women with the educational attainment of bachelor's degree are most likely to be married with 100.0% of them married at childbirth, while women with the educational attainment of college or associate's degree are least likely to be married with 73.5% of them unmarried at childbirth.
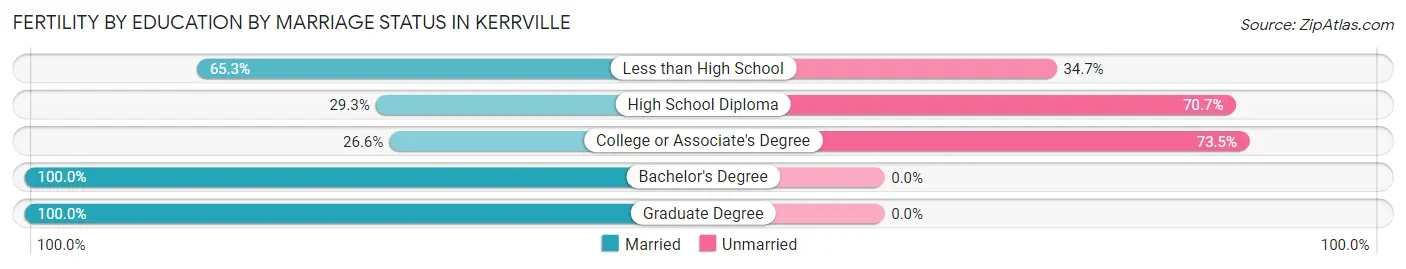
| Educational Attainment | Married | Unmarried |
| Less than High School | 128 (65.3%) | 68 (34.7%) |
| High School Diploma | 29 (29.3%) | 70 (70.7%) |
| College or Associate's Degree | 30 (26.6%) | 83 (73.5%) |
| Bachelor's Degree | 15 (100.0%) | 0 (0.0%) |
| Graduate Degree | 80 (100.0%) | 0 (0.0%) |
| Total | 282 (56.1%) | 221 (43.9%) |
Employment Characteristics in Kerrville
Employment by Class of Employer in Kerrville
Among the 10,099 employed individuals in Kerrville, private company employees (6,193 | 61.3%), not-for-profit organizations (1,134 | 11.2%), and self-employed (not incorporated) (1,111 | 11.0%) make up the most common classes of employment.
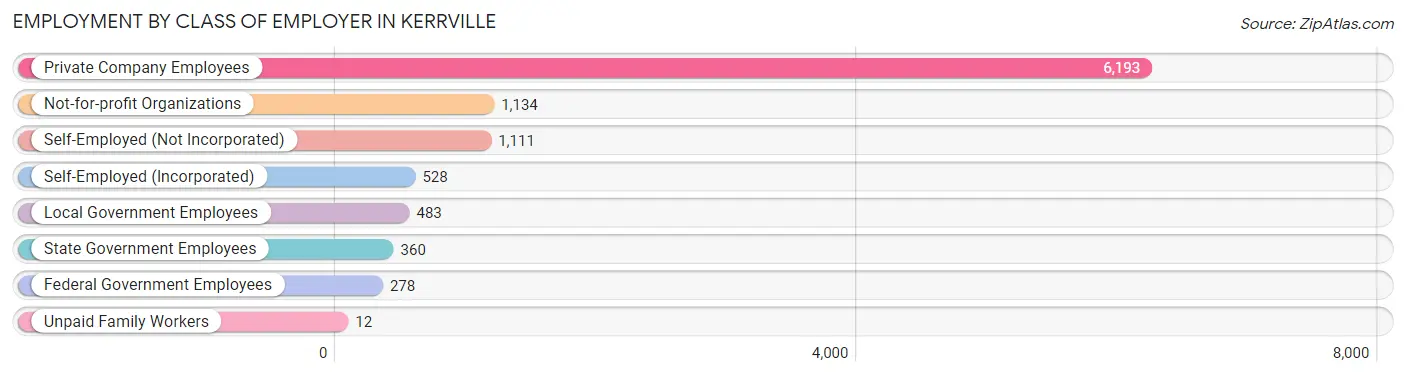
| Employer Class | # Employees | % Employees |
| Private Company Employees | 6,193 | 61.3% |
| Self-Employed (Incorporated) | 528 | 5.2% |
| Self-Employed (Not Incorporated) | 1,111 | 11.0% |
| Not-for-profit Organizations | 1,134 | 11.2% |
| Local Government Employees | 483 | 4.8% |
| State Government Employees | 360 | 3.6% |
| Federal Government Employees | 278 | 2.8% |
| Unpaid Family Workers | 12 | 0.1% |
| Total | 10,099 | 100.0% |
Employment Status by Age in Kerrville
According to the labor force statistics for Kerrville, out of the total population over 16 years of age (19,671), 54.7% or 10,760 individuals are in the labor force, with 2.5% or 269 of them unemployed. The age group with the highest labor force participation rate is 25 to 29 years, with 86.5% or 1,323 individuals in the labor force. Within the labor force, the 16 to 19 years age range has the highest percentage of unemployed individuals, with 24.1% or 135 of them being unemployed.
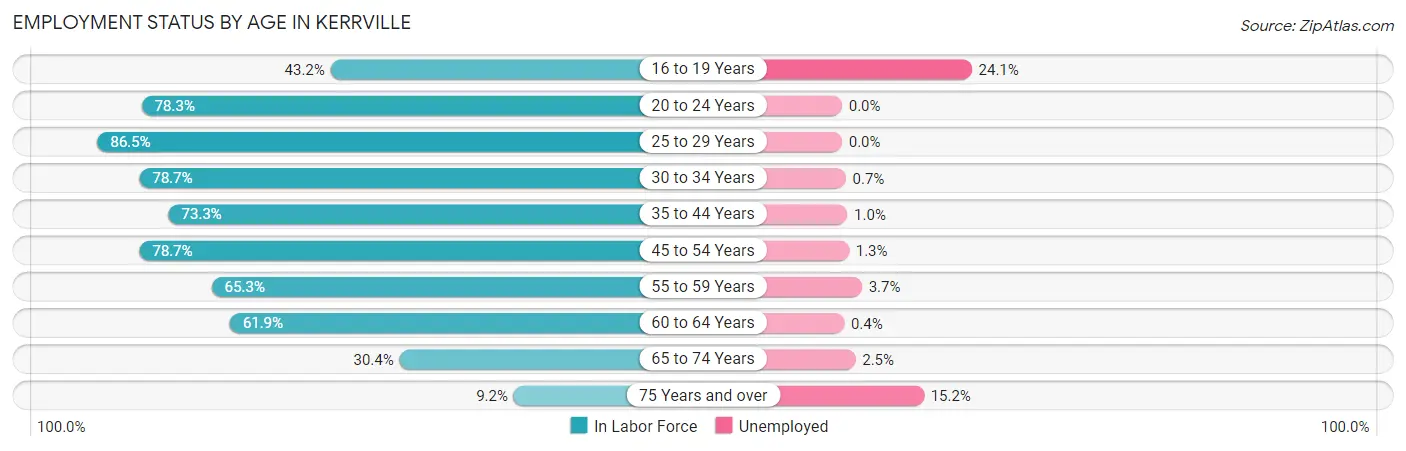
| Age Bracket | In Labor Force | Unemployed |
| 16 to 19 Years | 562 (43.2%) | 135 (24.1%) |
| 20 to 24 Years | 1,539 (78.3%) | 0 (0.0%) |
| 25 to 29 Years | 1,323 (86.5%) | 0 (0.0%) |
| 30 to 34 Years | 1,136 (78.7%) | 8 (0.7%) |
| 35 to 44 Years | 1,637 (73.3%) | 16 (1.0%) |
| 45 to 54 Years | 1,799 (78.7%) | 23 (1.3%) |
| 55 to 59 Years | 695 (65.3%) | 26 (3.7%) |
| 60 to 64 Years | 799 (61.9%) | 3 (0.4%) |
| 65 to 74 Years | 952 (30.4%) | 24 (2.5%) |
| 75 Years and over | 315 (9.2%) | 48 (15.2%) |
| Total | 10,760 (54.7%) | 269 (2.5%) |
Employment Status by Educational Attainment in Kerrville
According to labor force statistics for Kerrville, 75.0% of individuals (7,384) out of the total population between 25 and 64 years of age (9,846) are in the labor force, with 1.0% or 74 of them being unemployed. The group with the highest labor force participation rate are those with the educational attainment of bachelor's degree or higher, with 80.4% or 2,246 individuals in the labor force. Within the labor force, individuals with college / associate degree education have the highest percentage of unemployment, with 1.4% or 29 of them being unemployed.
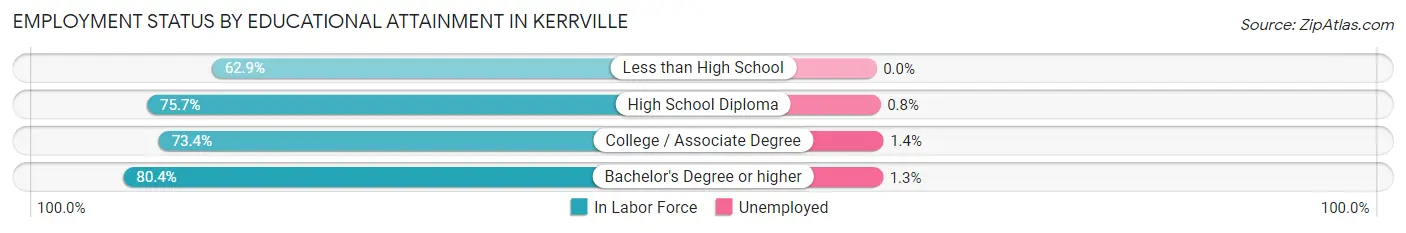
| Educational Attainment | In Labor Force | Unemployed |
| Less than High School | 633 (62.9%) | 0 (0.0%) |
| High School Diploma | 2,460 (75.7%) | 26 (0.8%) |
| College / Associate Degree | 2,052 (73.4%) | 39 (1.4%) |
| Bachelor's Degree or higher | 2,246 (80.4%) | 36 (1.3%) |
| Total | 7,384 (75.0%) | 98 (1.0%) |
Employment Occupations by Sex in Kerrville
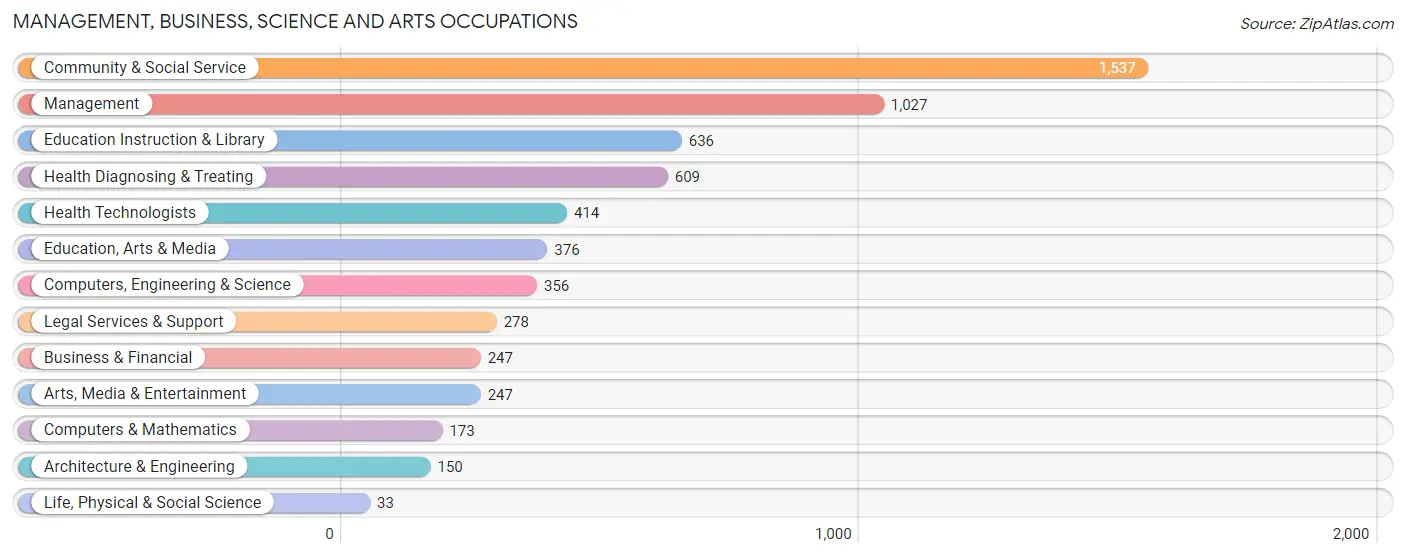
Management, Business, Science and Arts Occupations
The most common Management, Business, Science and Arts occupations in Kerrville are Community & Social Service (1,537 | 14.7%), Management (1,027 | 9.9%), Education Instruction & Library (636 | 6.1%), Health Diagnosing & Treating (609 | 5.9%), and Health Technologists (414 | 4.0%).
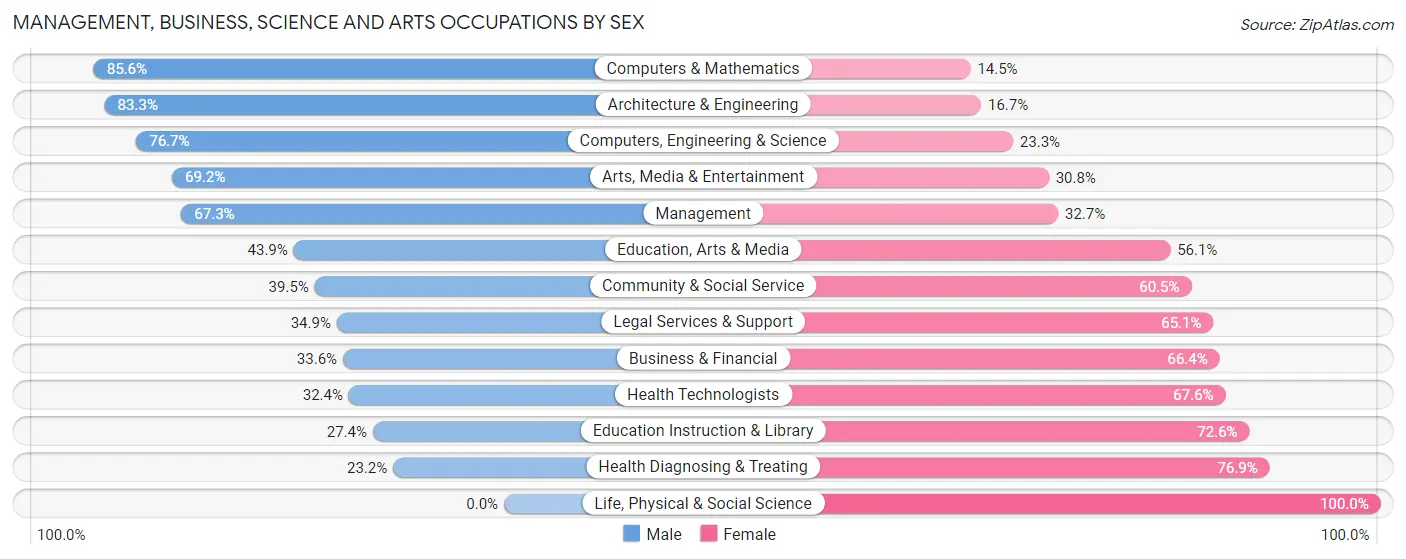
Management, Business, Science and Arts Occupations by Sex
Within the Management, Business, Science and Arts occupations in Kerrville, the most male-oriented occupations are Computers & Mathematics (85.6%), Architecture & Engineering (83.3%), and Computers, Engineering & Science (76.7%), while the most female-oriented occupations are Life, Physical & Social Science (100.0%), Health Diagnosing & Treating (76.8%), and Education Instruction & Library (72.6%).
| Occupation | Male | Female |
| Management | 691 (67.3%) | 336 (32.7%) |
| Business & Financial | 83 (33.6%) | 164 (66.4%) |
| Computers, Engineering & Science | 273 (76.7%) | 83 (23.3%) |
| Computers & Mathematics | 148 (85.6%) | 25 (14.4%) |
| Architecture & Engineering | 125 (83.3%) | 25 (16.7%) |
| Life, Physical & Social Science | 0 (0.0%) | 33 (100.0%) |
| Community & Social Service | 607 (39.5%) | 930 (60.5%) |
| Education, Arts & Media | 165 (43.9%) | 211 (56.1%) |
| Legal Services & Support | 97 (34.9%) | 181 (65.1%) |
| Education Instruction & Library | 174 (27.4%) | 462 (72.6%) |
| Arts, Media & Entertainment | 171 (69.2%) | 76 (30.8%) |
| Health Diagnosing & Treating | 141 (23.2%) | 468 (76.8%) |
| Health Technologists | 134 (32.4%) | 280 (67.6%) |
| Total (Category) | 1,795 (47.5%) | 1,981 (52.5%) |
| Total (Overall) | 5,223 (50.1%) | 5,196 (49.9%) |
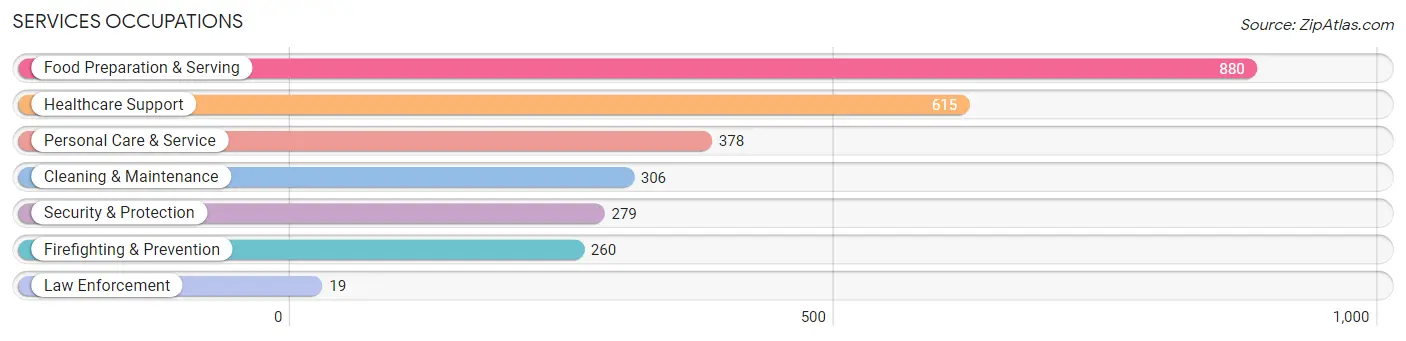
Services Occupations
The most common Services occupations in Kerrville are Food Preparation & Serving (880 | 8.5%), Healthcare Support (615 | 5.9%), Personal Care & Service (378 | 3.6%), Cleaning & Maintenance (306 | 2.9%), and Security & Protection (279 | 2.7%).
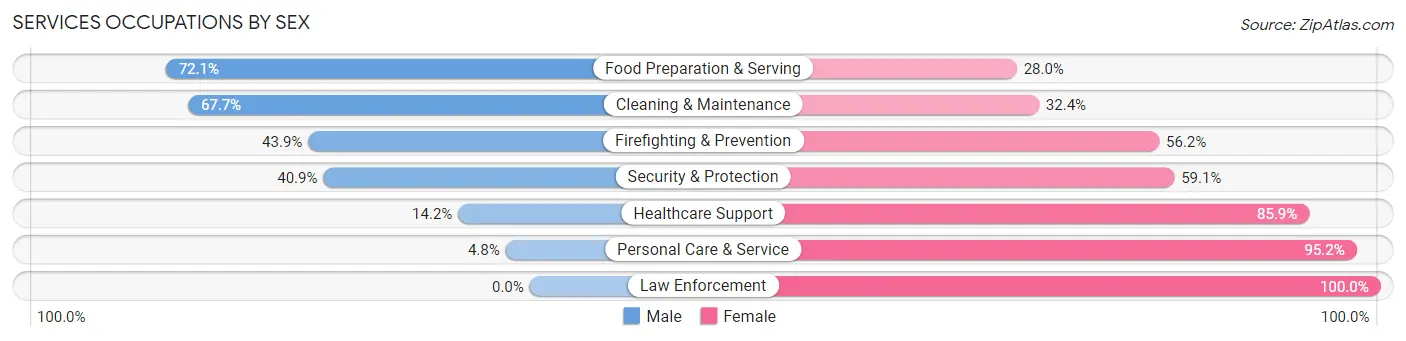
Services Occupations by Sex
Within the Services occupations in Kerrville, the most male-oriented occupations are Food Preparation & Serving (72.1%), Cleaning & Maintenance (67.6%), and Firefighting & Prevention (43.9%), while the most female-oriented occupations are Law Enforcement (100.0%), Personal Care & Service (95.2%), and Healthcare Support (85.9%).
| Occupation | Male | Female |
| Healthcare Support | 87 (14.1%) | 528 (85.9%) |
| Security & Protection | 114 (40.9%) | 165 (59.1%) |
| Firefighting & Prevention | 114 (43.9%) | 146 (56.1%) |
| Law Enforcement | 0 (0.0%) | 19 (100.0%) |
| Food Preparation & Serving | 634 (72.1%) | 246 (28.0%) |
| Cleaning & Maintenance | 207 (67.6%) | 99 (32.4%) |
| Personal Care & Service | 18 (4.8%) | 360 (95.2%) |
| Total (Category) | 1,060 (43.1%) | 1,398 (56.9%) |
| Total (Overall) | 5,223 (50.1%) | 5,196 (49.9%) |
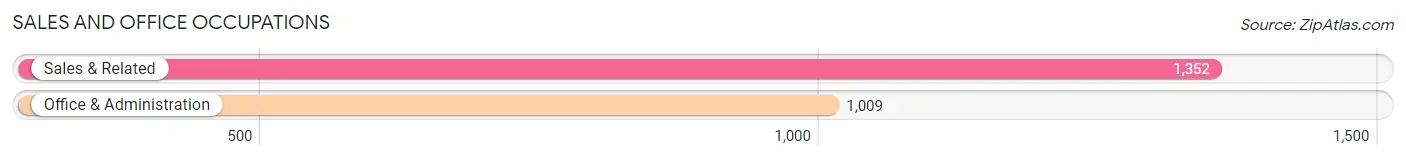
Sales and Office Occupations
The most common Sales and Office occupations in Kerrville are Sales & Related (1,352 | 13.0%), and Office & Administration (1,009 | 9.7%).
Sales and Office Occupations by Sex
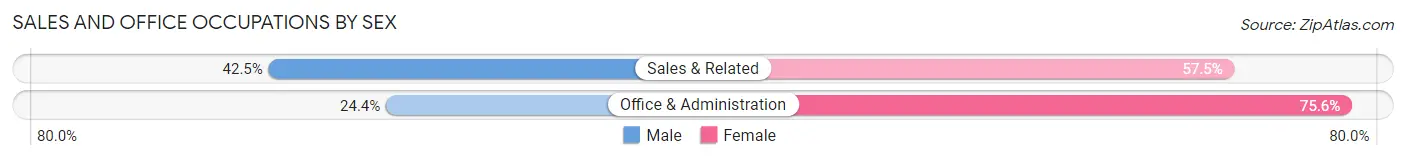
| Occupation | Male | Female |
| Sales & Related | 574 (42.5%) | 778 (57.5%) |
| Office & Administration | 246 (24.4%) | 763 (75.6%) |
| Total (Category) | 820 (34.7%) | 1,541 (65.3%) |
| Total (Overall) | 5,223 (50.1%) | 5,196 (49.9%) |
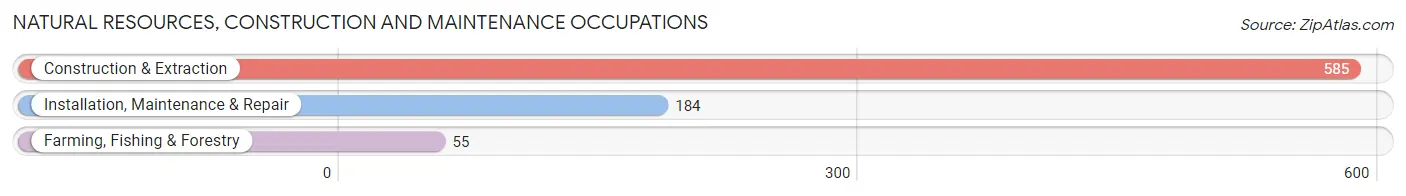
Natural Resources, Construction and Maintenance Occupations
The most common Natural Resources, Construction and Maintenance occupations in Kerrville are Construction & Extraction (585 | 5.6%), Installation, Maintenance & Repair (184 | 1.8%), and Farming, Fishing & Forestry (55 | 0.5%).
Natural Resources, Construction and Maintenance Occupations by Sex
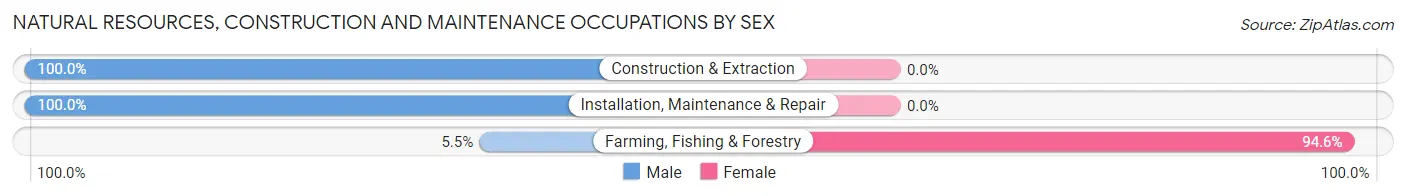
| Occupation | Male | Female |
| Farming, Fishing & Forestry | 3 (5.4%) | 52 (94.6%) |
| Construction & Extraction | 585 (100.0%) | 0 (0.0%) |
| Installation, Maintenance & Repair | 184 (100.0%) | 0 (0.0%) |
| Total (Category) | 772 (93.7%) | 52 (6.3%) |
| Total (Overall) | 5,223 (50.1%) | 5,196 (49.9%) |
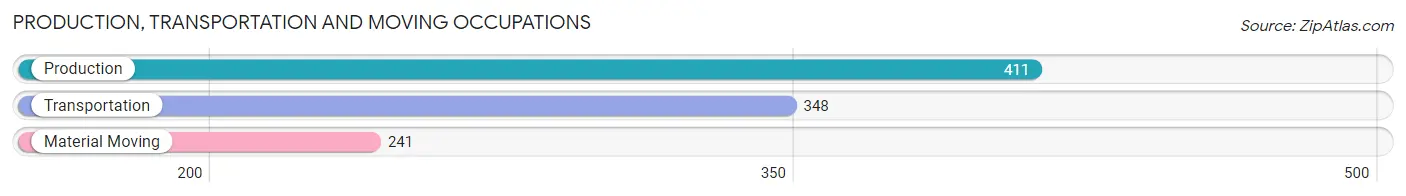
Production, Transportation and Moving Occupations
The most common Production, Transportation and Moving occupations in Kerrville are Production (411 | 3.9%), Transportation (348 | 3.3%), and Material Moving (241 | 2.3%).
Production, Transportation and Moving Occupations by Sex
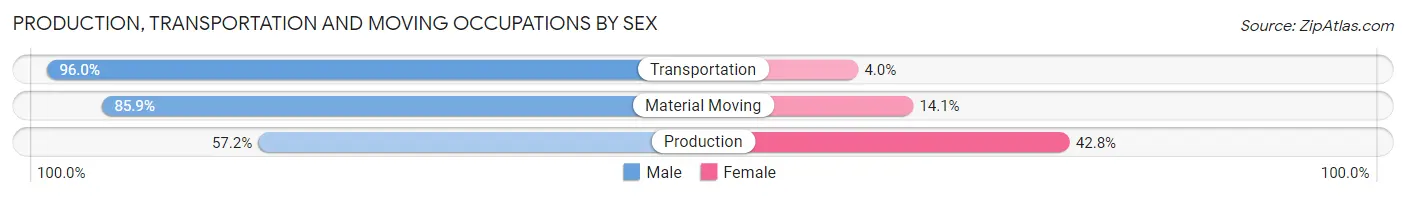
| Occupation | Male | Female |
| Production | 235 (57.2%) | 176 (42.8%) |
| Transportation | 334 (96.0%) | 14 (4.0%) |
| Material Moving | 207 (85.9%) | 34 (14.1%) |
| Total (Category) | 776 (77.6%) | 224 (22.4%) |
| Total (Overall) | 5,223 (50.1%) | 5,196 (49.9%) |
Employment Industries by Sex in Kerrville
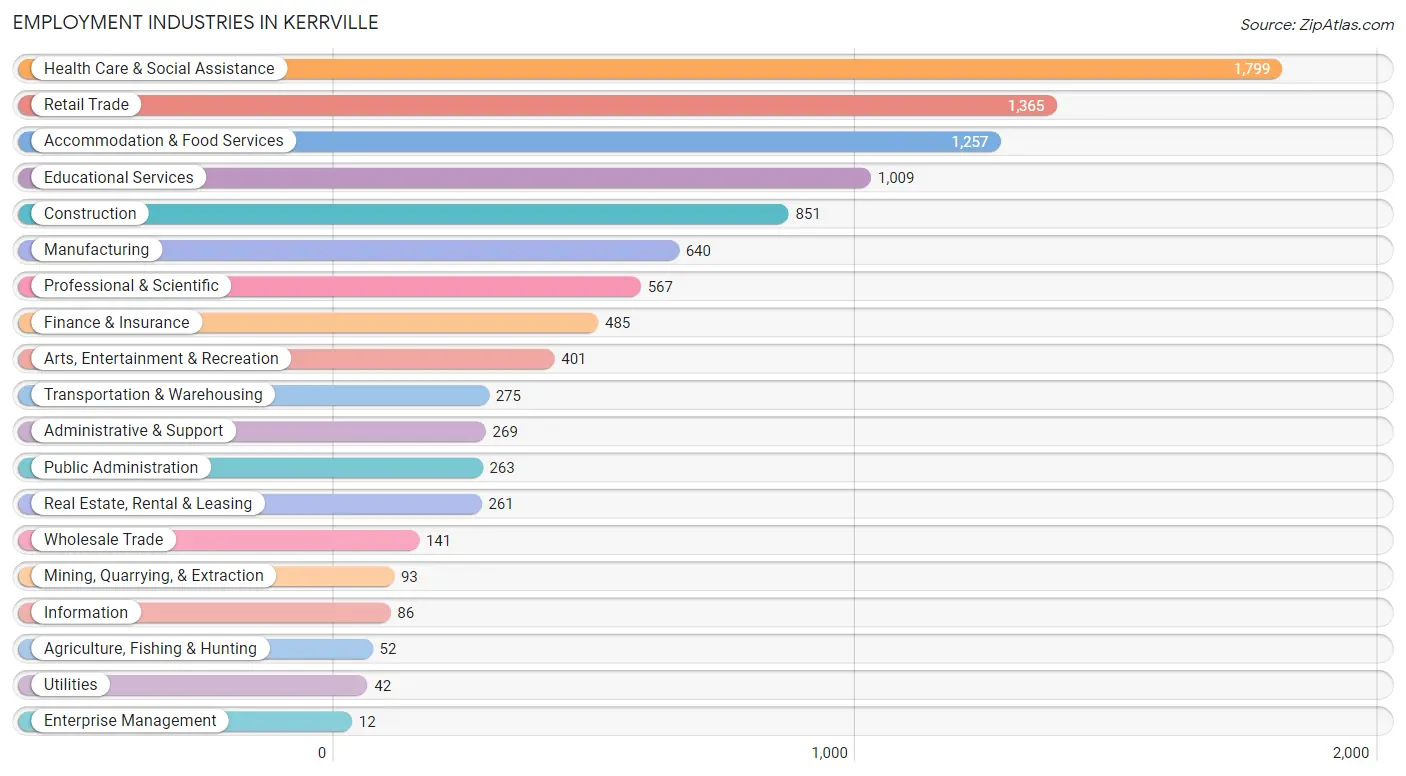
Employment Industries in Kerrville
The major employment industries in Kerrville include Health Care & Social Assistance (1,799 | 17.3%), Retail Trade (1,365 | 13.1%), Accommodation & Food Services (1,257 | 12.1%), Educational Services (1,009 | 9.7%), and Construction (851 | 8.2%).
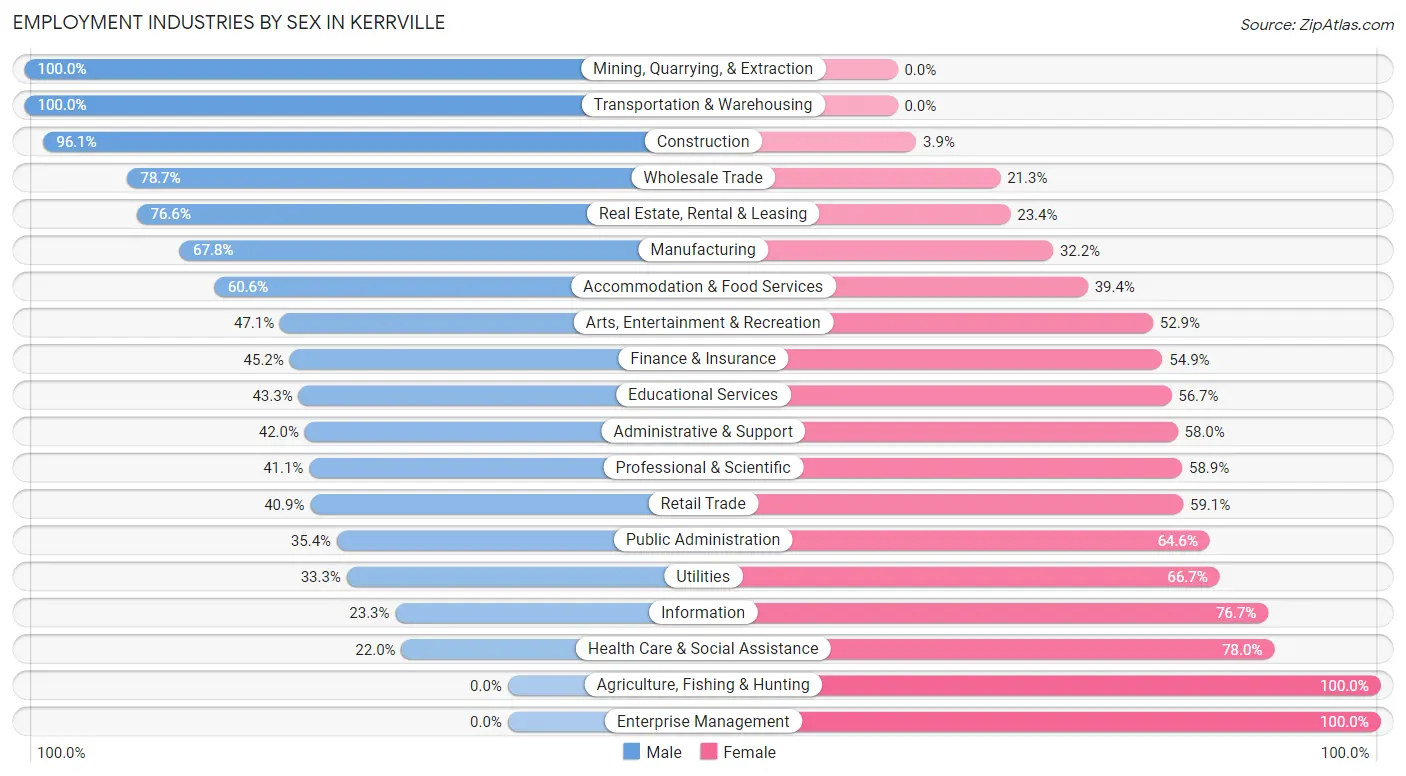
Employment Industries by Sex in Kerrville
The Kerrville industries that see more men than women are Mining, Quarrying, & Extraction (100.0%), Transportation & Warehousing (100.0%), and Construction (96.1%), whereas the industries that tend to have a higher number of women are Agriculture, Fishing & Hunting (100.0%), Enterprise Management (100.0%), and Health Care & Social Assistance (78.0%).
| Industry | Male | Female |
| Agriculture, Fishing & Hunting | 0 (0.0%) | 52 (100.0%) |
| Mining, Quarrying, & Extraction | 93 (100.0%) | 0 (0.0%) |
| Construction | 818 (96.1%) | 33 (3.9%) |
| Manufacturing | 434 (67.8%) | 206 (32.2%) |
| Wholesale Trade | 111 (78.7%) | 30 (21.3%) |
| Retail Trade | 558 (40.9%) | 807 (59.1%) |
| Transportation & Warehousing | 275 (100.0%) | 0 (0.0%) |
| Utilities | 14 (33.3%) | 28 (66.7%) |
| Information | 20 (23.3%) | 66 (76.7%) |
| Finance & Insurance | 219 (45.2%) | 266 (54.8%) |
| Real Estate, Rental & Leasing | 200 (76.6%) | 61 (23.4%) |
| Professional & Scientific | 233 (41.1%) | 334 (58.9%) |
| Enterprise Management | 0 (0.0%) | 12 (100.0%) |
| Administrative & Support | 113 (42.0%) | 156 (58.0%) |
| Educational Services | 437 (43.3%) | 572 (56.7%) |
| Health Care & Social Assistance | 396 (22.0%) | 1,403 (78.0%) |
| Arts, Entertainment & Recreation | 189 (47.1%) | 212 (52.9%) |
| Accommodation & Food Services | 762 (60.6%) | 495 (39.4%) |
| Public Administration | 93 (35.4%) | 170 (64.6%) |
| Total | 5,223 (50.1%) | 5,196 (49.9%) |
Education in Kerrville
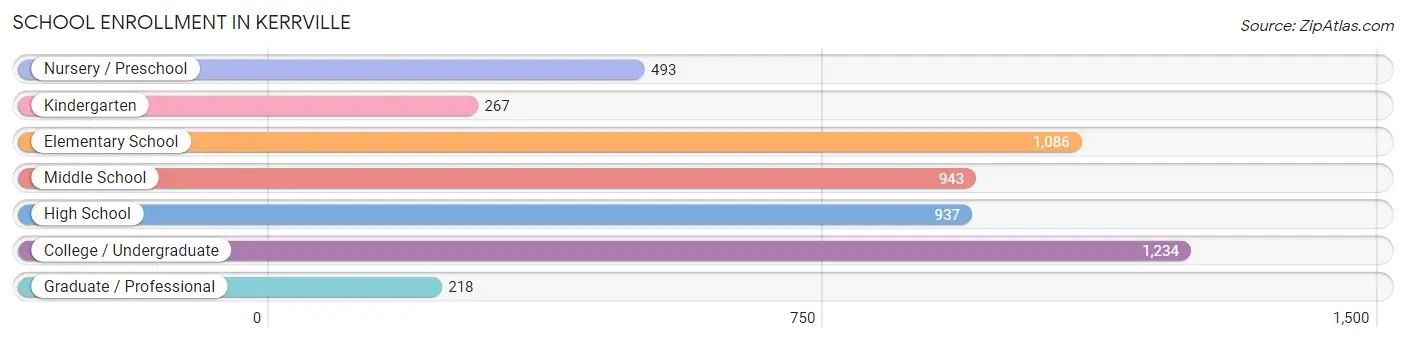
School Enrollment in Kerrville
The most common levels of schooling among the 5,178 students in Kerrville are college / undergraduate (1,234 | 23.8%), elementary school (1,086 | 21.0%), and middle school (943 | 18.2%).
| School Level | # Students | % Students |
| Nursery / Preschool | 493 | 9.5% |
| Kindergarten | 267 | 5.2% |
| Elementary School | 1,086 | 21.0% |
| Middle School | 943 | 18.2% |
| High School | 937 | 18.1% |
| College / Undergraduate | 1,234 | 23.8% |
| Graduate / Professional | 218 | 4.2% |
| Total | 5,178 | 100.0% |
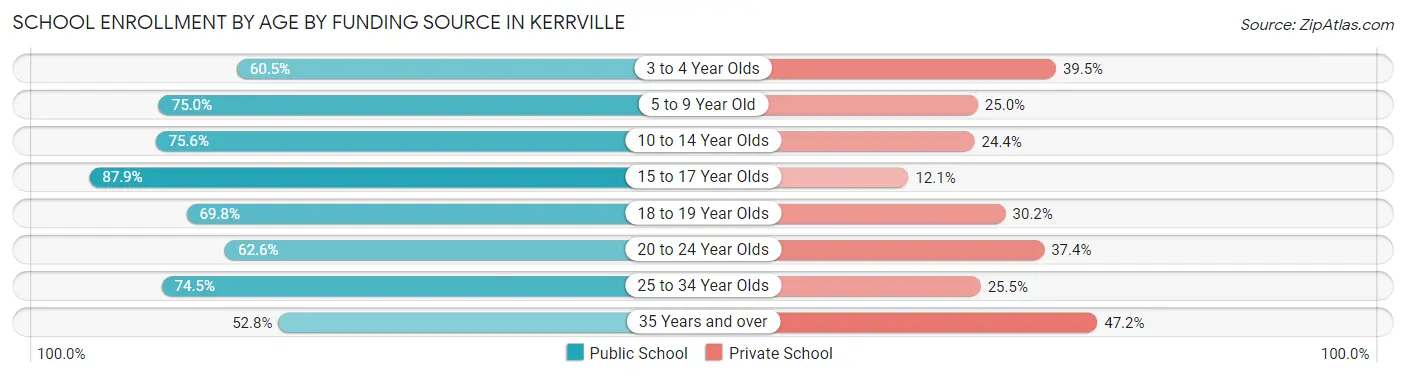
School Enrollment by Age by Funding Source in Kerrville
Out of a total of 5,178 students who are enrolled in schools in Kerrville, 1,367 (26.4%) attend a private institution, while the remaining 3,811 (73.6%) are enrolled in public schools. The age group of 35 years and over has the highest likelihood of being enrolled in private schools, with 77 (47.2% in the age bracket) enrolled. Conversely, the age group of 15 to 17 year olds has the lowest likelihood of being enrolled in a private school, with 641 (87.9% in the age bracket) attending a public institution.
| Age Bracket | Public School | Private School |
| 3 to 4 Year Olds | 159 (60.5%) | 104 (39.5%) |
| 5 to 9 Year Old | 930 (75.0%) | 310 (25.0%) |
| 10 to 14 Year Olds | 1,082 (75.6%) | 349 (24.4%) |
| 15 to 17 Year Olds | 641 (87.9%) | 88 (12.1%) |
| 18 to 19 Year Olds | 352 (69.8%) | 152 (30.2%) |
| 20 to 24 Year Olds | 384 (62.6%) | 229 (37.4%) |
| 25 to 34 Year Olds | 175 (74.5%) | 60 (25.5%) |
| 35 Years and over | 86 (52.8%) | 77 (47.2%) |
| Total | 3,811 (73.6%) | 1,367 (26.4%) |
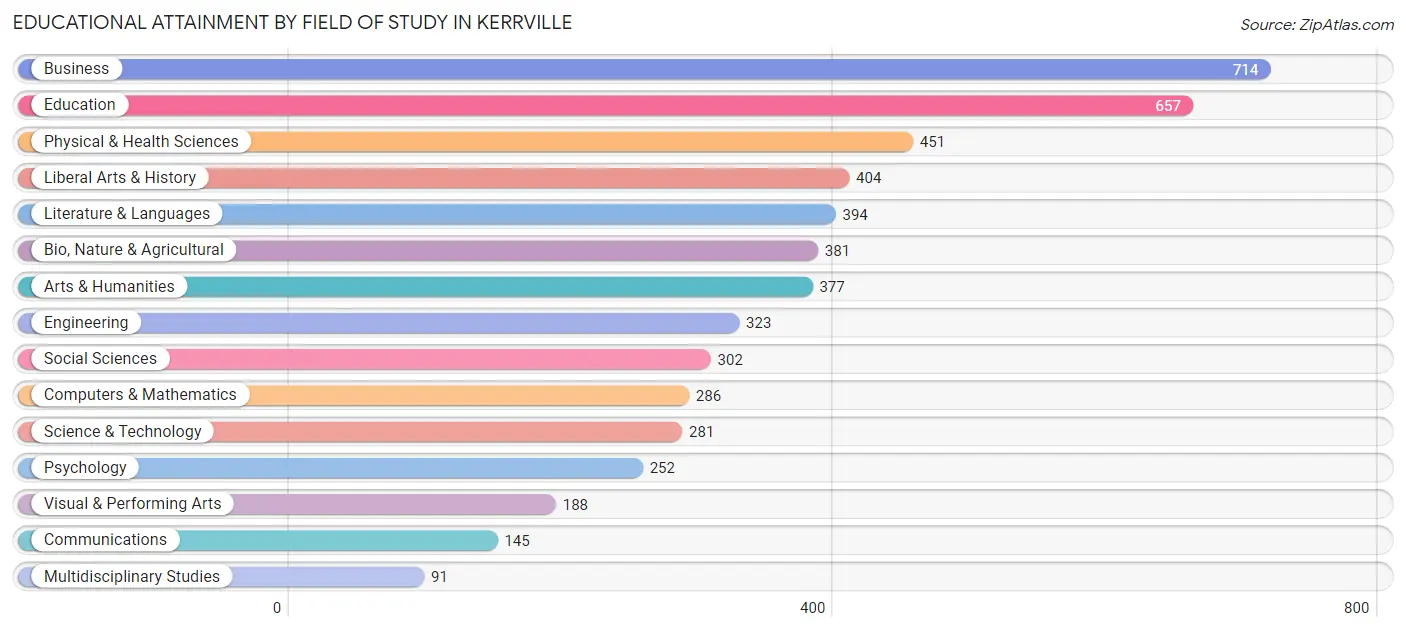
Educational Attainment by Field of Study in Kerrville
Business (714 | 13.6%), education (657 | 12.5%), physical & health sciences (451 | 8.6%), liberal arts & history (404 | 7.7%), and literature & languages (394 | 7.5%) are the most common fields of study among 5,246 individuals in Kerrville who have obtained a bachelor's degree or higher.
| Field of Study | # Graduates | % Graduates |
| Computers & Mathematics | 286 | 5.4% |
| Bio, Nature & Agricultural | 381 | 7.3% |
| Physical & Health Sciences | 451 | 8.6% |
| Psychology | 252 | 4.8% |
| Social Sciences | 302 | 5.8% |
| Engineering | 323 | 6.2% |
| Multidisciplinary Studies | 91 | 1.7% |
| Science & Technology | 281 | 5.4% |
| Business | 714 | 13.6% |
| Education | 657 | 12.5% |
| Literature & Languages | 394 | 7.5% |
| Liberal Arts & History | 404 | 7.7% |
| Visual & Performing Arts | 188 | 3.6% |
| Communications | 145 | 2.8% |
| Arts & Humanities | 377 | 7.2% |
| Total | 5,246 | 100.0% |
Transportation & Commute in Kerrville
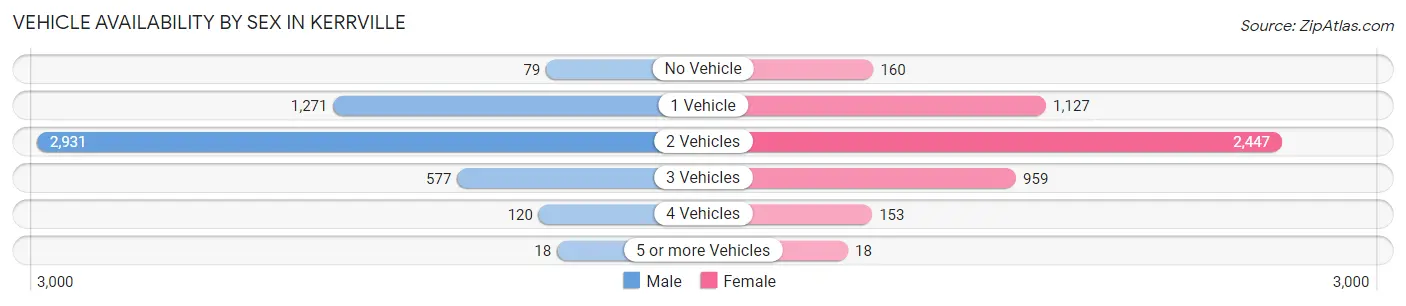
Vehicle Availability by Sex in Kerrville
The most prevalent vehicle ownership categories in Kerrville are males with 2 vehicles (2,931, accounting for 58.7%) and females with 2 vehicles (2,447, making up 60.3%).
| Vehicles Available | Male | Female |
| No Vehicle | 79 (1.6%) | 160 (3.3%) |
| 1 Vehicle | 1,271 (25.4%) | 1,127 (23.2%) |
| 2 Vehicles | 2,931 (58.7%) | 2,447 (50.3%) |
| 3 Vehicles | 577 (11.6%) | 959 (19.7%) |
| 4 Vehicles | 120 (2.4%) | 153 (3.2%) |
| 5 or more Vehicles | 18 (0.4%) | 18 (0.4%) |
| Total | 4,996 (100.0%) | 4,864 (100.0%) |
Commute Time in Kerrville
The most frequently occuring commute durations in Kerrville are 5 to 9 minutes (2,686 commuters, 28.8%), 10 to 14 minutes (2,405 commuters, 25.8%), and 15 to 19 minutes (1,307 commuters, 14.0%).
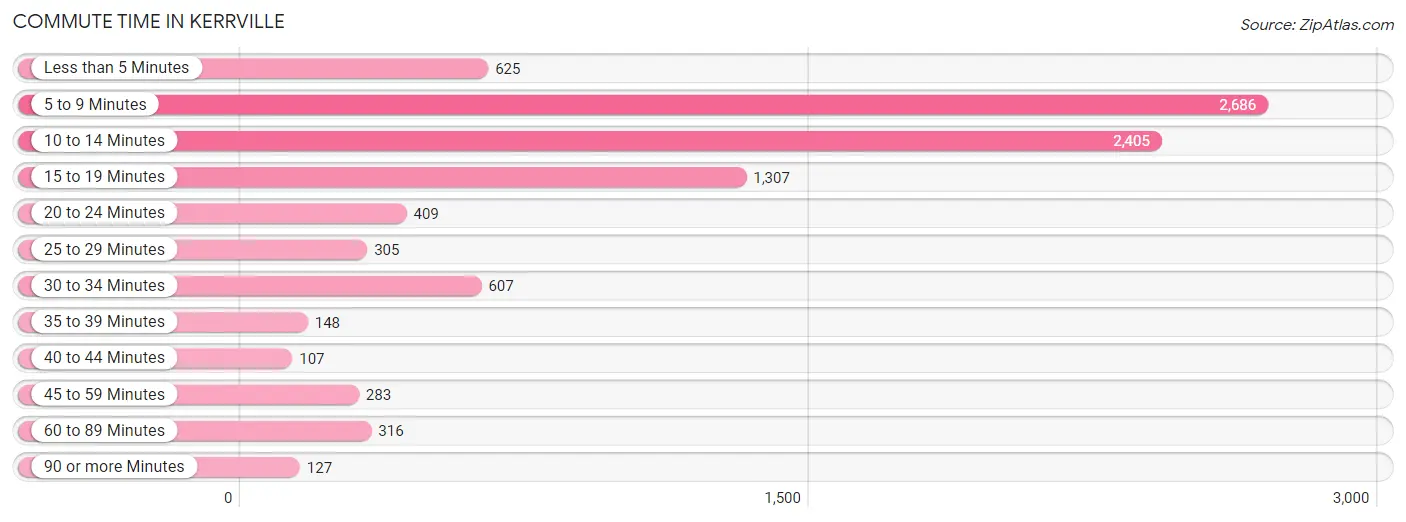
| Commute Time | # Commuters | % Commuters |
| Less than 5 Minutes | 625 | 6.7% |
| 5 to 9 Minutes | 2,686 | 28.8% |
| 10 to 14 Minutes | 2,405 | 25.8% |
| 15 to 19 Minutes | 1,307 | 14.0% |
| 20 to 24 Minutes | 409 | 4.4% |
| 25 to 29 Minutes | 305 | 3.3% |
| 30 to 34 Minutes | 607 | 6.5% |
| 35 to 39 Minutes | 148 | 1.6% |
| 40 to 44 Minutes | 107 | 1.1% |
| 45 to 59 Minutes | 283 | 3.0% |
| 60 to 89 Minutes | 316 | 3.4% |
| 90 or more Minutes | 127 | 1.4% |
Commute Time by Sex in Kerrville
The most common commute times in Kerrville are 10 to 14 minutes (1,360 commuters, 28.3%) for males and 5 to 9 minutes (1,439 commuters, 31.8%) for females.
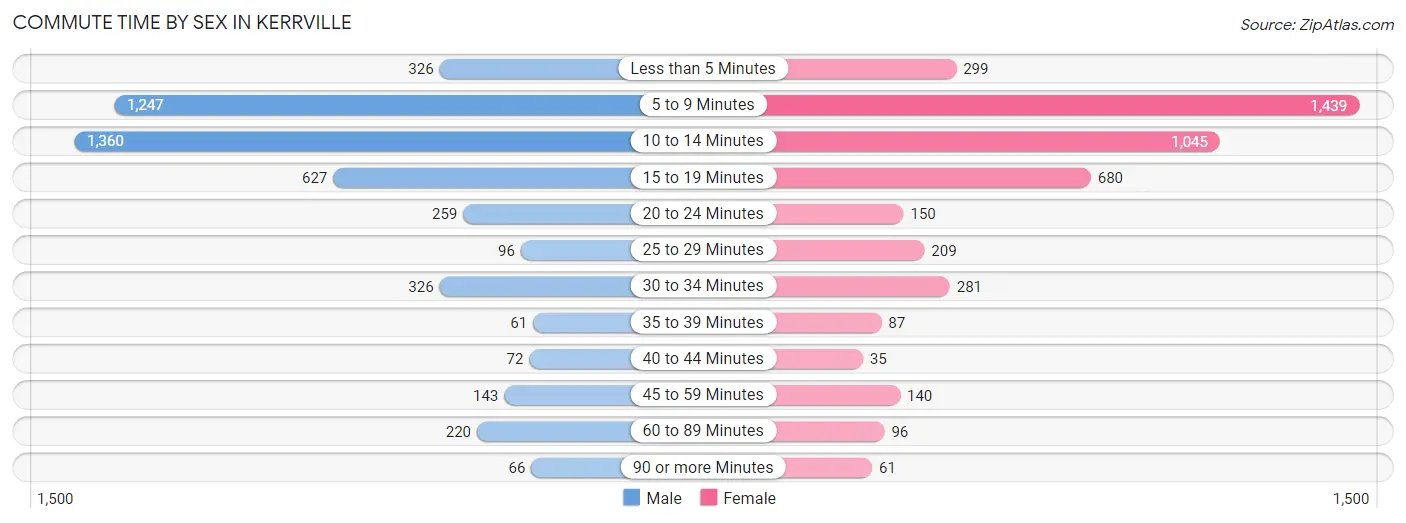
| Commute Time | Male | Female |
| Less than 5 Minutes | 326 (6.8%) | 299 (6.6%) |
| 5 to 9 Minutes | 1,247 (26.0%) | 1,439 (31.8%) |
| 10 to 14 Minutes | 1,360 (28.3%) | 1,045 (23.1%) |
| 15 to 19 Minutes | 627 (13.1%) | 680 (15.0%) |
| 20 to 24 Minutes | 259 (5.4%) | 150 (3.3%) |
| 25 to 29 Minutes | 96 (2.0%) | 209 (4.6%) |
| 30 to 34 Minutes | 326 (6.8%) | 281 (6.2%) |
| 35 to 39 Minutes | 61 (1.3%) | 87 (1.9%) |
| 40 to 44 Minutes | 72 (1.5%) | 35 (0.8%) |
| 45 to 59 Minutes | 143 (3.0%) | 140 (3.1%) |
| 60 to 89 Minutes | 220 (4.6%) | 96 (2.1%) |
| 90 or more Minutes | 66 (1.4%) | 61 (1.3%) |
Time of Departure to Work by Sex in Kerrville
The most frequent times of departure to work in Kerrville are 7:00 AM to 7:29 AM (863, 18.0%) for males and 7:30 AM to 7:59 AM (712, 15.8%) for females.
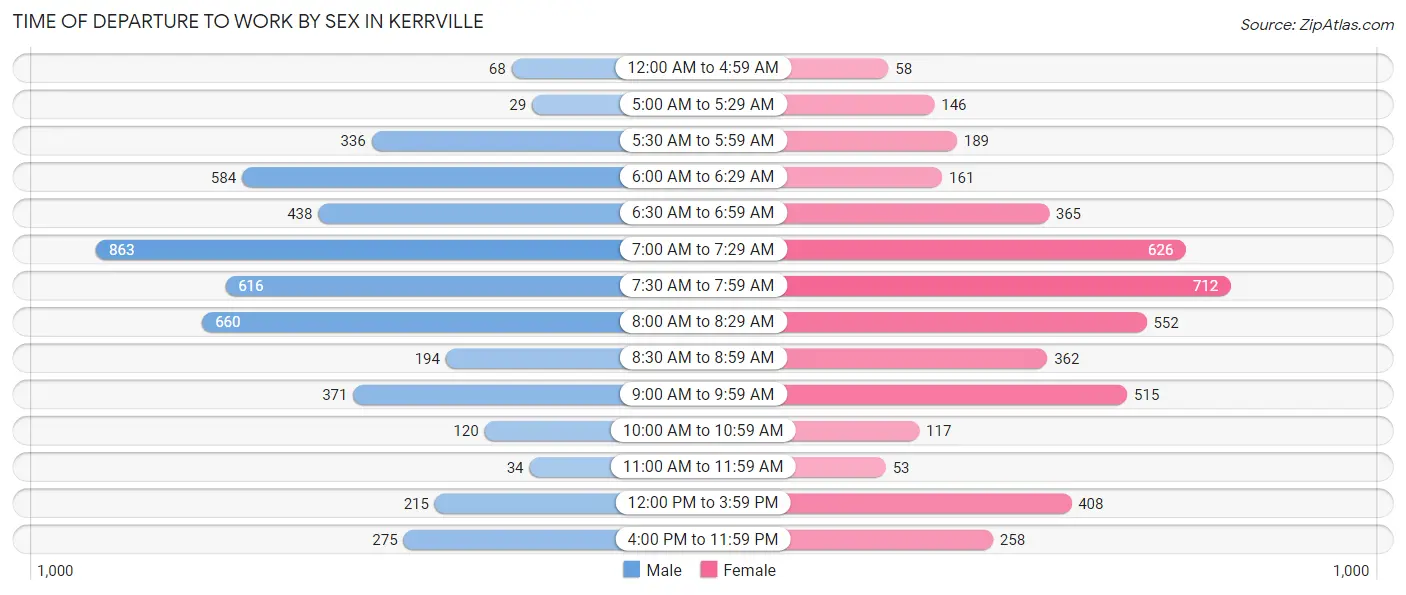
| Time of Departure | Male | Female |
| 12:00 AM to 4:59 AM | 68 (1.4%) | 58 (1.3%) |
| 5:00 AM to 5:29 AM | 29 (0.6%) | 146 (3.2%) |
| 5:30 AM to 5:59 AM | 336 (7.0%) | 189 (4.2%) |
| 6:00 AM to 6:29 AM | 584 (12.2%) | 161 (3.6%) |
| 6:30 AM to 6:59 AM | 438 (9.1%) | 365 (8.1%) |
| 7:00 AM to 7:29 AM | 863 (18.0%) | 626 (13.8%) |
| 7:30 AM to 7:59 AM | 616 (12.8%) | 712 (15.8%) |
| 8:00 AM to 8:29 AM | 660 (13.7%) | 552 (12.2%) |
| 8:30 AM to 8:59 AM | 194 (4.0%) | 362 (8.0%) |
| 9:00 AM to 9:59 AM | 371 (7.7%) | 515 (11.4%) |
| 10:00 AM to 10:59 AM | 120 (2.5%) | 117 (2.6%) |
| 11:00 AM to 11:59 AM | 34 (0.7%) | 53 (1.2%) |
| 12:00 PM to 3:59 PM | 215 (4.5%) | 408 (9.0%) |
| 4:00 PM to 11:59 PM | 275 (5.7%) | 258 (5.7%) |
| Total | 4,803 (100.0%) | 4,522 (100.0%) |
Housing Occupancy in Kerrville
Occupancy by Ownership in Kerrville
Of the total 10,086 dwellings in Kerrville, owner-occupied units account for 5,917 (58.7%), while renter-occupied units make up 4,169 (41.3%).
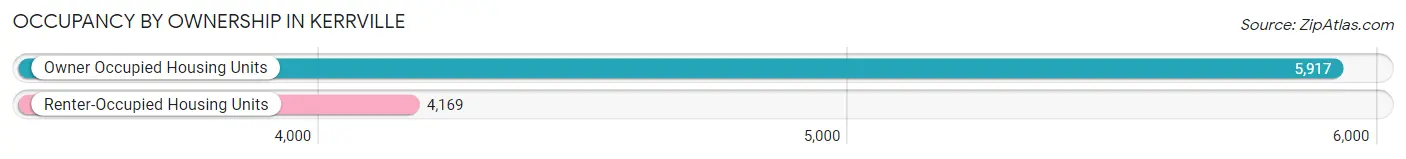
| Occupancy | # Housing Units | % Housing Units |
| Owner Occupied Housing Units | 5,917 | 58.7% |
| Renter-Occupied Housing Units | 4,169 | 41.3% |
| Total Occupied Housing Units | 10,086 | 100.0% |
Occupancy by Household Size in Kerrville
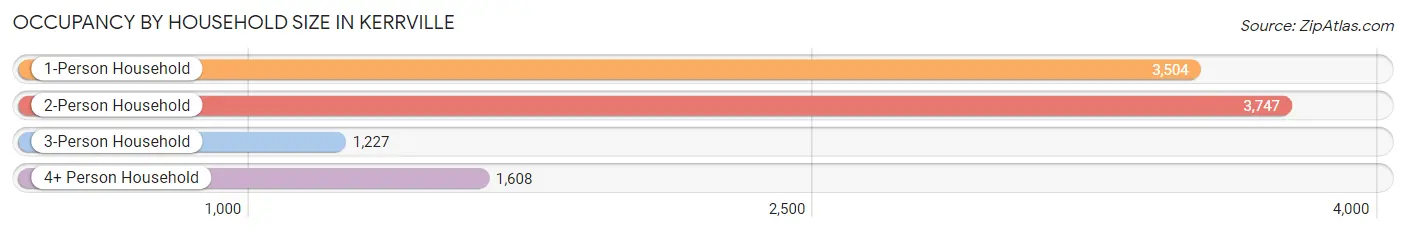
| Household Size | # Housing Units | % Housing Units |
| 1-Person Household | 3,504 | 34.7% |
| 2-Person Household | 3,747 | 37.1% |
| 3-Person Household | 1,227 | 12.2% |
| 4+ Person Household | 1,608 | 15.9% |
| Total Housing Units | 10,086 | 100.0% |
Occupancy by Ownership by Household Size in Kerrville
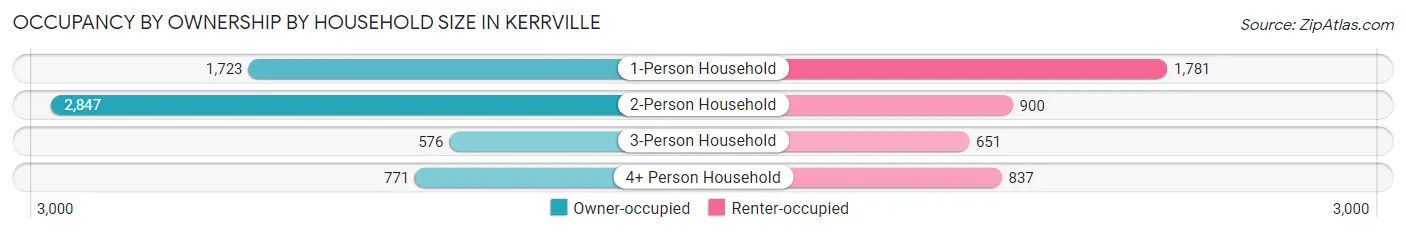
| Household Size | Owner-occupied | Renter-occupied |
| 1-Person Household | 1,723 (49.2%) | 1,781 (50.8%) |
| 2-Person Household | 2,847 (76.0%) | 900 (24.0%) |
| 3-Person Household | 576 (46.9%) | 651 (53.1%) |
| 4+ Person Household | 771 (47.9%) | 837 (52.0%) |
| Total Housing Units | 5,917 (58.7%) | 4,169 (41.3%) |
Occupancy by Educational Attainment in Kerrville
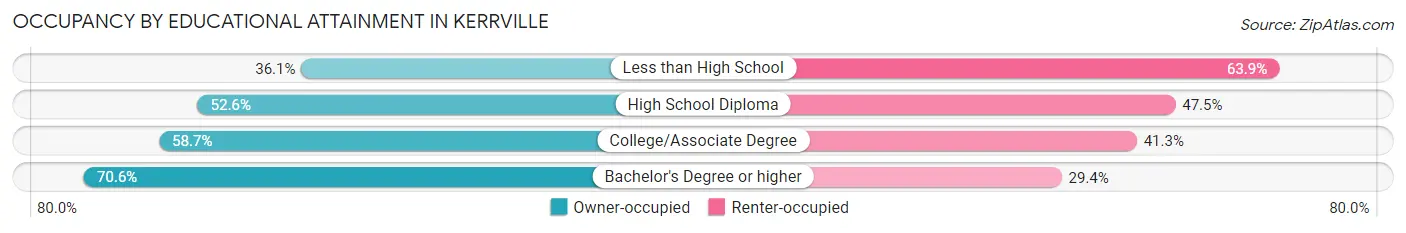
| Household Size | Owner-occupied | Renter-occupied |
| Less than High School | 325 (36.1%) | 575 (63.9%) |
| High School Diploma | 1,503 (52.5%) | 1,357 (47.4%) |
| College/Associate Degree | 1,854 (58.7%) | 1,306 (41.3%) |
| Bachelor's Degree or higher | 2,235 (70.6%) | 931 (29.4%) |
Occupancy by Age of Householder in Kerrville
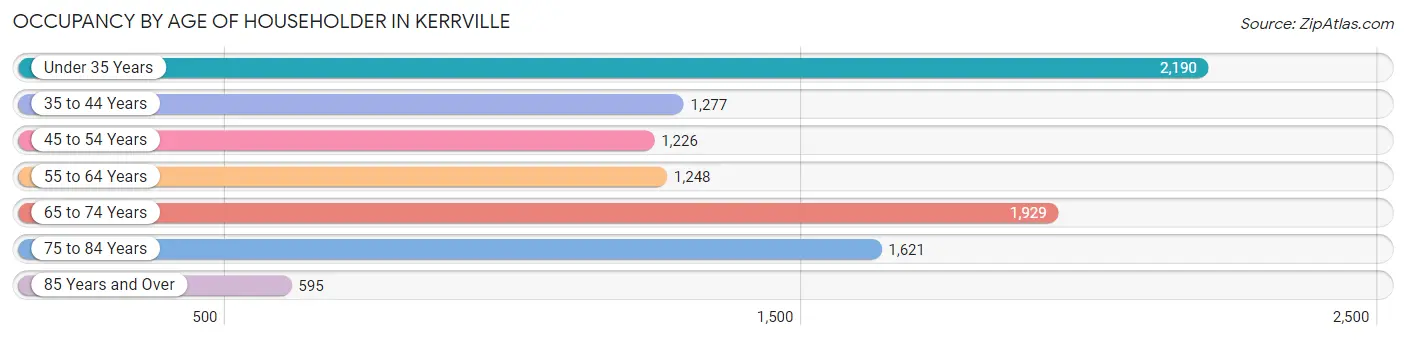
| Age Bracket | # Households | % Households |
| Under 35 Years | 2,190 | 21.7% |
| 35 to 44 Years | 1,277 | 12.7% |
| 45 to 54 Years | 1,226 | 12.2% |
| 55 to 64 Years | 1,248 | 12.4% |
| 65 to 74 Years | 1,929 | 19.1% |
| 75 to 84 Years | 1,621 | 16.1% |
| 85 Years and Over | 595 | 5.9% |
| Total | 10,086 | 100.0% |
Housing Finances in Kerrville
Median Income by Occupancy in Kerrville
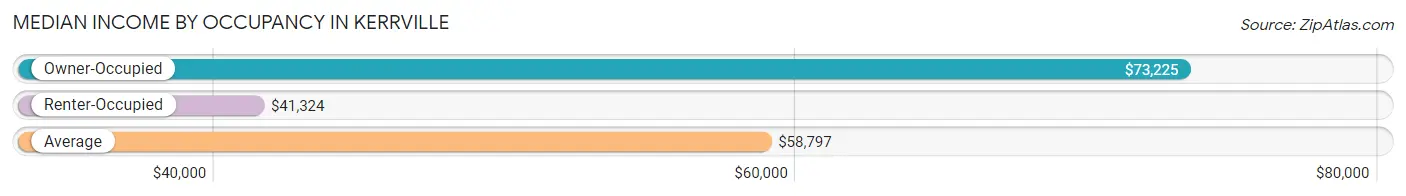
| Occupancy Type | # Households | Median Income |
| Owner-Occupied | 5,917 (58.7%) | $73,225 |
| Renter-Occupied | 4,169 (41.3%) | $41,324 |
| Average | 10,086 (100.0%) | $58,797 |
Occupancy by Householder Income Bracket in Kerrville
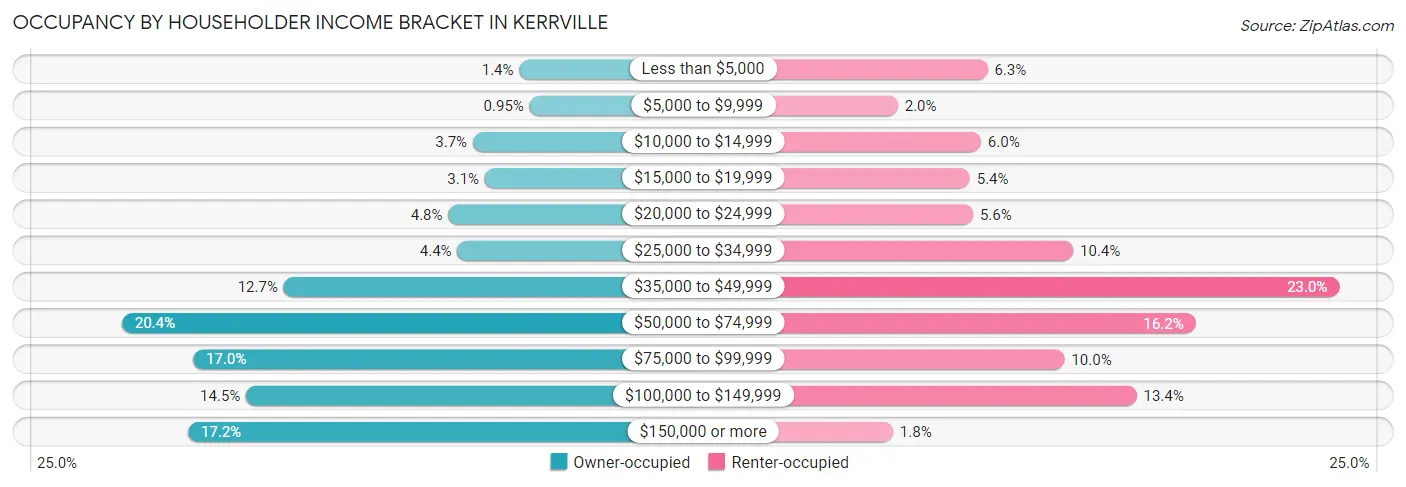
| Income Bracket | Owner-occupied | Renter-occupied |
| Less than $5,000 | 85 (1.4%) | 262 (6.3%) |
| $5,000 to $9,999 | 56 (0.9%) | 84 (2.0%) |
| $10,000 to $14,999 | 216 (3.6%) | 249 (6.0%) |
| $15,000 to $19,999 | 182 (3.1%) | 227 (5.4%) |
| $20,000 to $24,999 | 285 (4.8%) | 233 (5.6%) |
| $25,000 to $34,999 | 260 (4.4%) | 432 (10.4%) |
| $35,000 to $49,999 | 749 (12.7%) | 960 (23.0%) |
| $50,000 to $74,999 | 1,205 (20.4%) | 675 (16.2%) |
| $75,000 to $99,999 | 1,005 (17.0%) | 415 (10.0%) |
| $100,000 to $149,999 | 855 (14.4%) | 558 (13.4%) |
| $150,000 or more | 1,019 (17.2%) | 74 (1.8%) |
| Total | 5,917 (100.0%) | 4,169 (100.0%) |
Monthly Housing Cost Tiers in Kerrville
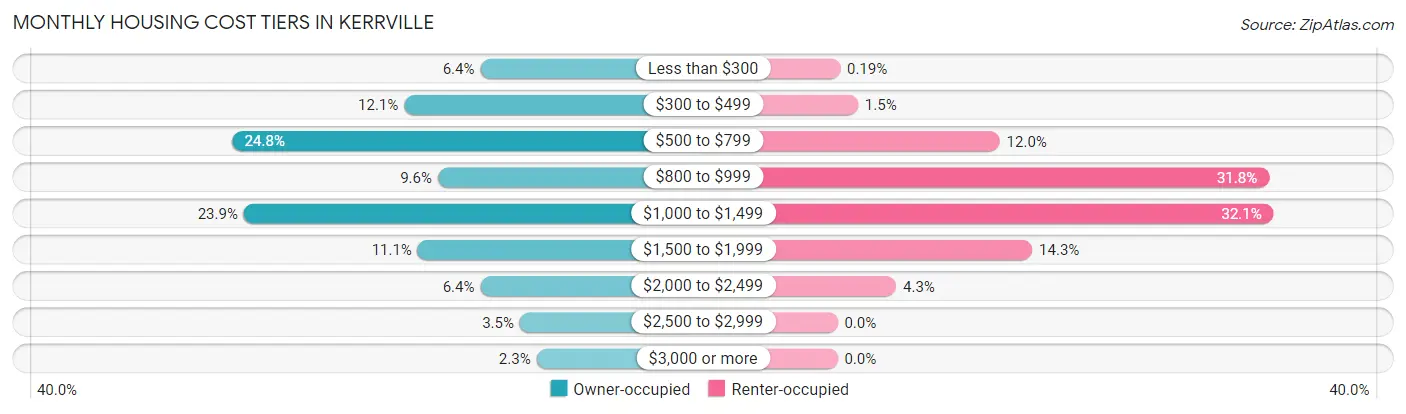
| Monthly Cost | Owner-occupied | Renter-occupied |
| Less than $300 | 381 (6.4%) | 8 (0.2%) |
| $300 to $499 | 713 (12.0%) | 63 (1.5%) |
| $500 to $799 | 1,465 (24.8%) | 498 (11.9%) |
| $800 to $999 | 566 (9.6%) | 1,325 (31.8%) |
| $1,000 to $1,499 | 1,412 (23.9%) | 1,339 (32.1%) |
| $1,500 to $1,999 | 654 (11.1%) | 598 (14.3%) |
| $2,000 to $2,499 | 381 (6.4%) | 180 (4.3%) |
| $2,500 to $2,999 | 209 (3.5%) | 0 (0.0%) |
| $3,000 or more | 136 (2.3%) | 0 (0.0%) |
| Total | 5,917 (100.0%) | 4,169 (100.0%) |
Physical Housing Characteristics in Kerrville
Housing Structures in Kerrville
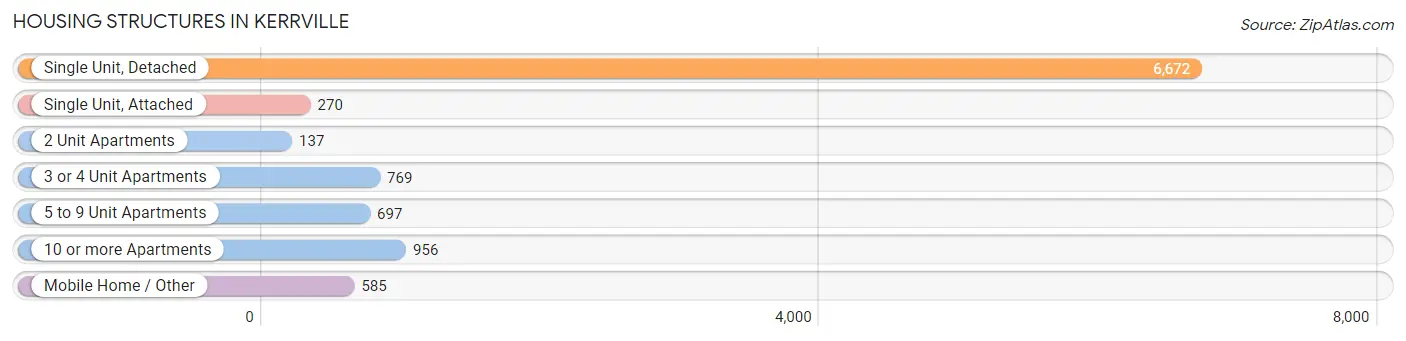
| Structure Type | # Housing Units | % Housing Units |
| Single Unit, Detached | 6,672 | 66.1% |
| Single Unit, Attached | 270 | 2.7% |
| 2 Unit Apartments | 137 | 1.4% |
| 3 or 4 Unit Apartments | 769 | 7.6% |
| 5 to 9 Unit Apartments | 697 | 6.9% |
| 10 or more Apartments | 956 | 9.5% |
| Mobile Home / Other | 585 | 5.8% |
| Total | 10,086 | 100.0% |
Housing Structures by Occupancy in Kerrville
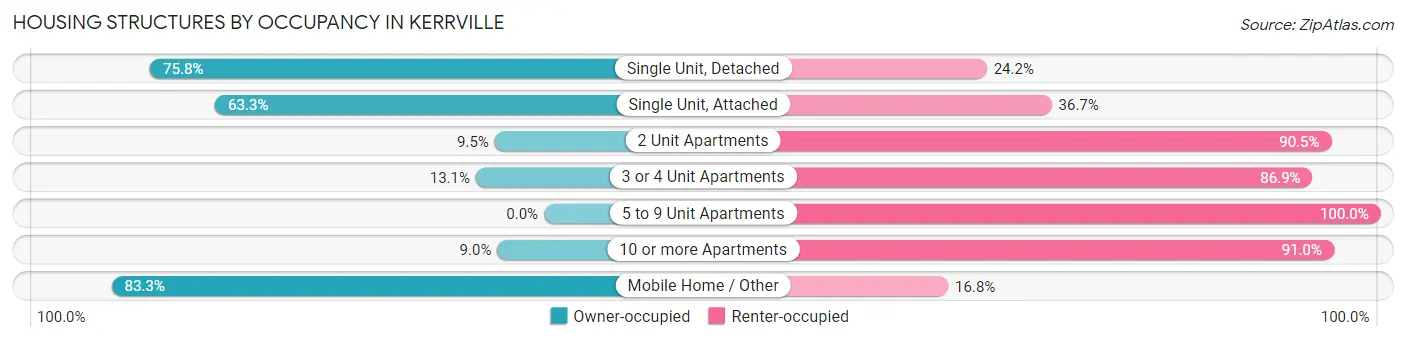
| Structure Type | Owner-occupied | Renter-occupied |
| Single Unit, Detached | 5,059 (75.8%) | 1,613 (24.2%) |
| Single Unit, Attached | 171 (63.3%) | 99 (36.7%) |
| 2 Unit Apartments | 13 (9.5%) | 124 (90.5%) |
| 3 or 4 Unit Apartments | 101 (13.1%) | 668 (86.9%) |
| 5 to 9 Unit Apartments | 0 (0.0%) | 697 (100.0%) |
| 10 or more Apartments | 86 (9.0%) | 870 (91.0%) |
| Mobile Home / Other | 487 (83.3%) | 98 (16.8%) |
| Total | 5,917 (58.7%) | 4,169 (41.3%) |
Housing Structures by Number of Rooms in Kerrville
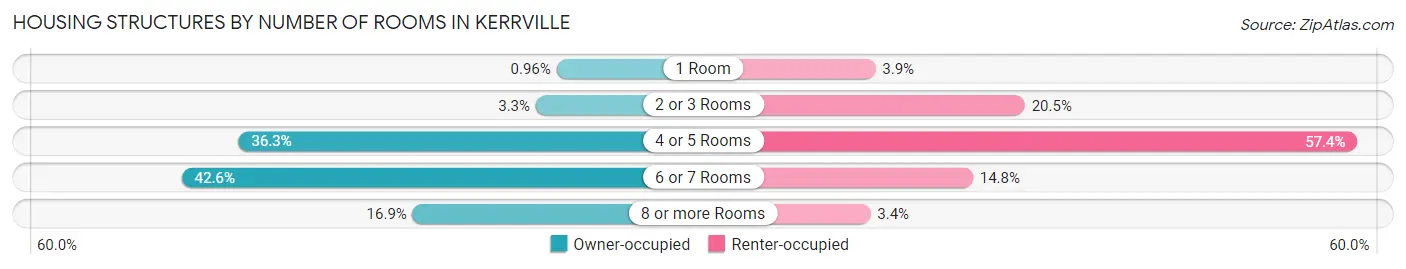
| Number of Rooms | Owner-occupied | Renter-occupied |
| 1 Room | 57 (1.0%) | 164 (3.9%) |
| 2 or 3 Rooms | 193 (3.3%) | 855 (20.5%) |
| 4 or 5 Rooms | 2,146 (36.3%) | 2,394 (57.4%) |
| 6 or 7 Rooms | 2,519 (42.6%) | 615 (14.7%) |
| 8 or more Rooms | 1,002 (16.9%) | 141 (3.4%) |
| Total | 5,917 (100.0%) | 4,169 (100.0%) |
Housing Structure by Heating Type in Kerrville
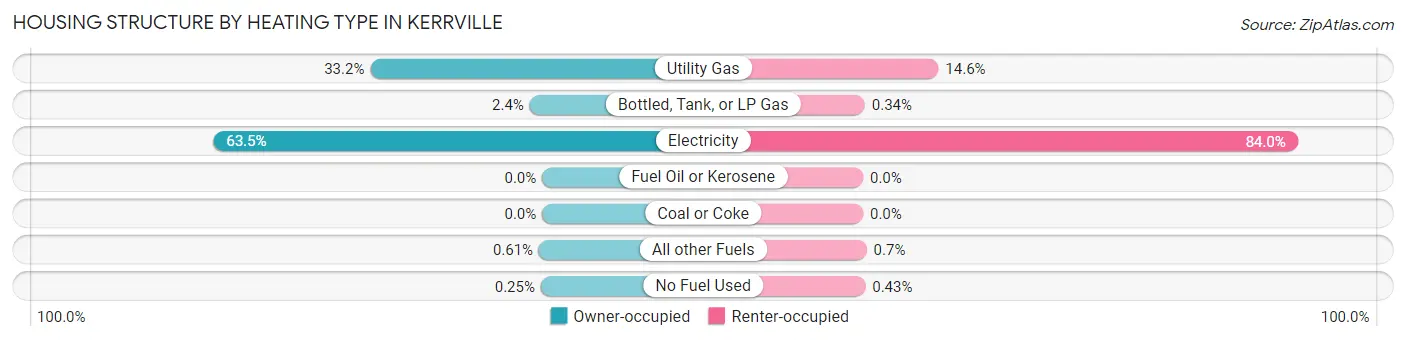
| Heating Type | Owner-occupied | Renter-occupied |
| Utility Gas | 1,965 (33.2%) | 607 (14.6%) |
| Bottled, Tank, or LP Gas | 142 (2.4%) | 14 (0.3%) |
| Electricity | 3,759 (63.5%) | 3,501 (84.0%) |
| Fuel Oil or Kerosene | 0 (0.0%) | 0 (0.0%) |
| Coal or Coke | 0 (0.0%) | 0 (0.0%) |
| All other Fuels | 36 (0.6%) | 29 (0.7%) |
| No Fuel Used | 15 (0.3%) | 18 (0.4%) |
| Total | 5,917 (100.0%) | 4,169 (100.0%) |
Household Vehicle Usage in Kerrville
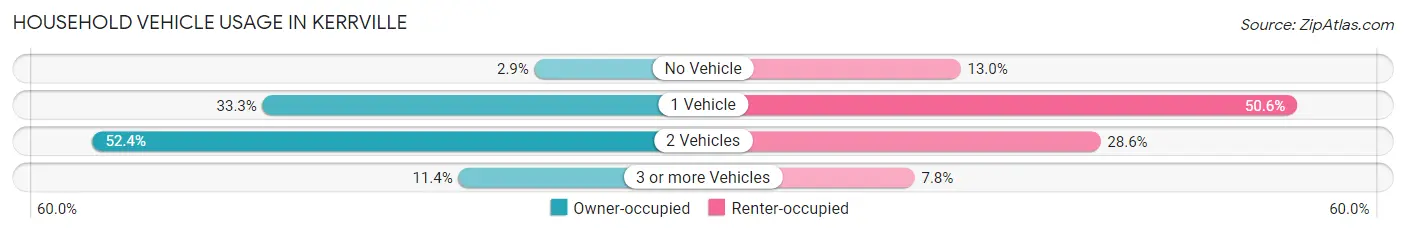
| Vehicles per Household | Owner-occupied | Renter-occupied |
| No Vehicle | 170 (2.9%) | 540 (13.0%) |
| 1 Vehicle | 1,973 (33.3%) | 2,111 (50.6%) |
| 2 Vehicles | 3,100 (52.4%) | 1,193 (28.6%) |
| 3 or more Vehicles | 674 (11.4%) | 325 (7.8%) |
| Total | 5,917 (100.0%) | 4,169 (100.0%) |
Real Estate & Mortgages in Kerrville
Real Estate and Mortgage Overview in Kerrville
| Characteristic | Without Mortgage | With Mortgage |
| Housing Units | 3,330 | 2,587 |
| Median Property Value | $228,900 | $275,200 |
| Median Household Income | $66,525 | $564 |
| Monthly Housing Costs | $592 | $126 |
| Real Estate Taxes | $3,351 | $175 |
Property Value by Mortgage Status in Kerrville
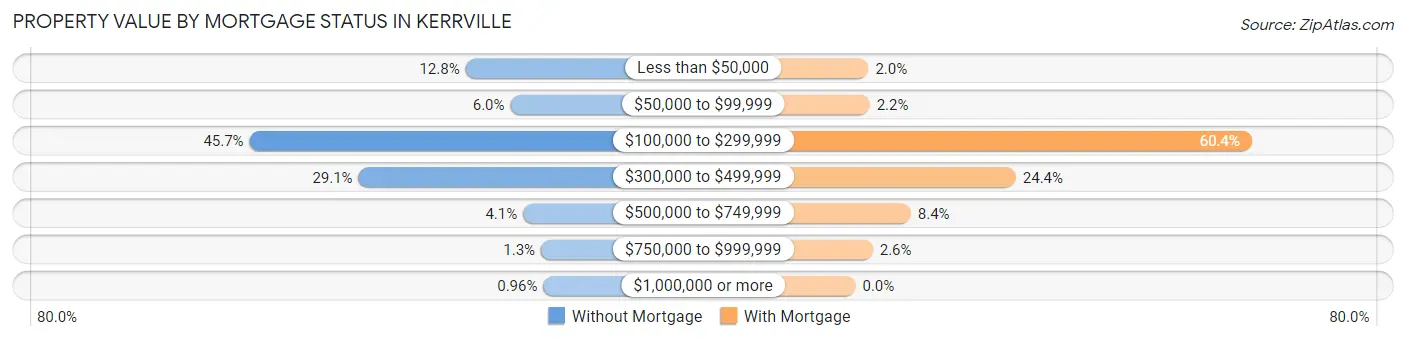
| Property Value | Without Mortgage | With Mortgage |
| Less than $50,000 | 427 (12.8%) | 51 (2.0%) |
| $50,000 to $99,999 | 199 (6.0%) | 56 (2.2%) |
| $100,000 to $299,999 | 1,523 (45.7%) | 1,562 (60.4%) |
| $300,000 to $499,999 | 970 (29.1%) | 632 (24.4%) |
| $500,000 to $749,999 | 135 (4.1%) | 218 (8.4%) |
| $750,000 to $999,999 | 44 (1.3%) | 68 (2.6%) |
| $1,000,000 or more | 32 (1.0%) | 0 (0.0%) |
| Total | 3,330 (100.0%) | 2,587 (100.0%) |
Household Income by Mortgage Status in Kerrville
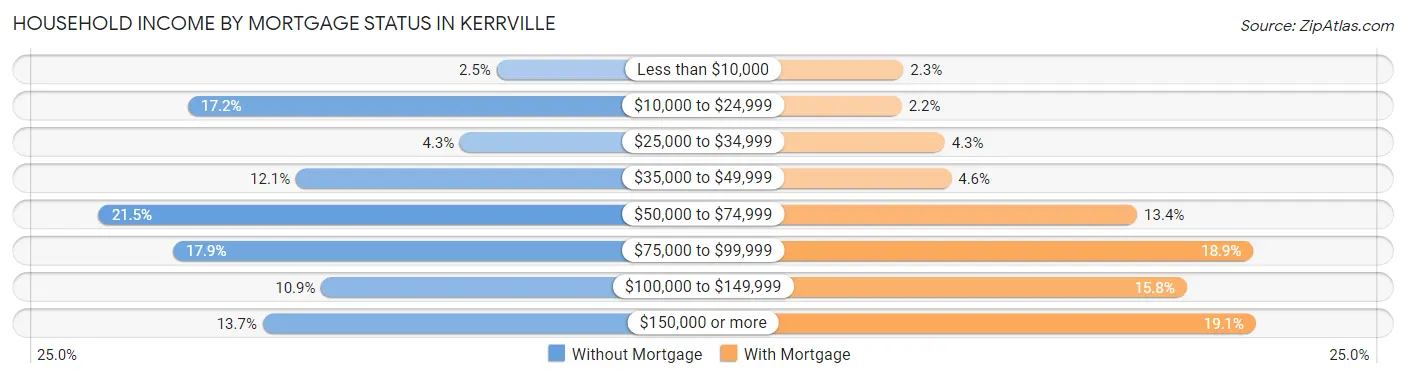
| Household Income | Without Mortgage | With Mortgage |
| Less than $10,000 | 84 (2.5%) | 59 (2.3%) |
| $10,000 to $24,999 | 573 (17.2%) | 57 (2.2%) |
| $25,000 to $34,999 | 142 (4.3%) | 110 (4.3%) |
| $35,000 to $49,999 | 402 (12.1%) | 118 (4.6%) |
| $50,000 to $74,999 | 715 (21.5%) | 347 (13.4%) |
| $75,000 to $99,999 | 597 (17.9%) | 490 (18.9%) |
| $100,000 to $149,999 | 362 (10.9%) | 408 (15.8%) |
| $150,000 or more | 455 (13.7%) | 493 (19.1%) |
| Total | 3,330 (100.0%) | 2,587 (100.0%) |
Property Value to Household Income Ratio in Kerrville
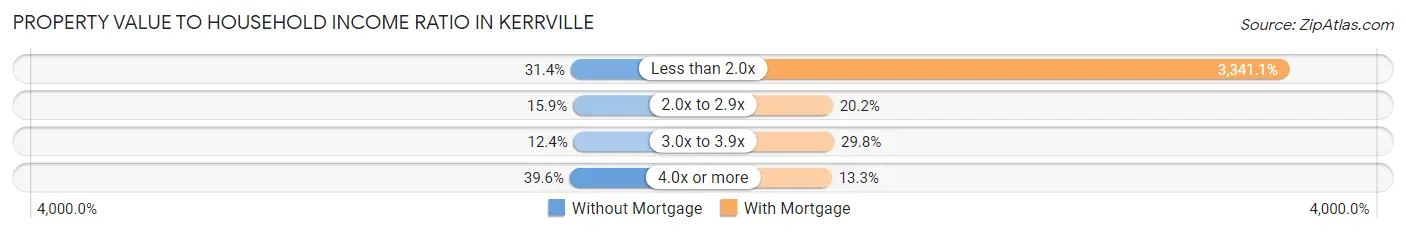
| Value-to-Income Ratio | Without Mortgage | With Mortgage |
| Less than 2.0x | 1,044 (31.4%) | 86,433 (3,341.0%) |
| 2.0x to 2.9x | 529 (15.9%) | 522 (20.2%) |
| 3.0x to 3.9x | 413 (12.4%) | 771 (29.8%) |
| 4.0x or more | 1,317 (39.6%) | 344 (13.3%) |
| Total | 3,330 (100.0%) | 2,587 (100.0%) |
Real Estate Taxes by Mortgage Status in Kerrville
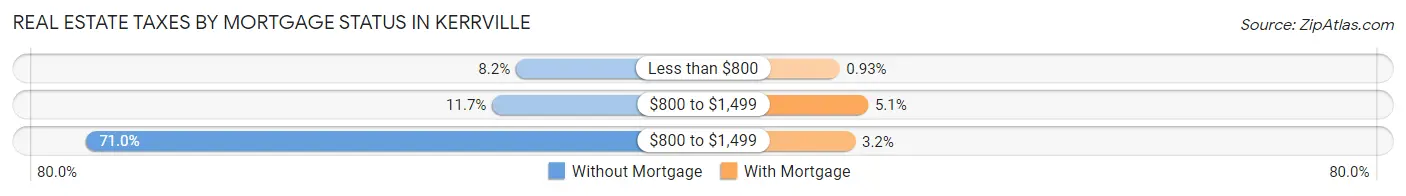
| Property Taxes | Without Mortgage | With Mortgage |
| Less than $800 | 273 (8.2%) | 24 (0.9%) |
| $800 to $1,499 | 389 (11.7%) | 132 (5.1%) |
| $800 to $1,499 | 2,364 (71.0%) | 83 (3.2%) |
| Total | 3,330 (100.0%) | 2,587 (100.0%) |
Health & Disability in Kerrville
Health Insurance Coverage by Age in Kerrville
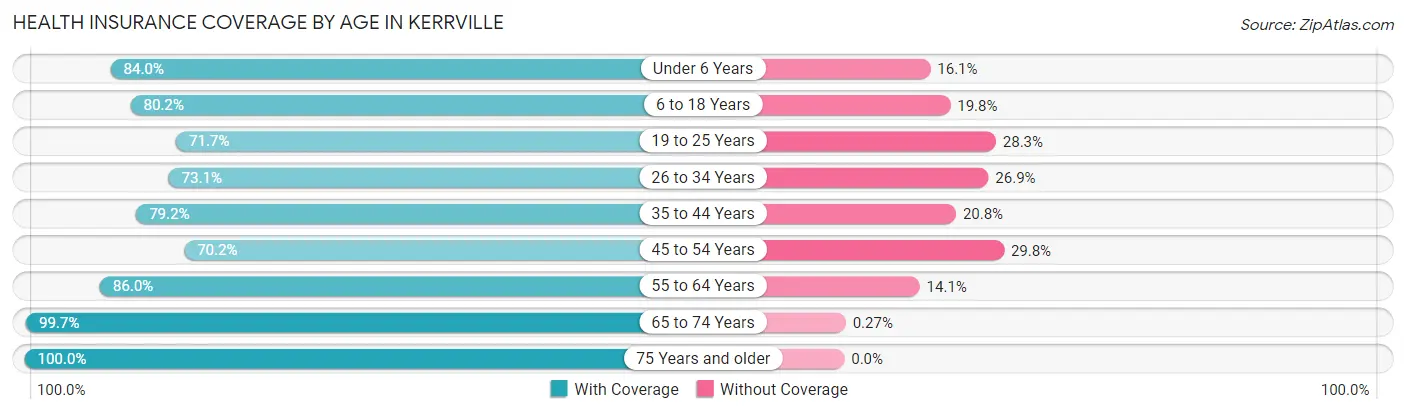
| Age Bracket | With Coverage | Without Coverage |
| Under 6 Years | 1,758 (84.0%) | 336 (16.1%) |
| 6 to 18 Years | 2,737 (80.2%) | 674 (19.8%) |
| 19 to 25 Years | 1,901 (71.7%) | 749 (28.3%) |
| 26 to 34 Years | 1,853 (73.1%) | 681 (26.9%) |
| 35 to 44 Years | 1,753 (79.2%) | 461 (20.8%) |
| 45 to 54 Years | 1,557 (70.2%) | 660 (29.8%) |
| 55 to 64 Years | 1,970 (86.0%) | 322 (14.1%) |
| 65 to 74 Years | 2,921 (99.7%) | 8 (0.3%) |
| 75 Years and older | 3,164 (100.0%) | 0 (0.0%) |
| Total | 19,614 (83.5%) | 3,891 (16.6%) |
Health Insurance Coverage by Citizenship Status in Kerrville
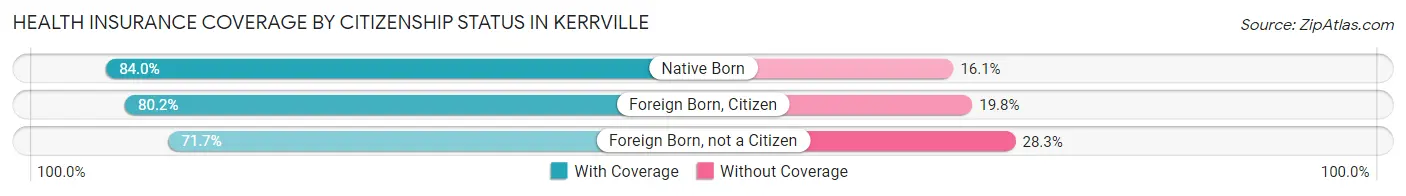
| Citizenship Status | With Coverage | Without Coverage |
| Native Born | 1,758 (84.0%) | 336 (16.1%) |
| Foreign Born, Citizen | 2,737 (80.2%) | 674 (19.8%) |
| Foreign Born, not a Citizen | 1,901 (71.7%) | 749 (28.3%) |
Health Insurance Coverage by Household Income in Kerrville
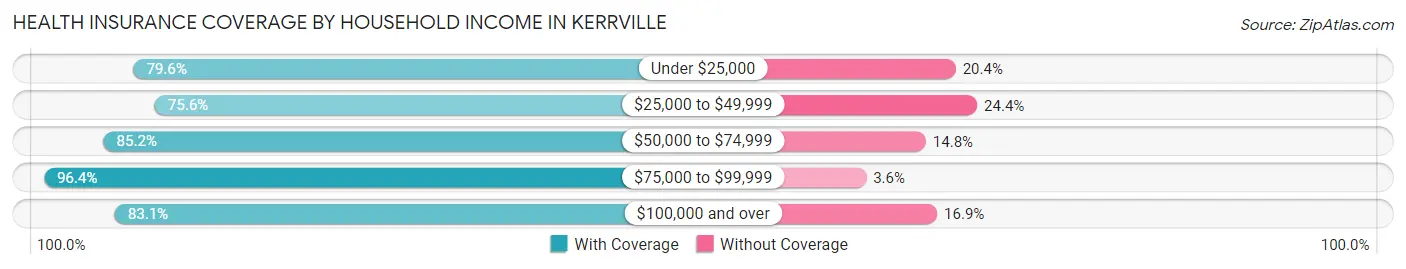
| Household Income | With Coverage | Without Coverage |
| Under $25,000 | 2,422 (79.6%) | 621 (20.4%) |
| $25,000 to $49,999 | 3,634 (75.6%) | 1,174 (24.4%) |
| $50,000 to $74,999 | 3,896 (85.2%) | 678 (14.8%) |
| $75,000 to $99,999 | 3,046 (96.4%) | 115 (3.6%) |
| $100,000 and over | 5,913 (83.1%) | 1,205 (16.9%) |
Public vs Private Health Insurance Coverage by Age in Kerrville
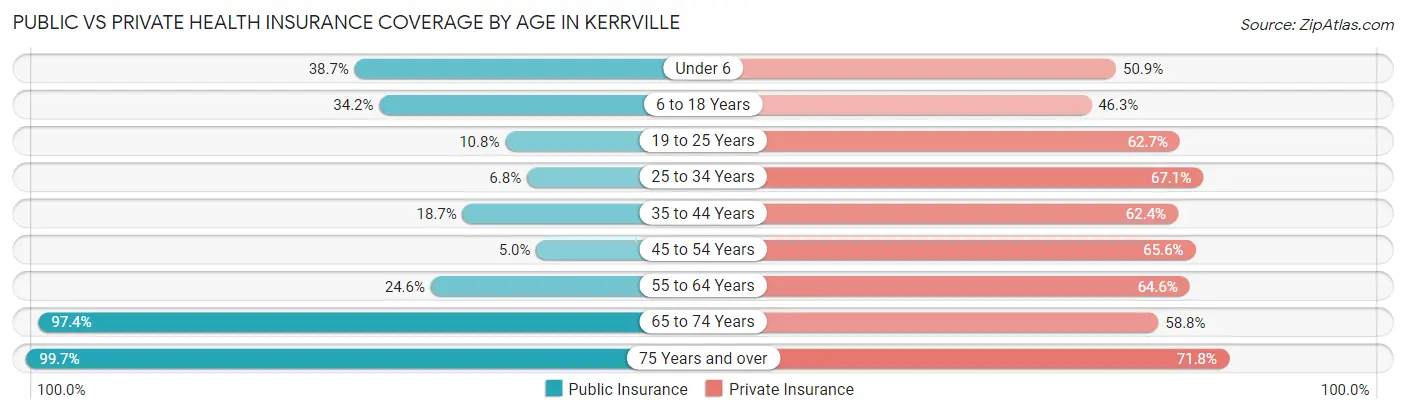
| Age Bracket | Public Insurance | Private Insurance |
| Under 6 | 811 (38.7%) | 1,066 (50.9%) |
| 6 to 18 Years | 1,165 (34.2%) | 1,579 (46.3%) |
| 19 to 25 Years | 286 (10.8%) | 1,662 (62.7%) |
| 25 to 34 Years | 171 (6.8%) | 1,699 (67.0%) |
| 35 to 44 Years | 414 (18.7%) | 1,381 (62.4%) |
| 45 to 54 Years | 111 (5.0%) | 1,455 (65.6%) |
| 55 to 64 Years | 564 (24.6%) | 1,480 (64.6%) |
| 65 to 74 Years | 2,854 (97.4%) | 1,721 (58.8%) |
| 75 Years and over | 3,154 (99.7%) | 2,273 (71.8%) |
| Total | 9,530 (40.5%) | 14,316 (60.9%) |
Disability Status by Sex by Age in Kerrville
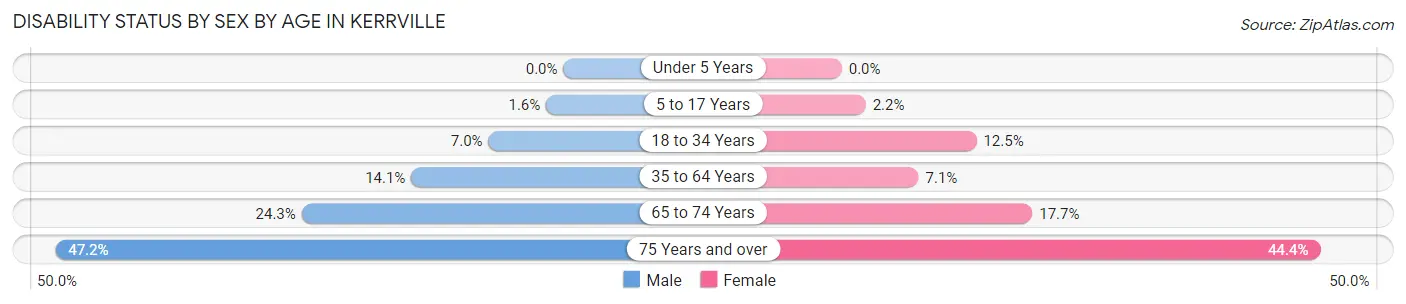
| Age Bracket | Male | Female |
| Under 5 Years | 0 (0.0%) | 0 (0.0%) |
| 5 to 17 Years | 27 (1.6%) | 41 (2.2%) |
| 18 to 34 Years | 177 (7.0%) | 367 (12.5%) |
| 35 to 64 Years | 460 (14.1%) | 247 (7.1%) |
| 65 to 74 Years | 324 (24.3%) | 282 (17.7%) |
| 75 Years and over | 621 (47.1%) | 820 (44.4%) |
Disability Class by Sex by Age in Kerrville
Disability Class: Hearing Difficulty
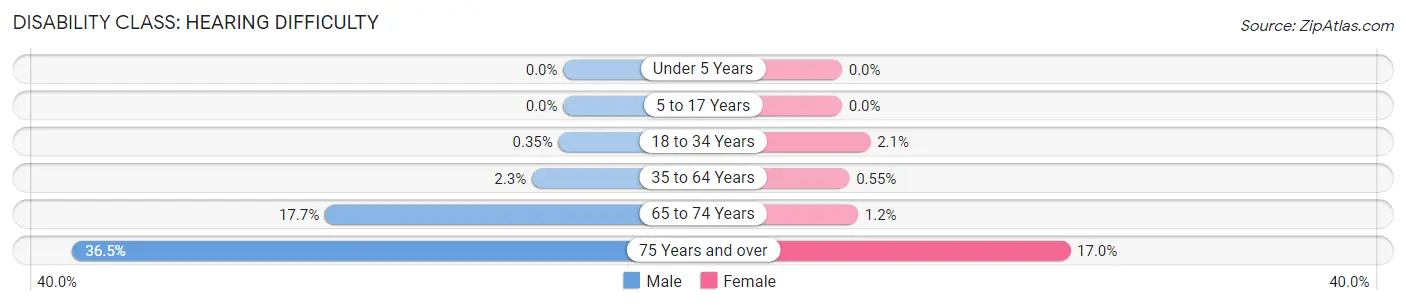
| Age Bracket | Male | Female |
| Under 5 Years | 0 (0.0%) | 0 (0.0%) |
| 5 to 17 Years | 0 (0.0%) | 0 (0.0%) |
| 18 to 34 Years | 9 (0.4%) | 62 (2.1%) |
| 35 to 64 Years | 76 (2.3%) | 19 (0.5%) |
| 65 to 74 Years | 236 (17.7%) | 19 (1.2%) |
| 75 Years and over | 480 (36.4%) | 313 (17.0%) |
Disability Class: Vision Difficulty
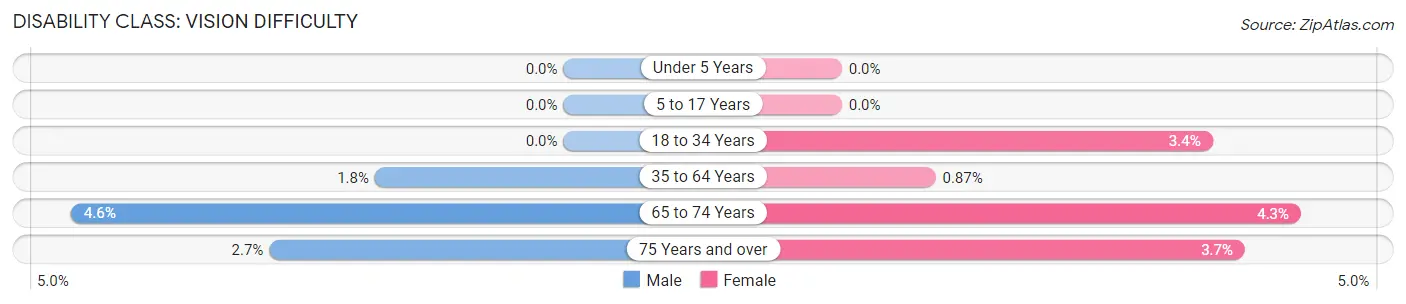
| Age Bracket | Male | Female |
| Under 5 Years | 0 (0.0%) | 0 (0.0%) |
| 5 to 17 Years | 0 (0.0%) | 0 (0.0%) |
| 18 to 34 Years | 0 (0.0%) | 101 (3.4%) |
| 35 to 64 Years | 57 (1.8%) | 30 (0.9%) |
| 65 to 74 Years | 61 (4.6%) | 68 (4.3%) |
| 75 Years and over | 36 (2.7%) | 69 (3.7%) |
Disability Class: Cognitive Difficulty
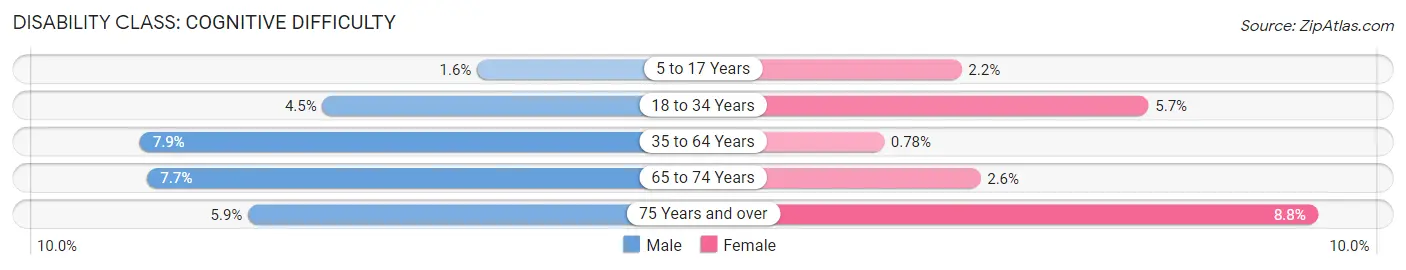
| Age Bracket | Male | Female |
| 5 to 17 Years | 27 (1.6%) | 41 (2.2%) |
| 18 to 34 Years | 114 (4.5%) | 167 (5.7%) |
| 35 to 64 Years | 256 (7.9%) | 27 (0.8%) |
| 65 to 74 Years | 103 (7.7%) | 41 (2.6%) |
| 75 Years and over | 77 (5.9%) | 163 (8.8%) |
Disability Class: Ambulatory Difficulty
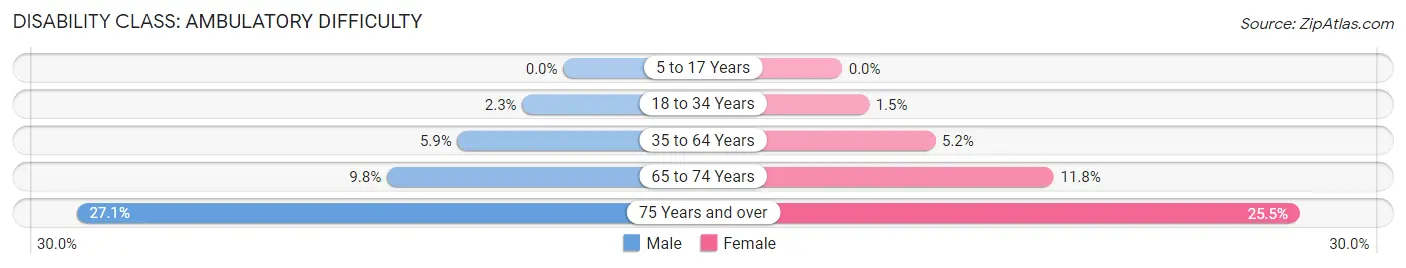
| Age Bracket | Male | Female |
| 5 to 17 Years | 0 (0.0%) | 0 (0.0%) |
| 18 to 34 Years | 58 (2.3%) | 44 (1.5%) |
| 35 to 64 Years | 192 (5.9%) | 180 (5.2%) |
| 65 to 74 Years | 131 (9.8%) | 188 (11.8%) |
| 75 Years and over | 357 (27.1%) | 471 (25.5%) |
Disability Class: Self-Care Difficulty
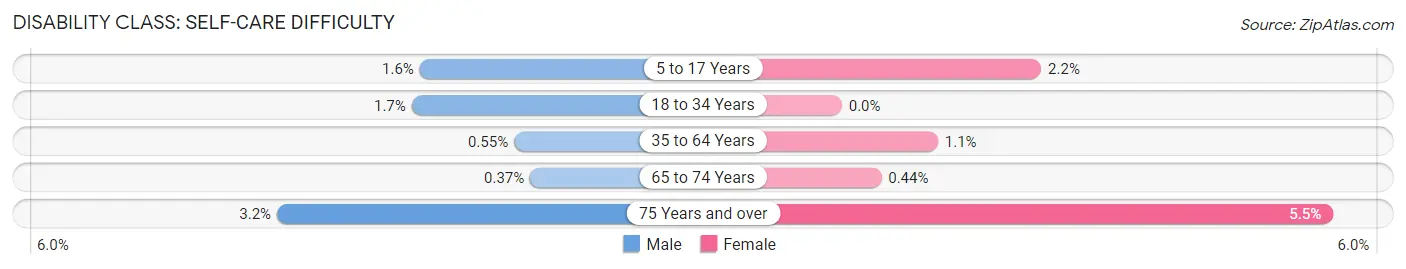
| Age Bracket | Male | Female |
| 5 to 17 Years | 27 (1.6%) | 41 (2.2%) |
| 18 to 34 Years | 43 (1.7%) | 0 (0.0%) |
| 35 to 64 Years | 18 (0.5%) | 37 (1.1%) |
| 65 to 74 Years | 5 (0.4%) | 7 (0.4%) |
| 75 Years and over | 42 (3.2%) | 101 (5.5%) |
Technology Access in Kerrville
Computing Device Access in Kerrville
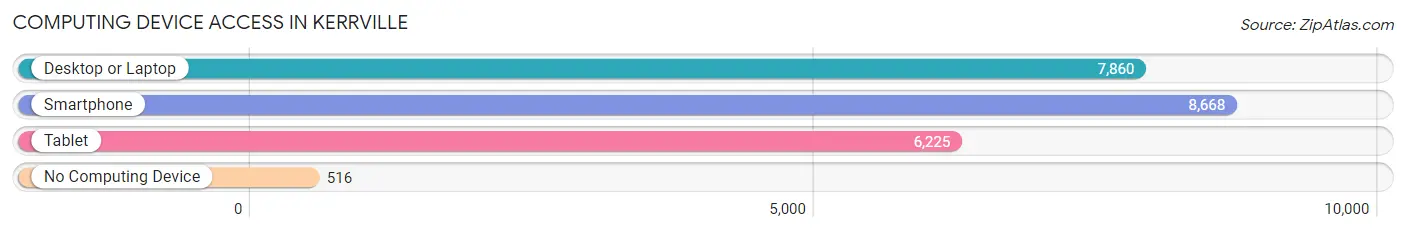
| Device Type | # Households | % Households |
| Desktop or Laptop | 7,860 | 77.9% |
| Smartphone | 8,668 | 85.9% |
| Tablet | 6,225 | 61.7% |
| No Computing Device | 516 | 5.1% |
| Total | 10,086 | 100.0% |
Internet Access in Kerrville
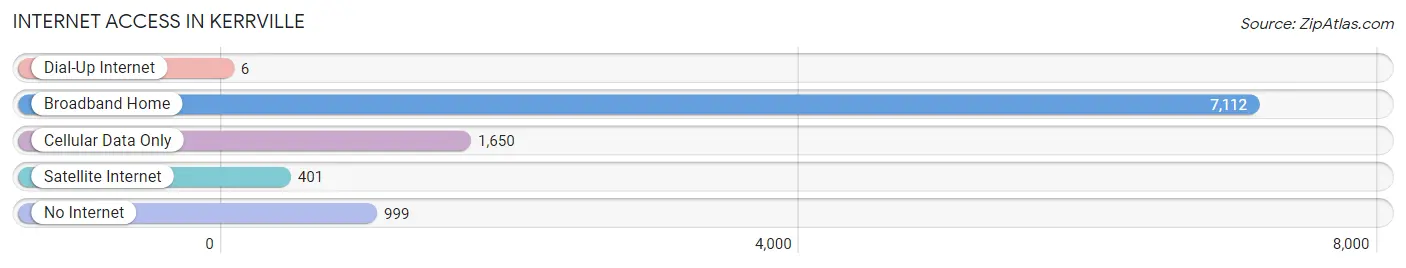
| Internet Type | # Households | % Households |
| Dial-Up Internet | 6 | 0.1% |
| Broadband Home | 7,112 | 70.5% |
| Cellular Data Only | 1,650 | 16.4% |
| Satellite Internet | 401 | 4.0% |
| No Internet | 999 | 9.9% |
| Total | 10,086 | 100.0% |
Kerrville Summary
Kerrville is a city located in the Texas Hill Country, about 65 miles northwest of San Antonio. It is the county seat of Kerr County, and is the largest city in the county. The city has a population of about 23,000 people, and is known for its scenic beauty, outdoor recreation, and cultural attractions.
History
Kerrville was founded in 1856 by Joshua D. Brown, a former Texas Ranger. Brown named the city after his friend, James Kerr, who was a state senator at the time. The city was originally a trading post and a stop on the stagecoach line between San Antonio and El Paso.
In the late 19th century, Kerrville became a popular tourist destination, due to its proximity to the Guadalupe River and its scenic beauty. The city was also home to several resorts, including the famous Y.O. Ranch.
In the early 20th century, Kerrville experienced a period of growth and development. The city was incorporated in 1909, and the first public school was established in 1910. The city also became a center for the oil and gas industry, and the population grew to over 10,000 by the 1950s.
Geography
Kerrville is located in the Texas Hill Country, about 65 miles northwest of San Antonio. The city is situated on the banks of the Guadalupe River, and is surrounded by rolling hills and lush vegetation. The climate is mild and temperate, with hot summers and mild winters.
The city covers an area of about 10 square miles, and is divided into several neighborhoods, including the historic downtown area, the River Road area, and the Hill Country area.
Economy
Kerrville’s economy is largely based on tourism, with the city being a popular destination for outdoor recreation and cultural attractions. The city is also home to several manufacturing and technology companies, as well as a number of retail stores and restaurants.
The city is also home to several educational institutions, including Schreiner University, a private liberal arts college, and the Texas Tech University Health Sciences Center.
Demographics
As of the 2010 census, the population of Kerrville was 23,434. The racial makeup of the city was 79.3% White, 1.3% African American, 0.7% Native American, 0.9% Asian, 0.1% Pacific Islander, 15.2% from other races, and 2.5% from two or more races. Hispanic or Latino of any race were 28.3% of the population.
The median income for a household in the city was $37,945, and the median income for a family was $45,945. The per capita income for the city was $20,945. About 14.3% of families and 17.7% of the population were below the poverty line, including 25.2% of those under age 18 and 10.2% of those age 65 or over.
Common Questions
What is Per Capita Income in Kerrville?
Per Capita income in Kerrville is $33,733.
What is the Median Family Income in Kerrville?
Median Family Income in Kerrville is $76,192.
What is the Median Household income in Kerrville?
Median Household Income in Kerrville is $58,797.
What is Income or Wage Gap in Kerrville?
Income or Wage Gap in Kerrville is 17.7%.
Women in Kerrville earn 82.3 cents for every dollar earned by a man.
What is Inequality or Gini Index in Kerrville?
Inequality or Gini Index in Kerrville is 0.45.
What is the Total Population of Kerrville?
Total Population of Kerrville is 24,333.
What is the Total Male Population of Kerrville?
Total Male Population of Kerrville is 11,468.
What is the Total Female Population of Kerrville?
Total Female Population of Kerrville is 12,865.
What is the Ratio of Males per 100 Females in Kerrville?
There are 89.14 Males per 100 Females in Kerrville.
What is the Ratio of Females per 100 Males in Kerrville?
There are 112.18 Females per 100 Males in Kerrville.
What is the Median Population Age in Kerrville?
Median Population Age in Kerrville is 39.9 Years.
What is the Average Family Size in Kerrville
Average Family Size in Kerrville is 2.9 People.
What is the Average Household Size in Kerrville
Average Household Size in Kerrville is 2.3 People.
How Large is the Labor Force in Kerrville?
There are 10,760 People in the Labor Forcein in Kerrville.
What is the Percentage of People in the Labor Force in Kerrville?
54.7% of People are in the Labor Force in Kerrville.
What is the Unemployment Rate in Kerrville?
Unemployment Rate in Kerrville is 2.5%.