Zip Codes with the Highest Percentage of Self-Employed / Incorporated in Pittsburgh, PA

RELATED REPORTS & OPTIONS

Self-Employed / Incorporated
Population
Families and Households
Female Fertility
Female Fertility (Unmarried)
Race (Community Size)
Race (Percentage)
Ancestry (Community Size)
AfghanAfricanAlbanianAlsatianAmericanApacheArabArgentineanArmenianAustralianAustrianBahamianBarbadianBasqueBelgianBhutaneseBlackfeetBolivianBrazilianBritishBritish West IndianBulgarianBurmeseCajunCambodianCanadianCape VerdeanCarpatho RusynCelticCentral AmericanCentral American IndianCherokeeChickasawChileanChippewaChoctawColombianComancheCosta RicanCreekCroatianCubanCypriotCzechCzechoslovakianDanishDelawareDominicanDutchEastern EuropeanEcuadorianEgyptianEnglishEthiopianEuropeanFilipinoFinnishFrenchFrench American IndianFrench CanadianGermanGhanaianGreekGuamanian / ChamorroGuatemalanGuyaneseHaitianHonduranHungarianIndian (Asian)IndonesianIranianIraqiIrishIroquoisIsraeliItalianJamaicanJapaneseJordanianKenyanKoreanLaotianLatvianLebaneseLiberianLithuanianLumbeeLuxembourgerMacedonianMalaysianMalteseMexicanMexican American IndianMongolianMoroccanNative HawaiianNavajoNew ZealanderNicaraguanNigerianNorthern EuropeanNorwegianPakistaniPalestinianPanamanianParaguayanPennsylvania GermanPeruvianPolishPortuguesePuerto RicanRomanianRussianSalvadoranSamoanScandinavianScotch-IrishScottishSeminoleSerbianSiouxSlavicSlovakSloveneSouth AfricanSouth AmericanSouth American IndianSoviet UnionSpaniardSpanishSri LankanSubsaharan AfricanSudaneseSwedishSwissSyrianThaiTrinidadian and TobagonianTurkishU.S. Virgin IslanderUgandanUkrainianUruguayanVenezuelanVietnameseWelshWest IndianYugoslavian
Ancestry (Percentage)
AfghanAfricanAlbanianAlsatianAmericanApacheArabArgentineanArmenianAustralianAustrianBahamianBarbadianBasqueBelgianBhutaneseBlackfeetBolivianBrazilianBritishBritish West IndianBulgarianBurmeseCajunCambodianCanadianCape VerdeanCarpatho RusynCelticCentral AmericanCentral American IndianCherokeeChickasawChileanChippewaChoctawColombianComancheCosta RicanCreekCroatianCubanCypriotCzechCzechoslovakianDanishDelawareDominicanDutchEastern EuropeanEcuadorianEgyptianEnglishEthiopianEuropeanFilipinoFinnishFrenchFrench American IndianFrench CanadianGermanGhanaianGreekGuamanian / ChamorroGuatemalanGuyaneseHaitianHonduranHungarianIndian (Asian)IndonesianIranianIraqiIrishIroquoisIsraeliItalianJamaicanJapaneseJordanianKenyanKoreanLaotianLatvianLebaneseLiberianLithuanianLumbeeLuxembourgerMacedonianMalaysianMalteseMexicanMexican American IndianMongolianMoroccanNative HawaiianNavajoNew ZealanderNicaraguanNigerianNorthern EuropeanNorwegianPakistaniPalestinianPanamanianParaguayanPennsylvania GermanPeruvianPolishPortuguesePuerto RicanRomanianRussianSalvadoranSamoanScandinavianScotch-IrishScottishSeminoleSerbianSiouxSlavicSlovakSloveneSouth AfricanSouth AmericanSouth American IndianSoviet UnionSpaniardSpanishSri LankanSubsaharan AfricanSudaneseSwedishSwissSyrianThaiTrinidadian and TobagonianTurkishU.S. Virgin IslanderUgandanUkrainianUruguayanVenezuelanVietnameseWelshWest IndianYugoslavian
Immigrant Origin (Total)
AfghanistanAfricaAlbaniaArgentinaAsiaAustraliaAustriaBahamasBangladeshBelarusBelgiumBoliviaBosnia and HerzegovinaBrazilBulgariaBurma / MyanmarCambodiaCameroonCanadaCaribbeanCentral AmericaChileChinaColombiaCongoCosta RicaCroatiaCubaCzechoslovakiaDenmarkDominican RepublicEastern AfricaEastern AsiaEastern EuropeEcuadorEgyptEl SalvadorEnglandEritreaEthiopiaEuropeFranceGermanyGhanaGreeceGuatemalaGuyanaHaitiHondurasHong KongHungaryIndiaIndonesiaIranIraqIrelandIsraelItalyJamaicaJapanJordanKazakhstanKenyaKoreaKuwaitLatin AmericaLatviaLebanonLiberiaLithuaniaMalaysiaMexicoMiddle AfricaMoldovaMoroccoNepalNetherlandsNigeriaNorthern AfricaNorthern EuropeNorwayOceaniaPakistanPanamaPeruPhilippinesPolandPortugalRomaniaRussiaSaudi ArabiaScotlandSerbiaSingaporeSouth AfricaSouth AmericaSouth Central AsiaSouth Eastern AsiaSouthern EuropeSpainSri LankaSudanSwedenSwitzerlandSyriaTaiwanThailandTrinidad and TobagoTurkeyUgandaUkraineUzbekistanVenezuelaVietnamWestern AfricaWestern AsiaWestern EuropeZaire
Immigrant Origin (Percentage)
AfghanistanAfricaAlbaniaArgentinaAsiaAustraliaAustriaBahamasBangladeshBelarusBelgiumBoliviaBosnia and HerzegovinaBrazilBulgariaBurma / MyanmarCambodiaCameroonCanadaCaribbeanCentral AmericaChileChinaColombiaCongoCosta RicaCroatiaCubaCzechoslovakiaDenmarkDominican RepublicEastern AfricaEastern AsiaEastern EuropeEcuadorEgyptEl SalvadorEnglandEritreaEthiopiaEuropeFranceGermanyGhanaGreeceGuatemalaGuyanaHaitiHondurasHong KongHungaryIndiaIndonesiaIranIraqIrelandIsraelItalyJamaicaJapanJordanKazakhstanKenyaKoreaKuwaitLatin AmericaLatviaLebanonLiberiaLithuaniaMalaysiaMexicoMiddle AfricaMoldovaMoroccoNepalNetherlandsNigeriaNorthern AfricaNorthern EuropeNorwayOceaniaPakistanPanamaPeruPhilippinesPolandPortugalRomaniaRussiaSaudi ArabiaScotlandSerbiaSingaporeSouth AfricaSouth AmericaSouth Central AsiaSouth Eastern AsiaSouthern EuropeSpainSri LankaSudanSwedenSwitzerlandSyriaTaiwanThailandTrinidad and TobagoTurkeyUgandaUkraineUzbekistanVenezuelaVietnamWestern AfricaWestern AsiaWestern EuropeZaire
Income
Income (Families)
Income (Households)
Poverty
Poverty (Families)
Unemployment
Employment Occupations
Employment Industries
Employer Class
Commute Time
Commute Means
School Enrollment
Education by Degree Field
Occupancy
Finances
Physical Characteristics
Pittsburgh
Compare Zip Codes
Comparison Subject

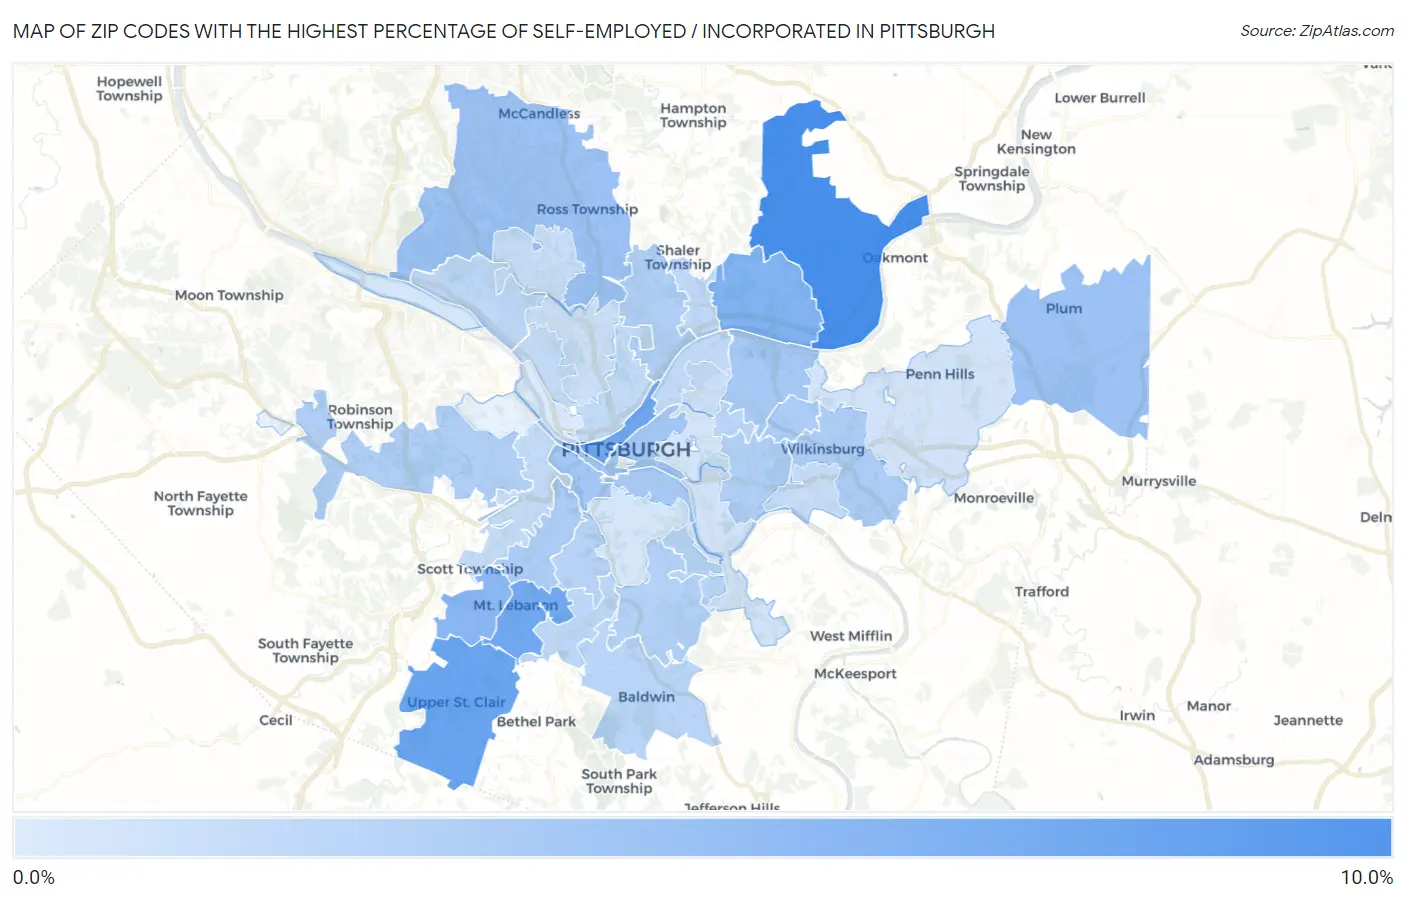
Map of Zip Codes with the Highest Percentage of Self-Employed / Incorporated in Pittsburgh

0.0%
10.0%
Zip Codes with the Highest Percentage of Self-Employed / Incorporated in Pittsburgh Map

Zip Codes with the Highest Percentage of Self-Employed / Incorporated in Pittsburgh, PA

Zip Code % Self-Employed / Incorporated vs State vs National
1.152388.2%3.0%(+5.20)#1013.8%(+4.42)#3,452
2.152416.4%3.0%(+3.35)#1653.8%(+2.58)#5,644
3.152285.9%3.0%(+2.90)#1913.8%(+2.13)#6,445
4.152225.9%3.0%(+2.89)#1923.8%(+2.11)#6,467
5.152155.1%3.0%(+2.05)#2583.8%(+1.27)#8,354
6.152434.7%3.0%(+1.63)#3053.8%(+0.849)#9,569
7.152393.7%3.0%(+0.664)#4683.8%(-0.113)#13,167
8.152373.6%3.0%(+0.551)#4903.8%(-0.227)#13,644
9.152193.3%3.0%(+0.258)#5673.8%(-0.519)#14,966
10.152113.3%3.0%(+0.235)#5723.8%(-0.543)#15,064
11.152063.2%3.0%(+0.169)#5963.8%(-0.609)#15,365
12.152033.0%3.0%(-0.035)#6543.8%(-0.813)#16,377
13.152083.0%3.0%(-0.089)#6703.8%(-0.867)#16,649
14.152162.9%3.0%(-0.187)#6983.8%(-0.964)#17,133
15.152212.7%3.0%(-0.290)#7393.8%(-1.07)#17,619
16.152172.6%3.0%(-0.418)#7843.8%(-1.20)#18,330
17.152052.5%3.0%(-0.516)#8303.8%(-1.29)#18,782
18.152092.5%3.0%(-0.534)#8333.8%(-1.31)#18,863
19.152272.4%3.0%(-0.627)#8623.8%(-1.41)#19,339
20.152262.2%3.0%(-0.801)#9123.8%(-1.58)#20,173
21.152322.0%3.0%(-1.00)#9853.8%(-1.78)#21,198
22.152362.0%3.0%(-1.01)#9883.8%(-1.79)#21,217
23.152341.9%3.0%(-1.10)#1,0163.8%(-1.88)#21,655
24.152021.9%3.0%(-1.19)#1,0373.8%(-1.97)#22,060
25.152011.8%3.0%(-1.28)#1,0603.8%(-2.05)#22,414
26.152231.7%3.0%(-1.37)#1,0833.8%(-2.15)#22,810
27.152121.7%3.0%(-1.39)#1,0893.8%(-2.16)#22,892
28.152201.6%3.0%(-1.46)#1,1103.8%(-2.24)#23,171
29.152181.5%3.0%(-1.55)#1,1413.8%(-2.33)#23,538
30.152291.4%3.0%(-1.61)#1,1623.8%(-2.39)#23,759
31.152241.3%3.0%(-1.73)#1,1873.8%(-2.51)#24,220
32.152141.1%3.0%(-1.92)#1,2343.8%(-2.69)#24,905
33.152350.94%3.0%(-2.10)#1,2683.8%(-2.88)#25,464
34.152070.85%3.0%(-2.19)#1,2843.8%(-2.97)#25,698
35.152130.82%3.0%(-2.22)#1,2893.8%(-2.99)#25,751
36.152100.72%3.0%(-2.32)#1,3133.8%(-3.10)#26,026
37.152250.63%3.0%(-2.41)#1,3323.8%(-3.19)#26,242
38.152330.31%3.0%(-2.73)#1,3703.8%(-3.51)#26,785

Common Questions

What are the Top 10 Zip Codes with the Highest Percentage of Self-Employed / Incorporated in Pittsburgh, PA?
Top 10 Zip Codes with the Highest Percentage of Self-Employed / Incorporated in Pittsburgh, PA are:
#1
8.2%
#2
6.4%
#3
5.9%
#4
5.9%
#5
5.1%
#6
4.7%
#7
3.7%
#8
3.6%
#9
3.3%
#10
3.3%
What zip code has the Highest Percentage of Self-Employed / Incorporated in Pittsburgh, PA?
15238 has the Highest Percentage of Self-Employed / Incorporated in Pittsburgh, PA with 8.2%.
What is the Percentage of Self-Employed / Incorporated in Pittsburgh, PA?
Percentage of Self-Employed / Incorporated in Pittsburgh is 2.0%.
What is the Percentage of Self-Employed / Incorporated in Pennsylvania?
Percentage of Self-Employed / Incorporated in Pennsylvania is 3.0%.
What is the Percentage of Self-Employed / Incorporated in the United States?
Percentage of Self-Employed / Incorporated in the United States is 3.8%.