Zip Codes with the Highest Percentage of Self-Employed / Not Incorporated in Philadelphia, PA

RELATED REPORTS & OPTIONS

Self-Employed / Not Incorporated
Population
Families and Households
Female Fertility
Female Fertility (Unmarried)
Race (Community Size)
Race (Percentage)
Ancestry (Community Size)
AfghanAfricanAlaska NativeAlaskan AthabascanAlbanianAmericanApacheArabArgentineanArmenianAustralianAustrianBahamianBangladeshiBarbadianBasqueBelgianBelizeanBermudanBhutaneseBlackfeetBolivianBrazilianBritishBritish West IndianBulgarianBurmeseCajunCambodianCanadianCape VerdeanCarpatho RusynCelticCentral AmericanCentral American IndianCherokeeChickasawChileanChippewaChoctawColombianCosta RicanCreekCroatianCubanCypriotCzechCzechoslovakianDanishDelawareDominicanDutchEastern EuropeanEcuadorianEgyptianEnglishEstonianEthiopianEuropeanFilipinoFinnishFrenchFrench American IndianFrench CanadianGermanGerman RussianGhanaianGreekGuamanian / ChamorroGuatemalanGuyaneseHaitianHonduranHungarianIcelanderIndian (Asian)IndonesianInupiatIranianIraqiIrishIroquoisIsraeliItalianJamaicanJapaneseJordanianKenyanKoreanLaotianLatvianLebaneseLiberianLithuanianLumbeeMacedonianMalaysianMexicanMexican American IndianMongolianMoroccanNative HawaiianNavajoNew ZealanderNicaraguanNigerianNorthern EuropeanNorwegianOkinawanPakistaniPalestinianPanamanianParaguayanPennsylvania GermanPeruvianPolishPortuguesePotawatomiPuerto RicanRomanianRussianSalvadoranSamoanScandinavianScotch-IrishScottishSeminoleSenegaleseSerbianShoshoneSierra LeoneanSiouxSlavicSlovakSloveneSomaliSouth AfricanSouth AmericanSouth American IndianSpaniardSpanishSpanish AmericanSri LankanSubsaharan AfricanSudaneseSwedishSwissSyrianThaiTrinidadian and TobagonianTurkishU.S. Virgin IslanderUgandanUkrainianUruguayanVenezuelanVietnameseWelshWest IndianYugoslavian
Ancestry (Percentage)
AfghanAfricanAlaska NativeAlaskan AthabascanAlbanianAmericanApacheArabArgentineanArmenianAustralianAustrianBahamianBangladeshiBarbadianBasqueBelgianBelizeanBermudanBhutaneseBlackfeetBolivianBrazilianBritishBritish West IndianBulgarianBurmeseCajunCambodianCanadianCape VerdeanCarpatho RusynCelticCentral AmericanCentral American IndianCherokeeChickasawChileanChippewaChoctawColombianCosta RicanCreekCroatianCubanCypriotCzechCzechoslovakianDanishDelawareDominicanDutchEastern EuropeanEcuadorianEgyptianEnglishEstonianEthiopianEuropeanFilipinoFinnishFrenchFrench American IndianFrench CanadianGermanGerman RussianGhanaianGreekGuamanian / ChamorroGuatemalanGuyaneseHaitianHonduranHungarianIcelanderIndian (Asian)IndonesianInupiatIranianIraqiIrishIroquoisIsraeliItalianJamaicanJapaneseJordanianKenyanKoreanLaotianLatvianLebaneseLiberianLithuanianLumbeeMacedonianMalaysianMexicanMexican American IndianMongolianMoroccanNative HawaiianNavajoNew ZealanderNicaraguanNigerianNorthern EuropeanNorwegianOkinawanPakistaniPalestinianPanamanianParaguayanPennsylvania GermanPeruvianPolishPortuguesePotawatomiPuerto RicanRomanianRussianSalvadoranSamoanScandinavianScotch-IrishScottishSeminoleSenegaleseSerbianShoshoneSierra LeoneanSiouxSlavicSlovakSloveneSomaliSouth AfricanSouth AmericanSouth American IndianSpaniardSpanishSpanish AmericanSri LankanSubsaharan AfricanSudaneseSwedishSwissSyrianThaiTrinidadian and TobagonianTurkishU.S. Virgin IslanderUgandanUkrainianUruguayanVenezuelanVietnameseWelshWest IndianYugoslavian
Immigrant Origin (Total)
AfghanistanAfricaAlbaniaArgentinaArmeniaAsiaAustraliaAustriaBangladeshBarbadosBelarusBelgiumBelizeBoliviaBosnia and HerzegovinaBrazilBulgariaBurma / MyanmarCambodiaCameroonCanadaCaribbeanCentral AmericaChileChinaColombiaCongoCosta RicaCroatiaCubaCzechoslovakiaDenmarkDominicaDominican RepublicEastern AfricaEastern AsiaEastern EuropeEcuadorEgyptEl SalvadorEnglandEritreaEthiopiaEuropeFranceGermanyGhanaGreeceGrenadaGuatemalaGuyanaHaitiHondurasHong KongHungaryIndiaIndonesiaIranIraqIrelandIsraelItalyJamaicaJapanJordanKazakhstanKenyaKoreaKuwaitLaosLatin AmericaLatviaLebanonLiberiaLithuaniaMalaysiaMexicoMiddle AfricaMoldovaMoroccoNepalNetherlandsNicaraguaNigeriaNorth MacedoniaNorthern AfricaNorthern EuropeNorwayOceaniaPakistanPanamaPeruPhilippinesPolandPortugalRomaniaRussiaSaudi ArabiaScotlandSenegalSerbiaSierra LeoneSingaporeSouth AfricaSouth AmericaSouth Central AsiaSouth Eastern AsiaSouthern EuropeSpainSri LankaSt. Vincent and the GrenadinesSudanSwedenSwitzerlandSyriaTaiwanThailandTrinidad and TobagoTurkeyUkraineUruguayUzbekistanVenezuelaVietnamWest IndiesWestern AfricaWestern AsiaWestern EuropeZaireZimbabwe
Immigrant Origin (Percentage)
AfghanistanAfricaAlbaniaArgentinaArmeniaAsiaAustraliaAustriaBangladeshBarbadosBelarusBelgiumBelizeBoliviaBosnia and HerzegovinaBrazilBulgariaBurma / MyanmarCambodiaCameroonCanadaCaribbeanCentral AmericaChileChinaColombiaCongoCosta RicaCroatiaCubaCzechoslovakiaDenmarkDominicaDominican RepublicEastern AfricaEastern AsiaEastern EuropeEcuadorEgyptEl SalvadorEnglandEritreaEthiopiaEuropeFranceGermanyGhanaGreeceGrenadaGuatemalaGuyanaHaitiHondurasHong KongHungaryIndiaIndonesiaIranIraqIrelandIsraelItalyJamaicaJapanJordanKazakhstanKenyaKoreaKuwaitLaosLatin AmericaLatviaLebanonLiberiaLithuaniaMalaysiaMexicoMiddle AfricaMoldovaMoroccoNepalNetherlandsNicaraguaNigeriaNorth MacedoniaNorthern AfricaNorthern EuropeNorwayOceaniaPakistanPanamaPeruPhilippinesPolandPortugalRomaniaRussiaSaudi ArabiaScotlandSenegalSerbiaSierra LeoneSingaporeSouth AfricaSouth AmericaSouth Central AsiaSouth Eastern AsiaSouthern EuropeSpainSri LankaSt. Vincent and the GrenadinesSudanSwedenSwitzerlandSyriaTaiwanThailandTrinidad and TobagoTurkeyUkraineUruguayUzbekistanVenezuelaVietnamWest IndiesWestern AfricaWestern AsiaWestern EuropeZaireZimbabwe
Income
Income (Families)
Income (Households)
Poverty
Poverty (Families)
Unemployment
Employment Occupations
Employment Industries
Employer Class
Commute Time
Commute Means
School Enrollment
Education by Degree Field
Occupancy
Finances
Physical Characteristics
Philadelphia
Compare Zip Codes
Comparison Subject

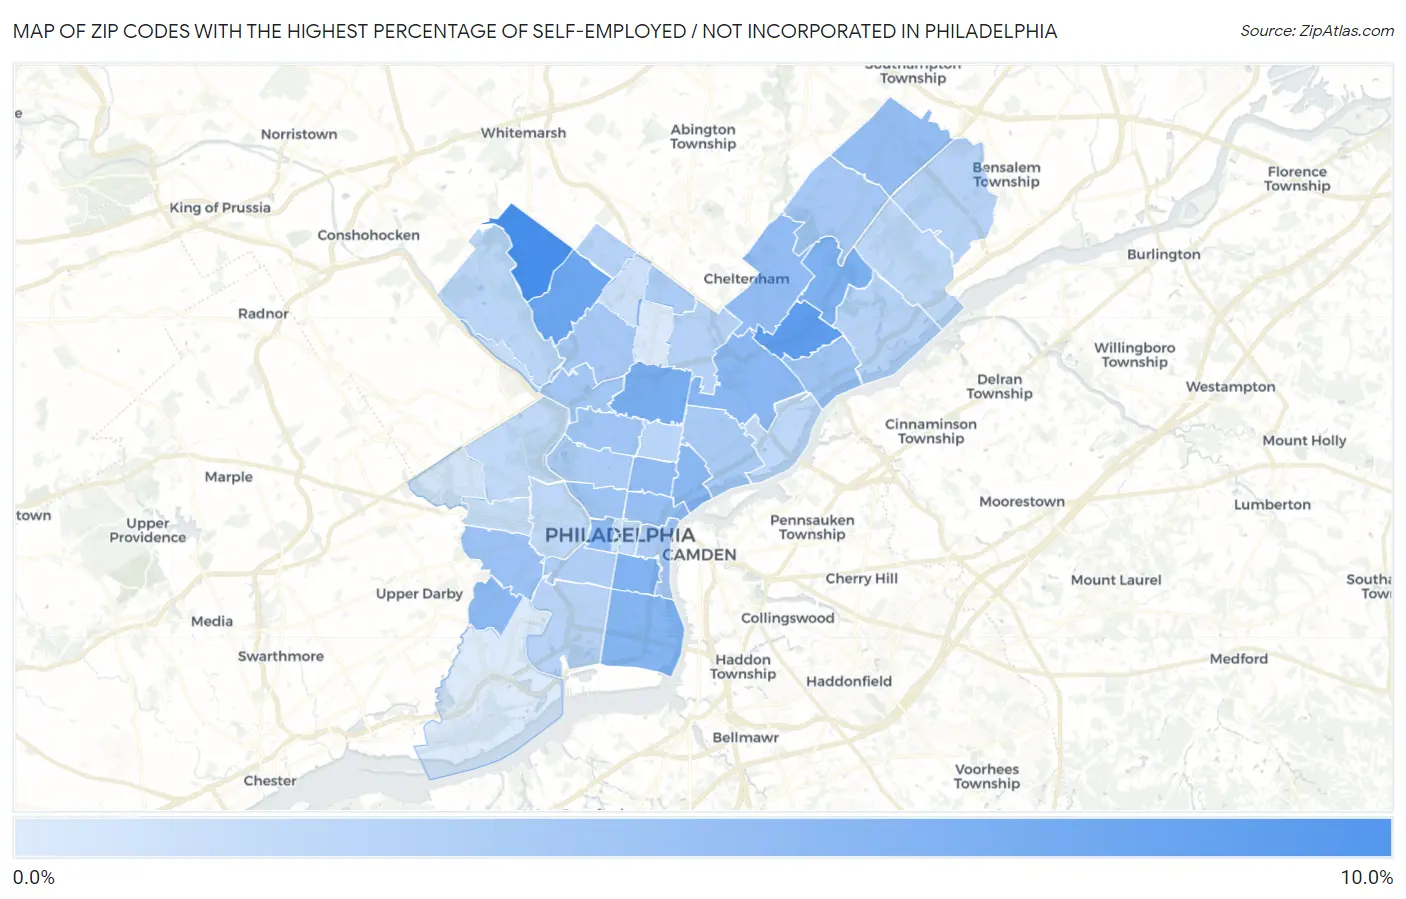
Map of Zip Codes with the Highest Percentage of Self-Employed / Not Incorporated in Philadelphia

0.0%
10.0%
Zip Codes with the Highest Percentage of Self-Employed / Not Incorporated in Philadelphia Map

Zip Codes with the Highest Percentage of Self-Employed / Not Incorporated in Philadelphia, PA

Zip Code % Self-Employed / Not Incorporated vs State vs National
1.191189.1%4.9%(+4.21)#2885.8%(+3.29)#8,618
2.191497.9%4.9%(+2.98)#3795.8%(+2.06)#10,909
3.191197.1%4.9%(+2.25)#4495.8%(+1.33)#12,629
4.191406.6%4.9%(+1.74)#5025.8%(+0.820)#14,023
5.191526.2%4.9%(+1.28)#5795.8%(+0.356)#15,510
6.191476.1%4.9%(+1.20)#5895.8%(+0.275)#15,761
7.191485.9%4.9%(+1.00)#6165.8%(+0.084)#16,386
8.191245.7%4.9%(+0.795)#6545.8%(-0.126)#17,075
9.191255.6%4.9%(+0.702)#6735.8%(-0.219)#17,415
10.191425.5%4.9%(+0.624)#6885.8%(-0.296)#17,707
11.191035.4%4.9%(+0.502)#7105.8%(-0.418)#18,131
12.191115.3%4.9%(+0.437)#7275.8%(-0.483)#18,389
13.191225.3%4.9%(+0.399)#7355.8%(-0.522)#18,545
14.191165.2%4.9%(+0.296)#7615.8%(-0.625)#18,954
15.191234.9%4.9%(+0.032)#8105.8%(-0.888)#19,950
16.191434.8%4.9%(-0.117)#8495.8%(-1.04)#20,505
17.191304.6%4.9%(-0.272)#8865.8%(-1.19)#21,078
18.191354.6%4.9%(-0.294)#8925.8%(-1.21)#21,158
19.191324.5%4.9%(-0.388)#9155.8%(-1.31)#21,548
20.191294.3%4.9%(-0.599)#9765.8%(-1.52)#22,334
21.191154.2%4.9%(-0.670)#9895.8%(-1.59)#22,601
22.191444.2%4.9%(-0.714)#1,0055.8%(-1.63)#22,751
23.191344.1%4.9%(-0.839)#1,0315.8%(-1.76)#23,200
24.191263.9%4.9%(-1.03)#1,0885.8%(-1.96)#23,856
25.191213.9%4.9%(-1.04)#1,0895.8%(-1.96)#23,880
26.191063.8%4.9%(-1.06)#1,0955.8%(-1.98)#23,950
27.191463.8%4.9%(-1.09)#1,1065.8%(-2.01)#24,042
28.191203.5%4.9%(-1.44)#1,1825.8%(-2.36)#25,127
29.191503.4%4.9%(-1.51)#1,2045.8%(-2.43)#25,336
30.191363.4%4.9%(-1.51)#1,2075.8%(-2.43)#25,352
31.191543.4%4.9%(-1.53)#1,2125.8%(-2.45)#25,405
32.191453.3%4.9%(-1.58)#1,2205.8%(-2.50)#25,562
33.191333.2%4.9%(-1.69)#1,2415.8%(-2.61)#25,843
34.191283.2%4.9%(-1.72)#1,2445.8%(-2.64)#25,936
35.191143.1%4.9%(-1.80)#1,2555.8%(-2.72)#26,127
36.191373.0%4.9%(-1.94)#1,2885.8%(-2.86)#26,494
37.191042.9%4.9%(-1.96)#1,2915.8%(-2.88)#26,525
38.191072.9%4.9%(-1.96)#1,2925.8%(-2.88)#26,527
39.191312.9%4.9%(-2.01)#1,3015.8%(-2.93)#26,626
40.191392.7%4.9%(-2.18)#1,3335.8%(-3.10)#27,013
41.191272.5%4.9%(-2.39)#1,3685.8%(-3.31)#27,396
42.191382.3%4.9%(-2.57)#1,3895.8%(-3.49)#27,735
43.191512.1%4.9%(-2.80)#1,4165.8%(-3.72)#28,099
44.191022.0%4.9%(-2.94)#1,4335.8%(-3.86)#28,300
45.191411.5%4.9%(-3.36)#1,4625.8%(-4.28)#28,707
46.191531.5%4.9%(-3.42)#1,4685.8%(-4.34)#28,763

Common Questions

What are the Top 10 Zip Codes with the Highest Percentage of Self-Employed / Not Incorporated in Philadelphia, PA?
Top 10 Zip Codes with the Highest Percentage of Self-Employed / Not Incorporated in Philadelphia, PA are:
#1
9.1%
#2
7.9%
#3
7.1%
#4
6.6%
#5
6.2%
#6
6.1%
#7
5.9%
#8
5.7%
#9
5.6%
#10
5.5%
What zip code has the Highest Percentage of Self-Employed / Not Incorporated in Philadelphia, PA?
19118 has the Highest Percentage of Self-Employed / Not Incorporated in Philadelphia, PA with 9.1%.
What is the Percentage of Self-Employed / Not Incorporated in Philadelphia, PA?
Percentage of Self-Employed / Not Incorporated in Philadelphia is 4.4%.
What is the Percentage of Self-Employed / Not Incorporated in Pennsylvania?
Percentage of Self-Employed / Not Incorporated in Pennsylvania is 4.9%.
What is the Percentage of Self-Employed / Not Incorporated in the United States?
Percentage of Self-Employed / Not Incorporated in the United States is 5.8%.