Zip Codes with the Highest Percentage of Population Employed in Transportation & Warehousing in Pittsburgh, PA

RELATED REPORTS & OPTIONS

Transportation & Warehousing
Population
Families and Households
Female Fertility
Female Fertility (Unmarried)
Race (Community Size)
Race (Percentage)
Ancestry (Community Size)
AfghanAfricanAlbanianAlsatianAmericanApacheArabArgentineanArmenianAustralianAustrianBahamianBarbadianBasqueBelgianBhutaneseBlackfeetBolivianBrazilianBritishBritish West IndianBulgarianBurmeseCajunCambodianCanadianCape VerdeanCarpatho RusynCelticCentral AmericanCentral American IndianCherokeeChickasawChileanChippewaChoctawColombianComancheCosta RicanCreekCroatianCubanCypriotCzechCzechoslovakianDanishDelawareDominicanDutchEastern EuropeanEcuadorianEgyptianEnglishEthiopianEuropeanFilipinoFinnishFrenchFrench American IndianFrench CanadianGermanGhanaianGreekGuamanian / ChamorroGuatemalanGuyaneseHaitianHonduranHungarianIndian (Asian)IndonesianIranianIraqiIrishIroquoisIsraeliItalianJamaicanJapaneseJordanianKenyanKoreanLaotianLatvianLebaneseLiberianLithuanianLumbeeLuxembourgerMacedonianMalaysianMalteseMexicanMexican American IndianMongolianMoroccanNative HawaiianNavajoNew ZealanderNicaraguanNigerianNorthern EuropeanNorwegianPakistaniPalestinianPanamanianParaguayanPennsylvania GermanPeruvianPolishPortuguesePuerto RicanRomanianRussianSalvadoranSamoanScandinavianScotch-IrishScottishSeminoleSerbianSiouxSlavicSlovakSloveneSouth AfricanSouth AmericanSouth American IndianSoviet UnionSpaniardSpanishSri LankanSubsaharan AfricanSudaneseSwedishSwissSyrianThaiTrinidadian and TobagonianTurkishU.S. Virgin IslanderUgandanUkrainianUruguayanVenezuelanVietnameseWelshWest IndianYugoslavian
Ancestry (Percentage)
AfghanAfricanAlbanianAlsatianAmericanApacheArabArgentineanArmenianAustralianAustrianBahamianBarbadianBasqueBelgianBhutaneseBlackfeetBolivianBrazilianBritishBritish West IndianBulgarianBurmeseCajunCambodianCanadianCape VerdeanCarpatho RusynCelticCentral AmericanCentral American IndianCherokeeChickasawChileanChippewaChoctawColombianComancheCosta RicanCreekCroatianCubanCypriotCzechCzechoslovakianDanishDelawareDominicanDutchEastern EuropeanEcuadorianEgyptianEnglishEthiopianEuropeanFilipinoFinnishFrenchFrench American IndianFrench CanadianGermanGhanaianGreekGuamanian / ChamorroGuatemalanGuyaneseHaitianHonduranHungarianIndian (Asian)IndonesianIranianIraqiIrishIroquoisIsraeliItalianJamaicanJapaneseJordanianKenyanKoreanLaotianLatvianLebaneseLiberianLithuanianLumbeeLuxembourgerMacedonianMalaysianMalteseMexicanMexican American IndianMongolianMoroccanNative HawaiianNavajoNew ZealanderNicaraguanNigerianNorthern EuropeanNorwegianPakistaniPalestinianPanamanianParaguayanPennsylvania GermanPeruvianPolishPortuguesePuerto RicanRomanianRussianSalvadoranSamoanScandinavianScotch-IrishScottishSeminoleSerbianSiouxSlavicSlovakSloveneSouth AfricanSouth AmericanSouth American IndianSoviet UnionSpaniardSpanishSri LankanSubsaharan AfricanSudaneseSwedishSwissSyrianThaiTrinidadian and TobagonianTurkishU.S. Virgin IslanderUgandanUkrainianUruguayanVenezuelanVietnameseWelshWest IndianYugoslavian
Immigrant Origin (Total)
AfghanistanAfricaAlbaniaArgentinaAsiaAustraliaAustriaBahamasBangladeshBelarusBelgiumBoliviaBosnia and HerzegovinaBrazilBulgariaBurma / MyanmarCambodiaCameroonCanadaCaribbeanCentral AmericaChileChinaColombiaCongoCosta RicaCroatiaCubaCzechoslovakiaDenmarkDominican RepublicEastern AfricaEastern AsiaEastern EuropeEcuadorEgyptEl SalvadorEnglandEritreaEthiopiaEuropeFranceGermanyGhanaGreeceGuatemalaGuyanaHaitiHondurasHong KongHungaryIndiaIndonesiaIranIraqIrelandIsraelItalyJamaicaJapanJordanKazakhstanKenyaKoreaKuwaitLatin AmericaLatviaLebanonLiberiaLithuaniaMalaysiaMexicoMiddle AfricaMoldovaMoroccoNepalNetherlandsNigeriaNorthern AfricaNorthern EuropeNorwayOceaniaPakistanPanamaPeruPhilippinesPolandPortugalRomaniaRussiaSaudi ArabiaScotlandSerbiaSingaporeSouth AfricaSouth AmericaSouth Central AsiaSouth Eastern AsiaSouthern EuropeSpainSri LankaSudanSwedenSwitzerlandSyriaTaiwanThailandTrinidad and TobagoTurkeyUgandaUkraineUzbekistanVenezuelaVietnamWestern AfricaWestern AsiaWestern EuropeZaire
Immigrant Origin (Percentage)
AfghanistanAfricaAlbaniaArgentinaAsiaAustraliaAustriaBahamasBangladeshBelarusBelgiumBoliviaBosnia and HerzegovinaBrazilBulgariaBurma / MyanmarCambodiaCameroonCanadaCaribbeanCentral AmericaChileChinaColombiaCongoCosta RicaCroatiaCubaCzechoslovakiaDenmarkDominican RepublicEastern AfricaEastern AsiaEastern EuropeEcuadorEgyptEl SalvadorEnglandEritreaEthiopiaEuropeFranceGermanyGhanaGreeceGuatemalaGuyanaHaitiHondurasHong KongHungaryIndiaIndonesiaIranIraqIrelandIsraelItalyJamaicaJapanJordanKazakhstanKenyaKoreaKuwaitLatin AmericaLatviaLebanonLiberiaLithuaniaMalaysiaMexicoMiddle AfricaMoldovaMoroccoNepalNetherlandsNigeriaNorthern AfricaNorthern EuropeNorwayOceaniaPakistanPanamaPeruPhilippinesPolandPortugalRomaniaRussiaSaudi ArabiaScotlandSerbiaSingaporeSouth AfricaSouth AmericaSouth Central AsiaSouth Eastern AsiaSouthern EuropeSpainSri LankaSudanSwedenSwitzerlandSyriaTaiwanThailandTrinidad and TobagoTurkeyUgandaUkraineUzbekistanVenezuelaVietnamWestern AfricaWestern AsiaWestern EuropeZaire
Income
Income (Families)
Income (Households)
Poverty
Poverty (Families)
Unemployment
Employment Occupations
Employment Industries
Employer Class
Commute Time
Commute Means
School Enrollment
Education by Degree Field
Occupancy
Finances
Physical Characteristics
Pittsburgh
Compare Zip Codes
Comparison Subject

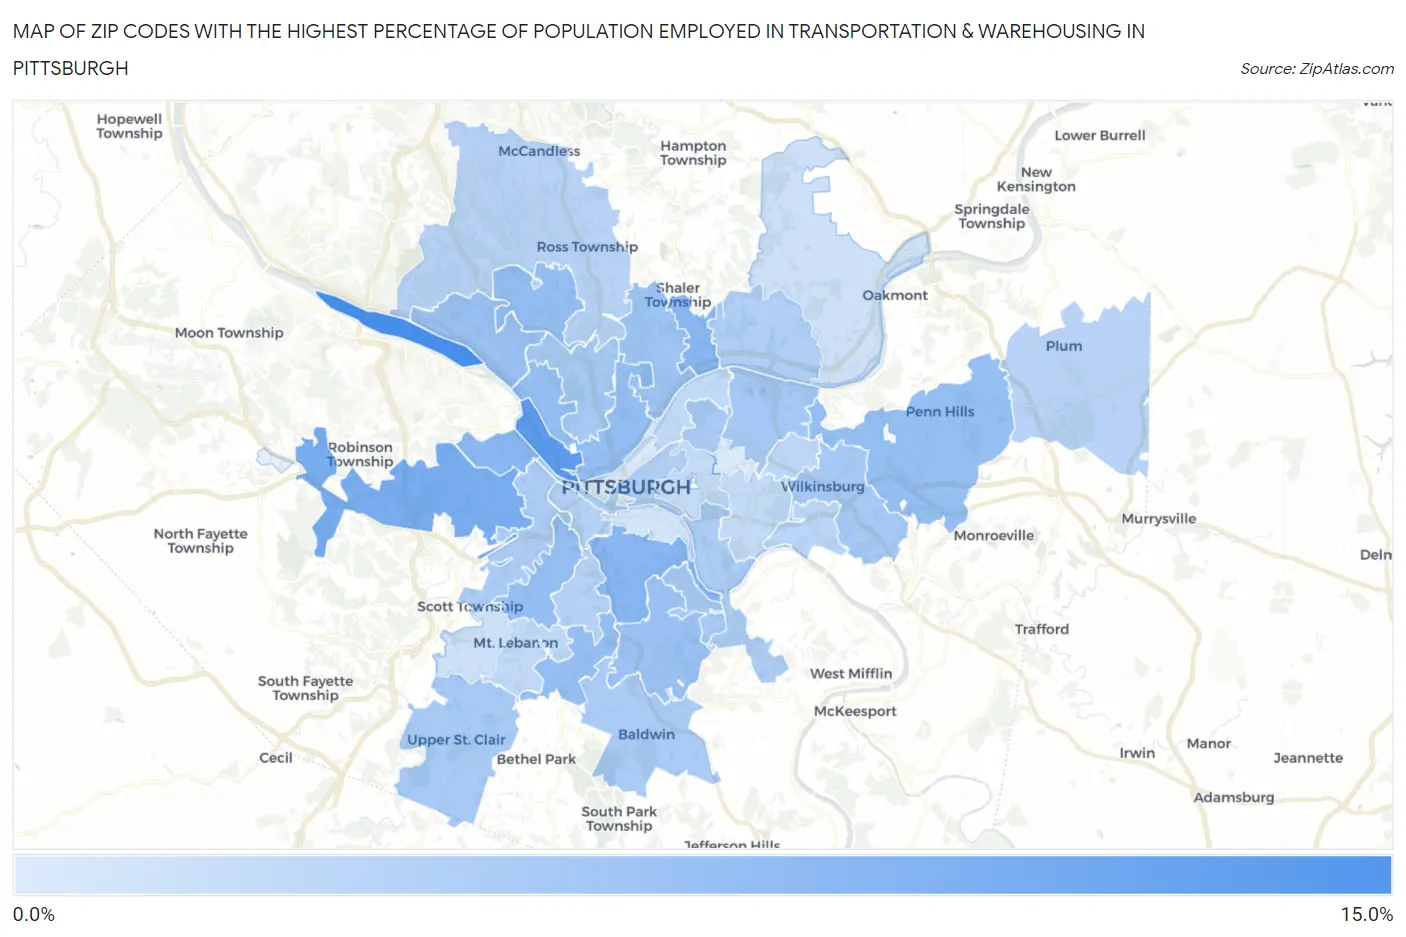
Map of Zip Codes with the Highest Percentage of Population Employed in Transportation & Warehousing in Pittsburgh

0.0%
15.0%
Zip Codes with the Highest Percentage of Population Employed in Transportation & Warehousing in Pittsburgh Map

Zip Codes with the Highest Percentage of Population Employed in Transportation & Warehousing in Pittsburgh, PA

Zip Code % Employed vs State vs National
1.1522511.2%5.0%(+6.21)#1394.9%(+6.25)#2,233
2.152339.5%5.0%(+4.53)#2124.9%(+4.58)#3,213
3.152057.3%5.0%(+2.35)#4064.9%(+2.39)#5,932
4.152106.4%5.0%(+1.43)#5354.9%(+1.48)#7,748
5.152046.3%5.0%(+1.27)#5634.9%(+1.31)#8,142
6.152236.2%5.0%(+1.18)#5754.9%(+1.23)#8,349
7.152295.4%5.0%(+0.452)#7064.9%(+0.497)#10,415
8.152345.4%5.0%(+0.422)#7144.9%(+0.467)#10,527
9.152355.4%5.0%(+0.389)#7254.9%(+0.434)#10,644
10.152165.4%5.0%(+0.387)#7274.9%(+0.432)#10,649
11.152125.3%5.0%(+0.340)#7374.9%(+0.385)#10,812
12.152275.1%5.0%(+0.087)#7814.9%(+0.132)#11,695
13.152024.9%5.0%(-0.089)#8074.9%(-0.044)#12,264
14.152094.7%5.0%(-0.257)#8494.9%(-0.212)#12,896
15.152214.3%5.0%(-0.708)#9364.9%(-0.663)#14,672
16.152064.3%5.0%(-0.726)#9404.9%(-0.681)#14,739
17.152414.0%5.0%(-0.959)#9864.9%(-0.914)#15,756
18.152144.0%5.0%(-1.01)#1,0024.9%(-0.960)#15,970
19.152243.9%5.0%(-1.05)#1,0104.9%(-1.00)#16,161
20.152363.8%5.0%(-1.17)#1,0464.9%(-1.12)#16,692
21.152203.8%5.0%(-1.20)#1,0534.9%(-1.16)#16,838
22.152073.7%5.0%(-1.33)#1,0794.9%(-1.28)#17,370
23.152193.6%5.0%(-1.36)#1,0854.9%(-1.31)#17,519
24.152153.4%5.0%(-1.55)#1,1294.9%(-1.50)#18,318
25.152113.3%5.0%(-1.72)#1,1694.9%(-1.68)#19,034
26.152263.1%5.0%(-1.87)#1,2014.9%(-1.83)#19,713
27.152393.0%5.0%(-2.01)#1,2254.9%(-1.96)#20,312
28.152372.9%5.0%(-2.11)#1,2474.9%(-2.06)#20,770
29.152182.7%5.0%(-2.32)#1,2824.9%(-2.27)#21,645
30.152082.7%5.0%(-2.32)#1,2874.9%(-2.28)#21,677
31.152282.3%5.0%(-2.72)#1,3464.9%(-2.68)#23,300
32.152012.2%5.0%(-2.77)#1,3494.9%(-2.72)#23,457
33.152172.2%5.0%(-2.84)#1,3594.9%(-2.80)#23,747
34.152131.9%5.0%(-3.13)#1,4054.9%(-3.08)#24,720
35.152431.3%5.0%(-3.66)#1,4634.9%(-3.61)#26,292
36.152381.3%5.0%(-3.73)#1,4694.9%(-3.68)#26,449
37.152031.0%5.0%(-3.94)#1,4924.9%(-3.90)#26,909
38.152220.56%5.0%(-4.43)#1,5154.9%(-4.38)#27,735
39.152820.49%5.0%(-4.51)#1,5184.9%(-4.46)#27,841
40.152320.35%5.0%(-4.64)#1,5194.9%(-4.60)#27,951

Common Questions

What are the Top 10 Zip Codes with the Highest Percentage of Population Employed in Transportation & Warehousing in Pittsburgh, PA?
Top 10 Zip Codes with the Highest Percentage of Population Employed in Transportation & Warehousing in Pittsburgh, PA are:
#1
11.2%
#2
9.5%
#3
7.3%
#4
6.4%
#5
6.3%
#6
6.2%
#7
5.4%
#8
5.4%
#9
5.4%
#10
5.4%
What zip code has the Highest Percentage of Population Employed in Transportation & Warehousing in Pittsburgh, PA?
15225 has the Highest Percentage of Population Employed in Transportation & Warehousing in Pittsburgh, PA with 11.2%.
What is the Percentage of Population Employed in Transportation & Warehousing in Pittsburgh, PA?
Percentage of Population Employed in Transportation & Warehousing in Pittsburgh is 3.6%.
What is the Percentage of Population Employed in Transportation & Warehousing in Pennsylvania?
Percentage of Population Employed in Transportation & Warehousing in Pennsylvania is 5.0%.
What is the Percentage of Population Employed in Transportation & Warehousing in the United States?
Percentage of Population Employed in Transportation & Warehousing in the United States is 4.9%.