Zip Codes with the Highest Percentage of Population Employed in Transportation & Warehousing in Delaware
RELATED REPORTS & OPTIONS
Transportation & Warehousing
Delaware
Compare Zip Codes
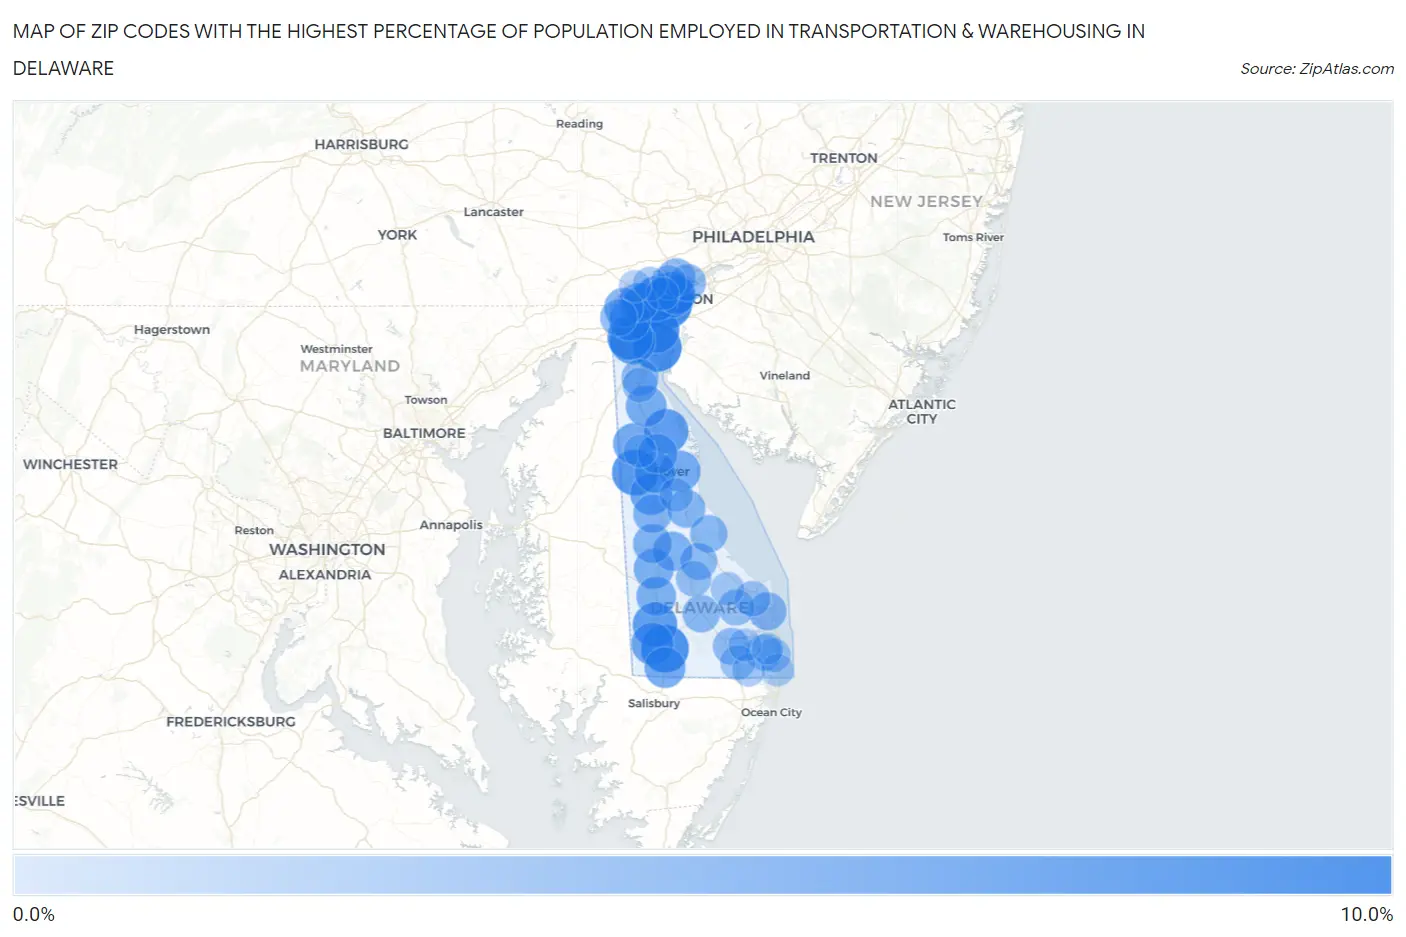
Map of Zip Codes with the Highest Percentage of Population Employed in Transportation & Warehousing in Delaware
0.0%
10.0%
Zip Codes with the Highest Percentage of Population Employed in Transportation & Warehousing in Delaware
| Zip Code | % Employed | vs State | vs National | |
| 1. | 19801 | 9.5% | 5.2%(+4.35)#1 | 4.9%(+4.56)#3,228 |
| 2. | 19706 | 8.9% | 5.2%(+3.74)#2 | 4.9%(+3.95)#3,809 |
| 3. | 19956 | 8.6% | 5.2%(+3.42)#3 | 4.9%(+3.63)#4,183 |
| 4. | 19804 | 8.2% | 5.2%(+3.04)#4 | 4.9%(+3.24)#4,644 |
| 5. | 19720 | 7.9% | 5.2%(+2.79)#5 | 4.9%(+2.99)#4,980 |
| 6. | 19953 | 7.8% | 5.2%(+2.61)#6 | 4.9%(+2.82)#5,236 |
| 7. | 19802 | 7.7% | 5.2%(+2.53)#7 | 4.9%(+2.74)#5,353 |
| 8. | 19701 | 7.6% | 5.2%(+2.46)#8 | 4.9%(+2.67)#5,473 |
| 9. | 19702 | 7.4% | 5.2%(+2.22)#9 | 4.9%(+2.43)#5,861 |
| 10. | 19805 | 7.2% | 5.2%(+2.03)#10 | 4.9%(+2.24)#6,209 |
| 11. | 19973 | 7.0% | 5.2%(+1.86)#11 | 4.9%(+2.07)#6,522 |
| 12. | 19977 | 7.0% | 5.2%(+1.83)#12 | 4.9%(+2.04)#6,588 |
| 13. | 19931 | 5.9% | 5.2%(+0.728)#13 | 4.9%(+0.936)#9,089 |
| 14. | 19934 | 5.8% | 5.2%(+0.667)#14 | 4.9%(+0.875)#9,283 |
| 15. | 19713 | 5.6% | 5.2%(+0.405)#15 | 4.9%(+0.613)#10,069 |
| 16. | 19938 | 5.4% | 5.2%(+0.250)#16 | 4.9%(+0.458)#10,554 |
| 17. | 19901 | 5.4% | 5.2%(+0.196)#17 | 4.9%(+0.404)#10,745 |
| 18. | 19940 | 5.2% | 5.2%(+0.079)#18 | 4.9%(+0.287)#11,125 |
| 19. | 19734 | 5.2% | 5.2%(+0.042)#19 | 4.9%(+0.250)#11,250 |
| 20. | 19904 | 5.2% | 5.2%(+0.036)#20 | 4.9%(+0.244)#11,273 |
| 21. | 19950 | 4.8% | 5.2%(-0.327)#21 | 4.9%(-0.119)#12,518 |
| 22. | 19936 | 4.7% | 5.2%(-0.482)#22 | 4.9%(-0.273)#13,131 |
| 23. | 19933 | 4.6% | 5.2%(-0.524)#23 | 4.9%(-0.316)#13,280 |
| 24. | 19808 | 4.5% | 5.2%(-0.685)#24 | 4.9%(-0.477)#13,905 |
| 25. | 19711 | 4.4% | 5.2%(-0.765)#25 | 4.9%(-0.557)#14,221 |
| 26. | 19954 | 4.4% | 5.2%(-0.789)#26 | 4.9%(-0.581)#14,313 |
| 27. | 19952 | 4.3% | 5.2%(-0.855)#27 | 4.9%(-0.646)#14,600 |
| 28. | 19809 | 4.3% | 5.2%(-0.884)#28 | 4.9%(-0.676)#14,715 |
| 29. | 19943 | 4.1% | 5.2%(-1.03)#29 | 4.9%(-0.824)#15,372 |
| 30. | 19946 | 3.9% | 5.2%(-1.23)#30 | 4.9%(-1.02)#16,249 |
| 31. | 19810 | 3.9% | 5.2%(-1.26)#31 | 4.9%(-1.05)#16,382 |
| 32. | 19971 | 3.7% | 5.2%(-1.41)#32 | 4.9%(-1.20)#17,034 |
| 33. | 19947 | 3.5% | 5.2%(-1.63)#33 | 4.9%(-1.42)#17,968 |
| 34. | 19963 | 3.5% | 5.2%(-1.66)#34 | 4.9%(-1.45)#18,097 |
| 35. | 19960 | 3.4% | 5.2%(-1.71)#35 | 4.9%(-1.50)#18,313 |
| 36. | 19717 | 3.4% | 5.2%(-1.79)#36 | 4.9%(-1.58)#18,642 |
| 37. | 19703 | 3.4% | 5.2%(-1.79)#37 | 4.9%(-1.58)#18,649 |
| 38. | 19709 | 3.3% | 5.2%(-1.81)#38 | 4.9%(-1.61)#18,753 |
| 39. | 19966 | 3.2% | 5.2%(-1.95)#39 | 4.9%(-1.74)#19,364 |
| 40. | 19967 | 3.0% | 5.2%(-2.20)#40 | 4.9%(-1.99)#20,443 |
| 41. | 19951 | 2.9% | 5.2%(-2.27)#41 | 4.9%(-2.06)#20,751 |
| 42. | 19958 | 2.7% | 5.2%(-2.50)#42 | 4.9%(-2.29)#21,751 |
| 43. | 19941 | 2.6% | 5.2%(-2.53)#43 | 4.9%(-2.33)#21,889 |
| 44. | 19803 | 2.3% | 5.2%(-2.81)#44 | 4.9%(-2.60)#23,040 |
| 45. | 19730 | 2.3% | 5.2%(-2.86)#45 | 4.9%(-2.66)#23,226 |
| 46. | 19945 | 2.2% | 5.2%(-2.91)#46 | 4.9%(-2.70)#23,389 |
| 47. | 19930 | 1.9% | 5.2%(-3.28)#47 | 4.9%(-3.07)#24,682 |
| 48. | 19807 | 1.7% | 5.2%(-3.44)#48 | 4.9%(-3.23)#25,218 |
| 49. | 19968 | 1.6% | 5.2%(-3.51)#49 | 4.9%(-3.30)#25,427 |
| 50. | 19962 | 1.6% | 5.2%(-3.52)#50 | 4.9%(-3.31)#25,474 |
| 51. | 19806 | 1.4% | 5.2%(-3.71)#51 | 4.9%(-3.50)#25,985 |
| 52. | 19975 | 1.4% | 5.2%(-3.73)#52 | 4.9%(-3.52)#26,043 |
| 53. | 19955 | 1.4% | 5.2%(-3.78)#53 | 4.9%(-3.58)#26,196 |
| 54. | 19939 | 1.4% | 5.2%(-3.80)#54 | 4.9%(-3.59)#26,243 |
| 55. | 19944 | 1.2% | 5.2%(-3.94)#55 | 4.9%(-3.73)#26,550 |
| 56. | 19707 | 1.0% | 5.2%(-4.13)#56 | 4.9%(-3.92)#26,958 |
| 57. | 19970 | 0.78% | 5.2%(-4.38)#57 | 4.9%(-4.17)#27,411 |
1
Common Questions
What are the Top 10 Zip Codes with the Highest Percentage of Population Employed in Transportation & Warehousing in Delaware?
Top 10 Zip Codes with the Highest Percentage of Population Employed in Transportation & Warehousing in Delaware are:
What zip code has the Highest Percentage of Population Employed in Transportation & Warehousing in Delaware?
19801 has the Highest Percentage of Population Employed in Transportation & Warehousing in Delaware with 9.5%.
What is the Percentage of Population Employed in Transportation & Warehousing in the State of Delaware?
Percentage of Population Employed in Transportation & Warehousing in Delaware is 5.2%.
What is the Percentage of Population Employed in Transportation & Warehousing in the United States?
Percentage of Population Employed in Transportation & Warehousing in the United States is 4.9%.