Zip Codes with the Lowest Poverty Level Among Children Under the Age of 5 in Philadelphia, PA

RELATED REPORTS & OPTIONS

Lowest Poverty | Child 0-5
Population
Families and Households
Female Fertility
Female Fertility (Unmarried)
Race (Community Size)
Race (Percentage)
Ancestry (Community Size)
AfghanAfricanAlaska NativeAlaskan AthabascanAlbanianAmericanApacheArabArgentineanArmenianAustralianAustrianBahamianBangladeshiBarbadianBasqueBelgianBelizeanBermudanBhutaneseBlackfeetBolivianBrazilianBritishBritish West IndianBulgarianBurmeseCajunCambodianCanadianCape VerdeanCarpatho RusynCelticCentral AmericanCentral American IndianCherokeeChickasawChileanChippewaChoctawColombianCosta RicanCreekCroatianCubanCypriotCzechCzechoslovakianDanishDelawareDominicanDutchEastern EuropeanEcuadorianEgyptianEnglishEstonianEthiopianEuropeanFilipinoFinnishFrenchFrench American IndianFrench CanadianGermanGerman RussianGhanaianGreekGuamanian / ChamorroGuatemalanGuyaneseHaitianHonduranHungarianIcelanderIndian (Asian)IndonesianInupiatIranianIraqiIrishIroquoisIsraeliItalianJamaicanJapaneseJordanianKenyanKoreanLaotianLatvianLebaneseLiberianLithuanianLumbeeMacedonianMalaysianMexicanMexican American IndianMongolianMoroccanNative HawaiianNavajoNew ZealanderNicaraguanNigerianNorthern EuropeanNorwegianOkinawanPakistaniPalestinianPanamanianParaguayanPennsylvania GermanPeruvianPolishPortuguesePotawatomiPuerto RicanRomanianRussianSalvadoranSamoanScandinavianScotch-IrishScottishSeminoleSenegaleseSerbianShoshoneSierra LeoneanSiouxSlavicSlovakSloveneSomaliSouth AfricanSouth AmericanSouth American IndianSpaniardSpanishSpanish AmericanSri LankanSubsaharan AfricanSudaneseSwedishSwissSyrianThaiTrinidadian and TobagonianTurkishU.S. Virgin IslanderUgandanUkrainianUruguayanVenezuelanVietnameseWelshWest IndianYugoslavian
Ancestry (Percentage)
AfghanAfricanAlaska NativeAlaskan AthabascanAlbanianAmericanApacheArabArgentineanArmenianAustralianAustrianBahamianBangladeshiBarbadianBasqueBelgianBelizeanBermudanBhutaneseBlackfeetBolivianBrazilianBritishBritish West IndianBulgarianBurmeseCajunCambodianCanadianCape VerdeanCarpatho RusynCelticCentral AmericanCentral American IndianCherokeeChickasawChileanChippewaChoctawColombianCosta RicanCreekCroatianCubanCypriotCzechCzechoslovakianDanishDelawareDominicanDutchEastern EuropeanEcuadorianEgyptianEnglishEstonianEthiopianEuropeanFilipinoFinnishFrenchFrench American IndianFrench CanadianGermanGerman RussianGhanaianGreekGuamanian / ChamorroGuatemalanGuyaneseHaitianHonduranHungarianIcelanderIndian (Asian)IndonesianInupiatIranianIraqiIrishIroquoisIsraeliItalianJamaicanJapaneseJordanianKenyanKoreanLaotianLatvianLebaneseLiberianLithuanianLumbeeMacedonianMalaysianMexicanMexican American IndianMongolianMoroccanNative HawaiianNavajoNew ZealanderNicaraguanNigerianNorthern EuropeanNorwegianOkinawanPakistaniPalestinianPanamanianParaguayanPennsylvania GermanPeruvianPolishPortuguesePotawatomiPuerto RicanRomanianRussianSalvadoranSamoanScandinavianScotch-IrishScottishSeminoleSenegaleseSerbianShoshoneSierra LeoneanSiouxSlavicSlovakSloveneSomaliSouth AfricanSouth AmericanSouth American IndianSpaniardSpanishSpanish AmericanSri LankanSubsaharan AfricanSudaneseSwedishSwissSyrianThaiTrinidadian and TobagonianTurkishU.S. Virgin IslanderUgandanUkrainianUruguayanVenezuelanVietnameseWelshWest IndianYugoslavian
Immigrant Origin (Total)
AfghanistanAfricaAlbaniaArgentinaArmeniaAsiaAustraliaAustriaBangladeshBarbadosBelarusBelgiumBelizeBoliviaBosnia and HerzegovinaBrazilBulgariaBurma / MyanmarCambodiaCameroonCanadaCaribbeanCentral AmericaChileChinaColombiaCongoCosta RicaCroatiaCubaCzechoslovakiaDenmarkDominicaDominican RepublicEastern AfricaEastern AsiaEastern EuropeEcuadorEgyptEl SalvadorEnglandEritreaEthiopiaEuropeFranceGermanyGhanaGreeceGrenadaGuatemalaGuyanaHaitiHondurasHong KongHungaryIndiaIndonesiaIranIraqIrelandIsraelItalyJamaicaJapanJordanKazakhstanKenyaKoreaKuwaitLaosLatin AmericaLatviaLebanonLiberiaLithuaniaMalaysiaMexicoMiddle AfricaMoldovaMoroccoNepalNetherlandsNicaraguaNigeriaNorth MacedoniaNorthern AfricaNorthern EuropeNorwayOceaniaPakistanPanamaPeruPhilippinesPolandPortugalRomaniaRussiaSaudi ArabiaScotlandSenegalSerbiaSierra LeoneSingaporeSouth AfricaSouth AmericaSouth Central AsiaSouth Eastern AsiaSouthern EuropeSpainSri LankaSt. Vincent and the GrenadinesSudanSwedenSwitzerlandSyriaTaiwanThailandTrinidad and TobagoTurkeyUkraineUruguayUzbekistanVenezuelaVietnamWest IndiesWestern AfricaWestern AsiaWestern EuropeZaireZimbabwe
Immigrant Origin (Percentage)
AfghanistanAfricaAlbaniaArgentinaArmeniaAsiaAustraliaAustriaBangladeshBarbadosBelarusBelgiumBelizeBoliviaBosnia and HerzegovinaBrazilBulgariaBurma / MyanmarCambodiaCameroonCanadaCaribbeanCentral AmericaChileChinaColombiaCongoCosta RicaCroatiaCubaCzechoslovakiaDenmarkDominicaDominican RepublicEastern AfricaEastern AsiaEastern EuropeEcuadorEgyptEl SalvadorEnglandEritreaEthiopiaEuropeFranceGermanyGhanaGreeceGrenadaGuatemalaGuyanaHaitiHondurasHong KongHungaryIndiaIndonesiaIranIraqIrelandIsraelItalyJamaicaJapanJordanKazakhstanKenyaKoreaKuwaitLaosLatin AmericaLatviaLebanonLiberiaLithuaniaMalaysiaMexicoMiddle AfricaMoldovaMoroccoNepalNetherlandsNicaraguaNigeriaNorth MacedoniaNorthern AfricaNorthern EuropeNorwayOceaniaPakistanPanamaPeruPhilippinesPolandPortugalRomaniaRussiaSaudi ArabiaScotlandSenegalSerbiaSierra LeoneSingaporeSouth AfricaSouth AmericaSouth Central AsiaSouth Eastern AsiaSouthern EuropeSpainSri LankaSt. Vincent and the GrenadinesSudanSwedenSwitzerlandSyriaTaiwanThailandTrinidad and TobagoTurkeyUkraineUruguayUzbekistanVenezuelaVietnamWest IndiesWestern AfricaWestern AsiaWestern EuropeZaireZimbabwe
Income
Income (Families)
Income (Households)
Poverty
Poverty (Families)
Unemployment
Employment Occupations
Employment Industries
Employer Class
Commute Time
Commute Means
School Enrollment
Education by Degree Field
Occupancy
Finances
Physical Characteristics
Philadelphia
Compare Zip Codes
Comparison Subject

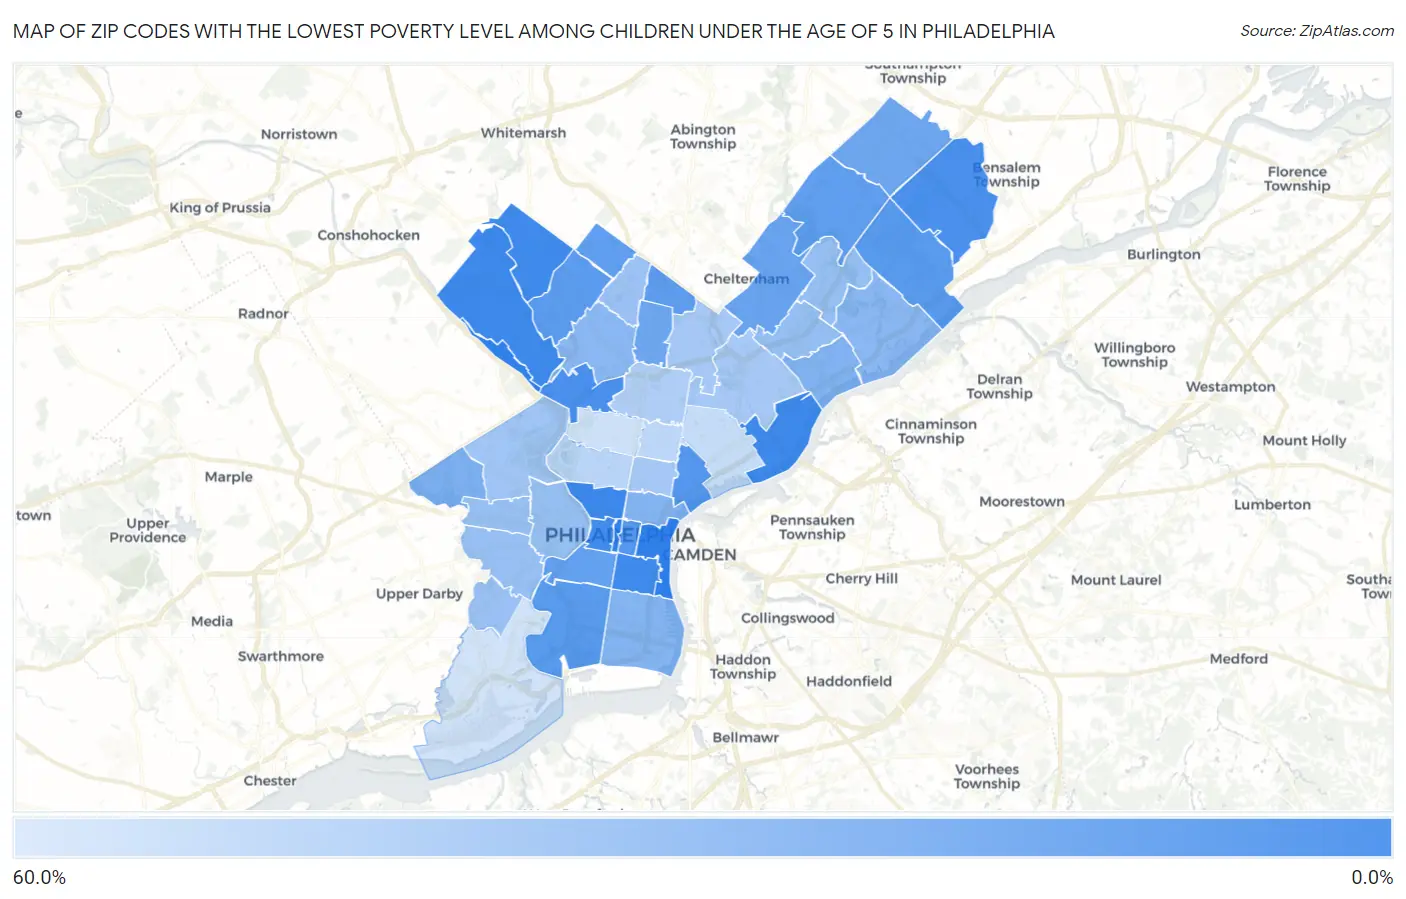
Map of Zip Codes with the Lowest Poverty Level Among Children Under the Age of 5 in Philadelphia

60.0%
0.0%
Zip Codes with the Lowest Poverty Level Among Children Under the Age of 5 in Philadelphia Map

Zip Codes with the Lowest Poverty Level Among Children Under the Age of 5 in Philadelphia, PA

Zip Code Child Poverty vs State vs National
1.191301.7%17.3%(-15.5)#4418.1%(-16.3)#659
2.191282.2%17.3%(-15.1)#5918.1%(-15.9)#939
3.191372.7%17.3%(-14.6)#9218.1%(-15.4)#1,304
4.191182.9%17.3%(-14.3)#10218.1%(-15.1)#1,451
5.191472.9%17.3%(-14.3)#10318.1%(-15.1)#1,455
6.191033.7%17.3%(-13.6)#12318.1%(-14.4)#1,944
7.191545.7%17.3%(-11.5)#20318.1%(-12.4)#3,397
8.191295.8%17.3%(-11.4)#20918.1%(-12.2)#3,463
9.191079.5%17.3%(-7.74)#34018.1%(-8.54)#5,957
10.191259.7%17.3%(-7.56)#34918.1%(-8.36)#6,078
11.1914511.0%17.3%(-6.25)#38418.1%(-7.05)#6,850
12.1911411.2%17.3%(-6.03)#39518.1%(-6.83)#6,995
13.1911912.1%17.3%(-5.17)#41918.1%(-5.97)#7,520
14.1912612.3%17.3%(-4.96)#42718.1%(-5.77)#7,631
15.1915013.4%17.3%(-3.89)#46418.1%(-4.69)#8,276
16.1911513.7%17.3%(-3.53)#47218.1%(-4.33)#8,474
17.1914614.2%17.3%(-3.07)#48418.1%(-3.87)#8,736
18.1911115.5%17.3%(-1.76)#52418.1%(-2.56)#9,503
19.1914118.1%17.3%(+0.829)#59918.1%(+0.027)#10,748
20.1911618.2%17.3%(+0.971)#60318.1%(+0.170)#10,835
21.1915123.9%17.3%(+6.65)#70618.1%(+5.84)#13,281
22.1913524.9%17.3%(+7.64)#72618.1%(+6.84)#13,610
23.1912325.3%17.3%(+8.04)#73518.1%(+7.24)#13,789
24.1914825.9%17.3%(+8.65)#74818.1%(+7.85)#14,001
25.1913627.8%17.3%(+10.5)#77318.1%(+9.69)#14,624
26.1914428.5%17.3%(+11.2)#78318.1%(+10.4)#14,856
27.1915232.3%17.3%(+15.1)#83918.1%(+14.3)#15,913
28.1914932.4%17.3%(+15.1)#84118.1%(+14.3)#15,931
29.1910432.8%17.3%(+15.5)#84818.1%(+14.7)#16,027
30.1914333.1%17.3%(+15.9)#85518.1%(+15.1)#16,109
31.1913933.3%17.3%(+16.1)#85718.1%(+15.3)#16,138
32.1914234.7%17.3%(+17.5)#88018.1%(+16.7)#16,536
33.1913835.5%17.3%(+18.3)#88918.1%(+17.5)#16,728
34.1913137.3%17.3%(+20.0)#91118.1%(+19.2)#17,130
35.1912039.3%17.3%(+22.0)#92718.1%(+21.2)#17,510
36.1912439.3%17.3%(+22.0)#92818.1%(+21.2)#17,514
37.1912239.3%17.3%(+22.1)#92918.1%(+21.3)#17,526
38.1914043.3%17.3%(+26.0)#96218.1%(+25.2)#18,229
39.1912147.7%17.3%(+30.4)#99018.1%(+29.6)#18,828
40.1913348.3%17.3%(+31.1)#99218.1%(+30.3)#18,893
41.1913452.6%17.3%(+35.3)#1,00818.1%(+34.5)#19,382
42.1913257.5%17.3%(+40.2)#1,02118.1%(+39.4)#19,806
43.1915358.2%17.3%(+40.9)#1,02418.1%(+40.1)#19,858

Common Questions

What are the Top 10 Zip Codes with the Lowest Poverty Level Among Children Under the Age of 5 in Philadelphia, PA?
Top 10 Zip Codes with the Lowest Poverty Level Among Children Under the Age of 5 in Philadelphia, PA are:
#1
0.0%
#2
0.0%
#3
0.0%
#4
1.7%
#5
2.2%
#6
2.7%
#7
2.9%
#8
2.9%
#9
3.7%
#10
5.7%
What zip code has the Lowest Poverty Level Among Children Under the Age of 5 in Philadelphia, PA?
19130 has the Lowest Poverty Level Among Children Under the Age of 5 in Philadelphia, PA with 1.7%.
What is the Poverty Level Among Children Under the Age of 5 in Philadelphia, PA?
Poverty Level Among Children Under the Age of 5 in Philadelphia is 27.6%.
What is the Poverty Level Among Children Under the Age of 5 in Pennsylvania?
Poverty Level Among Children Under the Age of 5 in Pennsylvania is 17.3%.
What is the Poverty Level Among Children Under the Age of 5 in the United States?
Poverty Level Among Children Under the Age of 5 in the United States is 18.1%.