Zip Codes with the Highest Percentage of Population Employed in Legal Services & Support in Levittown, PA
RELATED REPORTS & OPTIONS
Legal Services & Support
Levittown
Compare Zip Codes
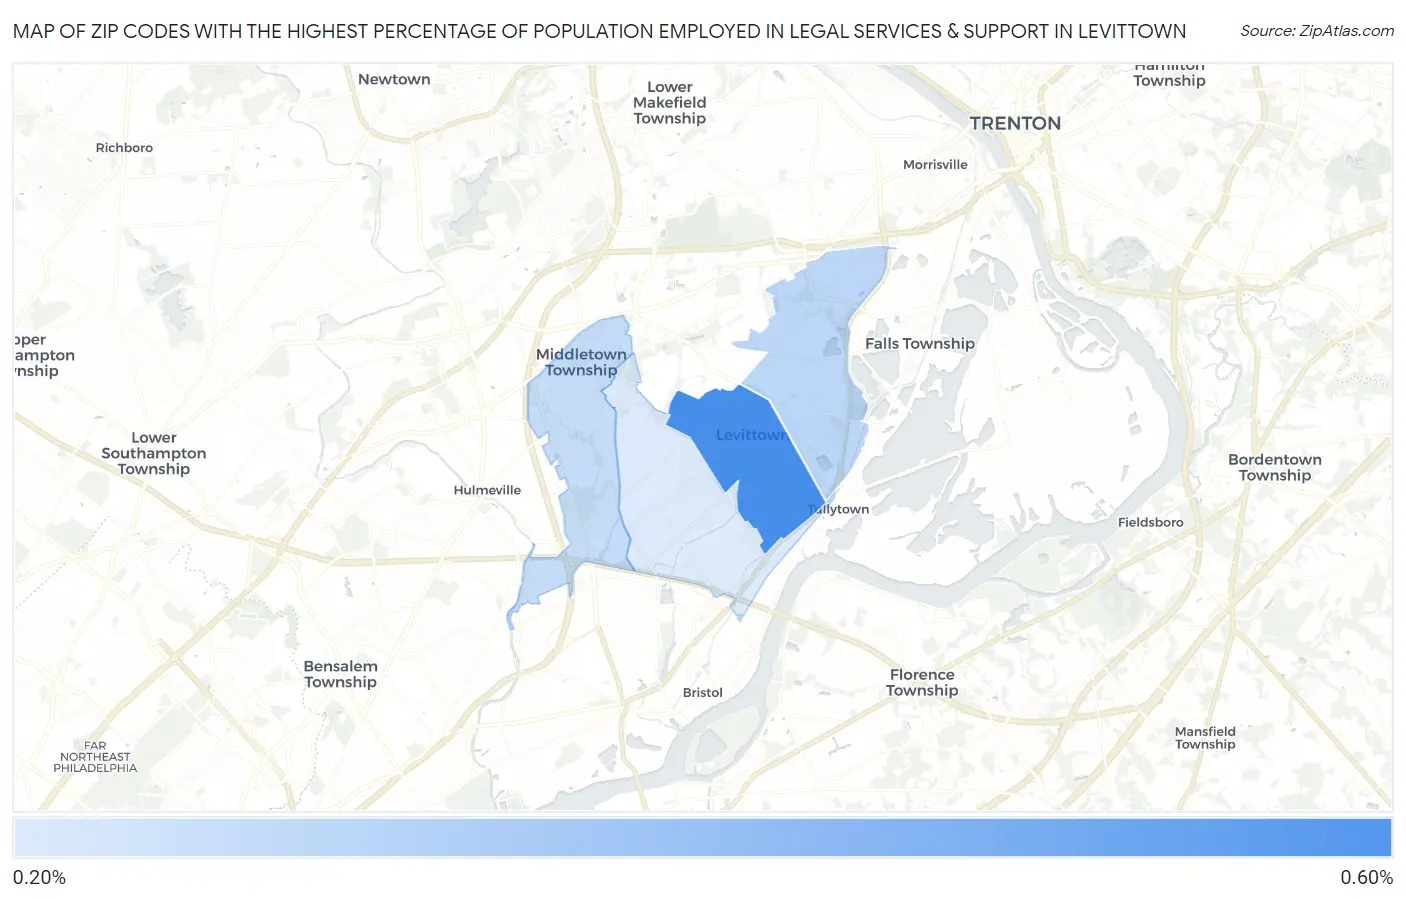
Map of Zip Codes with the Highest Percentage of Population Employed in Legal Services & Support in Levittown
0.29%
0.56%
Zip Codes with the Highest Percentage of Population Employed in Legal Services & Support in Levittown, PA
| Zip Code | % Employed | vs State | vs National | |
| 1. | 19055 | 0.56% | 1.1%(-0.584)#580 | 1.2%(-0.621)#11,908 |
| 2. | 19054 | 0.35% | 1.1%(-0.801)#727 | 1.2%(-0.837)#14,496 |
| 3. | 19056 | 0.33% | 1.1%(-0.820)#741 | 1.2%(-0.856)#14,734 |
| 4. | 19057 | 0.29% | 1.1%(-0.862)#765 | 1.2%(-0.899)#15,195 |
1
Common Questions
What are the Top 3 Zip Codes with the Highest Percentage of Population Employed in Legal Services & Support in Levittown, PA?
Top 3 Zip Codes with the Highest Percentage of Population Employed in Legal Services & Support in Levittown, PA are:
What zip code has the Highest Percentage of Population Employed in Legal Services & Support in Levittown, PA?
19055 has the Highest Percentage of Population Employed in Legal Services & Support in Levittown, PA with 0.56%.
What is the Percentage of Population Employed in Legal Services & Support in Levittown, PA?
Percentage of Population Employed in Legal Services & Support in Levittown is 0.49%.
What is the Percentage of Population Employed in Legal Services & Support in Pennsylvania?
Percentage of Population Employed in Legal Services & Support in Pennsylvania is 1.1%.
What is the Percentage of Population Employed in Legal Services & Support in the United States?
Percentage of Population Employed in Legal Services & Support in the United States is 1.2%.