Freeland borough, PA Map & Demographics
Freeland borough Overview
$28,772
PER CAPITA INCOME
$71,771
AVG FAMILY INCOME
$55,739
AVG HOUSEHOLD INCOME
24.2%
WAGE / INCOME GAP [ % ]
75.8¢/ $1
WAGE / INCOME GAP [ $ ]
0.40
INEQUALITY / GINI INDEX
3,807
TOTAL POPULATION
1,819
MALE POPULATION
1,988
FEMALE POPULATION
91.50
MALES / 100 FEMALES
109.29
FEMALES / 100 MALES
38.8
MEDIAN AGE
3.1
AVG FAMILY SIZE
2.4
AVG HOUSEHOLD SIZE
1,689
LABOR FORCE [ PEOPLE ]
55.3%
PERCENT IN LABOR FORCE
4.3%
UNEMPLOYMENT RATE
Income in Freeland borough
Income Overview in Freeland borough
Per Capita Income in Freeland borough is $28,772, while median incomes of families and households are $71,771 and $55,739 respectively.
| Characteristic | Number | Measure |
| Per Capita Income | 3,807 | $28,772 |
| Median Family Income | 989 | $71,771 |
| Mean Family Income | 989 | $81,802 |
| Median Household Income | 1,608 | $55,739 |
| Mean Household Income | 1,608 | $65,962 |
| Income Deficit | 989 | $0 |
| Wage / Income Gap (%) | 3,807 | 24.16% |
| Wage / Income Gap ($) | 3,807 | 75.84¢ per $1 |
| Gini / Inequality Index | 3,807 | 0.40 |
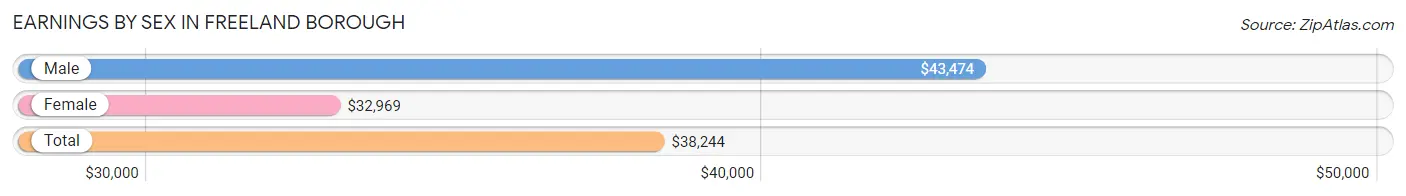
Earnings by Sex in Freeland borough
Average Earnings in Freeland borough are $38,244, $43,474 for men and $32,969 for women, a difference of 24.2%.
| Sex | Number | Average Earnings |
| Male | 965 (54.0%) | $43,474 |
| Female | 822 (46.0%) | $32,969 |
| Total | 1,787 (100.0%) | $38,244 |
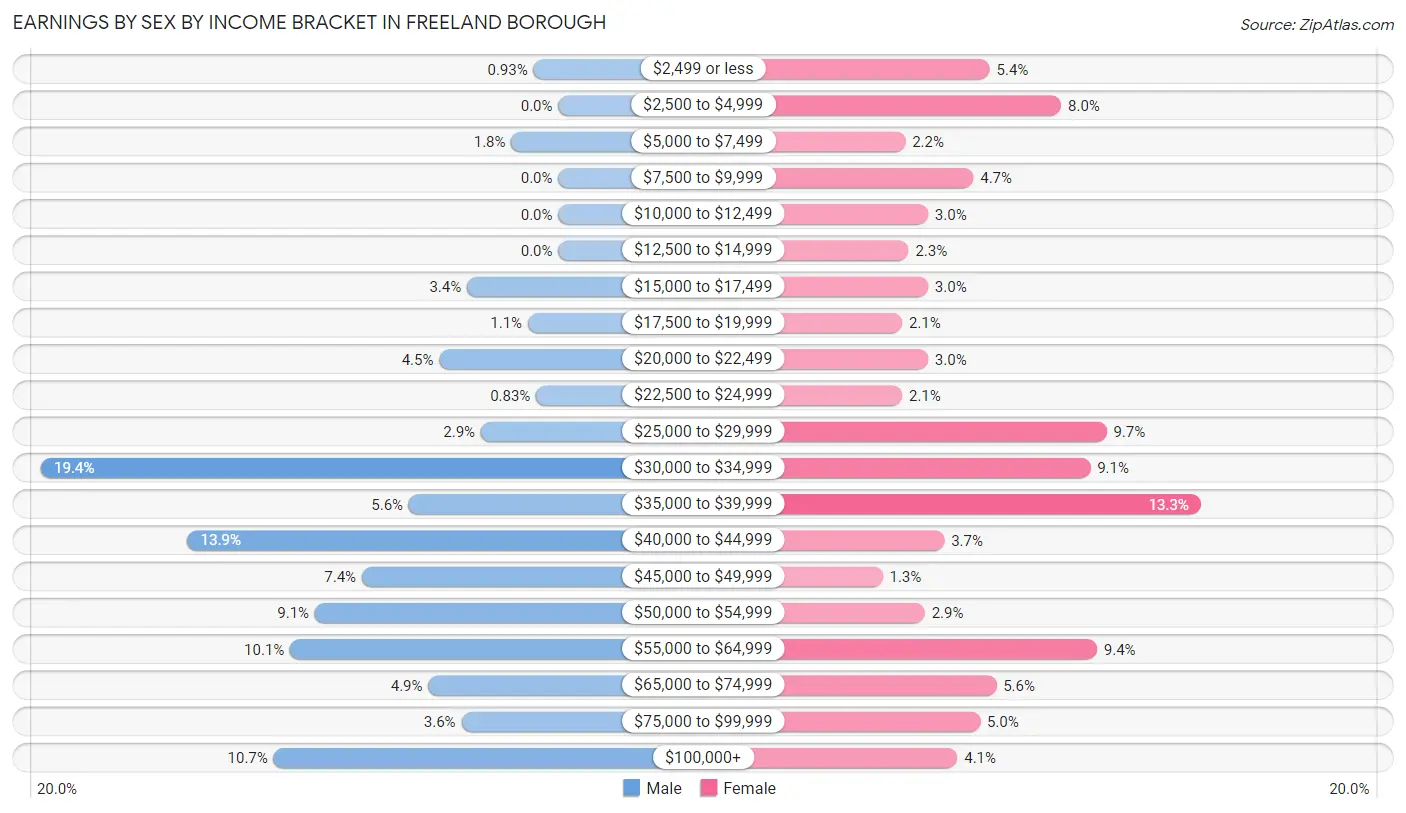
Earnings by Sex by Income Bracket in Freeland borough
The most common earnings brackets in Freeland borough are $30,000 to $34,999 for men (187 | 19.4%) and $35,000 to $39,999 for women (109 | 13.3%).
| Income | Male | Female |
| $2,499 or less | 9 (0.9%) | 44 (5.3%) |
| $2,500 to $4,999 | 0 (0.0%) | 66 (8.0%) |
| $5,000 to $7,499 | 17 (1.8%) | 18 (2.2%) |
| $7,500 to $9,999 | 0 (0.0%) | 39 (4.7%) |
| $10,000 to $12,499 | 0 (0.0%) | 25 (3.0%) |
| $12,500 to $14,999 | 0 (0.0%) | 19 (2.3%) |
| $15,000 to $17,499 | 33 (3.4%) | 25 (3.0%) |
| $17,500 to $19,999 | 11 (1.1%) | 17 (2.1%) |
| $20,000 to $22,499 | 43 (4.5%) | 25 (3.0%) |
| $22,500 to $24,999 | 8 (0.8%) | 17 (2.1%) |
| $25,000 to $29,999 | 28 (2.9%) | 80 (9.7%) |
| $30,000 to $34,999 | 187 (19.4%) | 75 (9.1%) |
| $35,000 to $39,999 | 54 (5.6%) | 109 (13.3%) |
| $40,000 to $44,999 | 134 (13.9%) | 30 (3.6%) |
| $45,000 to $49,999 | 71 (7.4%) | 11 (1.3%) |
| $50,000 to $54,999 | 88 (9.1%) | 24 (2.9%) |
| $55,000 to $64,999 | 97 (10.1%) | 77 (9.4%) |
| $65,000 to $74,999 | 47 (4.9%) | 46 (5.6%) |
| $75,000 to $99,999 | 35 (3.6%) | 41 (5.0%) |
| $100,000+ | 103 (10.7%) | 34 (4.1%) |
| Total | 965 (100.0%) | 822 (100.0%) |
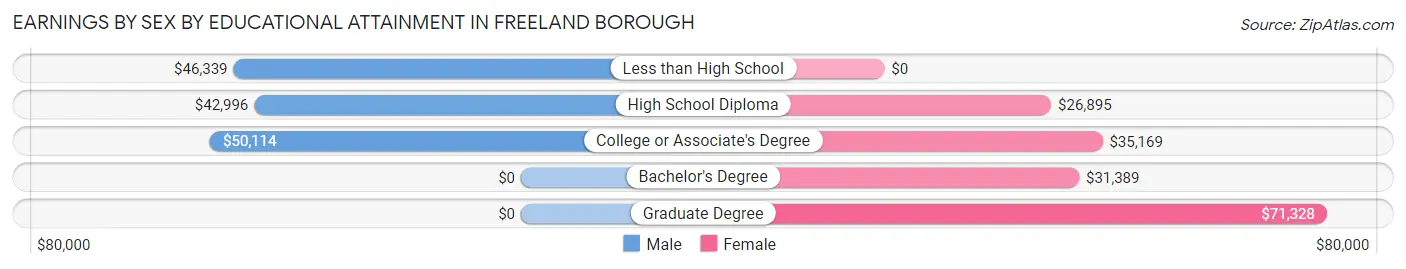
Earnings by Sex by Educational Attainment in Freeland borough
Average earnings in Freeland borough are $46,541 for men and $34,896 for women, a difference of 25.0%. Men with an educational attainment of college or associate's degree enjoy the highest average annual earnings of $50,114, while those with high school diploma education earn the least with $42,996. Women with an educational attainment of graduate degree earn the most with the average annual earnings of $71,328, while those with high school diploma education have the smallest earnings of $26,895.
| Educational Attainment | Male Income | Female Income |
| Less than High School | $46,339 | $0 |
| High School Diploma | $42,996 | $26,895 |
| College or Associate's Degree | $50,114 | $35,169 |
| Bachelor's Degree | - | - |
| Graduate Degree | - | - |
| Total | $46,541 | $34,896 |
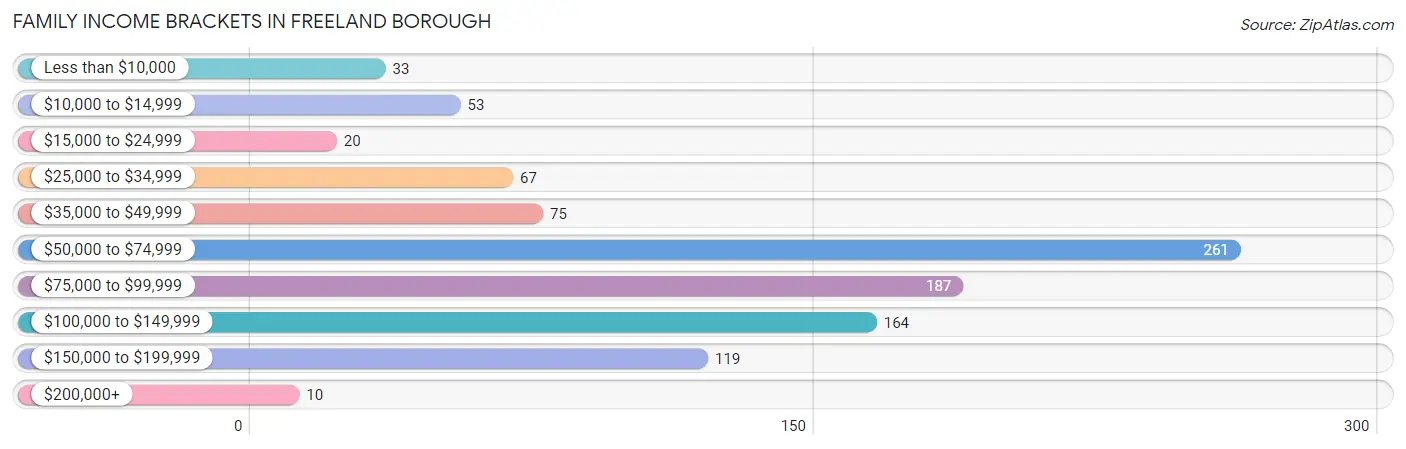
Family Income in Freeland borough
Family Income Brackets in Freeland borough
According to the Freeland borough family income data, there are 261 families falling into the $50,000 to $74,999 income range, which is the most common income bracket and makes up 26.4% of all families. Conversely, the $200,000+ income bracket is the least frequent group with only 10 families (1.0%) belonging to this category.
| Income Bracket | # Families | % Families |
| Less than $10,000 | 33 | 3.3% |
| $10,000 to $14,999 | 53 | 5.4% |
| $15,000 to $24,999 | 20 | 2.0% |
| $25,000 to $34,999 | 67 | 6.8% |
| $35,000 to $49,999 | 75 | 7.6% |
| $50,000 to $74,999 | 261 | 26.4% |
| $75,000 to $99,999 | 187 | 18.9% |
| $100,000 to $149,999 | 164 | 16.6% |
| $150,000 to $199,999 | 119 | 12.0% |
| $200,000+ | 10 | 1.0% |
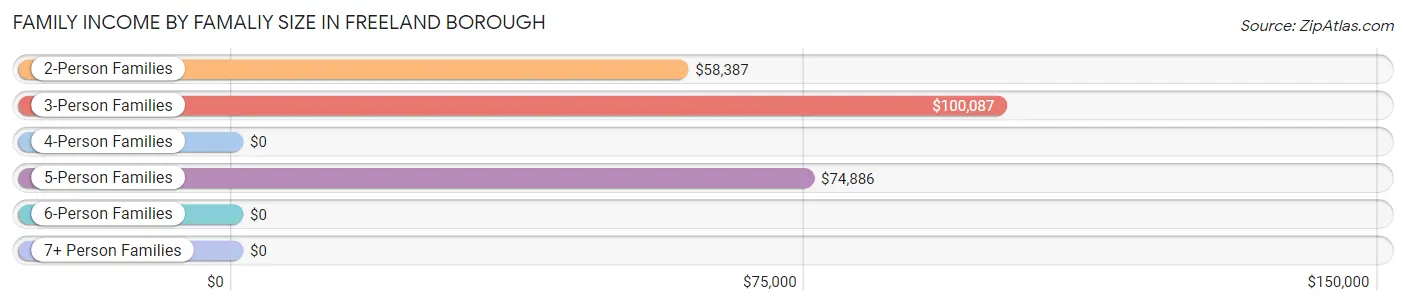
Family Income by Famaliy Size in Freeland borough
3-person families (173 | 17.5%) account for the highest median family income in Freeland borough with $100,087 per family, while 3-person families (173 | 17.5%) have the highest median income of $33,362 per family member.
| Income Bracket | # Families | Median Income |
| 2-Person Families | 502 (50.8%) | $58,387 |
| 3-Person Families | 173 (17.5%) | $100,087 |
| 4-Person Families | 154 (15.6%) | $0 |
| 5-Person Families | 121 (12.2%) | $74,886 |
| 6-Person Families | 32 (3.2%) | $0 |
| 7+ Person Families | 7 (0.7%) | $0 |
| Total | 989 (100.0%) | $71,771 |
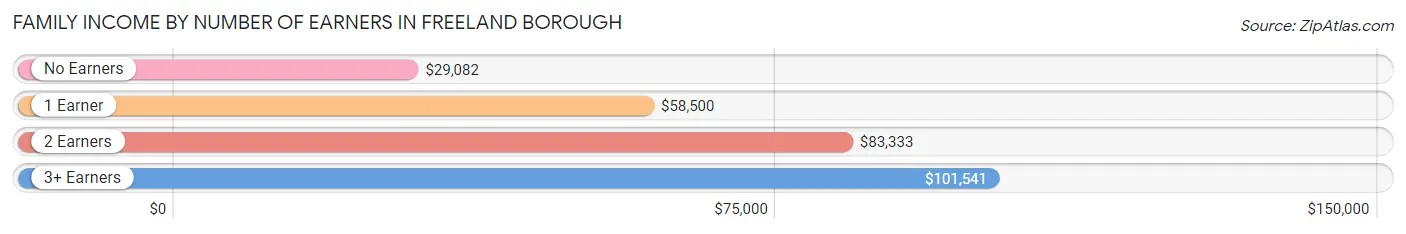
Family Income by Number of Earners in Freeland borough
The median family income in Freeland borough is $71,771, with families comprising 3+ earners (97) having the highest median family income of $101,541, while families with no earners (186) have the lowest median family income of $29,082, accounting for 9.8% and 18.8% of families, respectively.
| Number of Earners | # Families | Median Income |
| No Earners | 186 (18.8%) | $29,082 |
| 1 Earner | 350 (35.4%) | $58,500 |
| 2 Earners | 356 (36.0%) | $83,333 |
| 3+ Earners | 97 (9.8%) | $101,541 |
| Total | 989 (100.0%) | $71,771 |
Household Income in Freeland borough
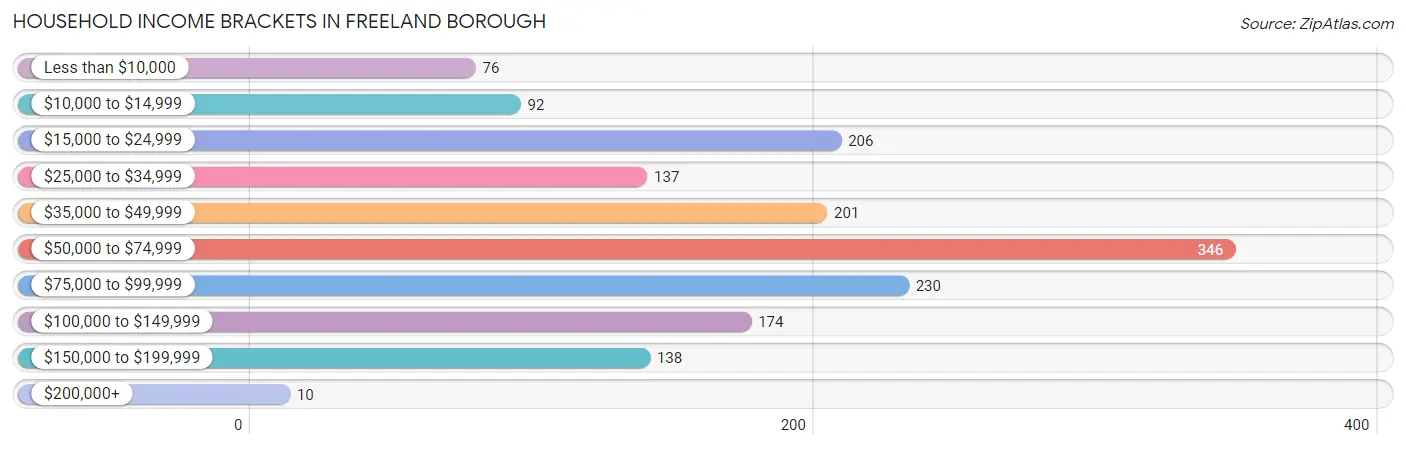
Household Income Brackets in Freeland borough
With 346 households falling in the category, the $50,000 to $74,999 income range is the most frequent in Freeland borough, accounting for 21.5% of all households. In contrast, only 10 households (0.6%) fall into the $200,000+ income bracket, making it the least populous group.
| Income Bracket | # Households | % Households |
| Less than $10,000 | 76 | 4.7% |
| $10,000 to $14,999 | 92 | 5.7% |
| $15,000 to $24,999 | 206 | 12.8% |
| $25,000 to $34,999 | 137 | 8.5% |
| $35,000 to $49,999 | 201 | 12.5% |
| $50,000 to $74,999 | 346 | 21.5% |
| $75,000 to $99,999 | 230 | 14.3% |
| $100,000 to $149,999 | 174 | 10.8% |
| $150,000 to $199,999 | 138 | 8.6% |
| $200,000+ | 10 | 0.6% |
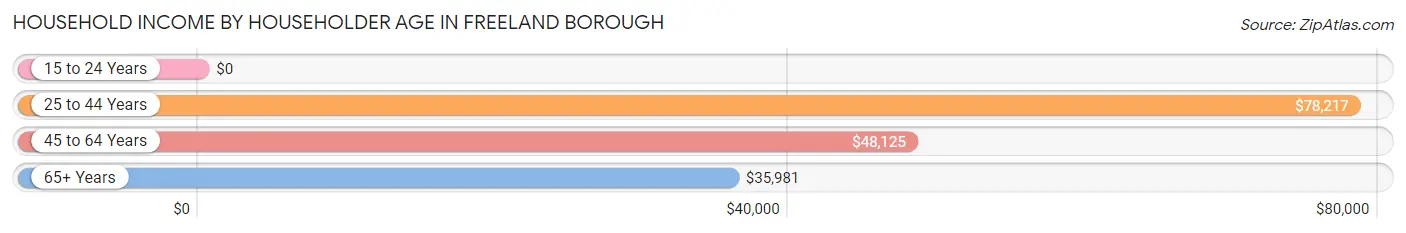
Household Income by Householder Age in Freeland borough
The median household income in Freeland borough is $55,739, with the highest median household income of $78,217 found in the 25 to 44 years age bracket for the primary householder. A total of 625 households (38.9%) fall into this category. Meanwhile, the 15 to 24 years age bracket for the primary householder has the lowest median household income of $0, with 27 households (1.7%) in this group.
| Income Bracket | # Households | Median Income |
| 15 to 24 Years | 27 (1.7%) | $0 |
| 25 to 44 Years | 625 (38.9%) | $78,217 |
| 45 to 64 Years | 486 (30.2%) | $48,125 |
| 65+ Years | 470 (29.2%) | $35,981 |
| Total | 1,608 (100.0%) | $55,739 |
Poverty in Freeland borough
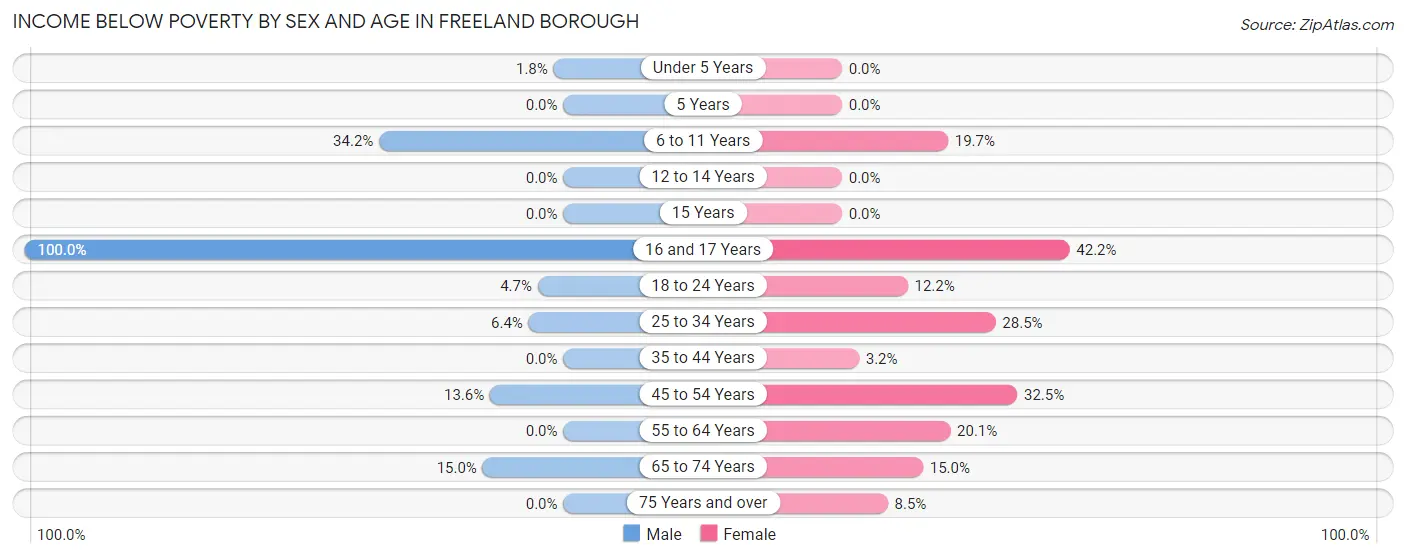
Income Below Poverty by Sex and Age in Freeland borough
With 7.6% poverty level for males and 18.3% for females among the residents of Freeland borough, 16 and 17 year old males and 16 and 17 year old females are the most vulnerable to poverty, with 14 males (100.0%) and 49 females (42.2%) in their respective age groups living below the poverty level.
| Age Bracket | Male | Female |
| Under 5 Years | 5 (1.8%) | 0 (0.0%) |
| 5 Years | 0 (0.0%) | 0 (0.0%) |
| 6 to 11 Years | 40 (34.2%) | 47 (19.7%) |
| 12 to 14 Years | 0 (0.0%) | 0 (0.0%) |
| 15 Years | 0 (0.0%) | 0 (0.0%) |
| 16 and 17 Years | 14 (100.0%) | 49 (42.2%) |
| 18 to 24 Years | 9 (4.7%) | 20 (12.2%) |
| 25 to 34 Years | 19 (6.4%) | 63 (28.5%) |
| 35 to 44 Years | 0 (0.0%) | 8 (3.2%) |
| 45 to 54 Years | 26 (13.6%) | 81 (32.5%) |
| 55 to 64 Years | 0 (0.0%) | 42 (20.1%) |
| 65 to 74 Years | 25 (15.0%) | 37 (15.0%) |
| 75 Years and over | 0 (0.0%) | 17 (8.5%) |
| Total | 138 (7.6%) | 364 (18.3%) |
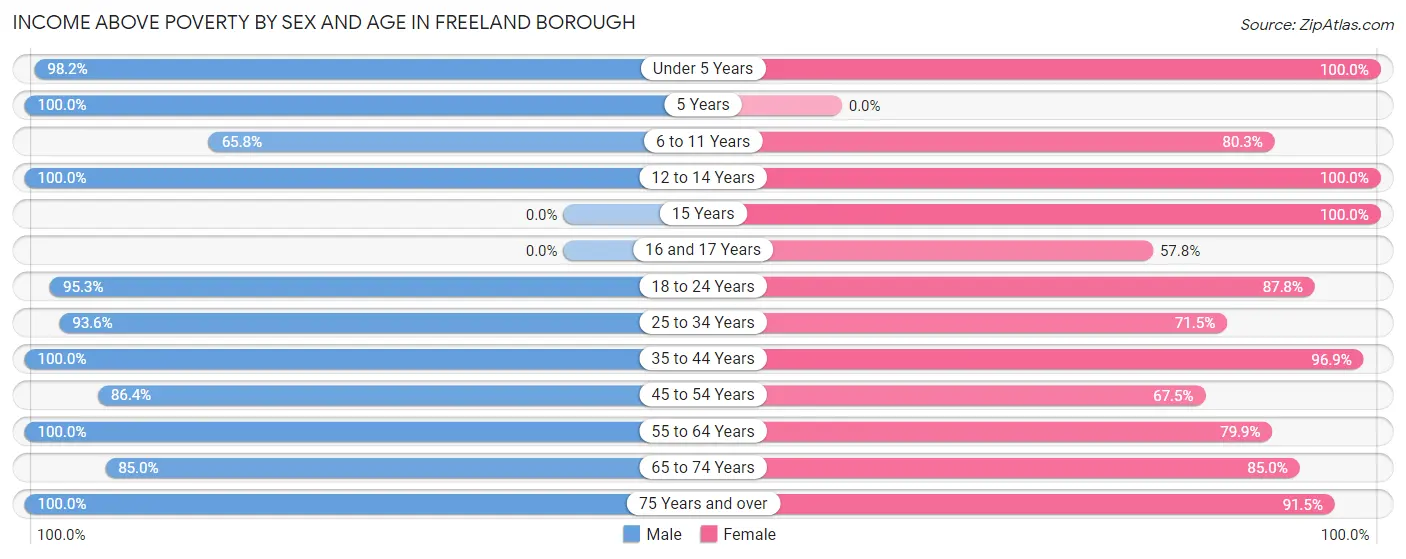
Income Above Poverty by Sex and Age in Freeland borough
According to the poverty statistics in Freeland borough, males aged 5 years and females aged under 5 years are the age groups that are most secure financially, with 100.0% of males and 100.0% of females in these age groups living above the poverty line.
| Age Bracket | Male | Female |
| Under 5 Years | 272 (98.2%) | 19 (100.0%) |
| 5 Years | 8 (100.0%) | 0 (0.0%) |
| 6 to 11 Years | 77 (65.8%) | 192 (80.3%) |
| 12 to 14 Years | 22 (100.0%) | 60 (100.0%) |
| 15 Years | 0 (0.0%) | 11 (100.0%) |
| 16 and 17 Years | 0 (0.0%) | 67 (57.8%) |
| 18 to 24 Years | 181 (95.3%) | 144 (87.8%) |
| 25 to 34 Years | 276 (93.6%) | 158 (71.5%) |
| 35 to 44 Years | 208 (100.0%) | 246 (96.9%) |
| 45 to 54 Years | 165 (86.4%) | 168 (67.5%) |
| 55 to 64 Years | 267 (100.0%) | 167 (79.9%) |
| 65 to 74 Years | 142 (85.0%) | 209 (85.0%) |
| 75 Years and over | 63 (100.0%) | 183 (91.5%) |
| Total | 1,681 (92.4%) | 1,624 (81.7%) |
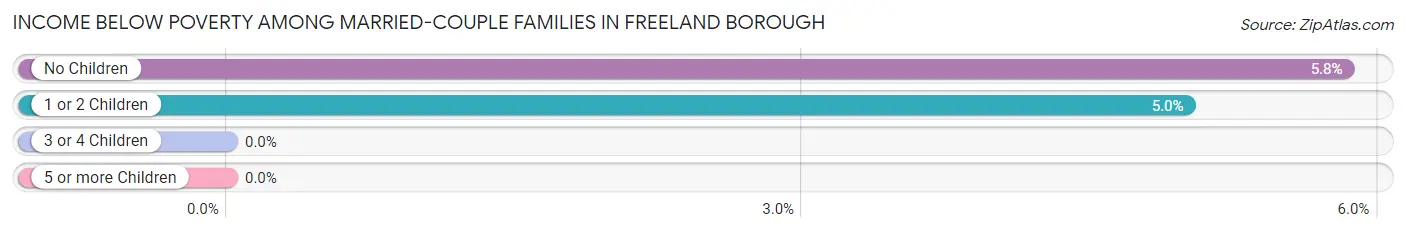
Income Below Poverty Among Married-Couple Families in Freeland borough
The poverty statistics for married-couple families in Freeland borough show that 4.7% or 32 of the total 679 families live below the poverty line. Families with no children have the highest poverty rate of 5.8%, comprising of 21 families. On the other hand, families with 3 or 4 children have the lowest poverty rate of 0.0%, which includes 0 families.
| Children | Above Poverty | Below Poverty |
| No Children | 339 (94.2%) | 21 (5.8%) |
| 1 or 2 Children | 209 (95.0%) | 11 (5.0%) |
| 3 or 4 Children | 99 (100.0%) | 0 (0.0%) |
| 5 or more Children | 0 (0.0%) | 0 (0.0%) |
| Total | 647 (95.3%) | 32 (4.7%) |
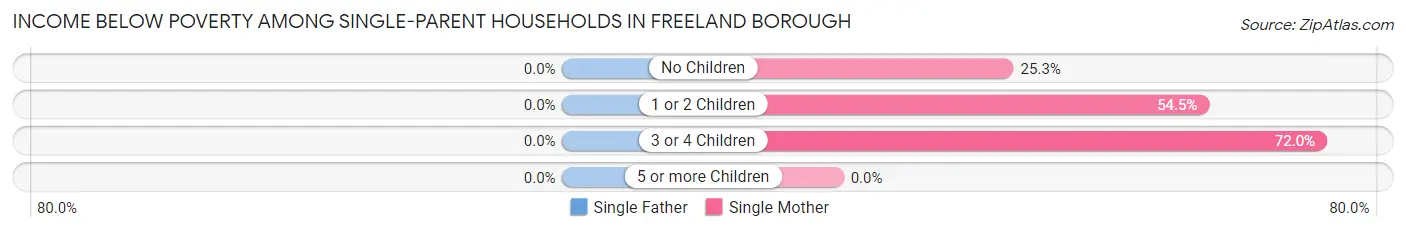
Income Below Poverty Among Single-Parent Households in Freeland borough
| Children | Single Father | Single Mother |
| No Children | 0 (0.0%) | 19 (25.3%) |
| 1 or 2 Children | 0 (0.0%) | 55 (54.5%) |
| 3 or 4 Children | 0 (0.0%) | 18 (72.0%) |
| 5 or more Children | 0 (0.0%) | 0 (0.0%) |
| Total | 0 (0.0%) | 92 (45.8%) |
Income Below Poverty Among Married-Couple vs Single-Parent Households in Freeland borough
The poverty data for Freeland borough shows that 32 of the married-couple family households (4.7%) and 92 of the single-parent households (29.7%) are living below the poverty level. Within the married-couple family households, those with no children have the highest poverty rate, with 21 households (5.8%) falling below the poverty line. Among the single-parent households, those with 3 or 4 children have the highest poverty rate, with 18 household (72.0%) living below poverty.
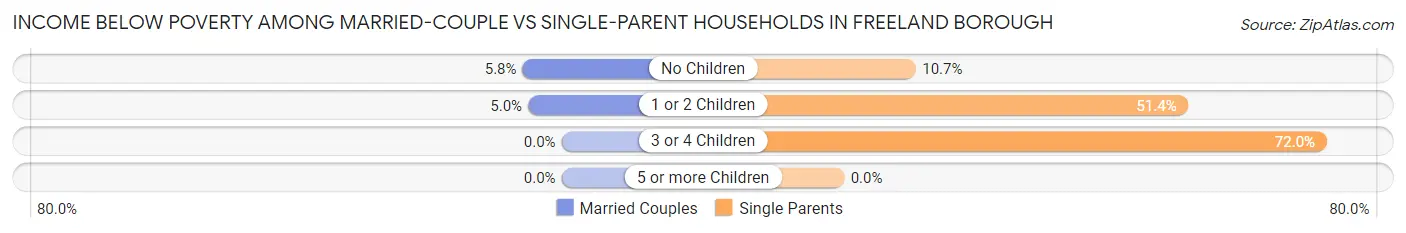
| Children | Married-Couple Families | Single-Parent Households |
| No Children | 21 (5.8%) | 19 (10.7%) |
| 1 or 2 Children | 11 (5.0%) | 55 (51.4%) |
| 3 or 4 Children | 0 (0.0%) | 18 (72.0%) |
| 5 or more Children | 0 (0.0%) | 0 (0.0%) |
| Total | 32 (4.7%) | 92 (29.7%) |
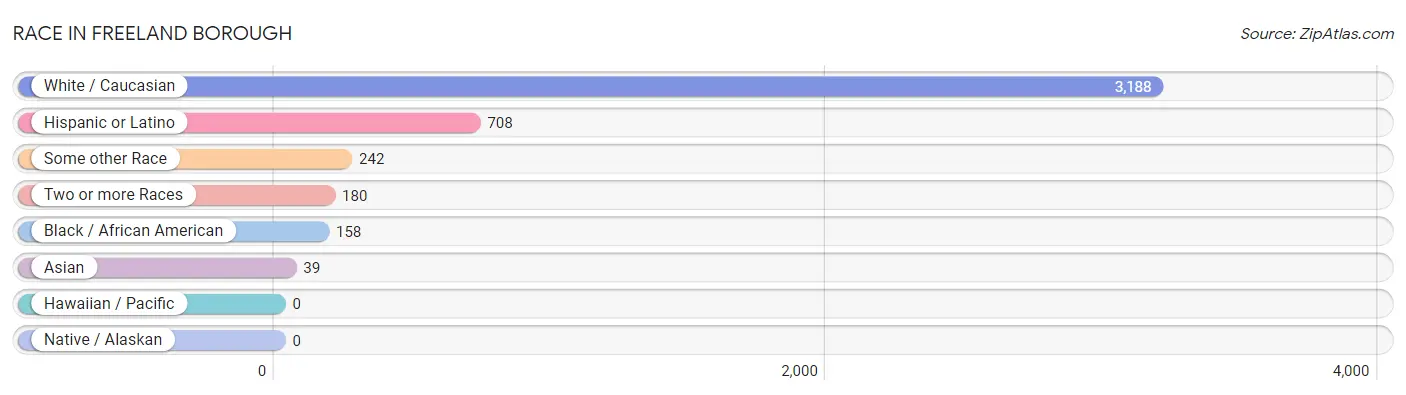
Race in Freeland borough
The most populous races in Freeland borough are White / Caucasian (3,188 | 83.7%), Hispanic or Latino (708 | 18.6%), and Some other Race (242 | 6.4%).
| Race | # Population | % Population |
| Asian | 39 | 1.0% |
| Black / African American | 158 | 4.2% |
| Hawaiian / Pacific | 0 | 0.0% |
| Hispanic or Latino | 708 | 18.6% |
| Native / Alaskan | 0 | 0.0% |
| White / Caucasian | 3,188 | 83.7% |
| Two or more Races | 180 | 4.7% |
| Some other Race | 242 | 6.4% |
| Total | 3,807 | 100.0% |
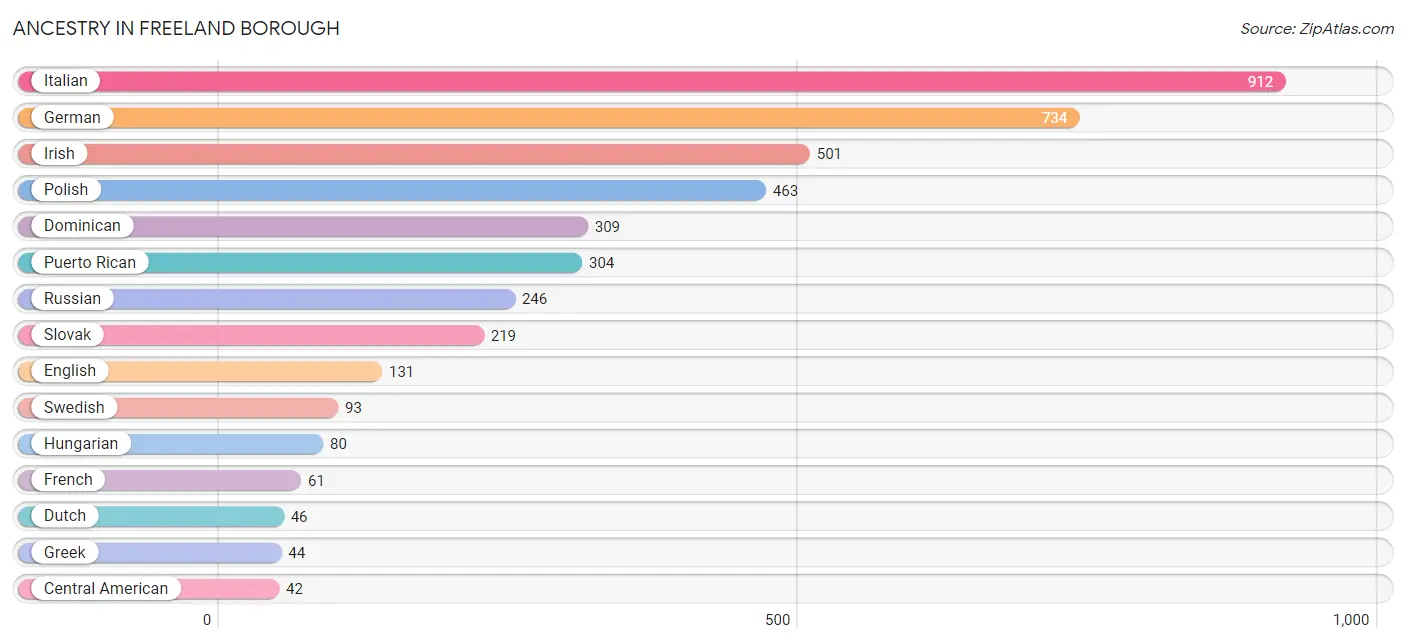
Ancestry in Freeland borough
The most populous ancestries reported in Freeland borough are Italian (912 | 24.0%), German (734 | 19.3%), Irish (501 | 13.2%), Polish (463 | 12.2%), and Dominican (309 | 8.1%), together accounting for 76.7% of all Freeland borough residents.
| Ancestry | # Population | % Population |
| American | 14 | 0.4% |
| Austrian | 9 | 0.2% |
| Central American | 42 | 1.1% |
| Czech | 13 | 0.3% |
| Delaware | 3 | 0.1% |
| Dominican | 309 | 8.1% |
| Dutch | 46 | 1.2% |
| Eastern European | 23 | 0.6% |
| English | 131 | 3.4% |
| European | 22 | 0.6% |
| French | 61 | 1.6% |
| German | 734 | 19.3% |
| Greek | 44 | 1.2% |
| Guatemalan | 42 | 1.1% |
| Hungarian | 80 | 2.1% |
| Irish | 501 | 13.2% |
| Italian | 912 | 24.0% |
| Mexican | 34 | 0.9% |
| Pennsylvania German | 16 | 0.4% |
| Polish | 463 | 12.2% |
| Portuguese | 23 | 0.6% |
| Puerto Rican | 304 | 8.0% |
| Russian | 246 | 6.5% |
| Scottish | 5 | 0.1% |
| Slavic | 12 | 0.3% |
| Slovak | 219 | 5.8% |
| Spaniard | 19 | 0.5% |
| Subsaharan African | 9 | 0.2% |
| Swedish | 93 | 2.4% |
| Thai | 39 | 1.0% |
| Ukrainian | 9 | 0.2% |
| Welsh | 30 | 0.8% | View All 32 Rows |
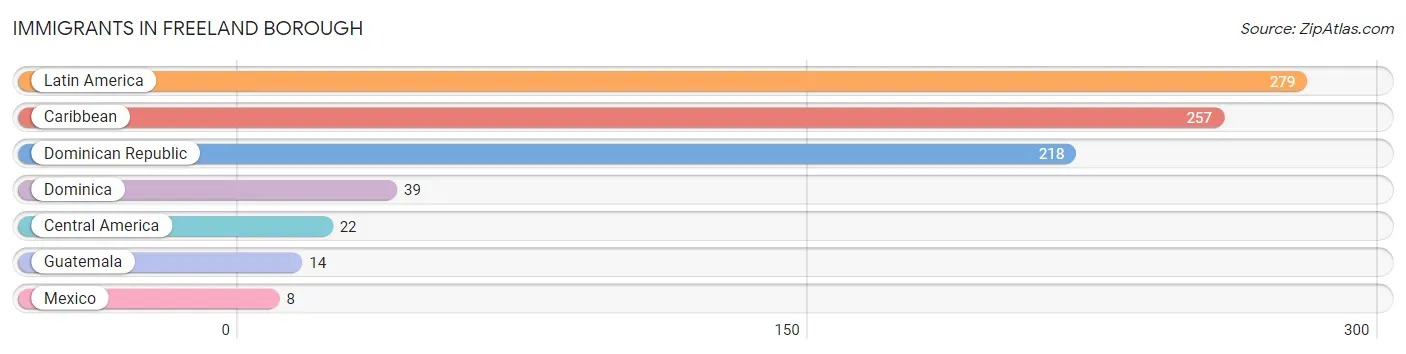
Immigrants in Freeland borough
The most numerous immigrant groups reported in Freeland borough came from Latin America (279 | 7.3%), Caribbean (257 | 6.8%), Dominican Republic (218 | 5.7%), Dominica (39 | 1.0%), and Central America (22 | 0.6%), together accounting for 21.4% of all Freeland borough residents.
| Immigration Origin | # Population | % Population |
| Caribbean | 257 | 6.8% |
| Central America | 22 | 0.6% |
| Dominica | 39 | 1.0% |
| Dominican Republic | 218 | 5.7% |
| Guatemala | 14 | 0.4% |
| Latin America | 279 | 7.3% |
| Mexico | 8 | 0.2% | View All 7 Rows |
Sex and Age in Freeland borough
Sex and Age in Freeland borough
The most populous age groups in Freeland borough are Under 5 Years (277 | 15.2%) for men and 10 to 14 Years (189 | 9.5%) for women.
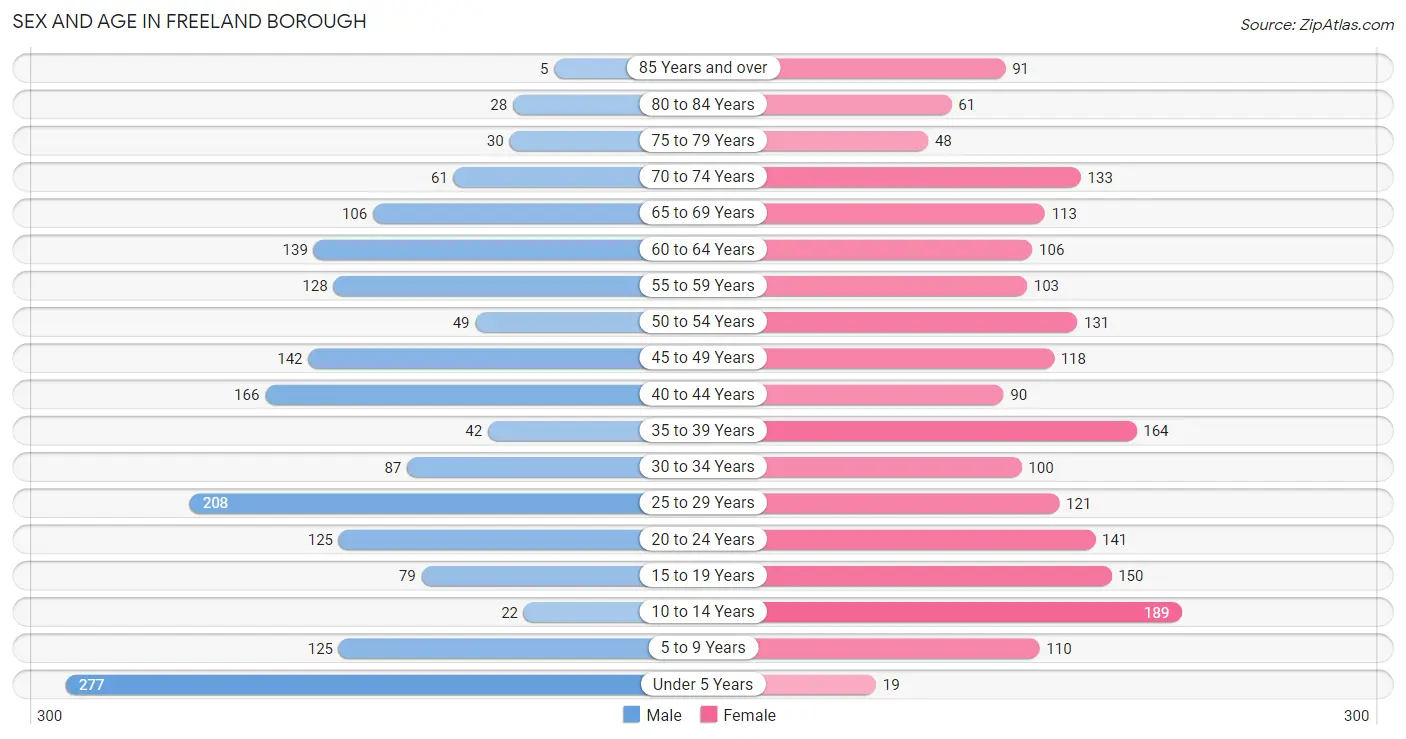
| Age Bracket | Male | Female |
| Under 5 Years | 277 (15.2%) | 19 (1.0%) |
| 5 to 9 Years | 125 (6.9%) | 110 (5.5%) |
| 10 to 14 Years | 22 (1.2%) | 189 (9.5%) |
| 15 to 19 Years | 79 (4.3%) | 150 (7.5%) |
| 20 to 24 Years | 125 (6.9%) | 141 (7.1%) |
| 25 to 29 Years | 208 (11.4%) | 121 (6.1%) |
| 30 to 34 Years | 87 (4.8%) | 100 (5.0%) |
| 35 to 39 Years | 42 (2.3%) | 164 (8.3%) |
| 40 to 44 Years | 166 (9.1%) | 90 (4.5%) |
| 45 to 49 Years | 142 (7.8%) | 118 (5.9%) |
| 50 to 54 Years | 49 (2.7%) | 131 (6.6%) |
| 55 to 59 Years | 128 (7.0%) | 103 (5.2%) |
| 60 to 64 Years | 139 (7.6%) | 106 (5.3%) |
| 65 to 69 Years | 106 (5.8%) | 113 (5.7%) |
| 70 to 74 Years | 61 (3.4%) | 133 (6.7%) |
| 75 to 79 Years | 30 (1.7%) | 48 (2.4%) |
| 80 to 84 Years | 28 (1.5%) | 61 (3.1%) |
| 85 Years and over | 5 (0.3%) | 91 (4.6%) |
| Total | 1,819 (100.0%) | 1,988 (100.0%) |
Families and Households in Freeland borough
Median Family Size in Freeland borough
The median family size in Freeland borough is 3.06 persons per family, with married-couple families (679 | 68.7%) accounting for the largest median family size of 3.19 persons per family. On the other hand, single male/father families (109 | 11.0%) represent the smallest median family size with 2.72 persons per family.
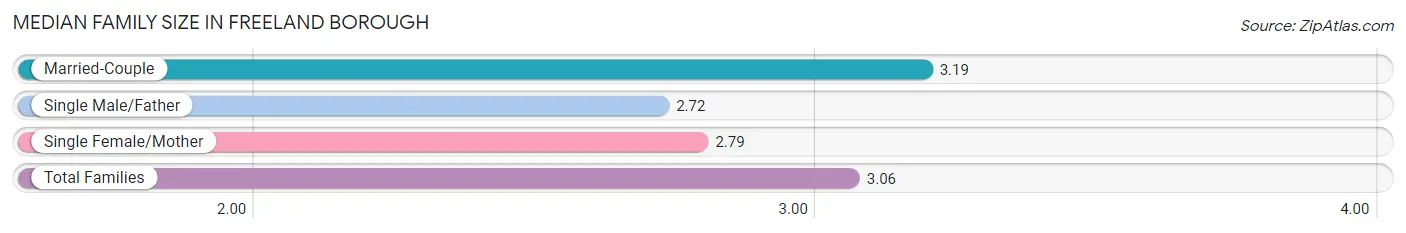
| Family Type | # Families | Family Size |
| Married-Couple | 679 (68.7%) | 3.19 |
| Single Male/Father | 109 (11.0%) | 2.72 |
| Single Female/Mother | 201 (20.3%) | 2.79 |
| Total Families | 989 (100.0%) | 3.06 |
Median Household Size in Freeland borough
The median household size in Freeland borough is 2.37 persons per household, with married-couple households (679 | 42.2%) accounting for the largest median household size of 3.19 persons per household. non-family households (619 | 38.5%) represent the smallest median household size with 1.26 persons per household.
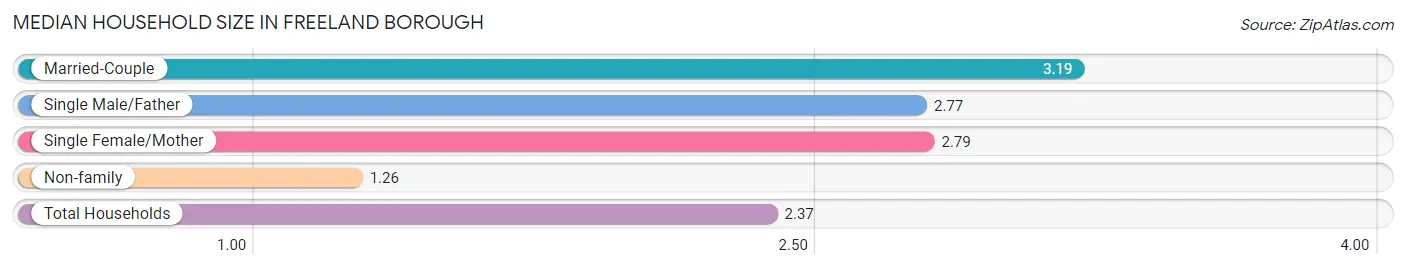
| Household Type | # Households | Household Size |
| Married-Couple | 679 (42.2%) | 3.19 |
| Single Male/Father | 109 (6.8%) | 2.77 |
| Single Female/Mother | 201 (12.5%) | 2.79 |
| Non-family | 619 (38.5%) | 1.26 |
| Total Households | 1,608 (100.0%) | 2.37 |
Household Size by Marriage Status in Freeland borough
Out of a total of 1,608 households in Freeland borough, 989 (61.5%) are family households, while 619 (38.5%) are nonfamily households. The most numerous type of family households are 2-person households, comprising 502, and the most common type of nonfamily households are 1-person households, comprising 533.
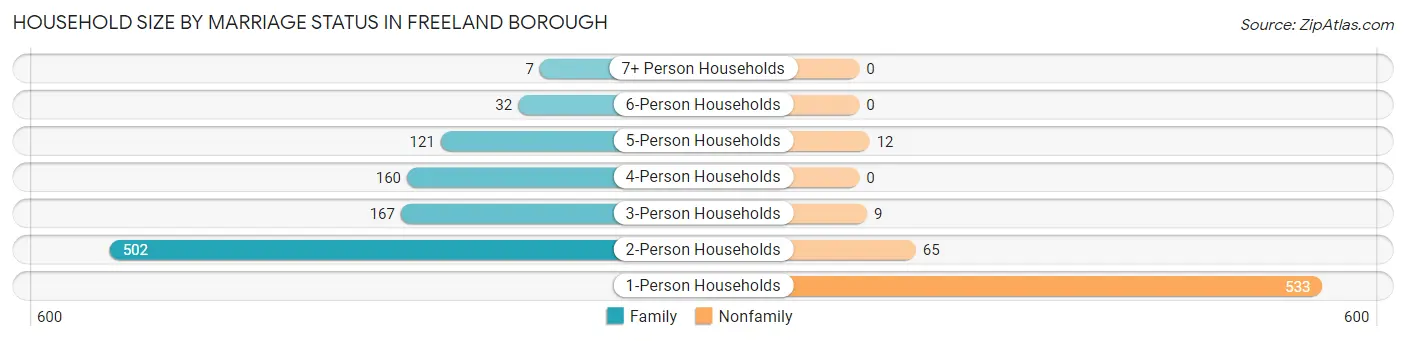
| Household Size | Family Households | Nonfamily Households |
| 1-Person Households | - | 533 (33.2%) |
| 2-Person Households | 502 (31.2%) | 65 (4.0%) |
| 3-Person Households | 167 (10.4%) | 9 (0.6%) |
| 4-Person Households | 160 (10.0%) | 0 (0.0%) |
| 5-Person Households | 121 (7.5%) | 12 (0.7%) |
| 6-Person Households | 32 (2.0%) | 0 (0.0%) |
| 7+ Person Households | 7 (0.4%) | 0 (0.0%) |
| Total | 989 (61.5%) | 619 (38.5%) |
Female Fertility in Freeland borough
Fertility by Age in Freeland borough
Average fertility rate in Freeland borough is 6.0 births per 1,000 women. Women in the age bracket of 20 to 34 years have the highest fertility rate with 17.0 births per 1,000 women. Women in the age bracket of 20 to 34 years acount for 100.0% of all women with births.
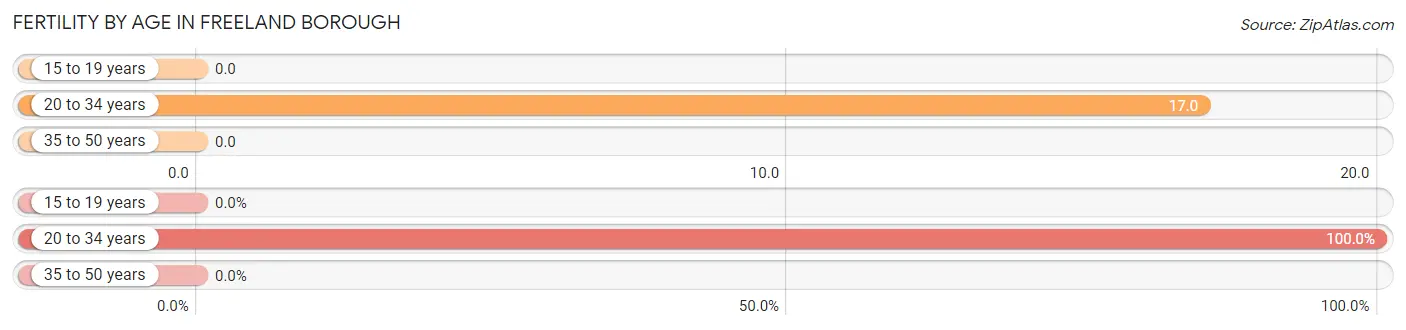
| Age Bracket | Women with Births | Births / 1,000 Women |
| 15 to 19 years | 0 (0.0%) | 0.0 |
| 20 to 34 years | 6 (100.0%) | 17.0 |
| 35 to 50 years | 0 (0.0%) | 0.0 |
| Total | 6 (100.0%) | 6.0 |
Fertility by Age by Marriage Status in Freeland borough
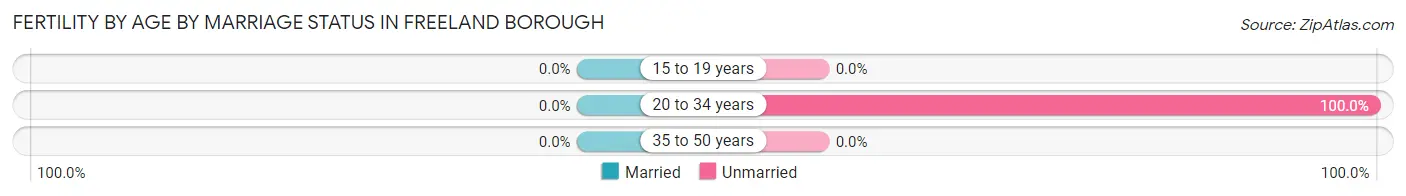
| Age Bracket | Married | Unmarried |
| 15 to 19 years | 0 (0.0%) | 0 (0.0%) |
| 20 to 34 years | 0 (0.0%) | 6 (100.0%) |
| 35 to 50 years | 0 (0.0%) | 0 (0.0%) |
| Total | 0 (0.0%) | 6 (100.0%) |
Fertility by Education in Freeland borough
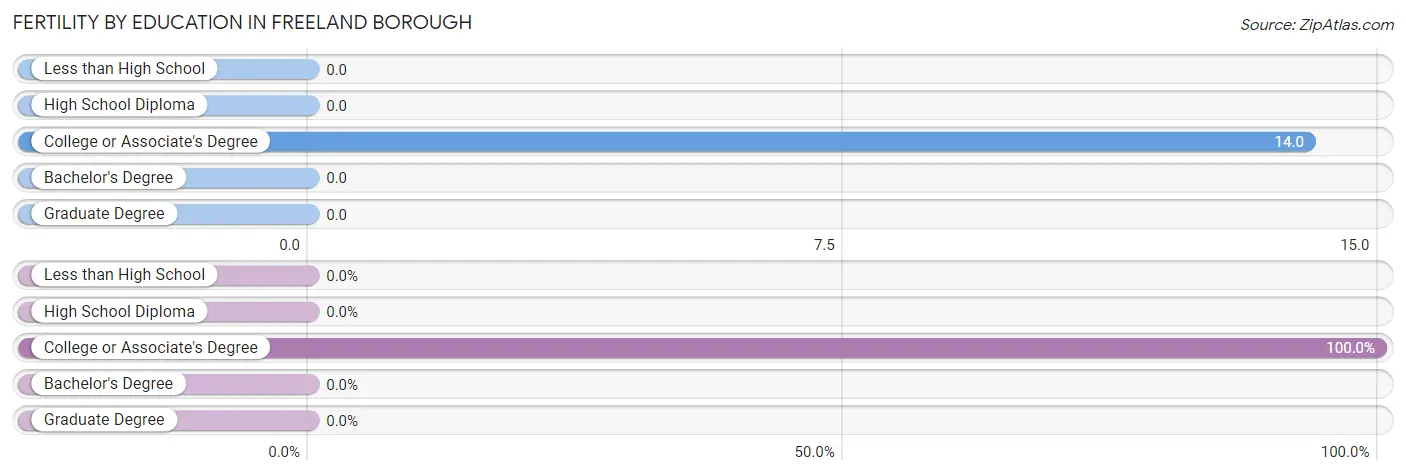
| Educational Attainment | Women with Births | Births / 1,000 Women |
| Less than High School | 0 (0.0%) | 0.0 |
| High School Diploma | 0 (0.0%) | 0.0 |
| College or Associate's Degree | 6 (100.0%) | 14.0 |
| Bachelor's Degree | 0 (0.0%) | 0.0 |
| Graduate Degree | 0 (0.0%) | 0.0 |
| Total | 6 (100.0%) | 6.0 |
Fertility by Education by Marriage Status in Freeland borough
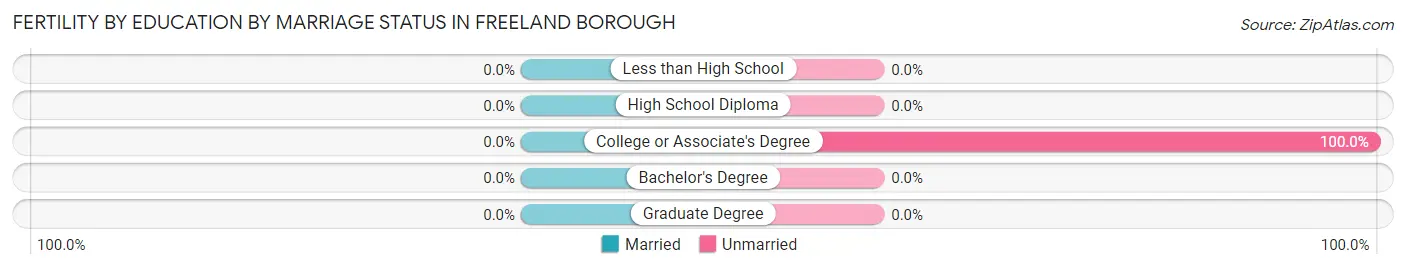
| Educational Attainment | Married | Unmarried |
| Less than High School | 0 (0.0%) | 0 (0.0%) |
| High School Diploma | 0 (0.0%) | 0 (0.0%) |
| College or Associate's Degree | 0 (0.0%) | 6 (100.0%) |
| Bachelor's Degree | 0 (0.0%) | 0 (0.0%) |
| Graduate Degree | 0 (0.0%) | 0 (0.0%) |
| Total | 0 (0.0%) | 6 (100.0%) |
Employment Characteristics in Freeland borough
Employment by Class of Employer in Freeland borough
Among the 1,590 employed individuals in Freeland borough, private company employees (1,189 | 74.8%), not-for-profit organizations (190 | 11.9%), and local government employees (98 | 6.2%) make up the most common classes of employment.
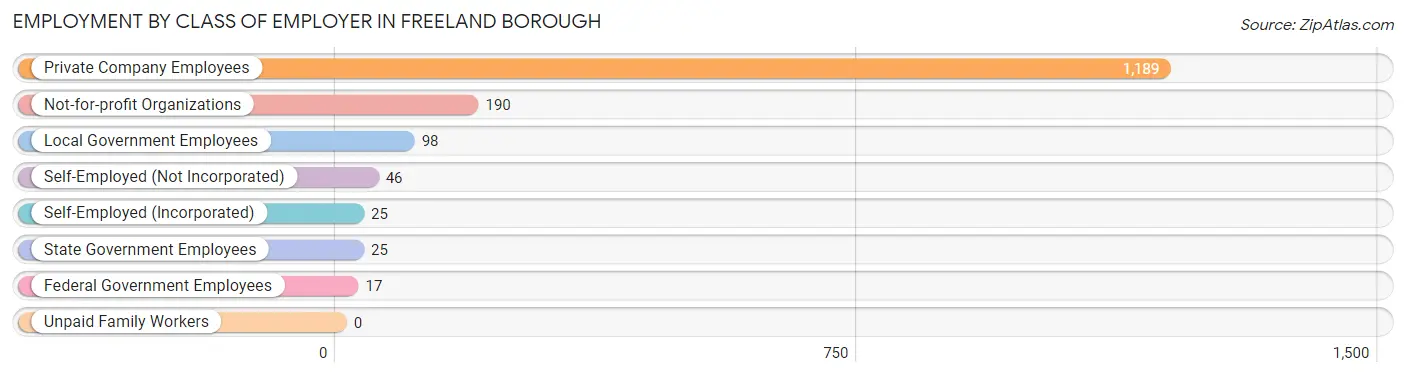
| Employer Class | # Employees | % Employees |
| Private Company Employees | 1,189 | 74.8% |
| Self-Employed (Incorporated) | 25 | 1.6% |
| Self-Employed (Not Incorporated) | 46 | 2.9% |
| Not-for-profit Organizations | 190 | 11.9% |
| Local Government Employees | 98 | 6.2% |
| State Government Employees | 25 | 1.6% |
| Federal Government Employees | 17 | 1.1% |
| Unpaid Family Workers | 0 | 0.0% |
| Total | 1,590 | 100.0% |
Employment Status by Age in Freeland borough
According to the labor force statistics for Freeland borough, out of the total population over 16 years of age (3,054), 55.3% or 1,689 individuals are in the labor force, with 4.3% or 73 of them unemployed. The age group with the highest labor force participation rate is 25 to 29 years, with 92.1% or 303 individuals in the labor force. Within the labor force, the 30 to 34 years age range has the highest percentage of unemployed individuals, with 17.7% or 26 of them being unemployed.
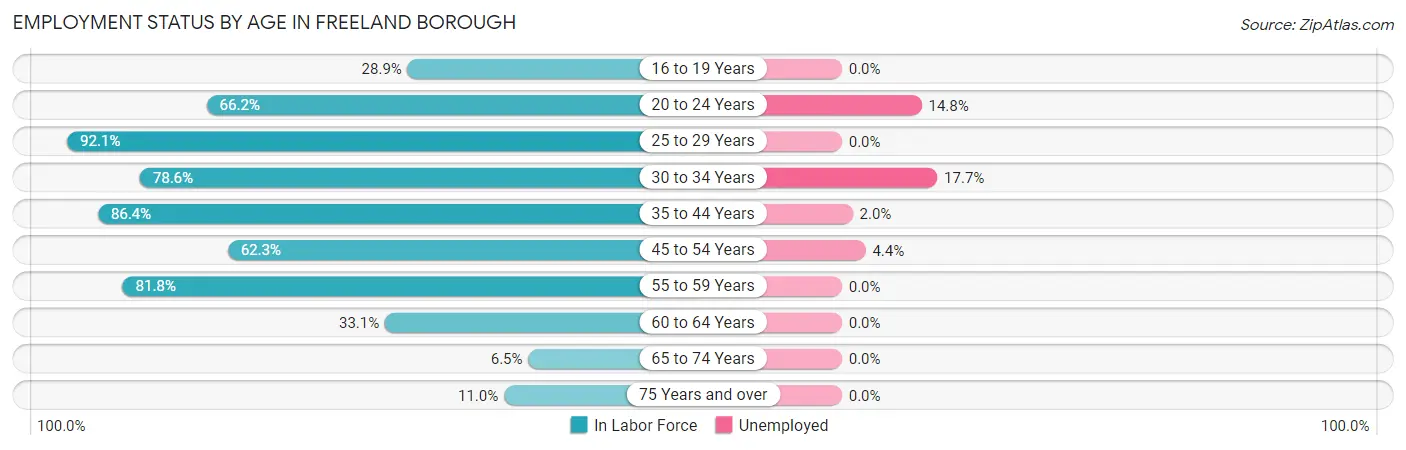
| Age Bracket | In Labor Force | Unemployed |
| 16 to 19 Years | 63 (28.9%) | 0 (0.0%) |
| 20 to 24 Years | 176 (66.2%) | 26 (14.8%) |
| 25 to 29 Years | 303 (92.1%) | 0 (0.0%) |
| 30 to 34 Years | 147 (78.6%) | 26 (17.7%) |
| 35 to 44 Years | 399 (86.4%) | 8 (2.0%) |
| 45 to 54 Years | 274 (62.3%) | 12 (4.4%) |
| 55 to 59 Years | 189 (81.8%) | 0 (0.0%) |
| 60 to 64 Years | 81 (33.1%) | 0 (0.0%) |
| 65 to 74 Years | 27 (6.5%) | 0 (0.0%) |
| 75 Years and over | 29 (11.0%) | 0 (0.0%) |
| Total | 1,689 (55.3%) | 73 (4.3%) |
Employment Status by Educational Attainment in Freeland borough
According to labor force statistics for Freeland borough, 73.5% of individuals (1,392) out of the total population between 25 and 64 years of age (1,894) are in the labor force, with 3.3% or 46 of them being unemployed. The group with the highest labor force participation rate are those with the educational attainment of bachelor's degree or higher, with 90.4% or 431 individuals in the labor force. Within the labor force, individuals with bachelor's degree or higher education have the highest percentage of unemployment, with 6.0% or 26 of them being unemployed.
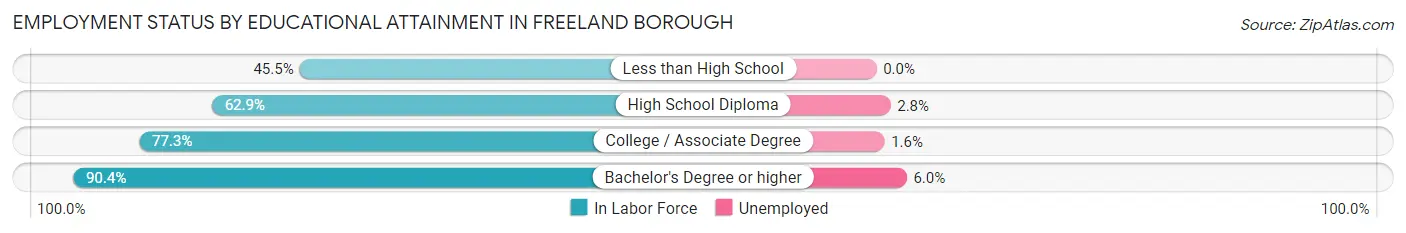
| Educational Attainment | In Labor Force | Unemployed |
| Less than High School | 51 (45.5%) | 0 (0.0%) |
| High School Diploma | 425 (62.9%) | 19 (2.8%) |
| College / Associate Degree | 486 (77.3%) | 10 (1.6%) |
| Bachelor's Degree or higher | 431 (90.4%) | 29 (6.0%) |
| Total | 1,392 (73.5%) | 63 (3.3%) |
Employment Occupations by Sex in Freeland borough
Management, Business, Science and Arts Occupations
The most common Management, Business, Science and Arts occupations in Freeland borough are Health Diagnosing & Treating (166 | 10.3%), Management (94 | 5.8%), Community & Social Service (82 | 5.1%), Business & Financial (75 | 4.6%), and Education Instruction & Library (56 | 3.5%).
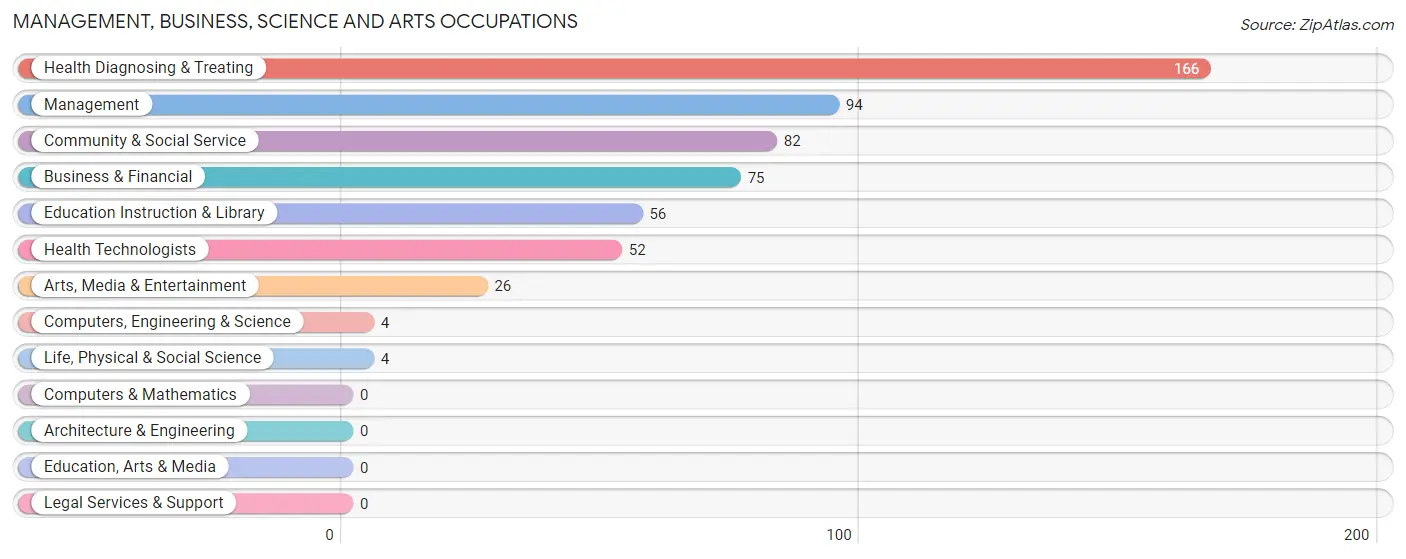
Management, Business, Science and Arts Occupations by Sex
Within the Management, Business, Science and Arts occupations in Freeland borough, the most male-oriented occupations are Health Diagnosing & Treating (90.4%), Health Technologists (69.2%), and Management (61.7%), while the most female-oriented occupations are Computers, Engineering & Science (100.0%), Life, Physical & Social Science (100.0%), and Education Instruction & Library (100.0%).
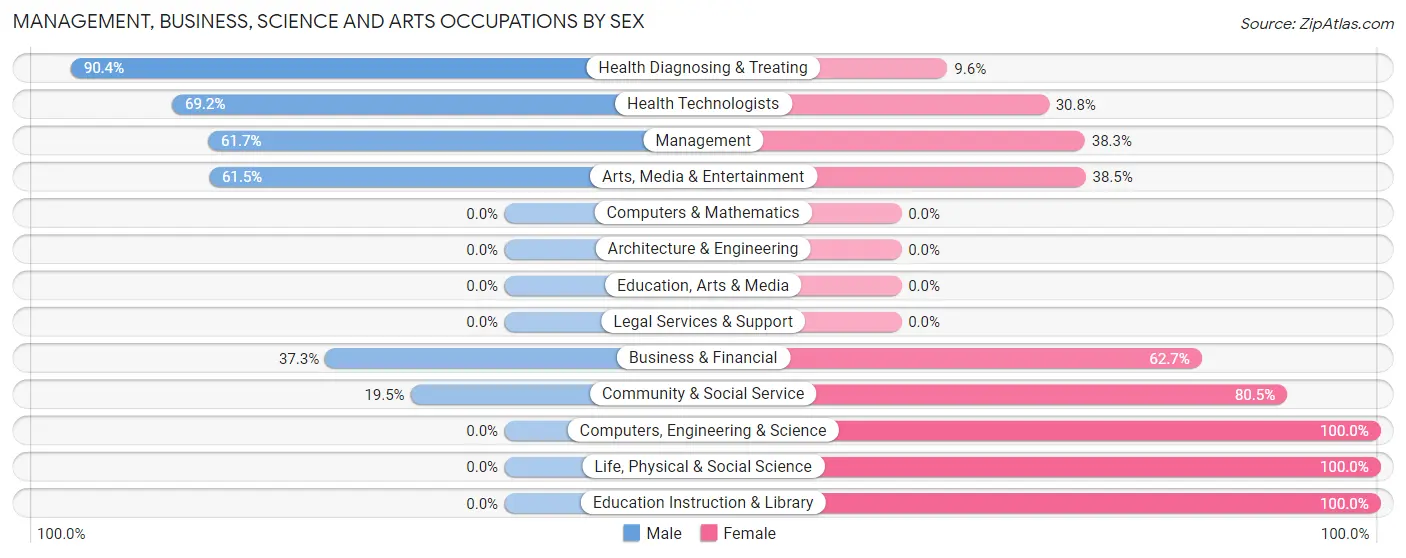
| Occupation | Male | Female |
| Management | 58 (61.7%) | 36 (38.3%) |
| Business & Financial | 28 (37.3%) | 47 (62.7%) |
| Computers, Engineering & Science | 0 (0.0%) | 4 (100.0%) |
| Computers & Mathematics | 0 (0.0%) | 0 (0.0%) |
| Architecture & Engineering | 0 (0.0%) | 0 (0.0%) |
| Life, Physical & Social Science | 0 (0.0%) | 4 (100.0%) |
| Community & Social Service | 16 (19.5%) | 66 (80.5%) |
| Education, Arts & Media | 0 (0.0%) | 0 (0.0%) |
| Legal Services & Support | 0 (0.0%) | 0 (0.0%) |
| Education Instruction & Library | 0 (0.0%) | 56 (100.0%) |
| Arts, Media & Entertainment | 16 (61.5%) | 10 (38.5%) |
| Health Diagnosing & Treating | 150 (90.4%) | 16 (9.6%) |
| Health Technologists | 36 (69.2%) | 16 (30.8%) |
| Total (Category) | 252 (59.9%) | 169 (40.1%) |
| Total (Overall) | 921 (57.0%) | 695 (43.0%) |
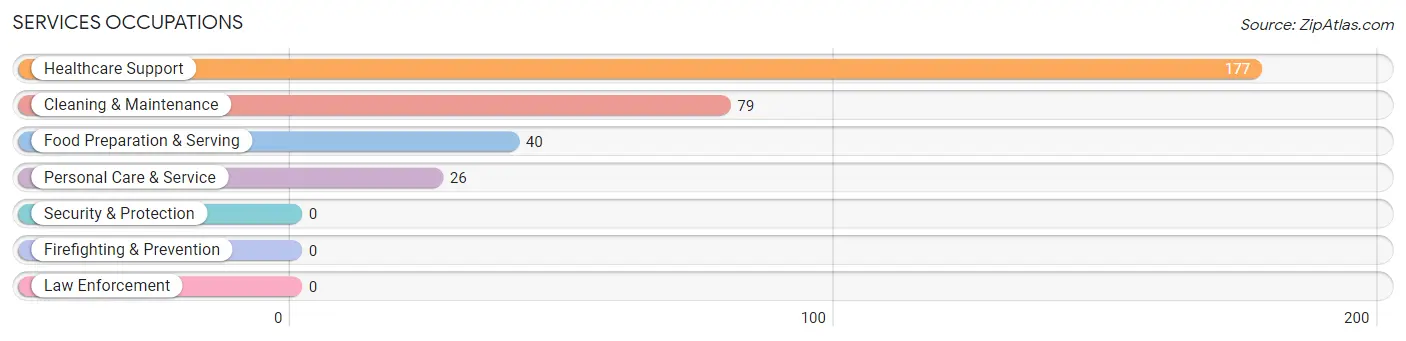
Services Occupations
The most common Services occupations in Freeland borough are Healthcare Support (177 | 11.0%), Cleaning & Maintenance (79 | 4.9%), Food Preparation & Serving (40 | 2.5%), and Personal Care & Service (26 | 1.6%).
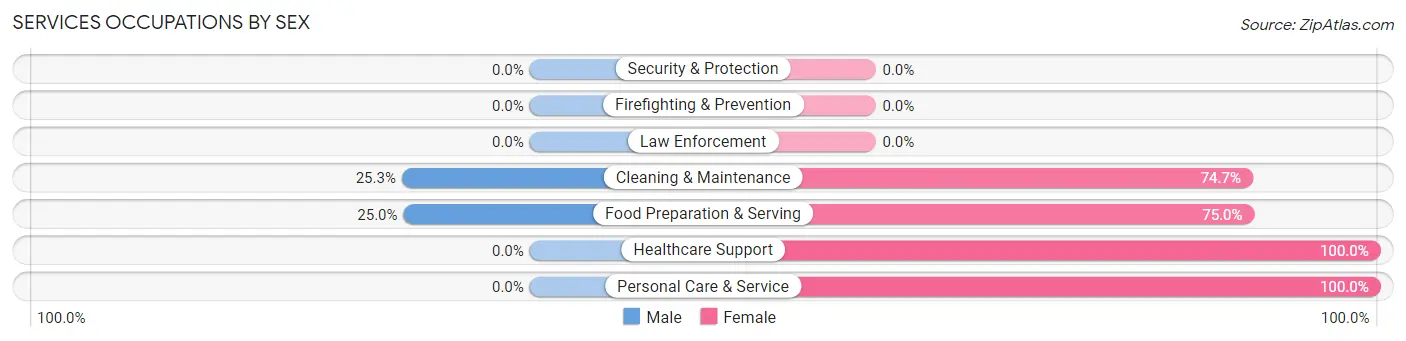
Services Occupations by Sex
Within the Services occupations in Freeland borough, the most male-oriented occupations are Cleaning & Maintenance (25.3%), and Food Preparation & Serving (25.0%), while the most female-oriented occupations are Healthcare Support (100.0%), Personal Care & Service (100.0%), and Food Preparation & Serving (75.0%).
| Occupation | Male | Female |
| Healthcare Support | 0 (0.0%) | 177 (100.0%) |
| Security & Protection | 0 (0.0%) | 0 (0.0%) |
| Firefighting & Prevention | 0 (0.0%) | 0 (0.0%) |
| Law Enforcement | 0 (0.0%) | 0 (0.0%) |
| Food Preparation & Serving | 10 (25.0%) | 30 (75.0%) |
| Cleaning & Maintenance | 20 (25.3%) | 59 (74.7%) |
| Personal Care & Service | 0 (0.0%) | 26 (100.0%) |
| Total (Category) | 30 (9.3%) | 292 (90.7%) |
| Total (Overall) | 921 (57.0%) | 695 (43.0%) |
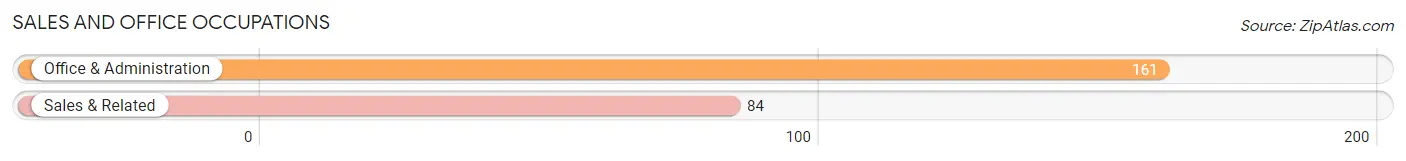
Sales and Office Occupations
The most common Sales and Office occupations in Freeland borough are Office & Administration (161 | 10.0%), and Sales & Related (84 | 5.2%).
Sales and Office Occupations by Sex
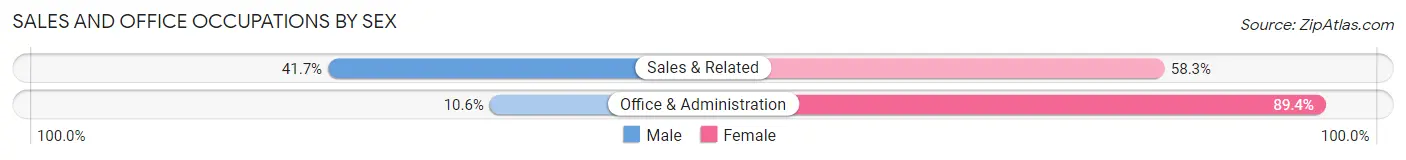
| Occupation | Male | Female |
| Sales & Related | 35 (41.7%) | 49 (58.3%) |
| Office & Administration | 17 (10.6%) | 144 (89.4%) |
| Total (Category) | 52 (21.2%) | 193 (78.8%) |
| Total (Overall) | 921 (57.0%) | 695 (43.0%) |
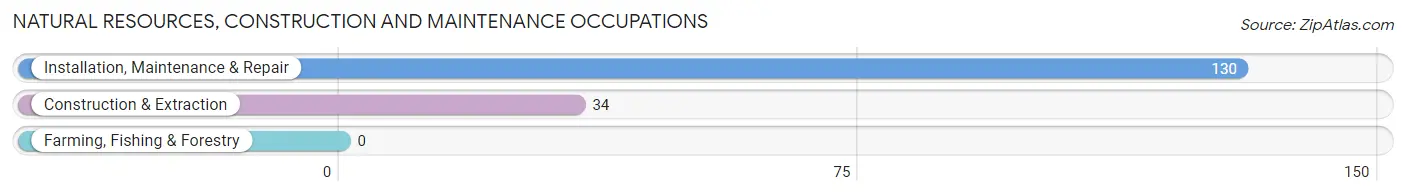
Natural Resources, Construction and Maintenance Occupations
The most common Natural Resources, Construction and Maintenance occupations in Freeland borough are Installation, Maintenance & Repair (130 | 8.0%), and Construction & Extraction (34 | 2.1%).
Natural Resources, Construction and Maintenance Occupations by Sex
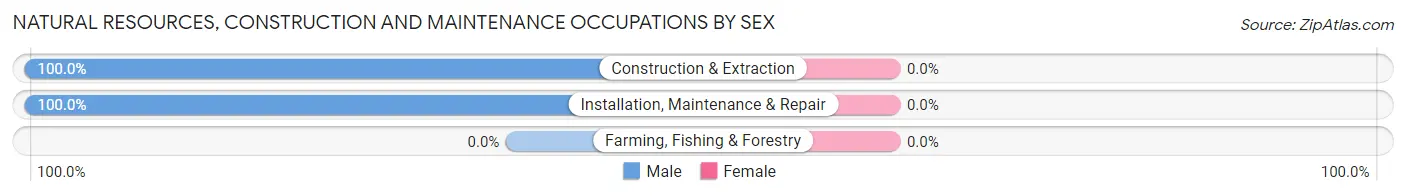
| Occupation | Male | Female |
| Farming, Fishing & Forestry | 0 (0.0%) | 0 (0.0%) |
| Construction & Extraction | 34 (100.0%) | 0 (0.0%) |
| Installation, Maintenance & Repair | 130 (100.0%) | 0 (0.0%) |
| Total (Category) | 164 (100.0%) | 0 (0.0%) |
| Total (Overall) | 921 (57.0%) | 695 (43.0%) |
Production, Transportation and Moving Occupations
The most common Production, Transportation and Moving occupations in Freeland borough are Production (186 | 11.5%), Material Moving (174 | 10.8%), and Transportation (104 | 6.4%).
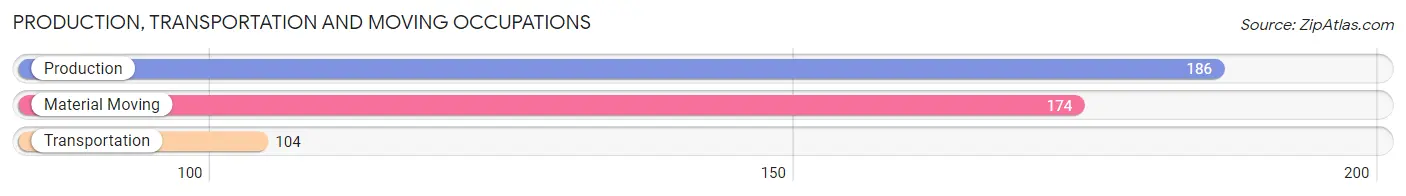
Production, Transportation and Moving Occupations by Sex
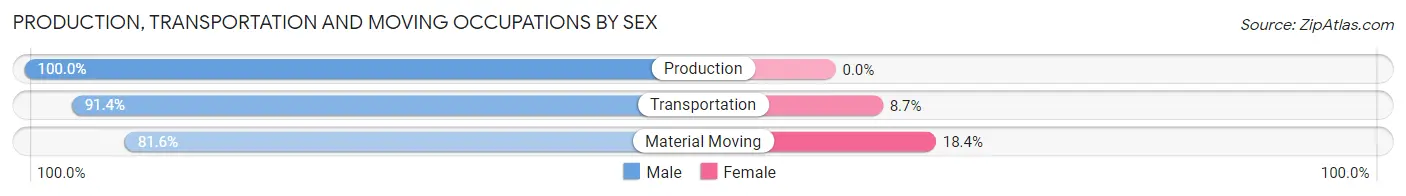
| Occupation | Male | Female |
| Production | 186 (100.0%) | 0 (0.0%) |
| Transportation | 95 (91.3%) | 9 (8.6%) |
| Material Moving | 142 (81.6%) | 32 (18.4%) |
| Total (Category) | 423 (91.2%) | 41 (8.8%) |
| Total (Overall) | 921 (57.0%) | 695 (43.0%) |
Employment Industries by Sex in Freeland borough
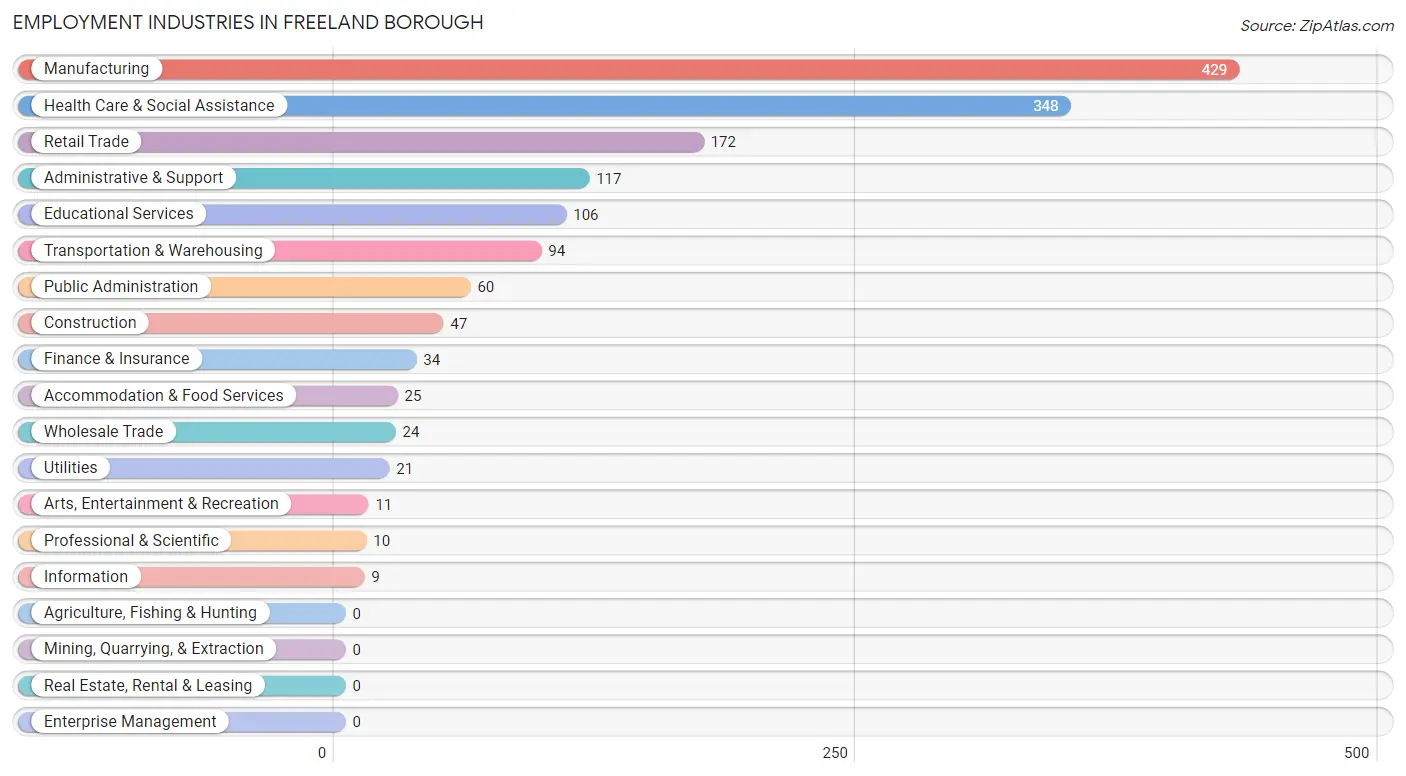
Employment Industries in Freeland borough
The major employment industries in Freeland borough include Manufacturing (429 | 26.6%), Health Care & Social Assistance (348 | 21.5%), Retail Trade (172 | 10.6%), Administrative & Support (117 | 7.2%), and Educational Services (106 | 6.6%).
Employment Industries by Sex in Freeland borough
The Freeland borough industries that see more men than women are Construction (100.0%), Utilities (100.0%), and Information (100.0%), whereas the industries that tend to have a higher number of women are Wholesale Trade (100.0%), Finance & Insurance (100.0%), and Educational Services (88.7%).
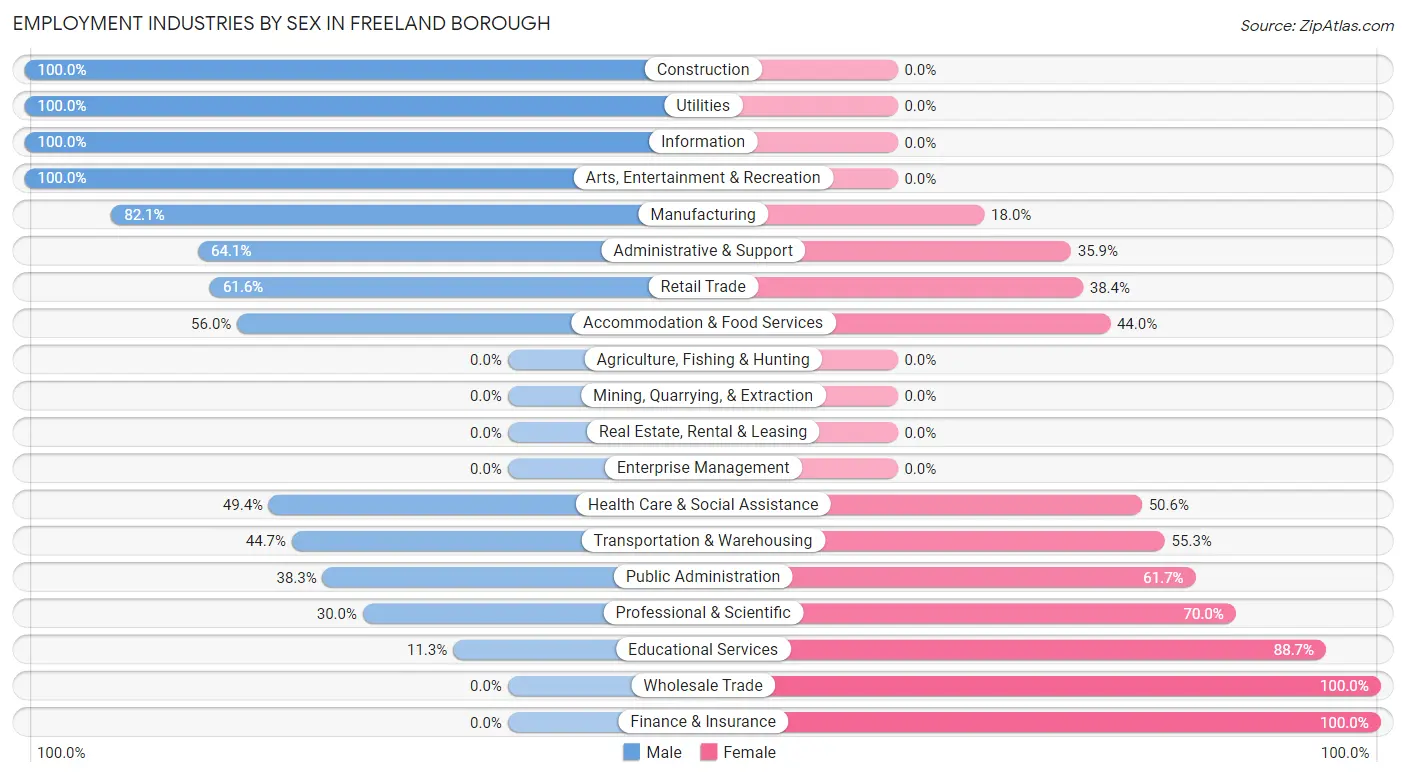
| Industry | Male | Female |
| Agriculture, Fishing & Hunting | 0 (0.0%) | 0 (0.0%) |
| Mining, Quarrying, & Extraction | 0 (0.0%) | 0 (0.0%) |
| Construction | 47 (100.0%) | 0 (0.0%) |
| Manufacturing | 352 (82.1%) | 77 (17.9%) |
| Wholesale Trade | 0 (0.0%) | 24 (100.0%) |
| Retail Trade | 106 (61.6%) | 66 (38.4%) |
| Transportation & Warehousing | 42 (44.7%) | 52 (55.3%) |
| Utilities | 21 (100.0%) | 0 (0.0%) |
| Information | 9 (100.0%) | 0 (0.0%) |
| Finance & Insurance | 0 (0.0%) | 34 (100.0%) |
| Real Estate, Rental & Leasing | 0 (0.0%) | 0 (0.0%) |
| Professional & Scientific | 3 (30.0%) | 7 (70.0%) |
| Enterprise Management | 0 (0.0%) | 0 (0.0%) |
| Administrative & Support | 75 (64.1%) | 42 (35.9%) |
| Educational Services | 12 (11.3%) | 94 (88.7%) |
| Health Care & Social Assistance | 172 (49.4%) | 176 (50.6%) |
| Arts, Entertainment & Recreation | 11 (100.0%) | 0 (0.0%) |
| Accommodation & Food Services | 14 (56.0%) | 11 (44.0%) |
| Public Administration | 23 (38.3%) | 37 (61.7%) |
| Total | 921 (57.0%) | 695 (43.0%) |
Education in Freeland borough
School Enrollment in Freeland borough
The most common levels of schooling among the 891 students in Freeland borough are elementary school (285 | 32.0%), college / undergraduate (230 | 25.8%), and middle school (148 | 16.6%).
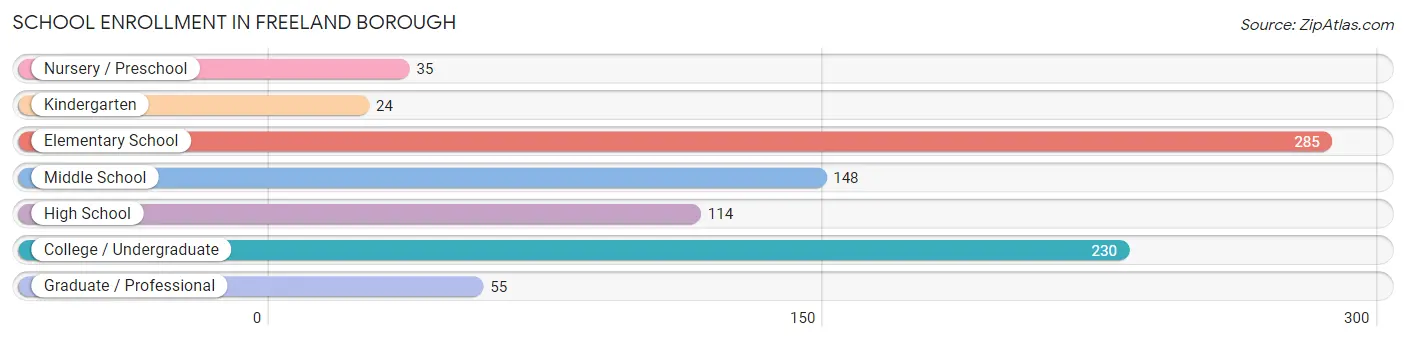
| School Level | # Students | % Students |
| Nursery / Preschool | 35 | 3.9% |
| Kindergarten | 24 | 2.7% |
| Elementary School | 285 | 32.0% |
| Middle School | 148 | 16.6% |
| High School | 114 | 12.8% |
| College / Undergraduate | 230 | 25.8% |
| Graduate / Professional | 55 | 6.2% |
| Total | 891 | 100.0% |
School Enrollment by Age by Funding Source in Freeland borough
Out of a total of 891 students who are enrolled in schools in Freeland borough, 114 (12.8%) attend a private institution, while the remaining 777 (87.2%) are enrolled in public schools. The age group of 35 years and over has the highest likelihood of being enrolled in private schools, with 27 (55.1% in the age bracket) enrolled. Conversely, the age group of 3 to 4 year olds has the lowest likelihood of being enrolled in a private school, with 35 (100.0% in the age bracket) attending a public institution.
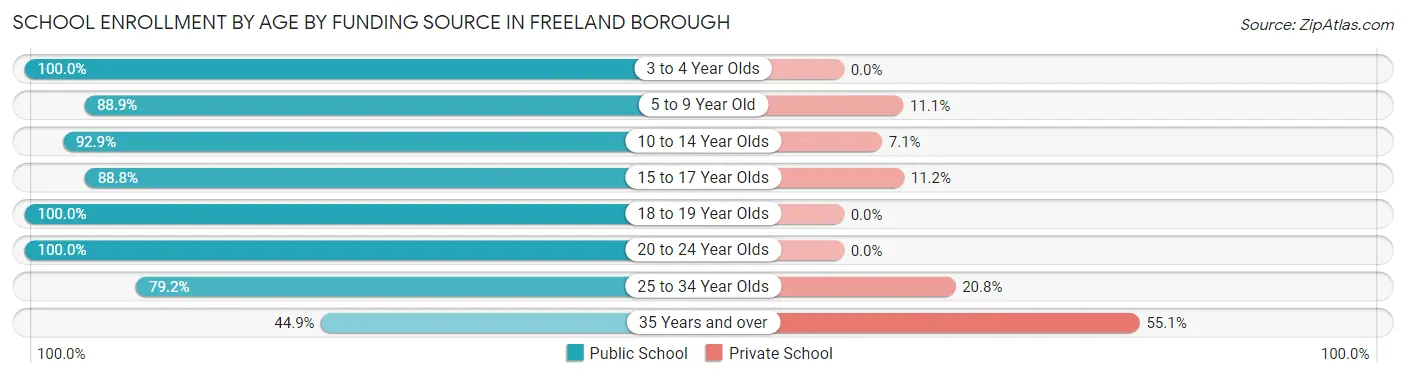
| Age Bracket | Public School | Private School |
| 3 to 4 Year Olds | 35 (100.0%) | 0 (0.0%) |
| 5 to 9 Year Old | 209 (88.9%) | 26 (11.1%) |
| 10 to 14 Year Olds | 196 (92.9%) | 15 (7.1%) |
| 15 to 17 Year Olds | 111 (88.8%) | 14 (11.2%) |
| 18 to 19 Year Olds | 27 (100.0%) | 0 (0.0%) |
| 20 to 24 Year Olds | 55 (100.0%) | 0 (0.0%) |
| 25 to 34 Year Olds | 122 (79.2%) | 32 (20.8%) |
| 35 Years and over | 22 (44.9%) | 27 (55.1%) |
| Total | 777 (87.2%) | 114 (12.8%) |
Educational Attainment by Field of Study in Freeland borough
Computers & mathematics (101 | 17.7%), education (92 | 16.1%), science & technology (83 | 14.5%), business (75 | 13.1%), and liberal arts & history (49 | 8.6%) are the most common fields of study among 571 individuals in Freeland borough who have obtained a bachelor's degree or higher.
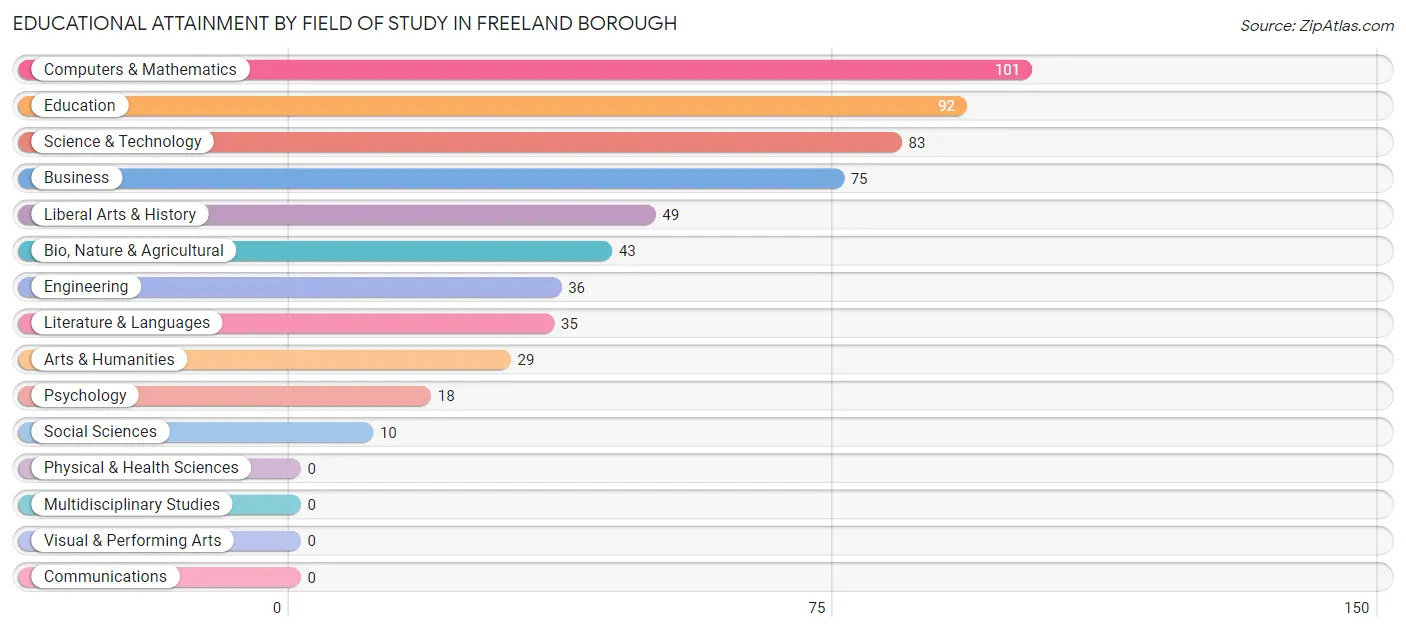
| Field of Study | # Graduates | % Graduates |
| Computers & Mathematics | 101 | 17.7% |
| Bio, Nature & Agricultural | 43 | 7.5% |
| Physical & Health Sciences | 0 | 0.0% |
| Psychology | 18 | 3.2% |
| Social Sciences | 10 | 1.8% |
| Engineering | 36 | 6.3% |
| Multidisciplinary Studies | 0 | 0.0% |
| Science & Technology | 83 | 14.5% |
| Business | 75 | 13.1% |
| Education | 92 | 16.1% |
| Literature & Languages | 35 | 6.1% |
| Liberal Arts & History | 49 | 8.6% |
| Visual & Performing Arts | 0 | 0.0% |
| Communications | 0 | 0.0% |
| Arts & Humanities | 29 | 5.1% |
| Total | 571 | 100.0% |
Transportation & Commute in Freeland borough
Vehicle Availability by Sex in Freeland borough
The most prevalent vehicle ownership categories in Freeland borough are males with 2 vehicles (481, accounting for 53.0%) and females with 2 vehicles (258, making up 70.4%).
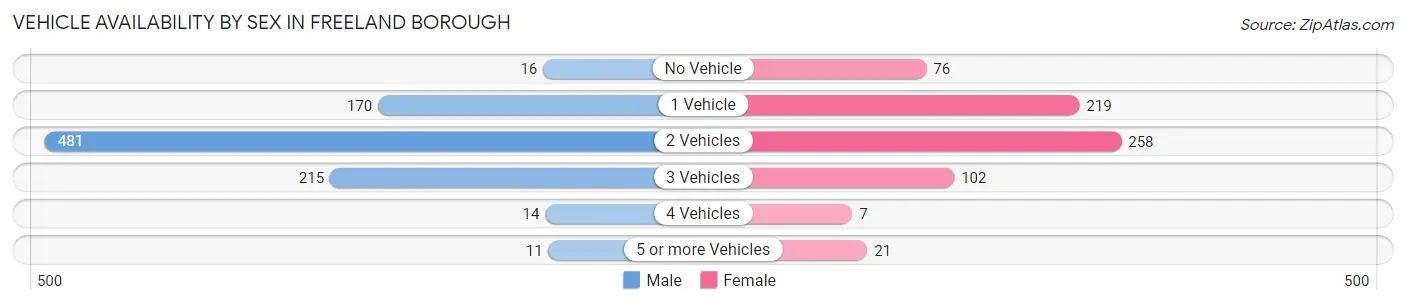
| Vehicles Available | Male | Female |
| No Vehicle | 16 (1.8%) | 76 (11.1%) |
| 1 Vehicle | 170 (18.7%) | 219 (32.1%) |
| 2 Vehicles | 481 (53.0%) | 258 (37.8%) |
| 3 Vehicles | 215 (23.7%) | 102 (14.9%) |
| 4 Vehicles | 14 (1.5%) | 7 (1.0%) |
| 5 or more Vehicles | 11 (1.2%) | 21 (3.1%) |
| Total | 907 (100.0%) | 683 (100.0%) |
Commute Time in Freeland borough
The most frequently occuring commute durations in Freeland borough are 20 to 24 minutes (270 commuters, 17.9%), 30 to 34 minutes (242 commuters, 16.1%), and 15 to 19 minutes (233 commuters, 15.5%).
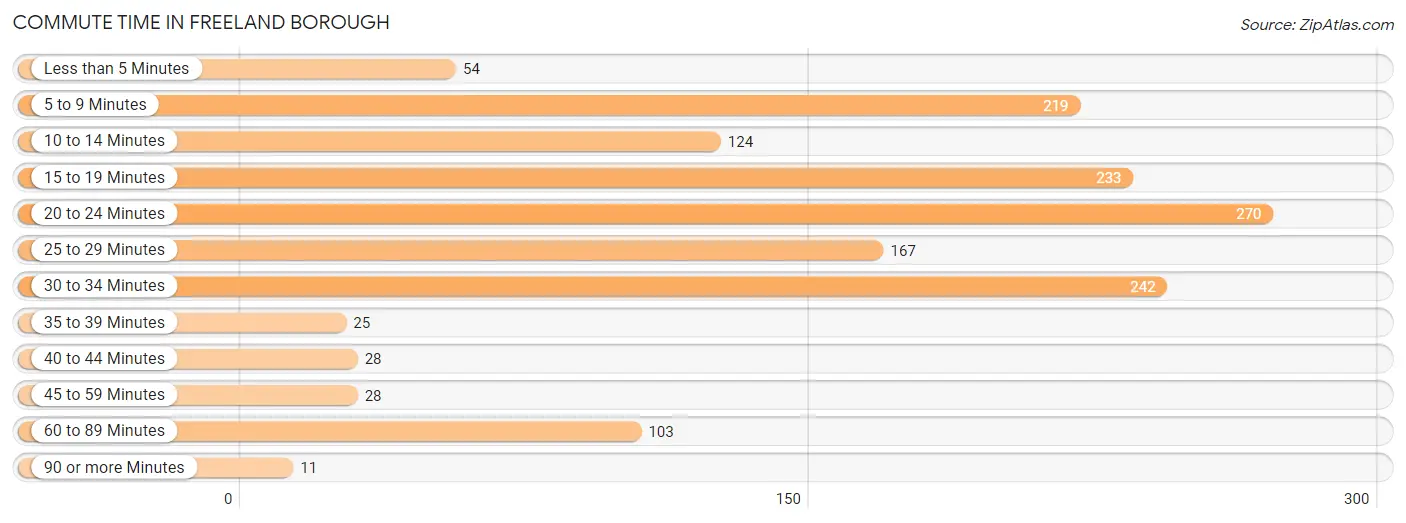
| Commute Time | # Commuters | % Commuters |
| Less than 5 Minutes | 54 | 3.6% |
| 5 to 9 Minutes | 219 | 14.6% |
| 10 to 14 Minutes | 124 | 8.2% |
| 15 to 19 Minutes | 233 | 15.5% |
| 20 to 24 Minutes | 270 | 17.9% |
| 25 to 29 Minutes | 167 | 11.1% |
| 30 to 34 Minutes | 242 | 16.1% |
| 35 to 39 Minutes | 25 | 1.7% |
| 40 to 44 Minutes | 28 | 1.9% |
| 45 to 59 Minutes | 28 | 1.9% |
| 60 to 89 Minutes | 103 | 6.9% |
| 90 or more Minutes | 11 | 0.7% |
Commute Time by Sex in Freeland borough
The most common commute times in Freeland borough are 5 to 9 minutes (188 commuters, 20.8%) for males and 30 to 34 minutes (165 commuters, 27.5%) for females.
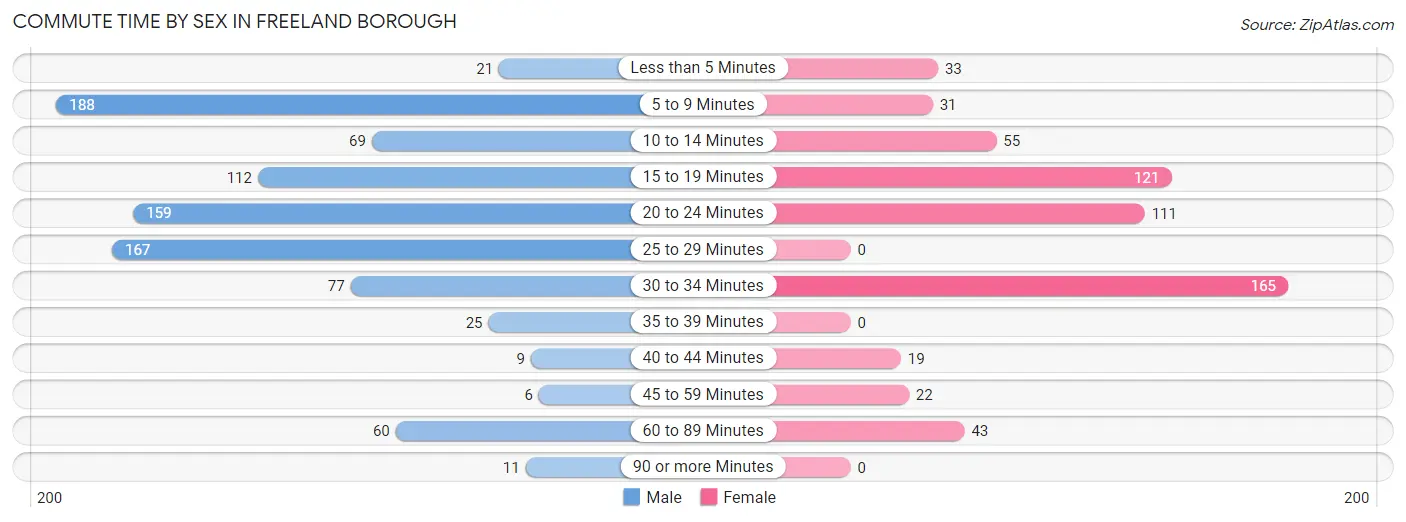
| Commute Time | Male | Female |
| Less than 5 Minutes | 21 (2.3%) | 33 (5.5%) |
| 5 to 9 Minutes | 188 (20.8%) | 31 (5.2%) |
| 10 to 14 Minutes | 69 (7.6%) | 55 (9.2%) |
| 15 to 19 Minutes | 112 (12.4%) | 121 (20.2%) |
| 20 to 24 Minutes | 159 (17.6%) | 111 (18.5%) |
| 25 to 29 Minutes | 167 (18.5%) | 0 (0.0%) |
| 30 to 34 Minutes | 77 (8.5%) | 165 (27.5%) |
| 35 to 39 Minutes | 25 (2.8%) | 0 (0.0%) |
| 40 to 44 Minutes | 9 (1.0%) | 19 (3.2%) |
| 45 to 59 Minutes | 6 (0.7%) | 22 (3.7%) |
| 60 to 89 Minutes | 60 (6.6%) | 43 (7.2%) |
| 90 or more Minutes | 11 (1.2%) | 0 (0.0%) |
Time of Departure to Work by Sex in Freeland borough
The most frequent times of departure to work in Freeland borough are 12:00 AM to 4:59 AM (240, 26.6%) for males and 8:00 AM to 8:29 AM (138, 23.0%) for females.
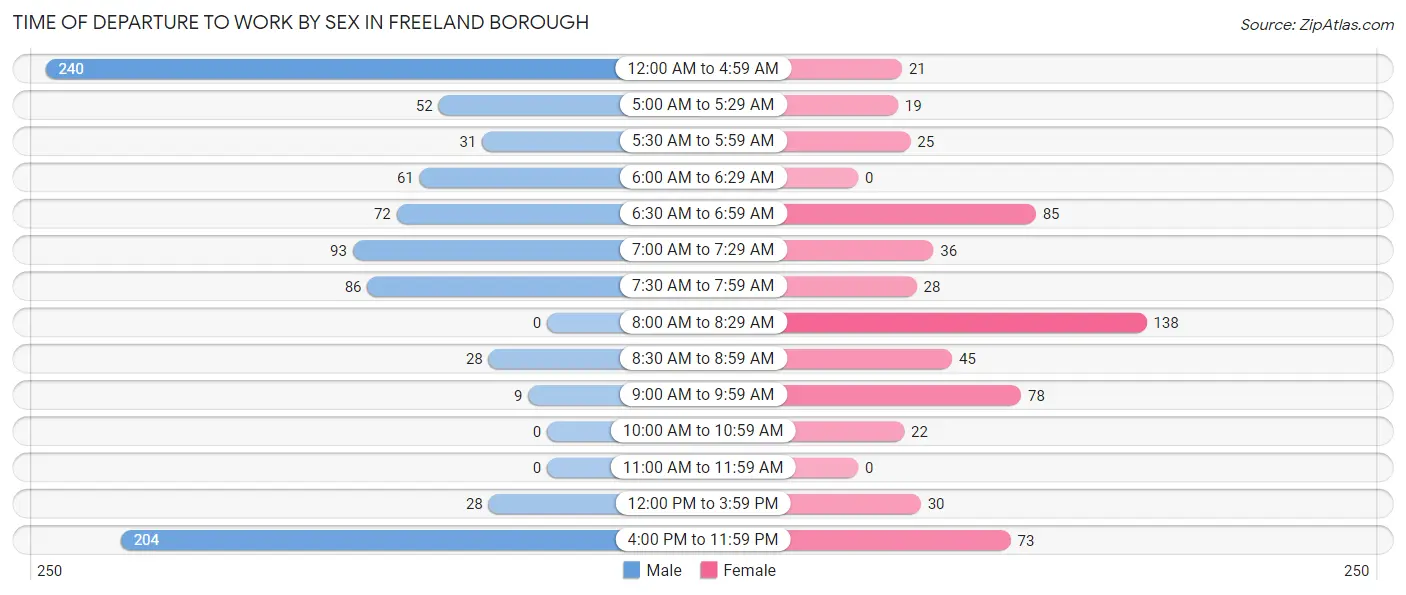
| Time of Departure | Male | Female |
| 12:00 AM to 4:59 AM | 240 (26.6%) | 21 (3.5%) |
| 5:00 AM to 5:29 AM | 52 (5.8%) | 19 (3.2%) |
| 5:30 AM to 5:59 AM | 31 (3.4%) | 25 (4.2%) |
| 6:00 AM to 6:29 AM | 61 (6.8%) | 0 (0.0%) |
| 6:30 AM to 6:59 AM | 72 (8.0%) | 85 (14.2%) |
| 7:00 AM to 7:29 AM | 93 (10.3%) | 36 (6.0%) |
| 7:30 AM to 7:59 AM | 86 (9.5%) | 28 (4.7%) |
| 8:00 AM to 8:29 AM | 0 (0.0%) | 138 (23.0%) |
| 8:30 AM to 8:59 AM | 28 (3.1%) | 45 (7.5%) |
| 9:00 AM to 9:59 AM | 9 (1.0%) | 78 (13.0%) |
| 10:00 AM to 10:59 AM | 0 (0.0%) | 22 (3.7%) |
| 11:00 AM to 11:59 AM | 0 (0.0%) | 0 (0.0%) |
| 12:00 PM to 3:59 PM | 28 (3.1%) | 30 (5.0%) |
| 4:00 PM to 11:59 PM | 204 (22.6%) | 73 (12.2%) |
| Total | 904 (100.0%) | 600 (100.0%) |
Housing Occupancy in Freeland borough
Occupancy by Ownership in Freeland borough
Of the total 1,608 dwellings in Freeland borough, owner-occupied units account for 804 (50.0%), while renter-occupied units make up 804 (50.0%).
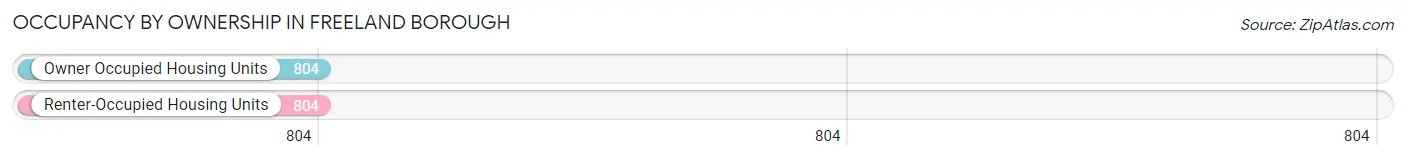
| Occupancy | # Housing Units | % Housing Units |
| Owner Occupied Housing Units | 804 | 50.0% |
| Renter-Occupied Housing Units | 804 | 50.0% |
| Total Occupied Housing Units | 1,608 | 100.0% |
Occupancy by Household Size in Freeland borough
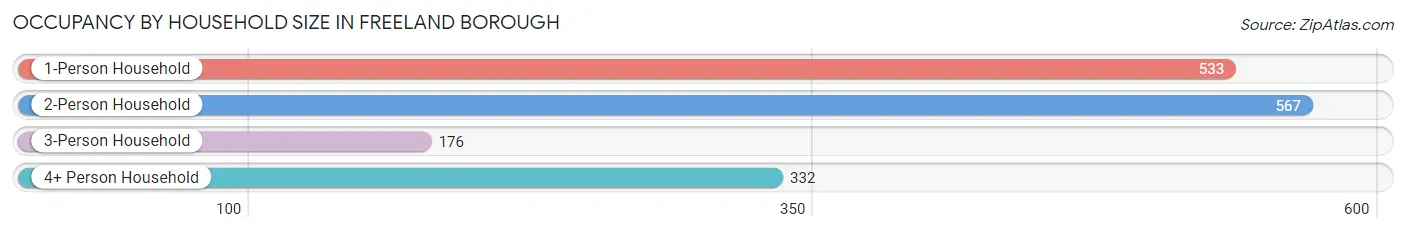
| Household Size | # Housing Units | % Housing Units |
| 1-Person Household | 533 | 33.2% |
| 2-Person Household | 567 | 35.3% |
| 3-Person Household | 176 | 11.0% |
| 4+ Person Household | 332 | 20.6% |
| Total Housing Units | 1,608 | 100.0% |
Occupancy by Ownership by Household Size in Freeland borough
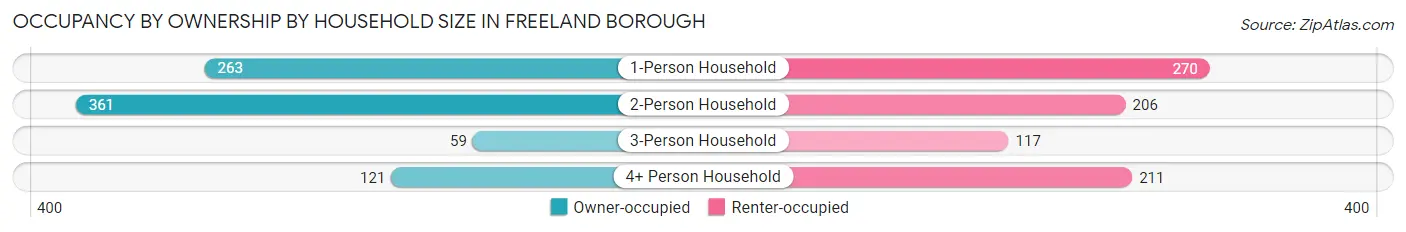
| Household Size | Owner-occupied | Renter-occupied |
| 1-Person Household | 263 (49.3%) | 270 (50.7%) |
| 2-Person Household | 361 (63.7%) | 206 (36.3%) |
| 3-Person Household | 59 (33.5%) | 117 (66.5%) |
| 4+ Person Household | 121 (36.4%) | 211 (63.5%) |
| Total Housing Units | 804 (50.0%) | 804 (50.0%) |
Occupancy by Educational Attainment in Freeland borough
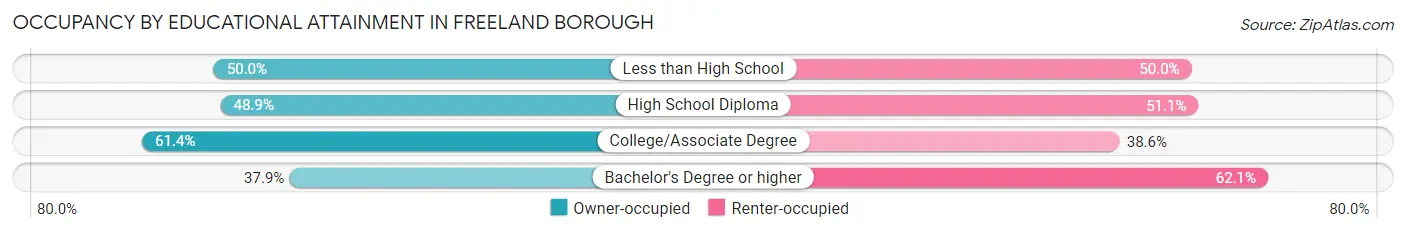
| Household Size | Owner-occupied | Renter-occupied |
| Less than High School | 41 (50.0%) | 41 (50.0%) |
| High School Diploma | 316 (48.9%) | 330 (51.1%) |
| College/Associate Degree | 297 (61.4%) | 187 (38.6%) |
| Bachelor's Degree or higher | 150 (37.9%) | 246 (62.1%) |
Occupancy by Age of Householder in Freeland borough
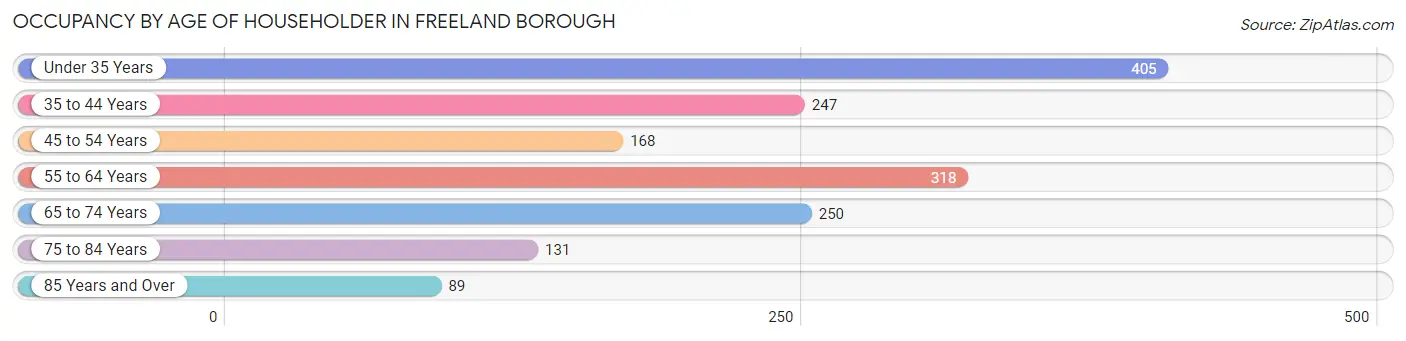
| Age Bracket | # Households | % Households |
| Under 35 Years | 405 | 25.2% |
| 35 to 44 Years | 247 | 15.4% |
| 45 to 54 Years | 168 | 10.4% |
| 55 to 64 Years | 318 | 19.8% |
| 65 to 74 Years | 250 | 15.5% |
| 75 to 84 Years | 131 | 8.2% |
| 85 Years and Over | 89 | 5.5% |
| Total | 1,608 | 100.0% |
Housing Finances in Freeland borough
Median Income by Occupancy in Freeland borough
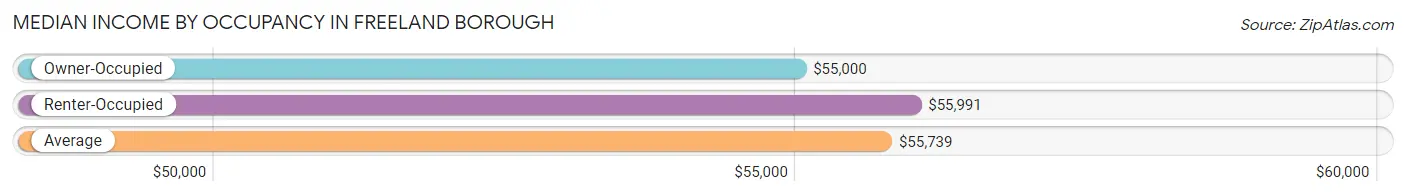
| Occupancy Type | # Households | Median Income |
| Owner-Occupied | 804 (50.0%) | $55,000 |
| Renter-Occupied | 804 (50.0%) | $55,991 |
| Average | 1,608 (100.0%) | $55,739 |
Occupancy by Householder Income Bracket in Freeland borough
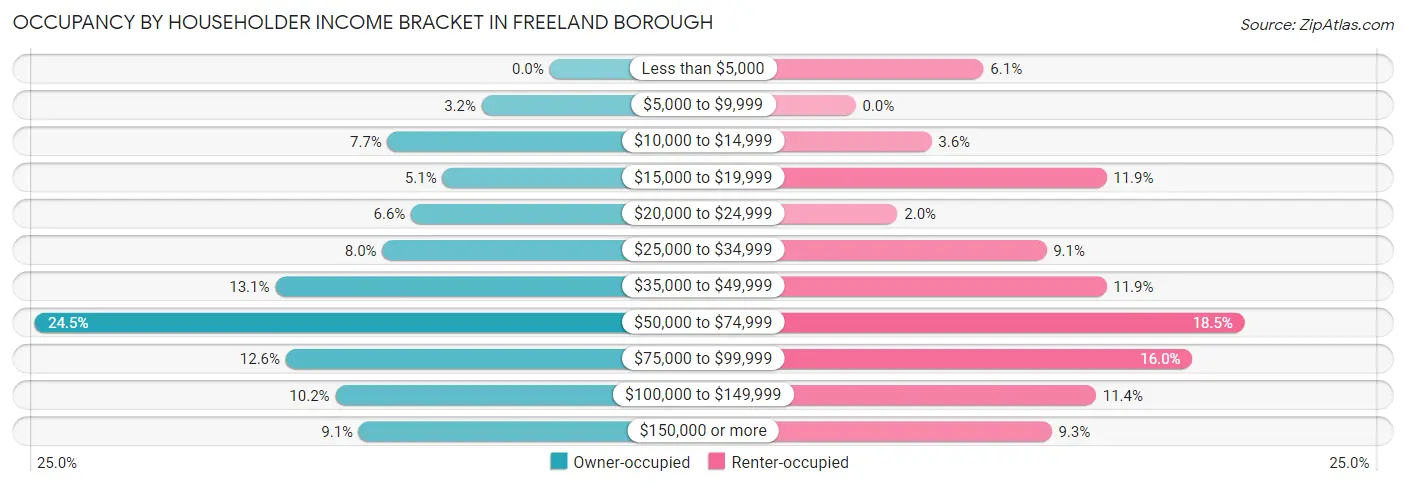
| Income Bracket | Owner-occupied | Renter-occupied |
| Less than $5,000 | 0 (0.0%) | 49 (6.1%) |
| $5,000 to $9,999 | 26 (3.2%) | 0 (0.0%) |
| $10,000 to $14,999 | 62 (7.7%) | 29 (3.6%) |
| $15,000 to $19,999 | 41 (5.1%) | 96 (11.9%) |
| $20,000 to $24,999 | 53 (6.6%) | 16 (2.0%) |
| $25,000 to $34,999 | 64 (8.0%) | 73 (9.1%) |
| $35,000 to $49,999 | 105 (13.1%) | 96 (11.9%) |
| $50,000 to $74,999 | 197 (24.5%) | 149 (18.5%) |
| $75,000 to $99,999 | 101 (12.6%) | 129 (16.0%) |
| $100,000 to $149,999 | 82 (10.2%) | 92 (11.4%) |
| $150,000 or more | 73 (9.1%) | 75 (9.3%) |
| Total | 804 (100.0%) | 804 (100.0%) |
Monthly Housing Cost Tiers in Freeland borough
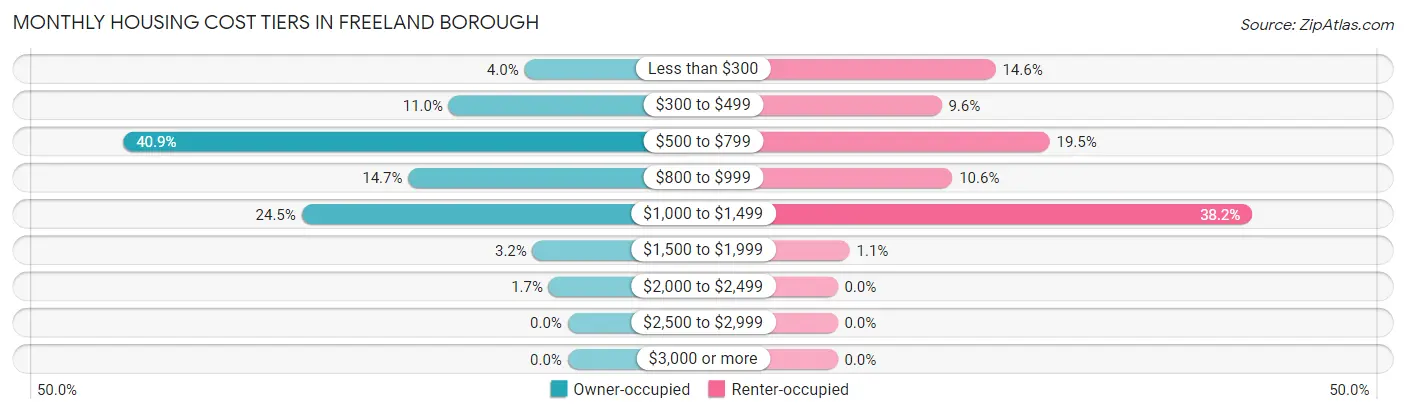
| Monthly Cost | Owner-occupied | Renter-occupied |
| Less than $300 | 32 (4.0%) | 117 (14.5%) |
| $300 to $499 | 88 (11.0%) | 77 (9.6%) |
| $500 to $799 | 329 (40.9%) | 157 (19.5%) |
| $800 to $999 | 118 (14.7%) | 85 (10.6%) |
| $1,000 to $1,499 | 197 (24.5%) | 307 (38.2%) |
| $1,500 to $1,999 | 26 (3.2%) | 9 (1.1%) |
| $2,000 to $2,499 | 14 (1.7%) | 0 (0.0%) |
| $2,500 to $2,999 | 0 (0.0%) | 0 (0.0%) |
| $3,000 or more | 0 (0.0%) | 0 (0.0%) |
| Total | 804 (100.0%) | 804 (100.0%) |
Physical Housing Characteristics in Freeland borough
Housing Structures in Freeland borough
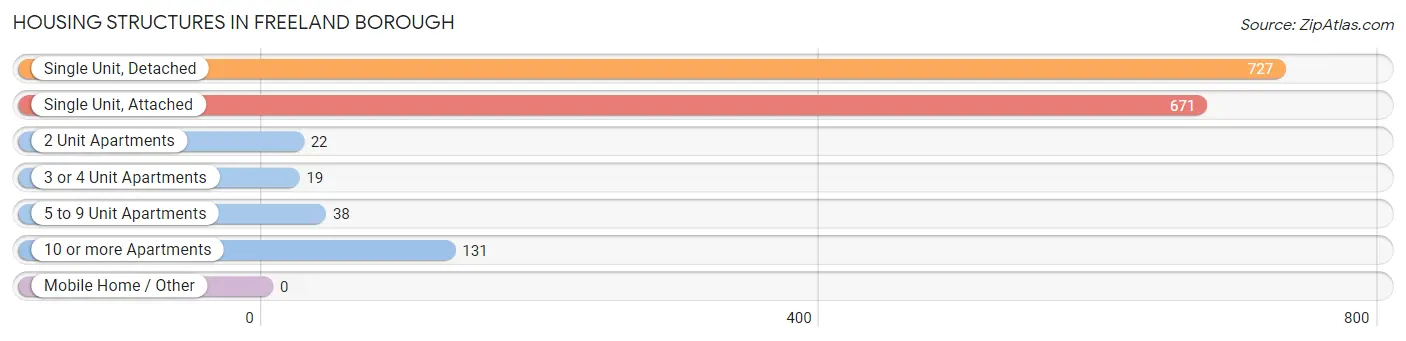
| Structure Type | # Housing Units | % Housing Units |
| Single Unit, Detached | 727 | 45.2% |
| Single Unit, Attached | 671 | 41.7% |
| 2 Unit Apartments | 22 | 1.4% |
| 3 or 4 Unit Apartments | 19 | 1.2% |
| 5 to 9 Unit Apartments | 38 | 2.4% |
| 10 or more Apartments | 131 | 8.2% |
| Mobile Home / Other | 0 | 0.0% |
| Total | 1,608 | 100.0% |
Housing Structures by Occupancy in Freeland borough
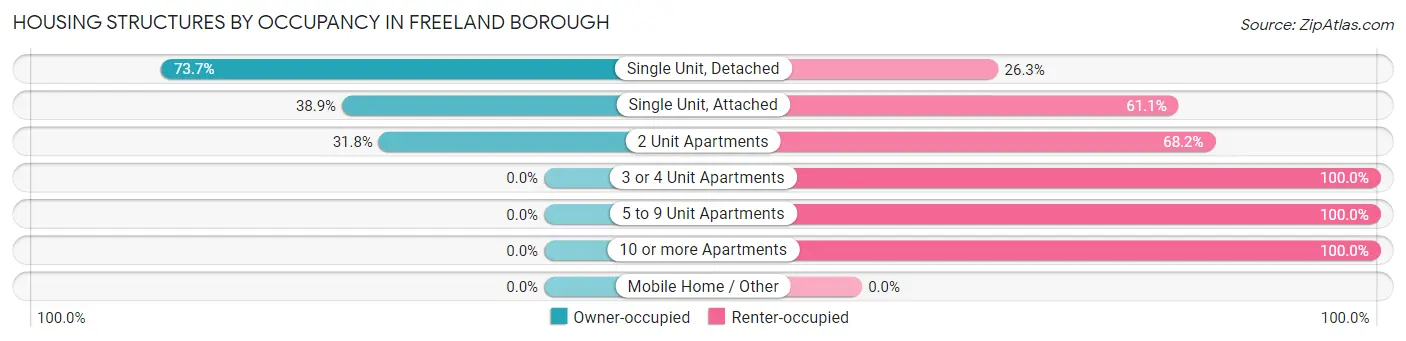
| Structure Type | Owner-occupied | Renter-occupied |
| Single Unit, Detached | 536 (73.7%) | 191 (26.3%) |
| Single Unit, Attached | 261 (38.9%) | 410 (61.1%) |
| 2 Unit Apartments | 7 (31.8%) | 15 (68.2%) |
| 3 or 4 Unit Apartments | 0 (0.0%) | 19 (100.0%) |
| 5 to 9 Unit Apartments | 0 (0.0%) | 38 (100.0%) |
| 10 or more Apartments | 0 (0.0%) | 131 (100.0%) |
| Mobile Home / Other | 0 (0.0%) | 0 (0.0%) |
| Total | 804 (50.0%) | 804 (50.0%) |
Housing Structures by Number of Rooms in Freeland borough
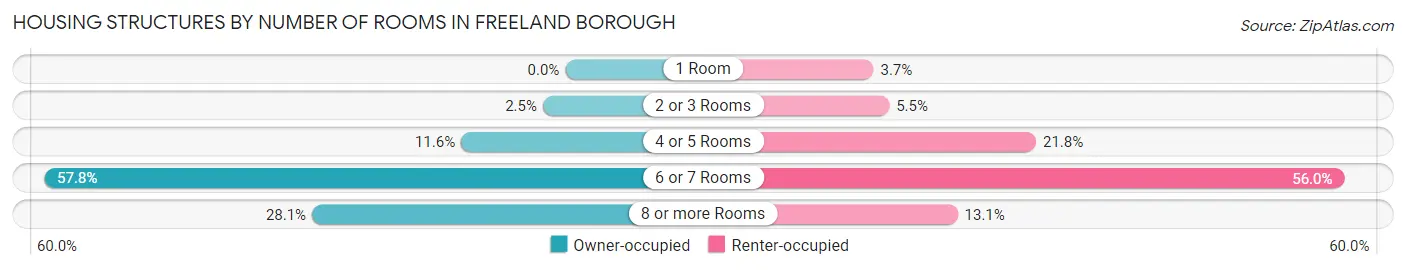
| Number of Rooms | Owner-occupied | Renter-occupied |
| 1 Room | 0 (0.0%) | 30 (3.7%) |
| 2 or 3 Rooms | 20 (2.5%) | 44 (5.5%) |
| 4 or 5 Rooms | 93 (11.6%) | 175 (21.8%) |
| 6 or 7 Rooms | 465 (57.8%) | 450 (56.0%) |
| 8 or more Rooms | 226 (28.1%) | 105 (13.1%) |
| Total | 804 (100.0%) | 804 (100.0%) |
Housing Structure by Heating Type in Freeland borough
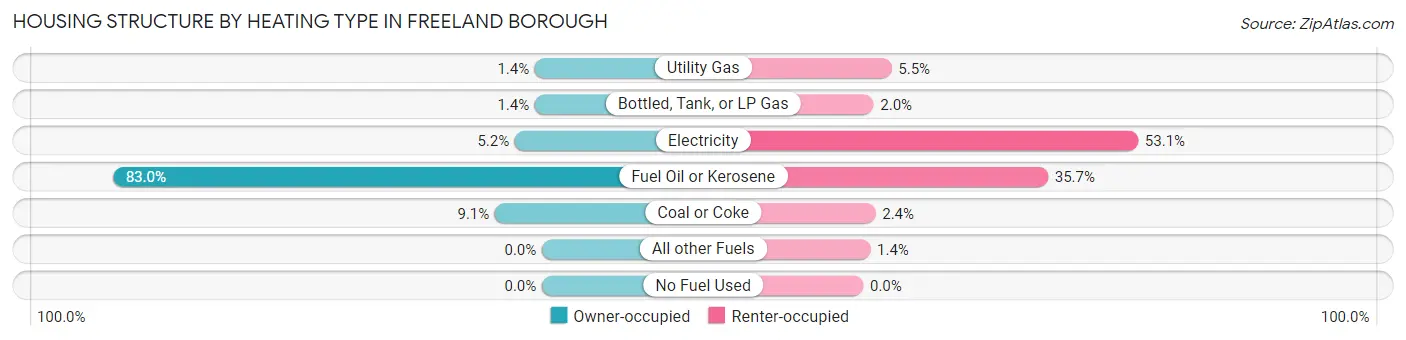
| Heating Type | Owner-occupied | Renter-occupied |
| Utility Gas | 11 (1.4%) | 44 (5.5%) |
| Bottled, Tank, or LP Gas | 11 (1.4%) | 16 (2.0%) |
| Electricity | 42 (5.2%) | 427 (53.1%) |
| Fuel Oil or Kerosene | 667 (83.0%) | 287 (35.7%) |
| Coal or Coke | 73 (9.1%) | 19 (2.4%) |
| All other Fuels | 0 (0.0%) | 11 (1.4%) |
| No Fuel Used | 0 (0.0%) | 0 (0.0%) |
| Total | 804 (100.0%) | 804 (100.0%) |
Household Vehicle Usage in Freeland borough
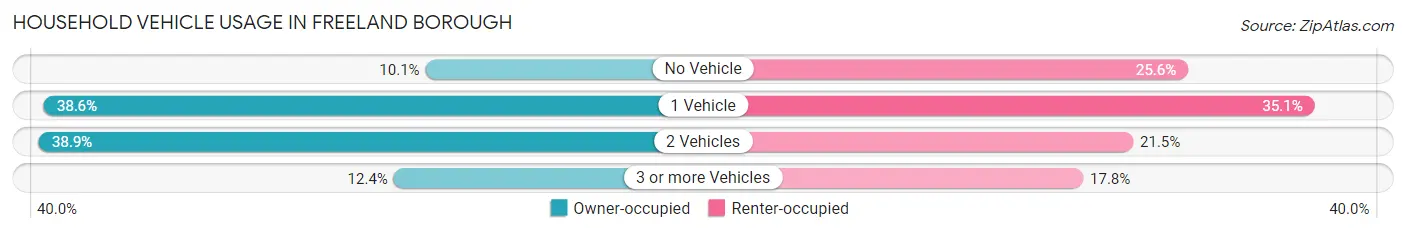
| Vehicles per Household | Owner-occupied | Renter-occupied |
| No Vehicle | 81 (10.1%) | 206 (25.6%) |
| 1 Vehicle | 310 (38.6%) | 282 (35.1%) |
| 2 Vehicles | 313 (38.9%) | 173 (21.5%) |
| 3 or more Vehicles | 100 (12.4%) | 143 (17.8%) |
| Total | 804 (100.0%) | 804 (100.0%) |
Real Estate & Mortgages in Freeland borough
Real Estate and Mortgage Overview in Freeland borough
| Characteristic | Without Mortgage | With Mortgage |
| Housing Units | 376 | 428 |
| Median Property Value | $91,000 | $94,600 |
| Median Household Income | $37,222 | $52 |
| Monthly Housing Costs | $578 | $0 |
| Real Estate Taxes | $1,298 | $20 |
Property Value by Mortgage Status in Freeland borough
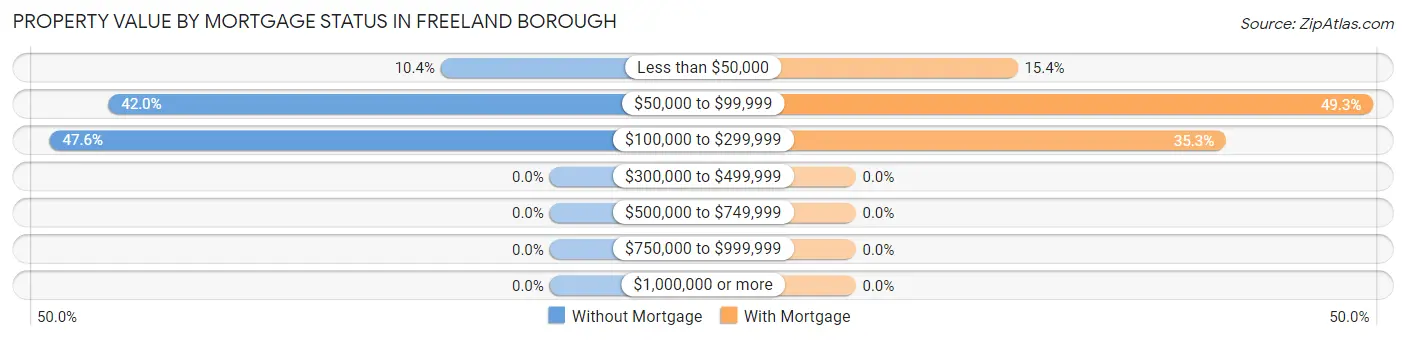
| Property Value | Without Mortgage | With Mortgage |
| Less than $50,000 | 39 (10.4%) | 66 (15.4%) |
| $50,000 to $99,999 | 158 (42.0%) | 211 (49.3%) |
| $100,000 to $299,999 | 179 (47.6%) | 151 (35.3%) |
| $300,000 to $499,999 | 0 (0.0%) | 0 (0.0%) |
| $500,000 to $749,999 | 0 (0.0%) | 0 (0.0%) |
| $750,000 to $999,999 | 0 (0.0%) | 0 (0.0%) |
| $1,000,000 or more | 0 (0.0%) | 0 (0.0%) |
| Total | 376 (100.0%) | 428 (100.0%) |
Household Income by Mortgage Status in Freeland borough
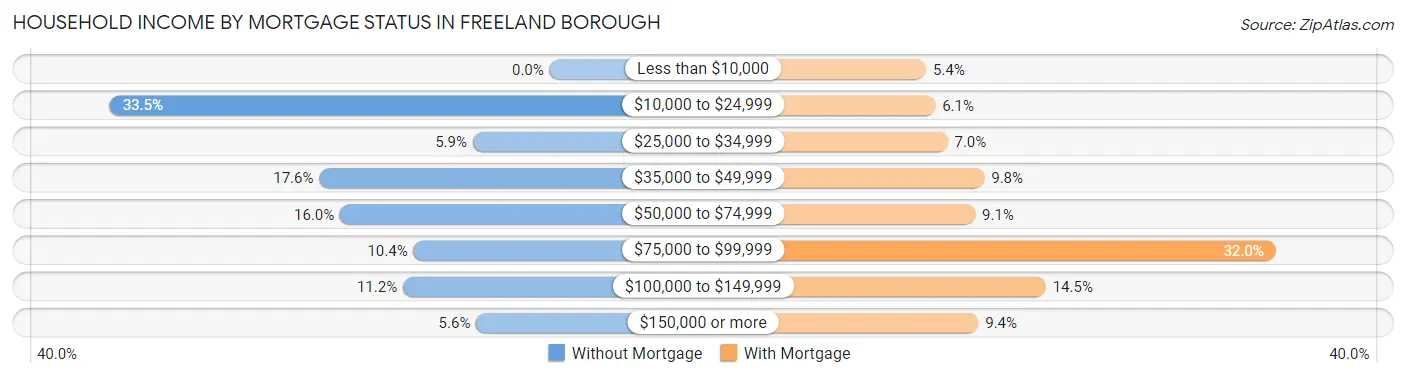
| Household Income | Without Mortgage | With Mortgage |
| Less than $10,000 | 0 (0.0%) | 23 (5.4%) |
| $10,000 to $24,999 | 126 (33.5%) | 26 (6.1%) |
| $25,000 to $34,999 | 22 (5.9%) | 30 (7.0%) |
| $35,000 to $49,999 | 66 (17.5%) | 42 (9.8%) |
| $50,000 to $74,999 | 60 (16.0%) | 39 (9.1%) |
| $75,000 to $99,999 | 39 (10.4%) | 137 (32.0%) |
| $100,000 to $149,999 | 42 (11.2%) | 62 (14.5%) |
| $150,000 or more | 21 (5.6%) | 40 (9.3%) |
| Total | 376 (100.0%) | 428 (100.0%) |
Property Value to Household Income Ratio in Freeland borough
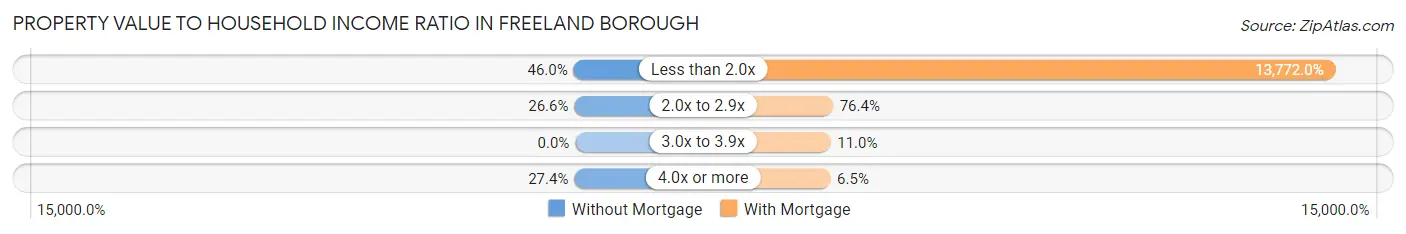
| Value-to-Income Ratio | Without Mortgage | With Mortgage |
| Less than 2.0x | 173 (46.0%) | 58,944 (13,772.0%) |
| 2.0x to 2.9x | 100 (26.6%) | 327 (76.4%) |
| 3.0x to 3.9x | 0 (0.0%) | 47 (11.0%) |
| 4.0x or more | 103 (27.4%) | 28 (6.5%) |
| Total | 376 (100.0%) | 428 (100.0%) |
Real Estate Taxes by Mortgage Status in Freeland borough
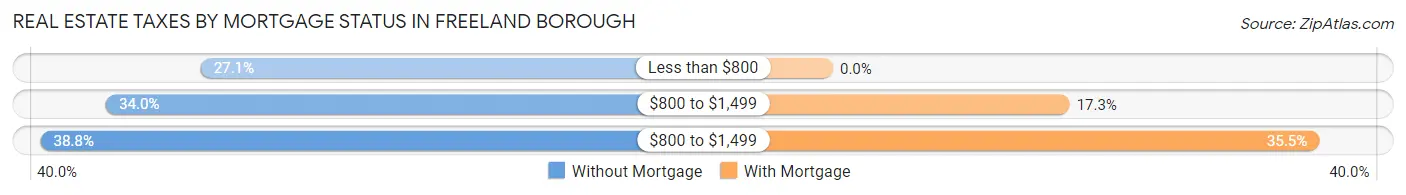
| Property Taxes | Without Mortgage | With Mortgage |
| Less than $800 | 102 (27.1%) | 0 (0.0%) |
| $800 to $1,499 | 128 (34.0%) | 74 (17.3%) |
| $800 to $1,499 | 146 (38.8%) | 152 (35.5%) |
| Total | 376 (100.0%) | 428 (100.0%) |
Health & Disability in Freeland borough
Health Insurance Coverage by Age in Freeland borough
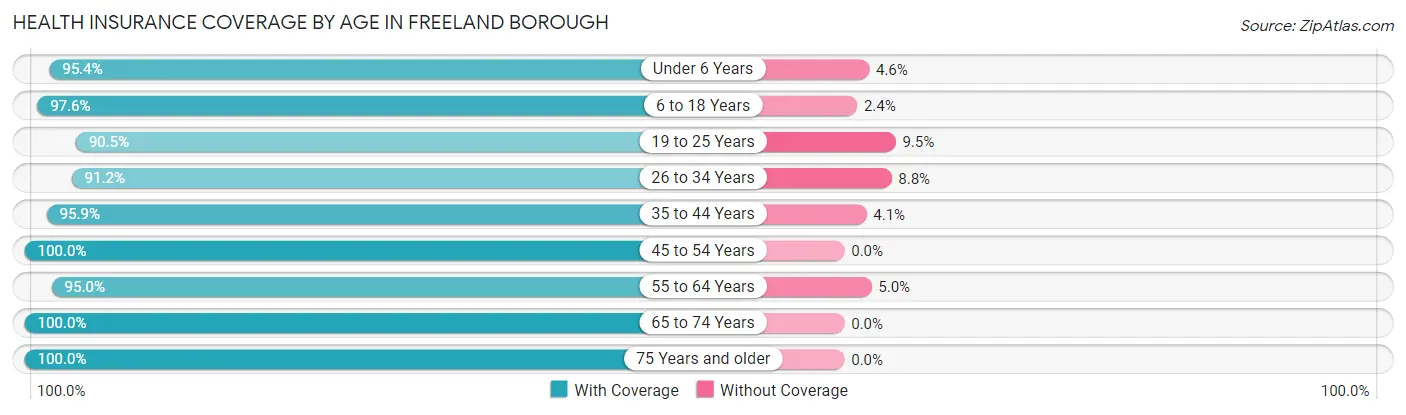
| Age Bracket | With Coverage | Without Coverage |
| Under 6 Years | 290 (95.4%) | 14 (4.6%) |
| 6 to 18 Years | 578 (97.6%) | 14 (2.4%) |
| 19 to 25 Years | 332 (90.5%) | 35 (9.5%) |
| 26 to 34 Years | 447 (91.2%) | 43 (8.8%) |
| 35 to 44 Years | 443 (95.9%) | 19 (4.1%) |
| 45 to 54 Years | 440 (100.0%) | 0 (0.0%) |
| 55 to 64 Years | 452 (95.0%) | 24 (5.0%) |
| 65 to 74 Years | 413 (100.0%) | 0 (0.0%) |
| 75 Years and older | 263 (100.0%) | 0 (0.0%) |
| Total | 3,658 (96.1%) | 149 (3.9%) |
Health Insurance Coverage by Citizenship Status in Freeland borough
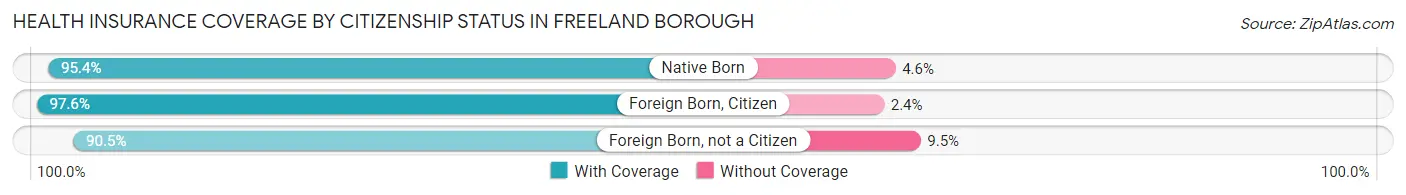
| Citizenship Status | With Coverage | Without Coverage |
| Native Born | 290 (95.4%) | 14 (4.6%) |
| Foreign Born, Citizen | 578 (97.6%) | 14 (2.4%) |
| Foreign Born, not a Citizen | 332 (90.5%) | 35 (9.5%) |
Health Insurance Coverage by Household Income in Freeland borough
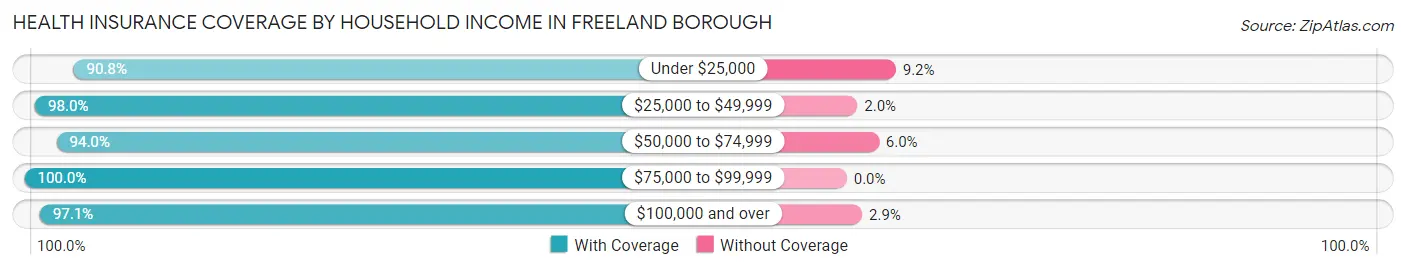
| Household Income | With Coverage | Without Coverage |
| Under $25,000 | 485 (90.8%) | 49 (9.2%) |
| $25,000 to $49,999 | 643 (98.0%) | 13 (2.0%) |
| $50,000 to $74,999 | 893 (94.0%) | 57 (6.0%) |
| $75,000 to $99,999 | 622 (100.0%) | 0 (0.0%) |
| $100,000 and over | 1,015 (97.1%) | 30 (2.9%) |
Public vs Private Health Insurance Coverage by Age in Freeland borough
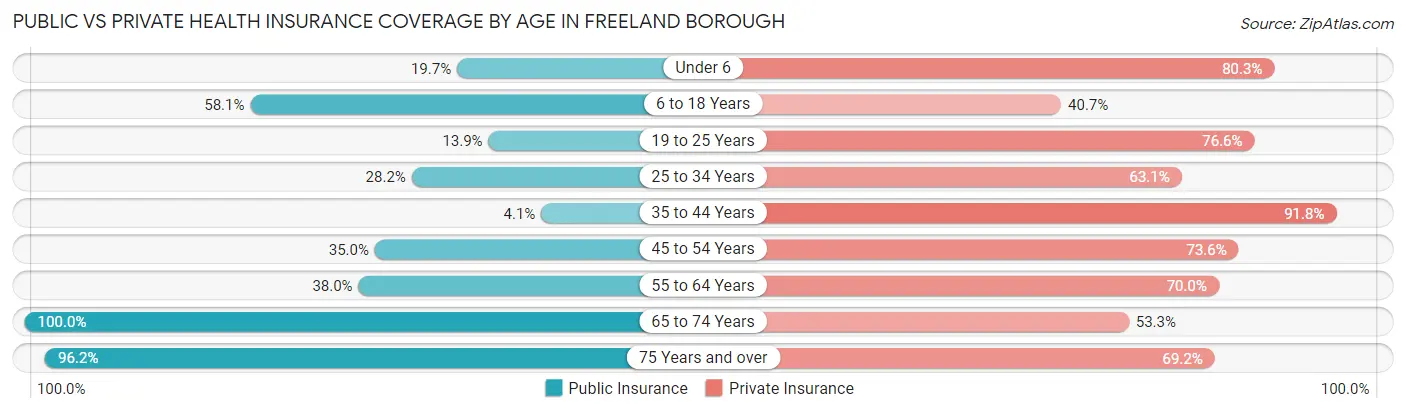
| Age Bracket | Public Insurance | Private Insurance |
| Under 6 | 60 (19.7%) | 244 (80.3%) |
| 6 to 18 Years | 344 (58.1%) | 241 (40.7%) |
| 19 to 25 Years | 51 (13.9%) | 281 (76.6%) |
| 25 to 34 Years | 138 (28.2%) | 309 (63.1%) |
| 35 to 44 Years | 19 (4.1%) | 424 (91.8%) |
| 45 to 54 Years | 154 (35.0%) | 324 (73.6%) |
| 55 to 64 Years | 181 (38.0%) | 333 (70.0%) |
| 65 to 74 Years | 413 (100.0%) | 220 (53.3%) |
| 75 Years and over | 253 (96.2%) | 182 (69.2%) |
| Total | 1,613 (42.4%) | 2,558 (67.2%) |
Disability Status by Sex by Age in Freeland borough
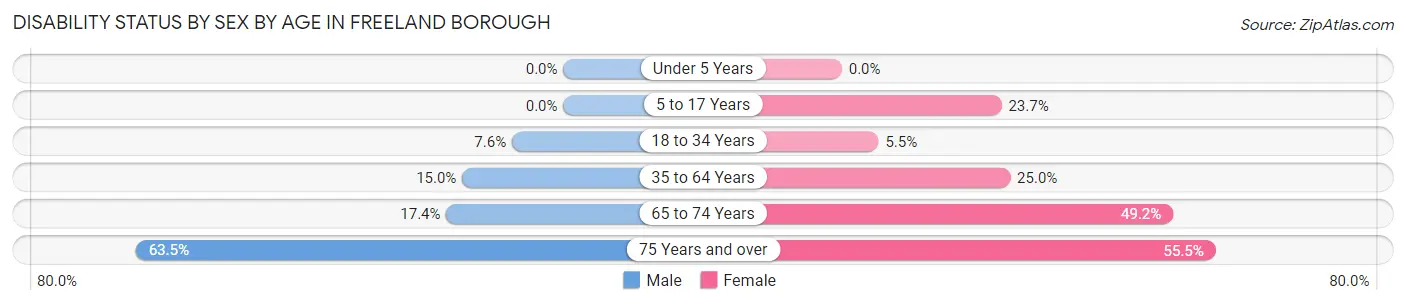
| Age Bracket | Male | Female |
| Under 5 Years | 0 (0.0%) | 0 (0.0%) |
| 5 to 17 Years | 0 (0.0%) | 101 (23.7%) |
| 18 to 34 Years | 37 (7.6%) | 21 (5.4%) |
| 35 to 64 Years | 100 (15.0%) | 178 (25.0%) |
| 65 to 74 Years | 29 (17.4%) | 121 (49.2%) |
| 75 Years and over | 40 (63.5%) | 111 (55.5%) |
Disability Class by Sex by Age in Freeland borough
Disability Class: Hearing Difficulty
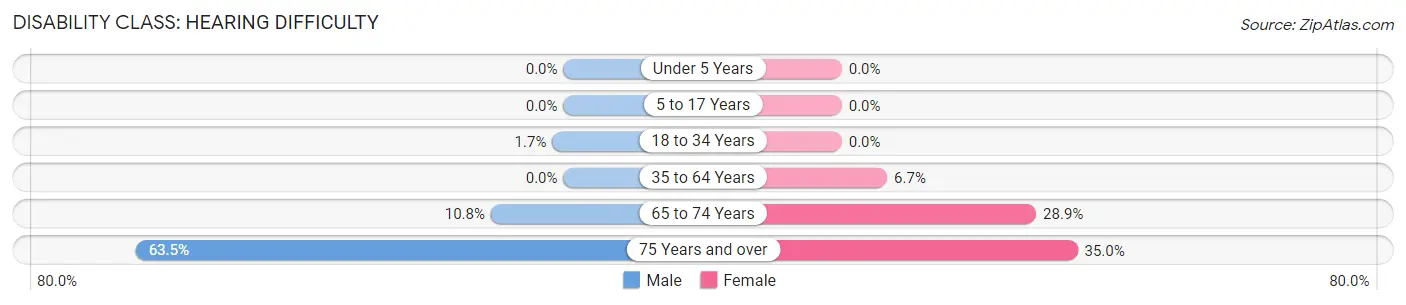
| Age Bracket | Male | Female |
| Under 5 Years | 0 (0.0%) | 0 (0.0%) |
| 5 to 17 Years | 0 (0.0%) | 0 (0.0%) |
| 18 to 34 Years | 8 (1.7%) | 0 (0.0%) |
| 35 to 64 Years | 0 (0.0%) | 48 (6.7%) |
| 65 to 74 Years | 18 (10.8%) | 71 (28.9%) |
| 75 Years and over | 40 (63.5%) | 70 (35.0%) |
Disability Class: Vision Difficulty
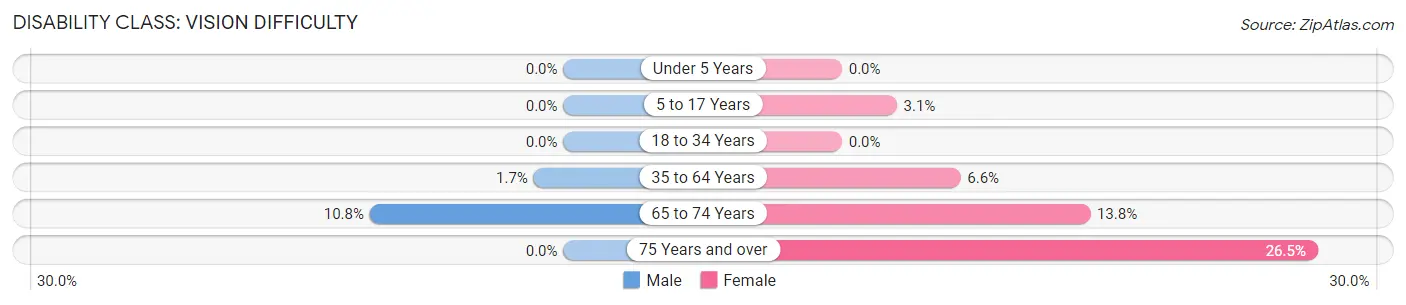
| Age Bracket | Male | Female |
| Under 5 Years | 0 (0.0%) | 0 (0.0%) |
| 5 to 17 Years | 0 (0.0%) | 13 (3.0%) |
| 18 to 34 Years | 0 (0.0%) | 0 (0.0%) |
| 35 to 64 Years | 11 (1.7%) | 47 (6.6%) |
| 65 to 74 Years | 18 (10.8%) | 34 (13.8%) |
| 75 Years and over | 0 (0.0%) | 53 (26.5%) |
Disability Class: Cognitive Difficulty
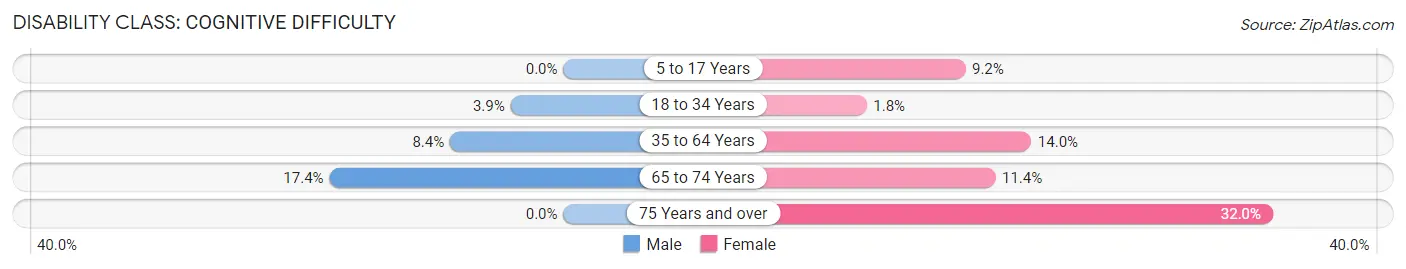
| Age Bracket | Male | Female |
| 5 to 17 Years | 0 (0.0%) | 39 (9.1%) |
| 18 to 34 Years | 19 (3.9%) | 7 (1.8%) |
| 35 to 64 Years | 56 (8.4%) | 100 (14.0%) |
| 65 to 74 Years | 29 (17.4%) | 28 (11.4%) |
| 75 Years and over | 0 (0.0%) | 64 (32.0%) |
Disability Class: Ambulatory Difficulty
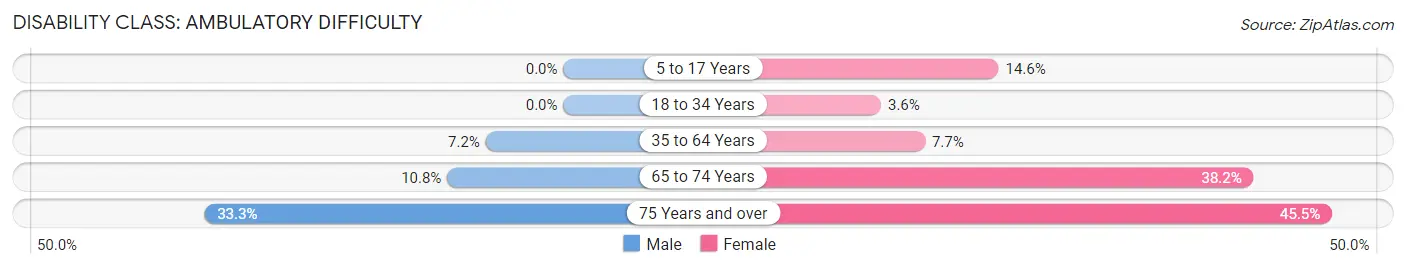
| Age Bracket | Male | Female |
| 5 to 17 Years | 0 (0.0%) | 62 (14.5%) |
| 18 to 34 Years | 0 (0.0%) | 14 (3.6%) |
| 35 to 64 Years | 48 (7.2%) | 55 (7.7%) |
| 65 to 74 Years | 18 (10.8%) | 94 (38.2%) |
| 75 Years and over | 21 (33.3%) | 91 (45.5%) |
Disability Class: Self-Care Difficulty
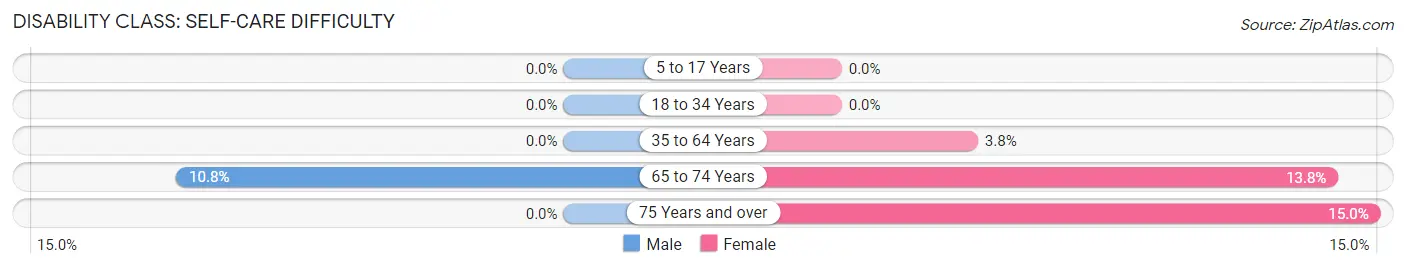
| Age Bracket | Male | Female |
| 5 to 17 Years | 0 (0.0%) | 0 (0.0%) |
| 18 to 34 Years | 0 (0.0%) | 0 (0.0%) |
| 35 to 64 Years | 0 (0.0%) | 27 (3.8%) |
| 65 to 74 Years | 18 (10.8%) | 34 (13.8%) |
| 75 Years and over | 0 (0.0%) | 30 (15.0%) |
Technology Access in Freeland borough
Computing Device Access in Freeland borough
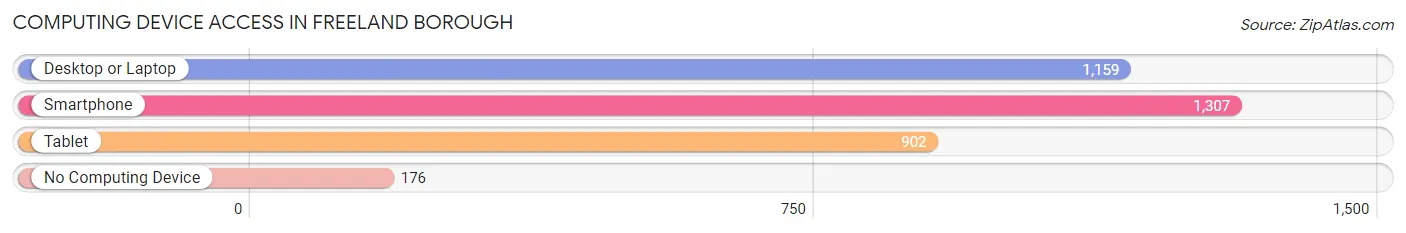
| Device Type | # Households | % Households |
| Desktop or Laptop | 1,159 | 72.1% |
| Smartphone | 1,307 | 81.3% |
| Tablet | 902 | 56.1% |
| No Computing Device | 176 | 11.0% |
| Total | 1,608 | 100.0% |
Internet Access in Freeland borough
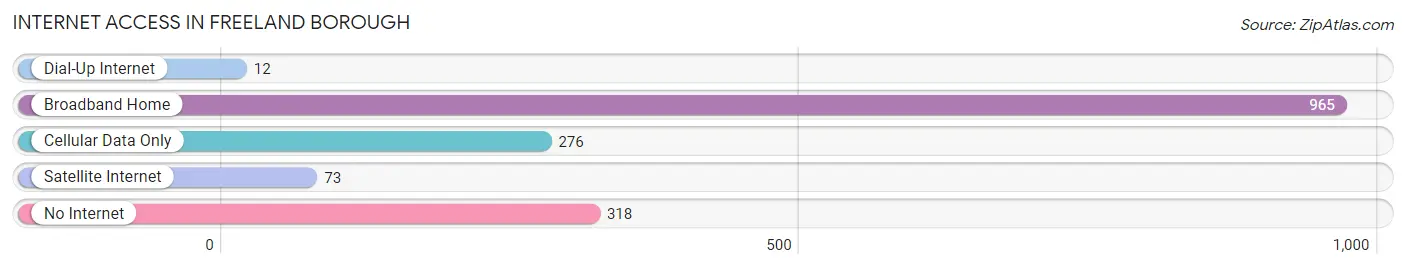
| Internet Type | # Households | % Households |
| Dial-Up Internet | 12 | 0.7% |
| Broadband Home | 965 | 60.0% |
| Cellular Data Only | 276 | 17.2% |
| Satellite Internet | 73 | 4.5% |
| No Internet | 318 | 19.8% |
| Total | 1,608 | 100.0% |
Freeland borough Summary
Freeland Borough is a small borough located in Luzerne County, Pennsylvania. It is situated in the southern part of the county, approximately 10 miles south of Wilkes-Barre. The borough is bordered by Hazle Township to the north, Foster Township to the east, and Black Creek Township to the south and west. The population of Freeland Borough was 2,619 at the 2010 census.
History
Freeland Borough was founded in 1867 by a group of coal miners who had recently immigrated from Wales. The miners named the town after their homeland, which was known as “Free Land” in Welsh. The town quickly grew as the coal industry flourished in the area. By the early 1900s, Freeland had become a bustling coal mining town with a population of over 5,000.
The coal industry in Freeland began to decline in the mid-1900s, and the population of the borough began to decrease. By the 1970s, the population had dropped to just over 2,000. Despite the decline in the coal industry, Freeland has managed to remain a vibrant community.
Geography
Freeland Borough is located at 40°59'N 75°54'W. It is situated in the southern part of Luzerne County, approximately 10 miles south of Wilkes-Barre. The borough is bordered by Hazle Township to the north, Foster Township to the east, and Black Creek Township to the south and west.
The borough has a total area of 1.2 square miles, all of which is land. The terrain is mostly flat, with some rolling hills in the northern part of the borough. The borough is located in the Appalachian Mountains, and the highest point in the borough is 1,400 feet above sea level.
Economy
Freeland Borough’s economy is largely based on the service industry. The borough is home to several restaurants, bars, and retail stores. The borough also has a few manufacturing companies, including a plastics factory and a metal fabrication plant.
The borough is also home to several small businesses, including a bakery, a florist, and a furniture store. The borough also has a few professional services, such as a law firm and an accounting firm.
Demographics
As of the 2010 census, the population of Freeland Borough was 2,619. The racial makeup of the borough was 97.3% White, 0.8% African American, 0.2% Native American, 0.4% Asian, 0.1% Pacific Islander, 0.3% from other races, and 0.9% from two or more races. Hispanic or Latino of any race were 1.2% of the population.
The median household income in Freeland Borough was $37,917, and the median family income was $45,938. The per capita income for the borough was $19,945. About 11.3% of families and 13.2% of the population were below the poverty line, including 17.2% of those under age 18 and 8.2% of those age 65 or over.
Common Questions
What is Per Capita Income in Freeland borough?
Per Capita income in Freeland borough is $28,772.
What is the Median Family Income in Freeland borough?
Median Family Income in Freeland borough is $71,771.
What is the Median Household income in Freeland borough?
Median Household Income in Freeland borough is $55,739.
What is Income or Wage Gap in Freeland borough?
Income or Wage Gap in Freeland borough is 24.2%.
Women in Freeland borough earn 75.8 cents for every dollar earned by a man.
What is Inequality or Gini Index in Freeland borough?
Inequality or Gini Index in Freeland borough is 0.40.
What is the Total Population of Freeland borough?
Total Population of Freeland borough is 3,807.
What is the Total Male Population of Freeland borough?
Total Male Population of Freeland borough is 1,819.
What is the Total Female Population of Freeland borough?
Total Female Population of Freeland borough is 1,988.
What is the Ratio of Males per 100 Females in Freeland borough?
There are 91.50 Males per 100 Females in Freeland borough.
What is the Ratio of Females per 100 Males in Freeland borough?
There are 109.29 Females per 100 Males in Freeland borough.
What is the Median Population Age in Freeland borough?
Median Population Age in Freeland borough is 38.8 Years.
What is the Average Family Size in Freeland borough
Average Family Size in Freeland borough is 3.1 People.
What is the Average Household Size in Freeland borough
Average Household Size in Freeland borough is 2.4 People.
How Large is the Labor Force in Freeland borough?
There are 1,689 People in the Labor Forcein in Freeland borough.
What is the Percentage of People in the Labor Force in Freeland borough?
55.3% of People are in the Labor Force in Freeland borough.
What is the Unemployment Rate in Freeland borough?
Unemployment Rate in Freeland borough is 4.3%.