Hyde Park, PA Map & Demographics
Hyde Park Map
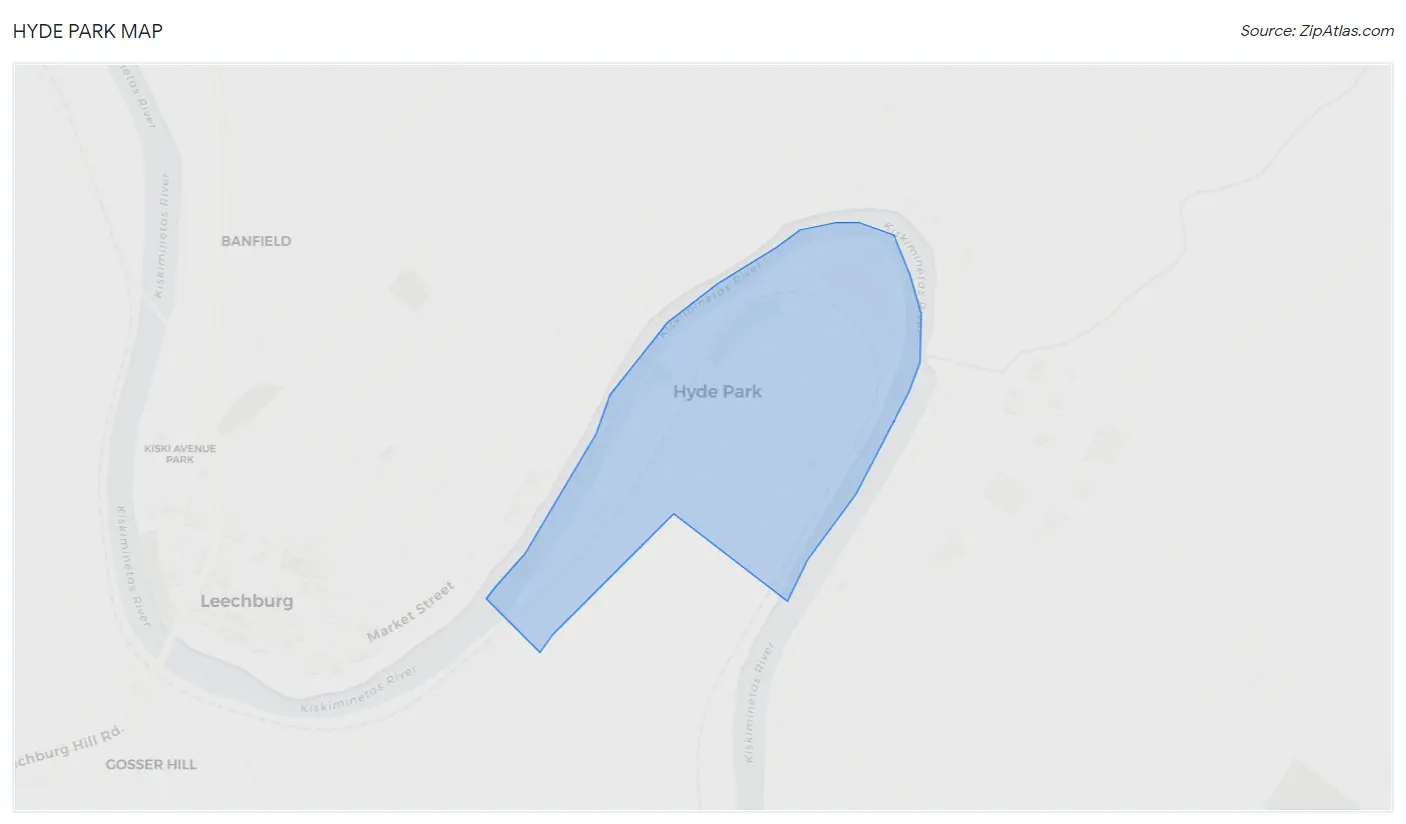
Hyde Park Overview
$27,068
PER CAPITA INCOME
$95,781
AVG FAMILY INCOME
$59,792
AVG HOUSEHOLD INCOME
21.1%
WAGE / INCOME GAP [ % ]
78.9¢/ $1
WAGE / INCOME GAP [ $ ]
0.38
INEQUALITY / GINI INDEX
2,332
TOTAL POPULATION
1,275
MALE POPULATION
1,057
FEMALE POPULATION
120.62
MALES / 100 FEMALES
82.90
FEMALES / 100 MALES
36.9
MEDIAN AGE
3.9
AVG FAMILY SIZE
3.0
AVG HOUSEHOLD SIZE
1,284
LABOR FORCE [ PEOPLE ]
69.8%
PERCENT IN LABOR FORCE
7.6%
UNEMPLOYMENT RATE
Hyde Park Zip Codes
Hyde Park Area Codes
Income in Hyde Park
Income Overview in Hyde Park
Per Capita Income in Hyde Park is $27,068, while median incomes of families and households are $95,781 and $59,792 respectively.
| Characteristic | Number | Measure |
| Per Capita Income | 2,332 | $27,068 |
| Median Family Income | 501 | $95,781 |
| Mean Family Income | 501 | $91,269 |
| Median Household Income | 781 | $59,792 |
| Mean Household Income | 781 | $73,477 |
| Income Deficit | 501 | $0 |
| Wage / Income Gap (%) | 2,332 | 21.14% |
| Wage / Income Gap ($) | 2,332 | 78.86¢ per $1 |
| Gini / Inequality Index | 2,332 | 0.38 |
Earnings by Sex in Hyde Park
Average Earnings in Hyde Park are $40,603, $45,469 for men and $35,855 for women, a difference of 21.1%.
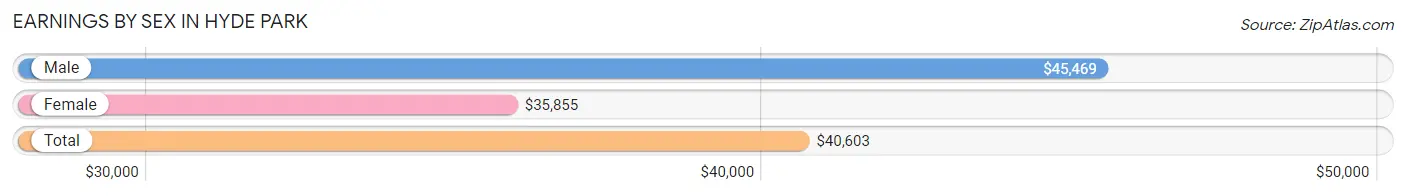
| Sex | Number | Average Earnings |
| Male | 771 (60.0%) | $45,469 |
| Female | 514 (40.0%) | $35,855 |
| Total | 1,285 (100.0%) | $40,603 |
Earnings by Sex by Income Bracket in Hyde Park
The most common earnings brackets in Hyde Park are $45,000 to $49,999 for men (154 | 20.0%) and $35,000 to $39,999 for women (64 | 12.4%).
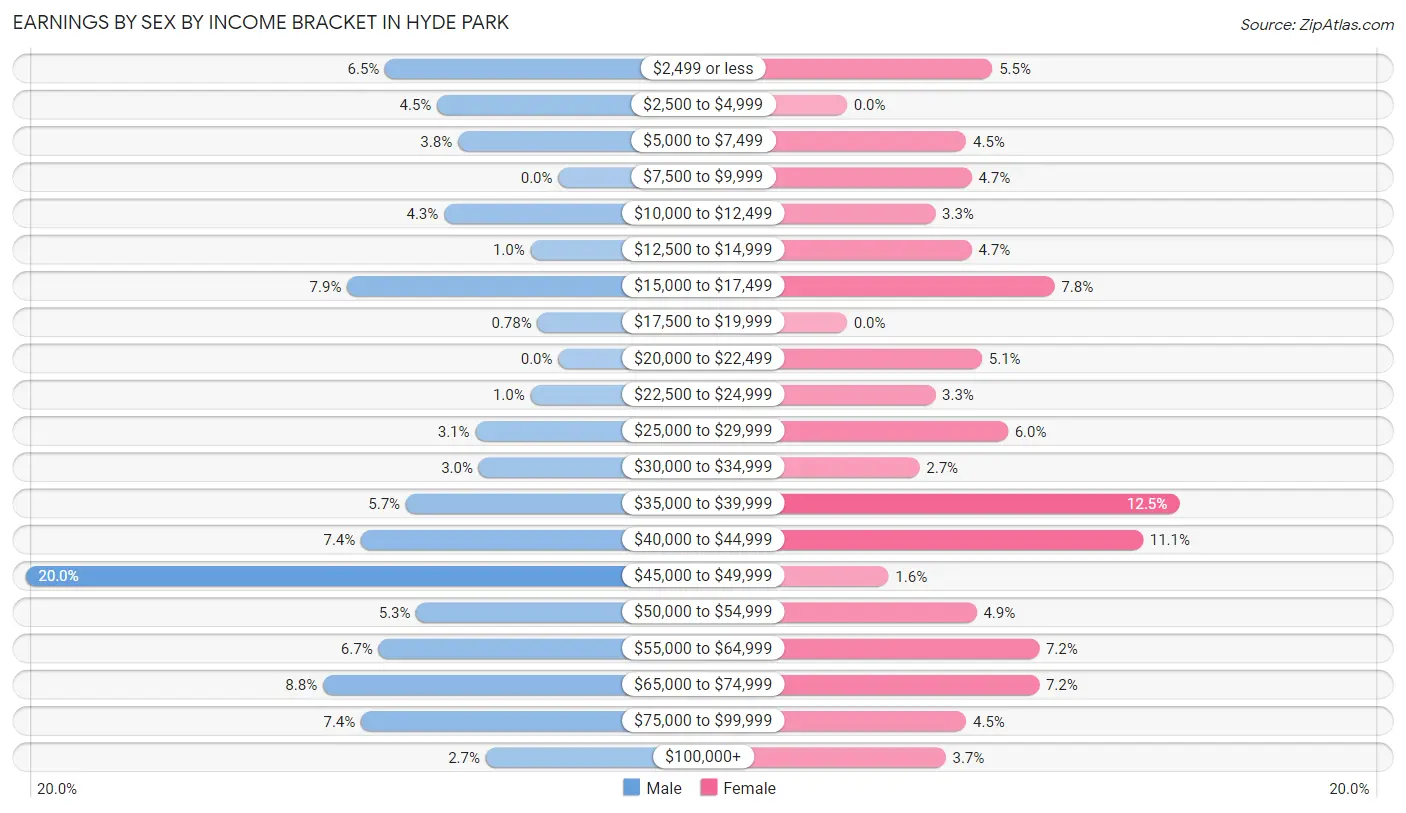
| Income | Male | Female |
| $2,499 or less | 50 (6.5%) | 28 (5.4%) |
| $2,500 to $4,999 | 35 (4.5%) | 0 (0.0%) |
| $5,000 to $7,499 | 29 (3.8%) | 23 (4.5%) |
| $7,500 to $9,999 | 0 (0.0%) | 24 (4.7%) |
| $10,000 to $12,499 | 33 (4.3%) | 17 (3.3%) |
| $12,500 to $14,999 | 8 (1.0%) | 24 (4.7%) |
| $15,000 to $17,499 | 61 (7.9%) | 40 (7.8%) |
| $17,500 to $19,999 | 6 (0.8%) | 0 (0.0%) |
| $20,000 to $22,499 | 0 (0.0%) | 26 (5.1%) |
| $22,500 to $24,999 | 8 (1.0%) | 17 (3.3%) |
| $25,000 to $29,999 | 24 (3.1%) | 31 (6.0%) |
| $30,000 to $34,999 | 23 (3.0%) | 14 (2.7%) |
| $35,000 to $39,999 | 44 (5.7%) | 64 (12.4%) |
| $40,000 to $44,999 | 57 (7.4%) | 57 (11.1%) |
| $45,000 to $49,999 | 154 (20.0%) | 8 (1.6%) |
| $50,000 to $54,999 | 41 (5.3%) | 25 (4.9%) |
| $55,000 to $64,999 | 52 (6.7%) | 37 (7.2%) |
| $65,000 to $74,999 | 68 (8.8%) | 37 (7.2%) |
| $75,000 to $99,999 | 57 (7.4%) | 23 (4.5%) |
| $100,000+ | 21 (2.7%) | 19 (3.7%) |
| Total | 771 (100.0%) | 514 (100.0%) |
Earnings by Sex by Educational Attainment in Hyde Park
Average earnings in Hyde Park are $48,947 for men and $39,375 for women, a difference of 19.6%. Men with an educational attainment of bachelor's degree enjoy the highest average annual earnings of $52,344, while those with college or associate's degree education earn the least with $43,125. Women with an educational attainment of bachelor's degree earn the most with the average annual earnings of $55,000, while those with high school diploma education have the smallest earnings of $29,917.
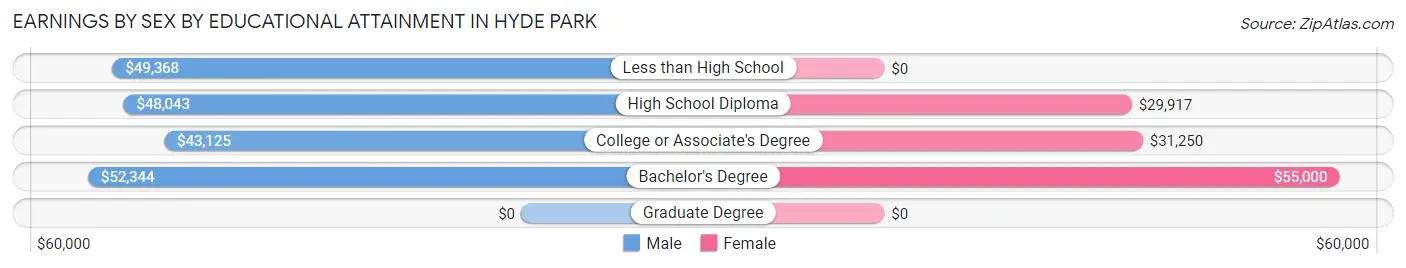
| Educational Attainment | Male Income | Female Income |
| Less than High School | $49,368 | $0 |
| High School Diploma | $48,043 | $29,917 |
| College or Associate's Degree | $43,125 | $31,250 |
| Bachelor's Degree | $52,344 | $55,000 |
| Graduate Degree | - | - |
| Total | $48,947 | $39,375 |
Family Income in Hyde Park
Family Income Brackets in Hyde Park
According to the Hyde Park family income data, there are 177 families falling into the $100,000 to $149,999 income range, which is the most common income bracket and makes up 35.3% of all families.
| Income Bracket | # Families | % Families |
| Less than $10,000 | 0 | 0.0% |
| $10,000 to $14,999 | 19 | 3.8% |
| $15,000 to $24,999 | 0 | 0.0% |
| $25,000 to $34,999 | 8 | 1.6% |
| $35,000 to $49,999 | 126 | 25.1% |
| $50,000 to $74,999 | 57 | 11.4% |
| $75,000 to $99,999 | 60 | 12.0% |
| $100,000 to $149,999 | 177 | 35.3% |
| $150,000 to $199,999 | 31 | 6.2% |
| $200,000+ | 23 | 4.6% |
Family Income by Famaliy Size in Hyde Park
3-person families (85 | 17.0%) account for the highest median family income in Hyde Park with $118,641 per family, while 3-person families (85 | 17.0%) have the highest median income of $39,547 per family member.
| Income Bracket | # Families | Median Income |
| 2-Person Families | 175 (34.9%) | $66,250 |
| 3-Person Families | 85 (17.0%) | $118,641 |
| 4-Person Families | 87 (17.4%) | $101,050 |
| 5-Person Families | 93 (18.6%) | $77,656 |
| 6-Person Families | 38 (7.6%) | $112,857 |
| 7+ Person Families | 23 (4.6%) | $54,297 |
| Total | 501 (100.0%) | $95,781 |
Family Income by Number of Earners in Hyde Park
The median family income in Hyde Park is $95,781, with families comprising 3+ earners (136) having the highest median family income of $103,500, while families with 1 earner (94) have the lowest median family income of $44,083, accounting for 27.2% and 18.8% of families, respectively.
| Number of Earners | # Families | Median Income |
| No Earners | 78 (15.6%) | $48,571 |
| 1 Earner | 94 (18.8%) | $44,083 |
| 2 Earners | 193 (38.5%) | $93,958 |
| 3+ Earners | 136 (27.2%) | $103,500 |
| Total | 501 (100.0%) | $95,781 |
Household Income in Hyde Park
Household Income Brackets in Hyde Park
With 171 households falling in the category, the $35,000 to $49,999 income range is the most frequent in Hyde Park, accounting for 21.9% of all households. In contrast, only 8 households (1.0%) fall into the less than $10,000 income bracket, making it the least populous group.
| Income Bracket | # Households | % Households |
| Less than $10,000 | 8 | 1.0% |
| $10,000 to $14,999 | 81 | 10.4% |
| $15,000 to $24,999 | 41 | 5.2% |
| $25,000 to $34,999 | 51 | 6.5% |
| $35,000 to $49,999 | 171 | 21.9% |
| $50,000 to $74,999 | 115 | 14.7% |
| $75,000 to $99,999 | 82 | 10.5% |
| $100,000 to $149,999 | 155 | 19.8% |
| $150,000 to $199,999 | 54 | 6.9% |
| $200,000+ | 23 | 2.9% |
Household Income by Householder Age in Hyde Park
The median household income in Hyde Park is $59,792, with the highest median household income of $88,917 found in the 45 to 64 years age bracket for the primary householder. A total of 313 households (40.1%) fall into this category. Meanwhile, the 15 to 24 years age bracket for the primary householder has the lowest median household income of $0, with 44 households (5.6%) in this group.
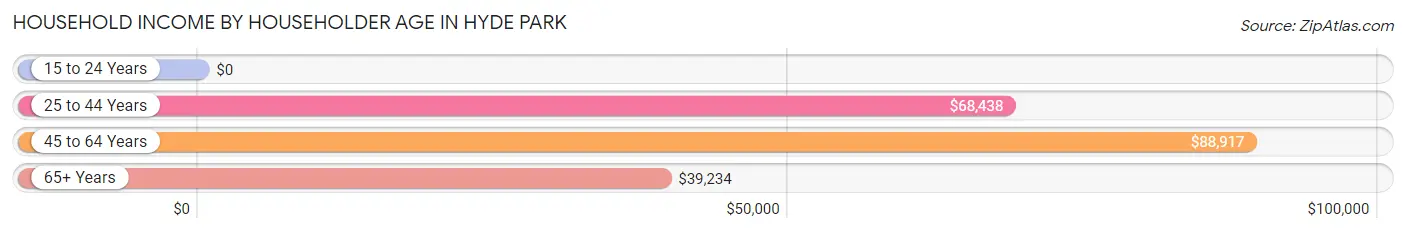
| Income Bracket | # Households | Median Income |
| 15 to 24 Years | 44 (5.6%) | $0 |
| 25 to 44 Years | 249 (31.9%) | $68,438 |
| 45 to 64 Years | 313 (40.1%) | $88,917 |
| 65+ Years | 175 (22.4%) | $39,234 |
| Total | 781 (100.0%) | $59,792 |
Poverty in Hyde Park
Income Below Poverty by Sex and Age in Hyde Park
With 4.5% poverty level for males and 5.8% for females among the residents of Hyde Park, 25 to 34 year old males and 65 to 74 year old females are the most vulnerable to poverty, with 32 males (24.6%) and 24 females (24.7%) in their respective age groups living below the poverty level.
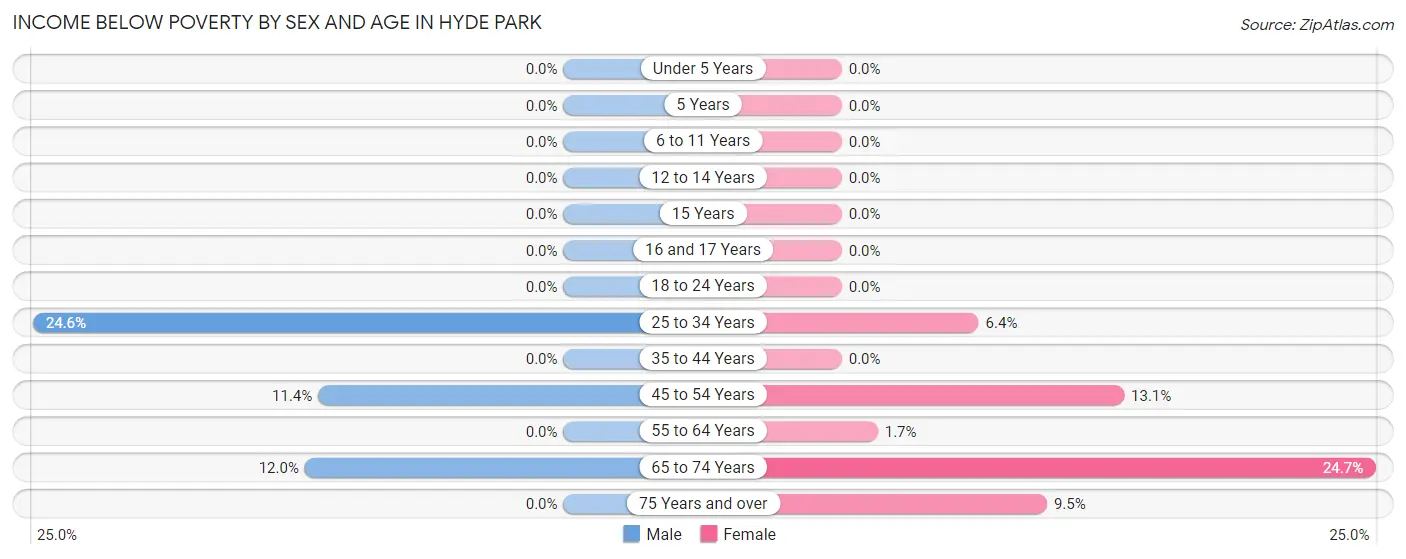
| Age Bracket | Male | Female |
| Under 5 Years | 0 (0.0%) | 0 (0.0%) |
| 5 Years | 0 (0.0%) | 0 (0.0%) |
| 6 to 11 Years | 0 (0.0%) | 0 (0.0%) |
| 12 to 14 Years | 0 (0.0%) | 0 (0.0%) |
| 15 Years | 0 (0.0%) | 0 (0.0%) |
| 16 and 17 Years | 0 (0.0%) | 0 (0.0%) |
| 18 to 24 Years | 0 (0.0%) | 0 (0.0%) |
| 25 to 34 Years | 32 (24.6%) | 8 (6.4%) |
| 35 to 44 Years | 0 (0.0%) | 0 (0.0%) |
| 45 to 54 Years | 19 (11.4%) | 19 (13.1%) |
| 55 to 64 Years | 0 (0.0%) | 2 (1.7%) |
| 65 to 74 Years | 6 (12.0%) | 24 (24.7%) |
| 75 Years and over | 0 (0.0%) | 8 (9.5%) |
| Total | 57 (4.5%) | 61 (5.8%) |
Income Above Poverty by Sex and Age in Hyde Park
According to the poverty statistics in Hyde Park, males aged under 5 years and females aged under 5 years are the age groups that are most secure financially, with 100.0% of males and 100.0% of females in these age groups living above the poverty line.
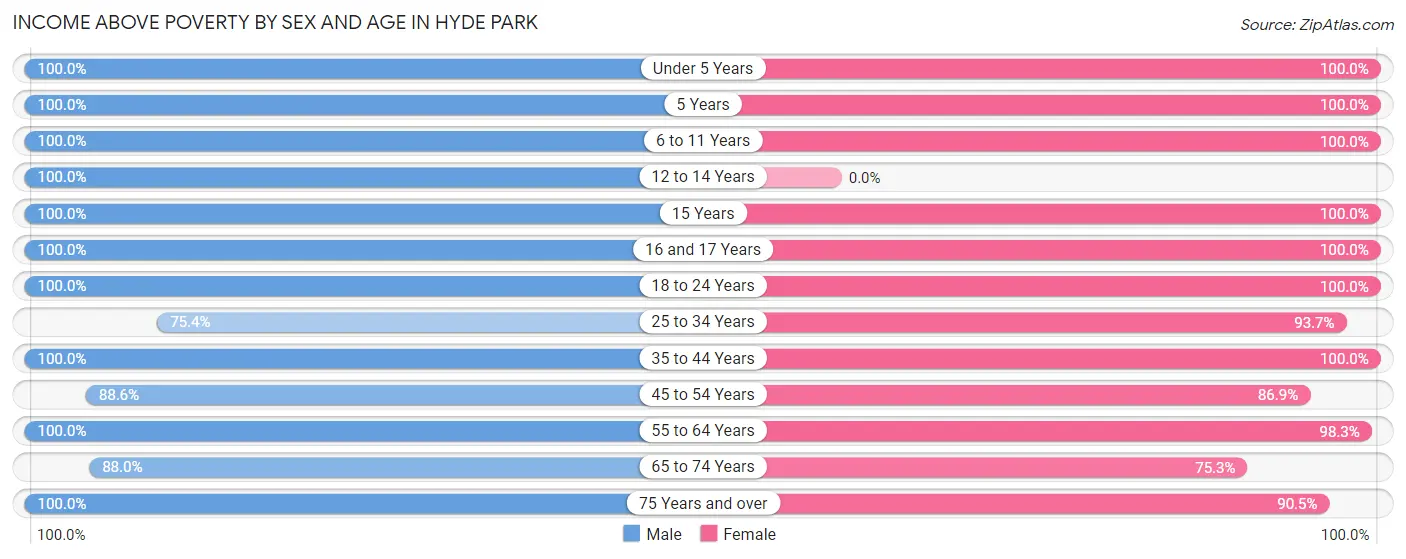
| Age Bracket | Male | Female |
| Under 5 Years | 109 (100.0%) | 87 (100.0%) |
| 5 Years | 23 (100.0%) | 18 (100.0%) |
| 6 to 11 Years | 59 (100.0%) | 138 (100.0%) |
| 12 to 14 Years | 37 (100.0%) | 0 (0.0%) |
| 15 Years | 14 (100.0%) | 1 (100.0%) |
| 16 and 17 Years | 70 (100.0%) | 39 (100.0%) |
| 18 to 24 Years | 159 (100.0%) | 63 (100.0%) |
| 25 to 34 Years | 98 (75.4%) | 118 (93.6%) |
| 35 to 44 Years | 149 (100.0%) | 129 (100.0%) |
| 45 to 54 Years | 148 (88.6%) | 126 (86.9%) |
| 55 to 64 Years | 139 (100.0%) | 118 (98.3%) |
| 65 to 74 Years | 44 (88.0%) | 73 (75.3%) |
| 75 Years and over | 153 (100.0%) | 76 (90.5%) |
| Total | 1,202 (95.5%) | 986 (94.2%) |
Income Below Poverty Among Married-Couple Families in Hyde Park
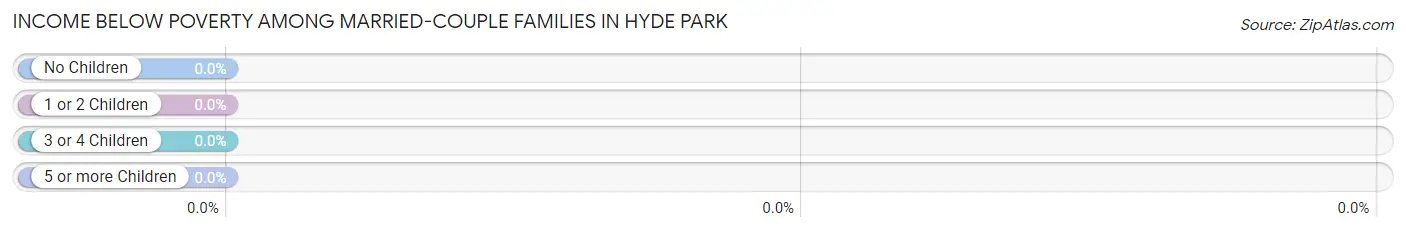
| Children | Above Poverty | Below Poverty |
| No Children | 189 (100.0%) | 0 (0.0%) |
| 1 or 2 Children | 105 (100.0%) | 0 (0.0%) |
| 3 or 4 Children | 78 (100.0%) | 0 (0.0%) |
| 5 or more Children | 17 (100.0%) | 0 (0.0%) |
| Total | 389 (100.0%) | 0 (0.0%) |
Income Below Poverty Among Single-Parent Households in Hyde Park
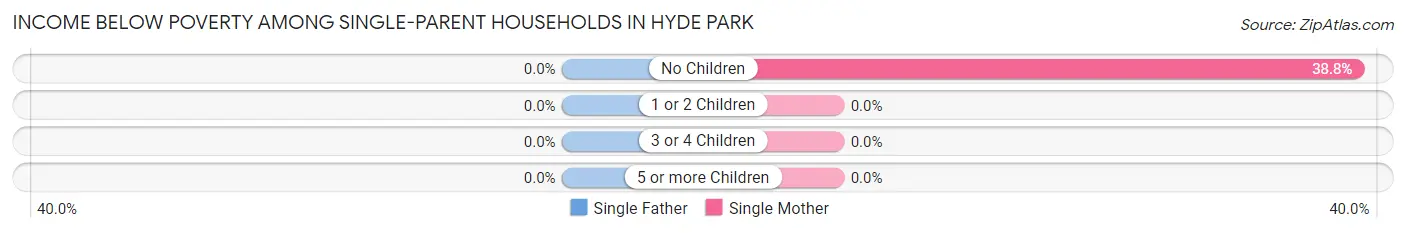
| Children | Single Father | Single Mother |
| No Children | 0 (0.0%) | 19 (38.8%) |
| 1 or 2 Children | 0 (0.0%) | 0 (0.0%) |
| 3 or 4 Children | 0 (0.0%) | 0 (0.0%) |
| 5 or more Children | 0 (0.0%) | 0 (0.0%) |
| Total | 0 (0.0%) | 19 (25.7%) |
Income Below Poverty Among Married-Couple vs Single-Parent Households in Hyde Park
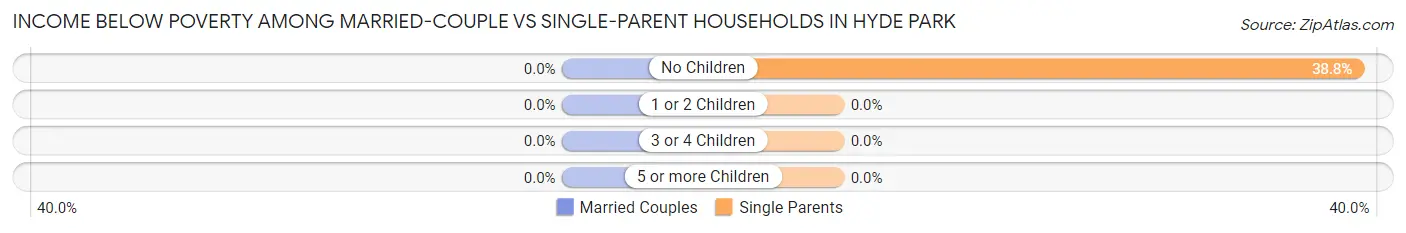
| Children | Married-Couple Families | Single-Parent Households |
| No Children | 0 (0.0%) | 19 (38.8%) |
| 1 or 2 Children | 0 (0.0%) | 0 (0.0%) |
| 3 or 4 Children | 0 (0.0%) | 0 (0.0%) |
| 5 or more Children | 0 (0.0%) | 0 (0.0%) |
| Total | 0 (0.0%) | 19 (17.0%) |
Race in Hyde Park
The most populous races in Hyde Park are White / Caucasian (1,411 | 60.5%), Hispanic or Latino (1,133 | 48.6%), and Some other Race (553 | 23.7%).
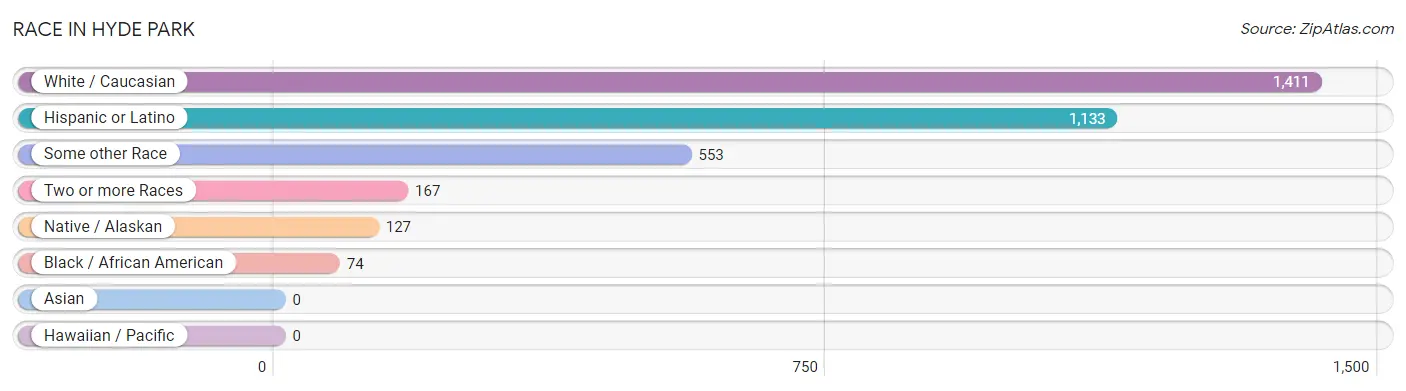
| Race | # Population | % Population |
| Asian | 0 | 0.0% |
| Black / African American | 74 | 3.2% |
| Hawaiian / Pacific | 0 | 0.0% |
| Hispanic or Latino | 1,133 | 48.6% |
| Native / Alaskan | 127 | 5.4% |
| White / Caucasian | 1,411 | 60.5% |
| Two or more Races | 167 | 7.2% |
| Some other Race | 553 | 23.7% |
| Total | 2,332 | 100.0% |
Ancestry in Hyde Park
The most populous ancestries reported in Hyde Park are Dominican (562 | 24.1%), German (493 | 21.1%), Puerto Rican (290 | 12.4%), Irish (157 | 6.7%), and Mexican (146 | 6.3%), together accounting for 70.7% of all Hyde Park residents.
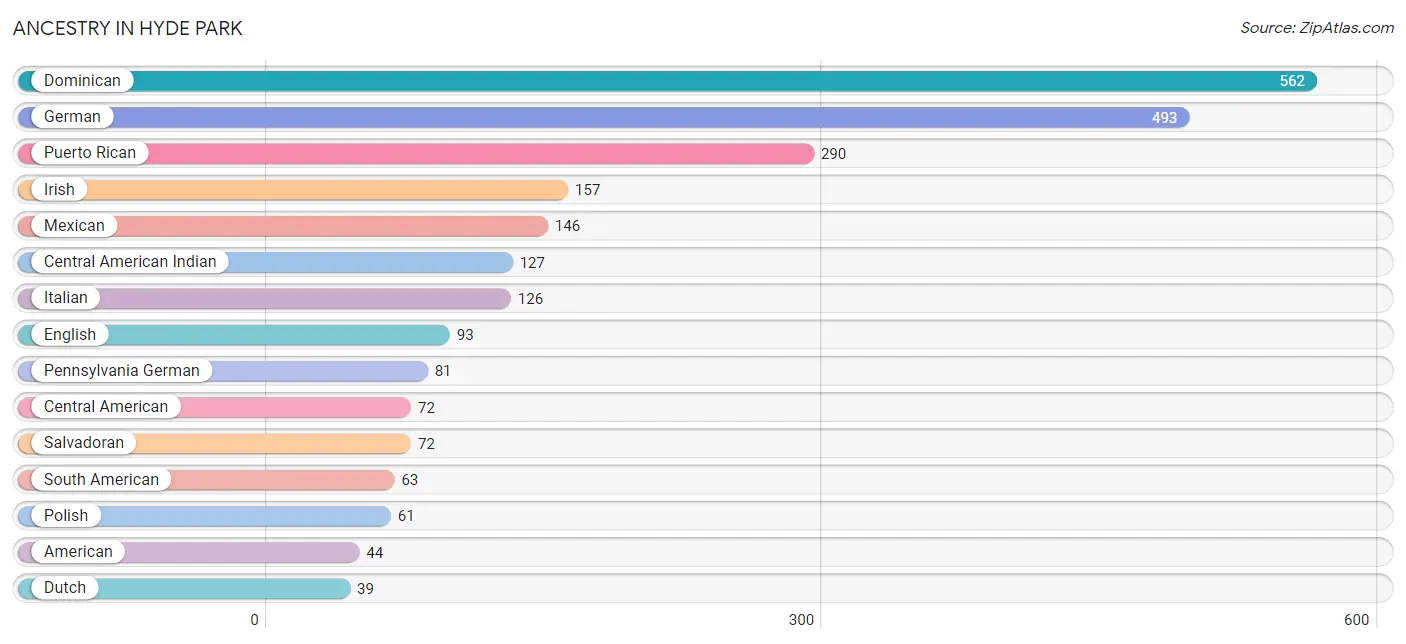
| Ancestry | # Population | % Population |
| American | 44 | 1.9% |
| British | 13 | 0.6% |
| Central American | 72 | 3.1% |
| Central American Indian | 127 | 5.4% |
| Colombian | 36 | 1.5% |
| Dominican | 562 | 24.1% |
| Dutch | 39 | 1.7% |
| Ecuadorian | 16 | 0.7% |
| English | 93 | 4.0% |
| French | 36 | 1.5% |
| German | 493 | 21.1% |
| Irish | 157 | 6.7% |
| Italian | 126 | 5.4% |
| Lithuanian | 1 | 0.0% |
| Mexican | 146 | 6.3% |
| Pennsylvania German | 81 | 3.5% |
| Peruvian | 11 | 0.5% |
| Polish | 61 | 2.6% |
| Puerto Rican | 290 | 12.4% |
| Romanian | 2 | 0.1% |
| Salvadoran | 72 | 3.1% |
| Scotch-Irish | 22 | 0.9% |
| Scottish | 7 | 0.3% |
| Slovak | 16 | 0.7% |
| South American | 63 | 2.7% |
| Subsaharan African | 16 | 0.7% |
| Swedish | 8 | 0.3% |
| Ukrainian | 2 | 0.1% |
| Welsh | 15 | 0.6% | View All 29 Rows |
Immigrants in Hyde Park
The most numerous immigrant groups reported in Hyde Park came from Latin America (520 | 22.3%), Caribbean (387 | 16.6%), Dominican Republic (387 | 16.6%), Central America (93 | 4.0%), and El Salvador (72 | 3.1%), together accounting for 62.6% of all Hyde Park residents.
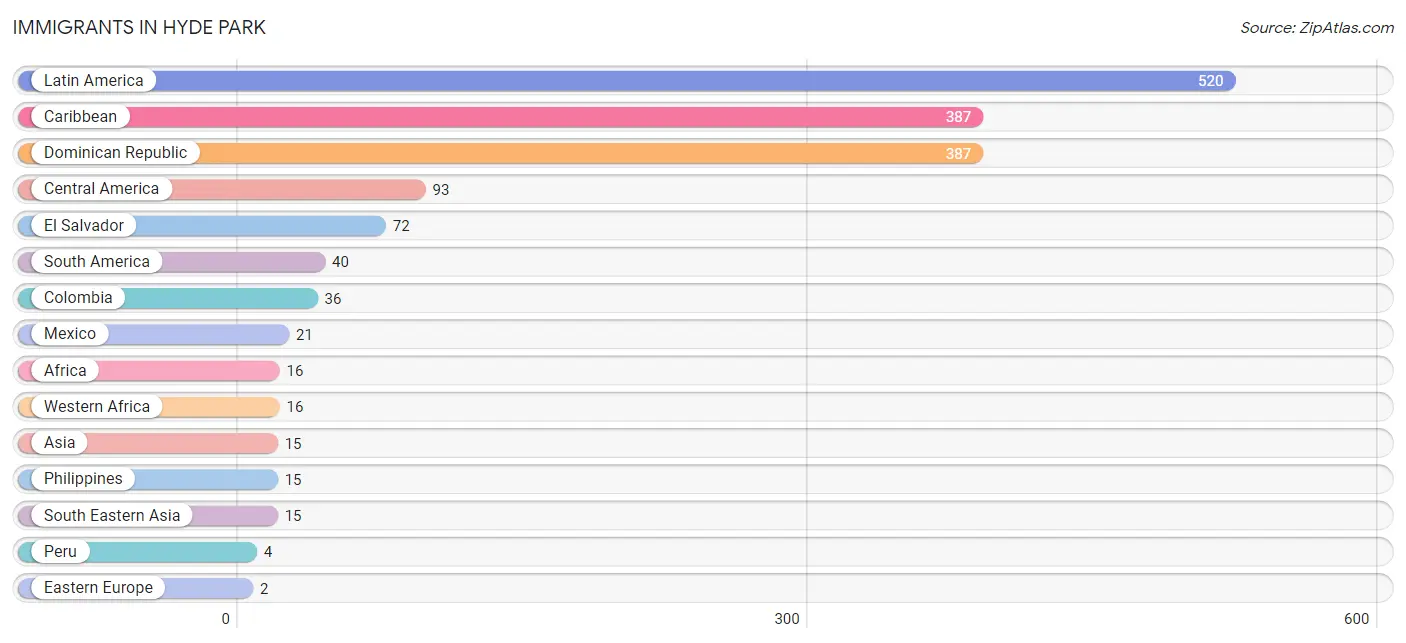
| Immigration Origin | # Population | % Population |
| Africa | 16 | 0.7% |
| Asia | 15 | 0.6% |
| Caribbean | 387 | 16.6% |
| Central America | 93 | 4.0% |
| Colombia | 36 | 1.5% |
| Dominican Republic | 387 | 16.6% |
| Eastern Europe | 2 | 0.1% |
| El Salvador | 72 | 3.1% |
| Europe | 2 | 0.1% |
| Latin America | 520 | 22.3% |
| Mexico | 21 | 0.9% |
| Peru | 4 | 0.2% |
| Philippines | 15 | 0.6% |
| Romania | 2 | 0.1% |
| South America | 40 | 1.7% |
| South Eastern Asia | 15 | 0.6% |
| Western Africa | 16 | 0.7% | View All 17 Rows |
Sex and Age in Hyde Park
Sex and Age in Hyde Park
The most populous age groups in Hyde Park are 15 to 19 Years (139 | 10.9%) for men and 5 to 9 Years (136 | 12.9%) for women.
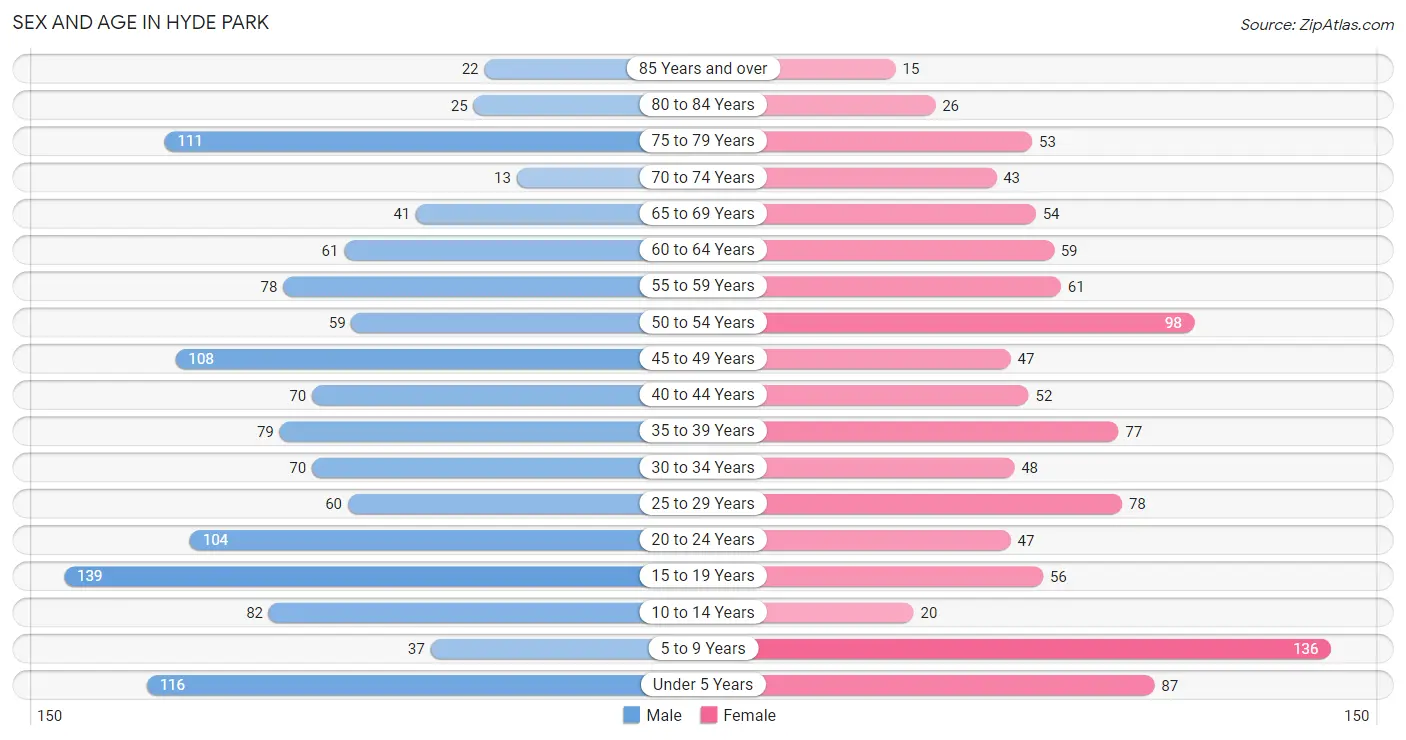
| Age Bracket | Male | Female |
| Under 5 Years | 116 (9.1%) | 87 (8.2%) |
| 5 to 9 Years | 37 (2.9%) | 136 (12.9%) |
| 10 to 14 Years | 82 (6.4%) | 20 (1.9%) |
| 15 to 19 Years | 139 (10.9%) | 56 (5.3%) |
| 20 to 24 Years | 104 (8.2%) | 47 (4.4%) |
| 25 to 29 Years | 60 (4.7%) | 78 (7.4%) |
| 30 to 34 Years | 70 (5.5%) | 48 (4.5%) |
| 35 to 39 Years | 79 (6.2%) | 77 (7.3%) |
| 40 to 44 Years | 70 (5.5%) | 52 (4.9%) |
| 45 to 49 Years | 108 (8.5%) | 47 (4.4%) |
| 50 to 54 Years | 59 (4.6%) | 98 (9.3%) |
| 55 to 59 Years | 78 (6.1%) | 61 (5.8%) |
| 60 to 64 Years | 61 (4.8%) | 59 (5.6%) |
| 65 to 69 Years | 41 (3.2%) | 54 (5.1%) |
| 70 to 74 Years | 13 (1.0%) | 43 (4.1%) |
| 75 to 79 Years | 111 (8.7%) | 53 (5.0%) |
| 80 to 84 Years | 25 (2.0%) | 26 (2.5%) |
| 85 Years and over | 22 (1.7%) | 15 (1.4%) |
| Total | 1,275 (100.0%) | 1,057 (100.0%) |
Families and Households in Hyde Park
Median Family Size in Hyde Park
The median family size in Hyde Park is 3.94 persons per family, with married-couple families (389 | 77.6%) accounting for the largest median family size of 4.06 persons per family. On the other hand, single female/mother families (74 | 14.8%) represent the smallest median family size with 3.38 persons per family.
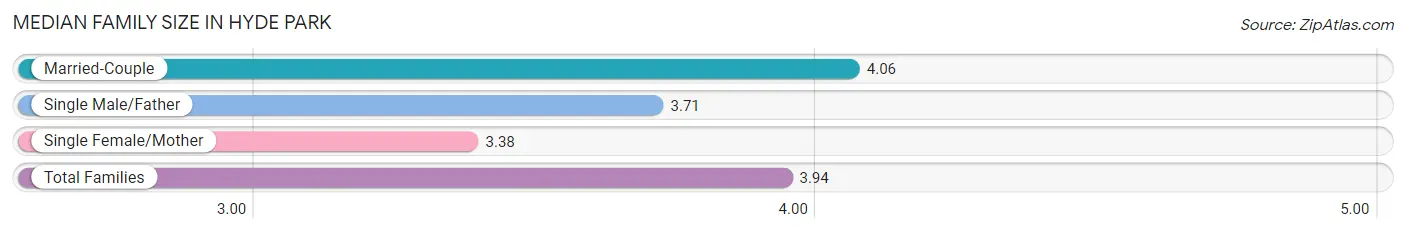
| Family Type | # Families | Family Size |
| Married-Couple | 389 (77.6%) | 4.06 |
| Single Male/Father | 38 (7.6%) | 3.71 |
| Single Female/Mother | 74 (14.8%) | 3.38 |
| Total Families | 501 (100.0%) | 3.94 |
Median Household Size in Hyde Park
The median household size in Hyde Park is 2.95 persons per household, with single male/father households (38 | 4.9%) accounting for the largest median household size of 4.34 persons per household. non-family households (280 | 35.8%) represent the smallest median household size with 1.05 persons per household.
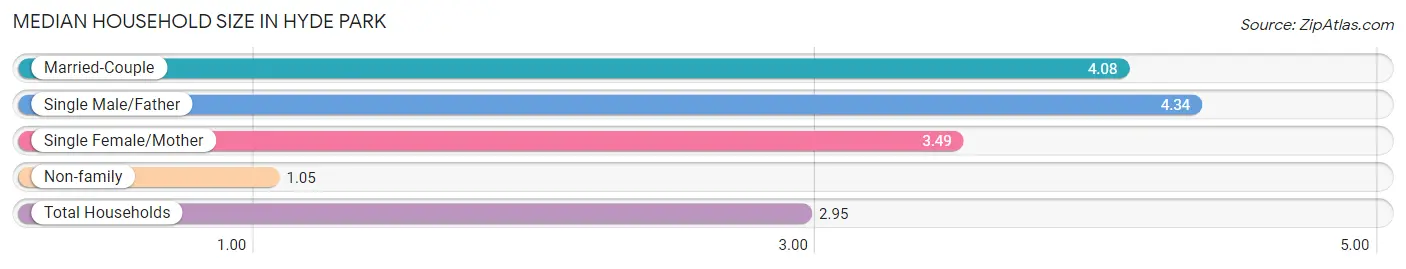
| Household Type | # Households | Household Size |
| Married-Couple | 389 (49.8%) | 4.08 |
| Single Male/Father | 38 (4.9%) | 4.34 |
| Single Female/Mother | 74 (9.5%) | 3.49 |
| Non-family | 280 (35.8%) | 1.05 |
| Total Households | 781 (100.0%) | 2.95 |
Household Size by Marriage Status in Hyde Park
Out of a total of 781 households in Hyde Park, 501 (64.1%) are family households, while 280 (35.8%) are nonfamily households. The most numerous type of family households are 2-person households, comprising 168, and the most common type of nonfamily households are 1-person households, comprising 265.
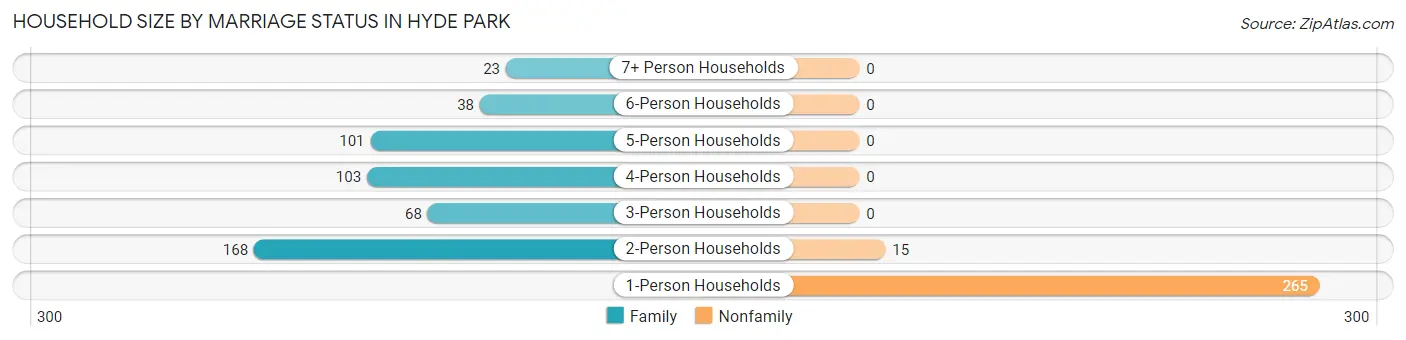
| Household Size | Family Households | Nonfamily Households |
| 1-Person Households | - | 265 (33.9%) |
| 2-Person Households | 168 (21.5%) | 15 (1.9%) |
| 3-Person Households | 68 (8.7%) | 0 (0.0%) |
| 4-Person Households | 103 (13.2%) | 0 (0.0%) |
| 5-Person Households | 101 (12.9%) | 0 (0.0%) |
| 6-Person Households | 38 (4.9%) | 0 (0.0%) |
| 7+ Person Households | 23 (2.9%) | 0 (0.0%) |
| Total | 501 (64.1%) | 280 (35.8%) |
Female Fertility in Hyde Park
Fertility by Age in Hyde Park
Average fertility rate in Hyde Park is 93.0 births per 1,000 women. Women in the age bracket of 15 to 19 years have the highest fertility rate with 125.0 births per 1,000 women. Women in the age bracket of 35 to 50 years acount for 42.5% of all women with births.
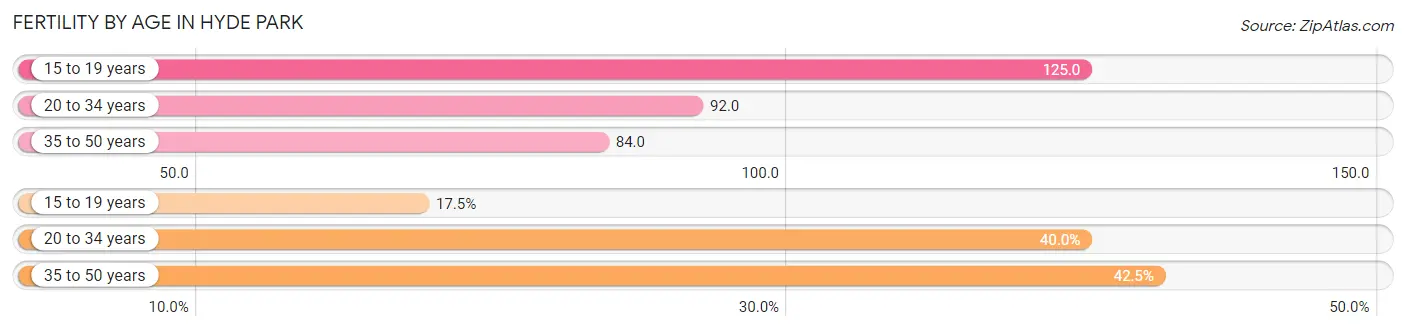
| Age Bracket | Women with Births | Births / 1,000 Women |
| 15 to 19 years | 7 (17.5%) | 125.0 |
| 20 to 34 years | 16 (40.0%) | 92.0 |
| 35 to 50 years | 17 (42.5%) | 84.0 |
| Total | 40 (100.0%) | 93.0 |
Fertility by Age by Marriage Status in Hyde Park
82.5% of women with births (40) in Hyde Park are married. The highest percentage of unmarried women with births falls into 15 to 19 years age bracket with 100.0% of them unmarried at the time of birth, while the lowest percentage of unmarried women with births belong to 20 to 34 years age bracket with 0.0% of them unmarried.
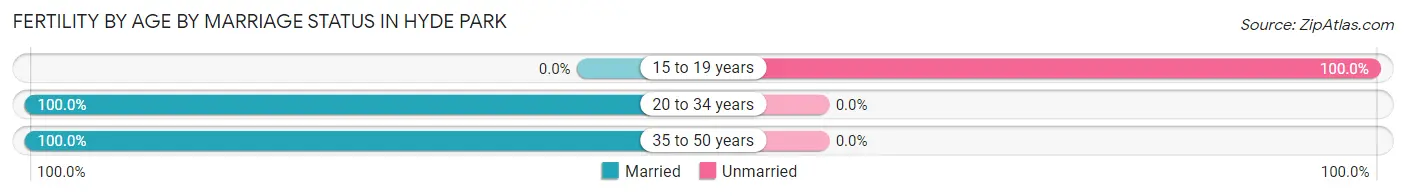
| Age Bracket | Married | Unmarried |
| 15 to 19 years | 0 (0.0%) | 7 (100.0%) |
| 20 to 34 years | 16 (100.0%) | 0 (0.0%) |
| 35 to 50 years | 17 (100.0%) | 0 (0.0%) |
| Total | 33 (82.5%) | 7 (17.5%) |
Fertility by Education in Hyde Park
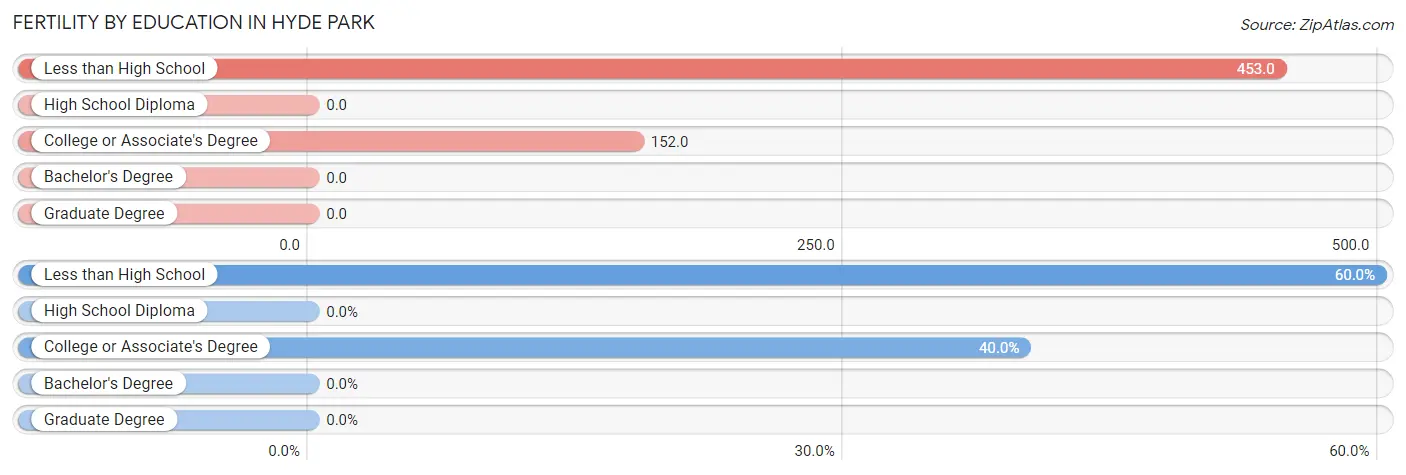
| Educational Attainment | Women with Births | Births / 1,000 Women |
| Less than High School | 24 (60.0%) | 453.0 |
| High School Diploma | 0 (0.0%) | 0.0 |
| College or Associate's Degree | 16 (40.0%) | 152.0 |
| Bachelor's Degree | 0 (0.0%) | 0.0 |
| Graduate Degree | 0 (0.0%) | 0.0 |
| Total | 40 (100.0%) | 93.0 |
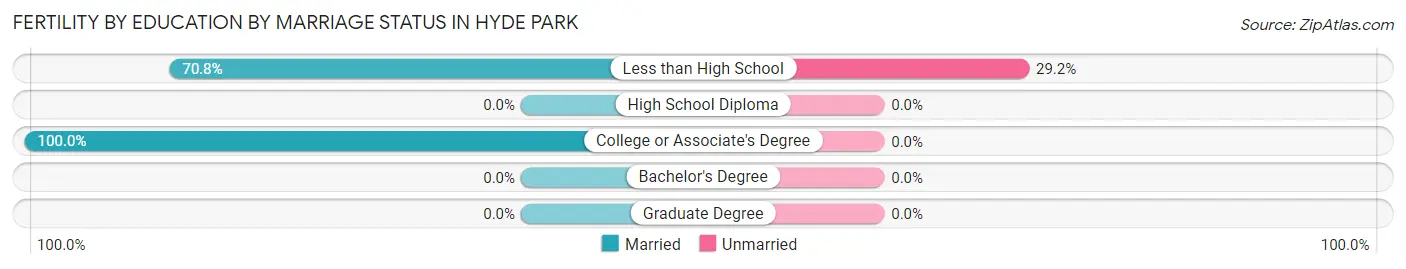
Fertility by Education by Marriage Status in Hyde Park
17.5% of women with births in Hyde Park are unmarried. Women with the educational attainment of college or associate's degree are most likely to be married with 100.0% of them married at childbirth, while women with the educational attainment of less than high school are least likely to be married with 29.2% of them unmarried at childbirth.
| Educational Attainment | Married | Unmarried |
| Less than High School | 17 (70.8%) | 7 (29.2%) |
| High School Diploma | 0 (0.0%) | 0 (0.0%) |
| College or Associate's Degree | 16 (100.0%) | 0 (0.0%) |
| Bachelor's Degree | 0 (0.0%) | 0 (0.0%) |
| Graduate Degree | 0 (0.0%) | 0 (0.0%) |
| Total | 33 (82.5%) | 7 (17.5%) |
Employment Characteristics in Hyde Park
Employment by Class of Employer in Hyde Park
Among the 1,156 employed individuals in Hyde Park, private company employees (859 | 74.3%), not-for-profit organizations (152 | 13.2%), and federal government employees (70 | 6.1%) make up the most common classes of employment.
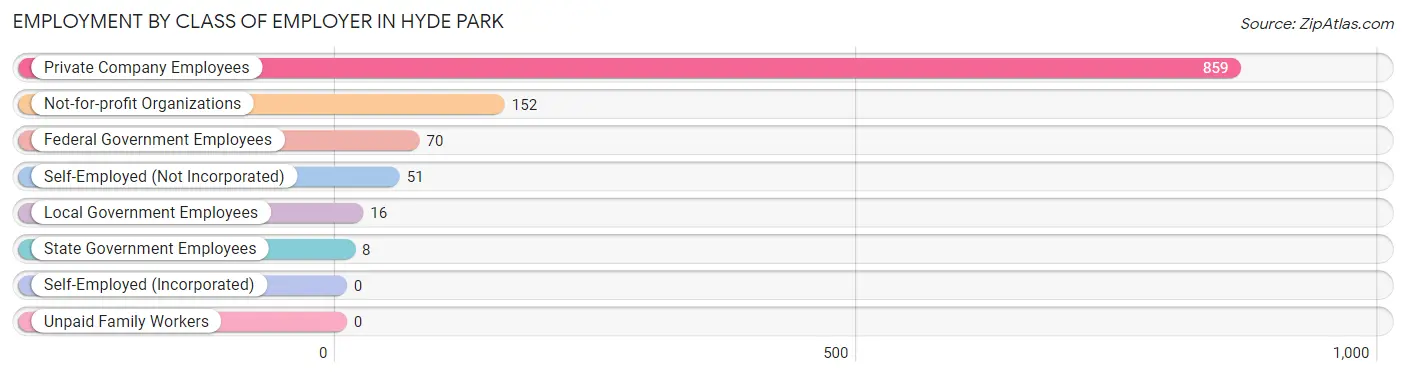
| Employer Class | # Employees | % Employees |
| Private Company Employees | 859 | 74.3% |
| Self-Employed (Incorporated) | 0 | 0.0% |
| Self-Employed (Not Incorporated) | 51 | 4.4% |
| Not-for-profit Organizations | 152 | 13.2% |
| Local Government Employees | 16 | 1.4% |
| State Government Employees | 8 | 0.7% |
| Federal Government Employees | 70 | 6.1% |
| Unpaid Family Workers | 0 | 0.0% |
| Total | 1,156 | 100.0% |
Employment Status by Age in Hyde Park
According to the labor force statistics for Hyde Park, out of the total population over 16 years of age (1,839), 69.8% or 1,284 individuals are in the labor force, with 7.6% or 98 of them unemployed. The age group with the highest labor force participation rate is 30 to 34 years, with 100.0% or 118 individuals in the labor force. Within the labor force, the 25 to 29 years age range has the highest percentage of unemployed individuals, with 27.4% or 32 of them being unemployed.
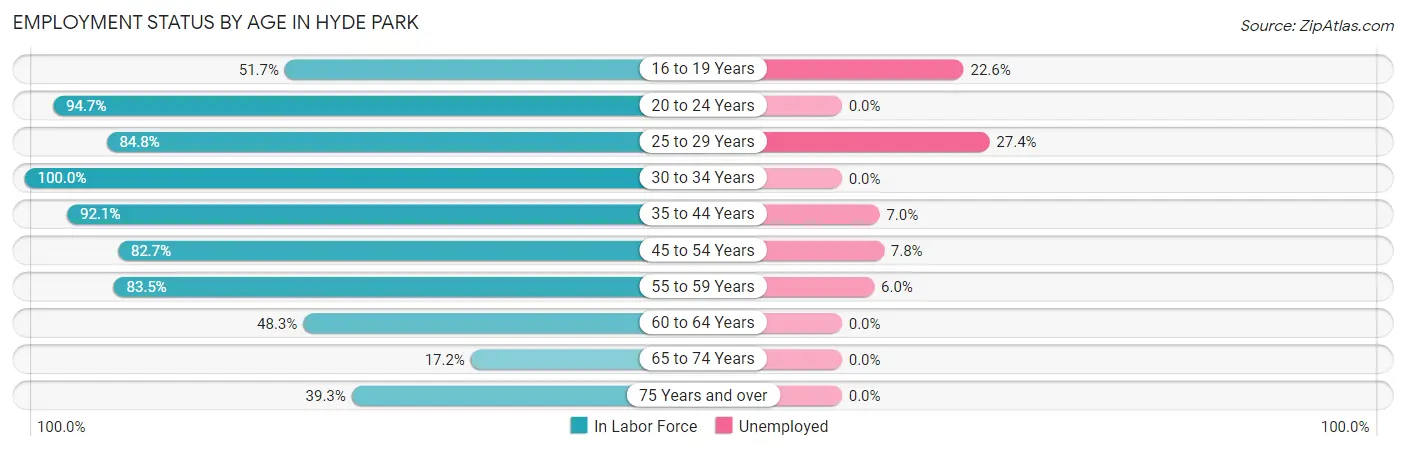
| Age Bracket | In Labor Force | Unemployed |
| 16 to 19 Years | 93 (51.7%) | 21 (22.6%) |
| 20 to 24 Years | 143 (94.7%) | 0 (0.0%) |
| 25 to 29 Years | 117 (84.8%) | 32 (27.4%) |
| 30 to 34 Years | 118 (100.0%) | 0 (0.0%) |
| 35 to 44 Years | 256 (92.1%) | 18 (7.0%) |
| 45 to 54 Years | 258 (82.7%) | 20 (7.8%) |
| 55 to 59 Years | 116 (83.5%) | 7 (6.0%) |
| 60 to 64 Years | 58 (48.3%) | 0 (0.0%) |
| 65 to 74 Years | 26 (17.2%) | 0 (0.0%) |
| 75 Years and over | 99 (39.3%) | 0 (0.0%) |
| Total | 1,284 (69.8%) | 98 (7.6%) |
Employment Status by Educational Attainment in Hyde Park
According to labor force statistics for Hyde Park, 83.5% of individuals (923) out of the total population between 25 and 64 years of age (1,105) are in the labor force, with 8.3% or 77 of them being unemployed. The group with the highest labor force participation rate are those with the educational attainment of college / associate degree, with 89.9% or 170 individuals in the labor force. Within the labor force, individuals with less than high school education have the highest percentage of unemployment, with 27.2% or 31 of them being unemployed.
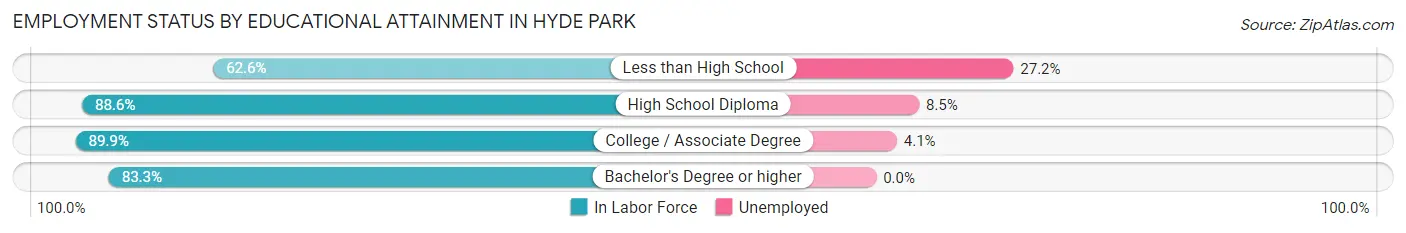
| Educational Attainment | In Labor Force | Unemployed |
| Less than High School | 114 (62.6%) | 50 (27.2%) |
| High School Diploma | 459 (88.6%) | 44 (8.5%) |
| College / Associate Degree | 170 (89.9%) | 8 (4.1%) |
| Bachelor's Degree or higher | 180 (83.3%) | 0 (0.0%) |
| Total | 923 (83.5%) | 92 (8.3%) |
Employment Occupations by Sex in Hyde Park
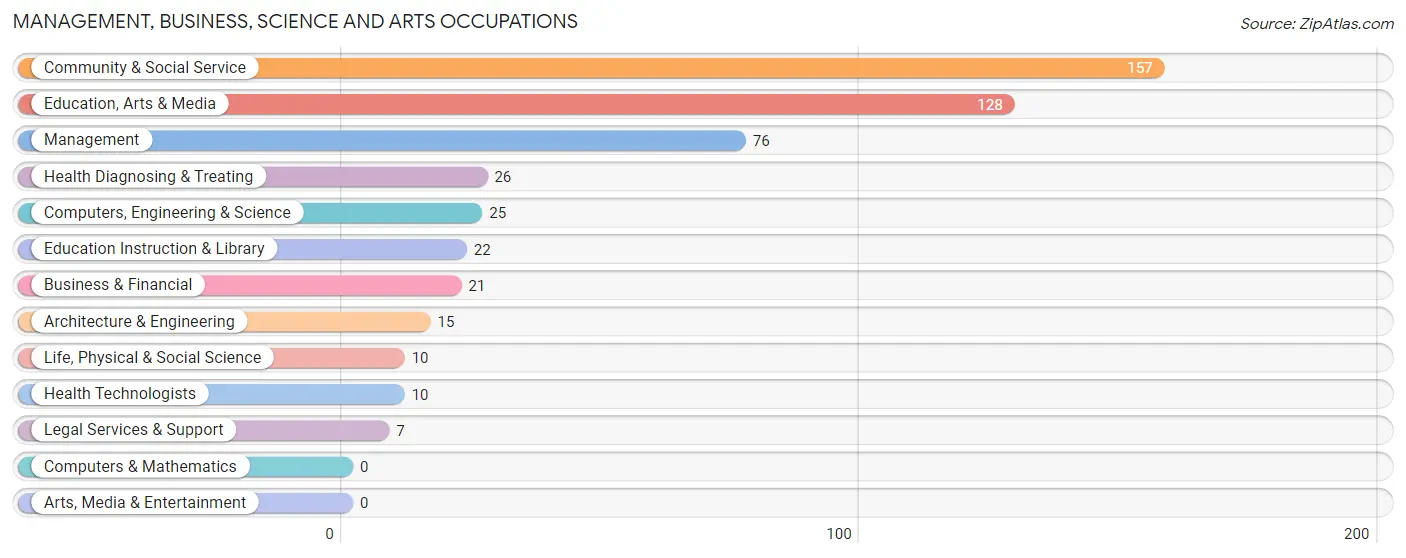
Management, Business, Science and Arts Occupations
The most common Management, Business, Science and Arts occupations in Hyde Park are Community & Social Service (157 | 13.2%), Education, Arts & Media (128 | 10.8%), Management (76 | 6.4%), Health Diagnosing & Treating (26 | 2.2%), and Computers, Engineering & Science (25 | 2.1%).
Management, Business, Science and Arts Occupations by Sex
Within the Management, Business, Science and Arts occupations in Hyde Park, the most male-oriented occupations are Education, Arts & Media (82.8%), Community & Social Service (67.5%), and Architecture & Engineering (53.3%), while the most female-oriented occupations are Business & Financial (100.0%), Life, Physical & Social Science (100.0%), and Legal Services & Support (100.0%).
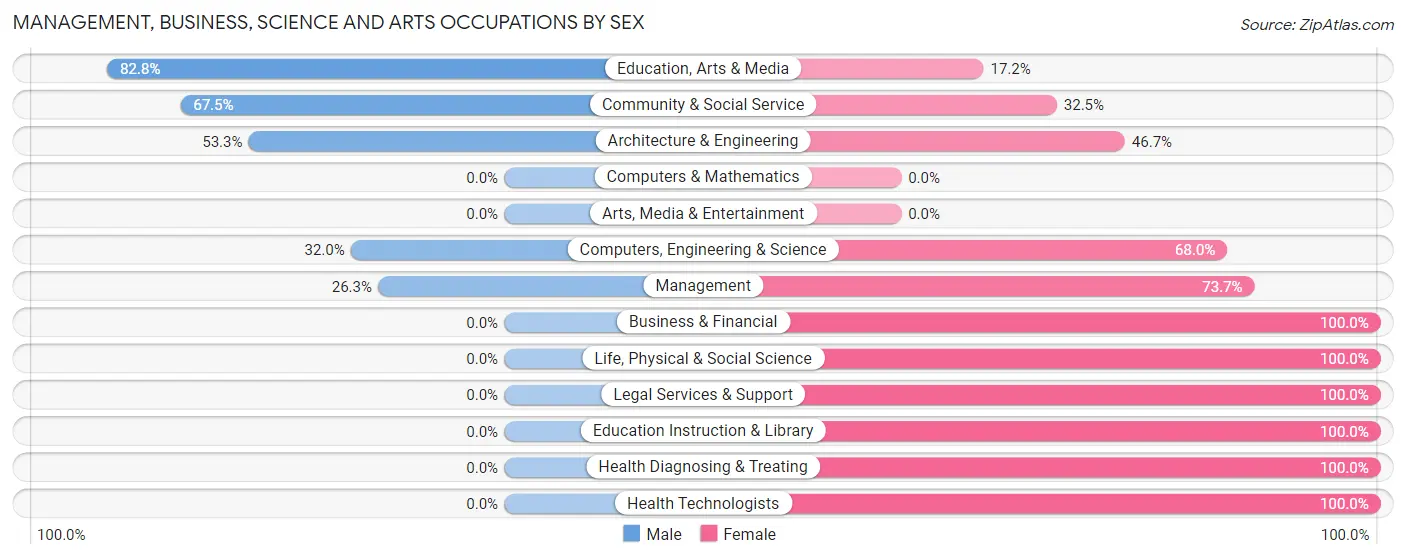
| Occupation | Male | Female |
| Management | 20 (26.3%) | 56 (73.7%) |
| Business & Financial | 0 (0.0%) | 21 (100.0%) |
| Computers, Engineering & Science | 8 (32.0%) | 17 (68.0%) |
| Computers & Mathematics | 0 (0.0%) | 0 (0.0%) |
| Architecture & Engineering | 8 (53.3%) | 7 (46.7%) |
| Life, Physical & Social Science | 0 (0.0%) | 10 (100.0%) |
| Community & Social Service | 106 (67.5%) | 51 (32.5%) |
| Education, Arts & Media | 106 (82.8%) | 22 (17.2%) |
| Legal Services & Support | 0 (0.0%) | 7 (100.0%) |
| Education Instruction & Library | 0 (0.0%) | 22 (100.0%) |
| Arts, Media & Entertainment | 0 (0.0%) | 0 (0.0%) |
| Health Diagnosing & Treating | 0 (0.0%) | 26 (100.0%) |
| Health Technologists | 0 (0.0%) | 10 (100.0%) |
| Total (Category) | 134 (43.9%) | 171 (56.1%) |
| Total (Overall) | 700 (59.0%) | 486 (41.0%) |
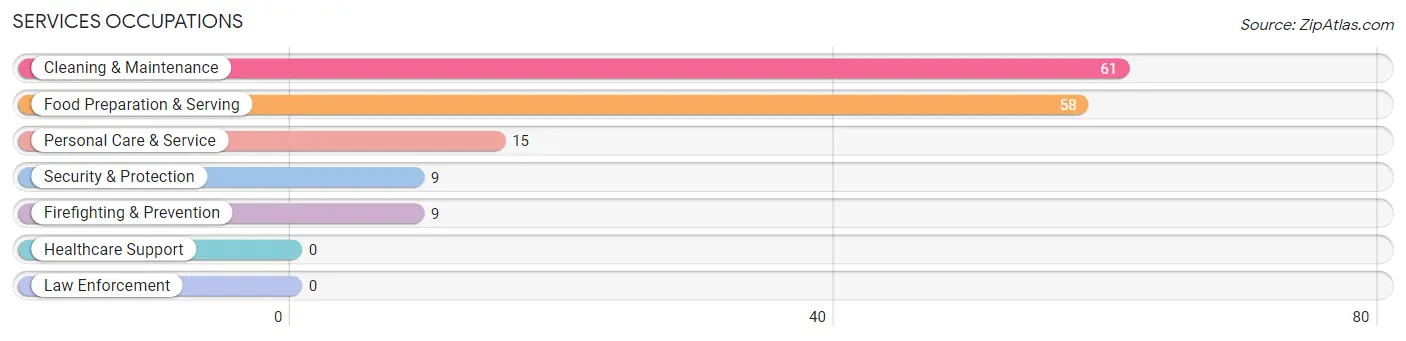
Services Occupations
The most common Services occupations in Hyde Park are Cleaning & Maintenance (61 | 5.1%), Food Preparation & Serving (58 | 4.9%), Personal Care & Service (15 | 1.3%), Security & Protection (9 | 0.8%), and Firefighting & Prevention (9 | 0.8%).
Services Occupations by Sex
Within the Services occupations in Hyde Park, the most male-oriented occupations are Security & Protection (100.0%), Firefighting & Prevention (100.0%), and Food Preparation & Serving (53.4%), while the most female-oriented occupations are Personal Care & Service (100.0%), Cleaning & Maintenance (63.9%), and Food Preparation & Serving (46.6%).
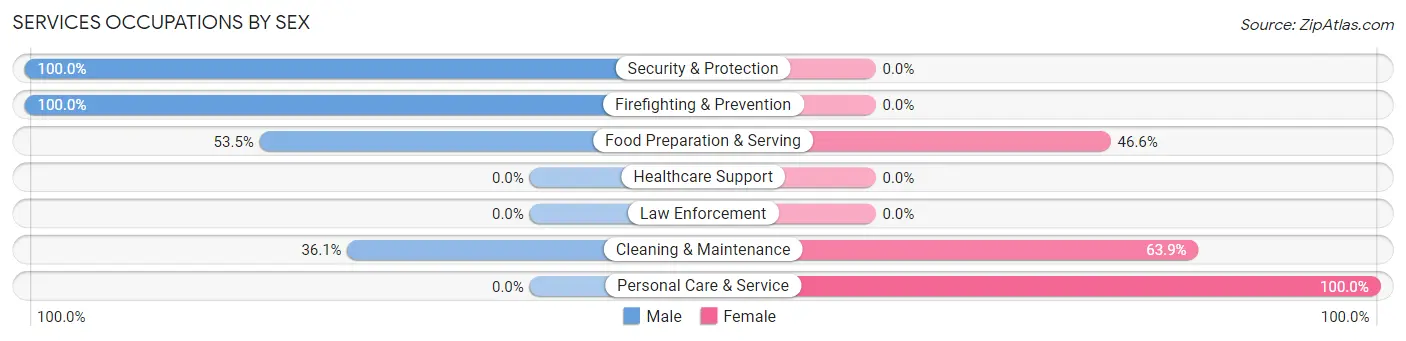
| Occupation | Male | Female |
| Healthcare Support | 0 (0.0%) | 0 (0.0%) |
| Security & Protection | 9 (100.0%) | 0 (0.0%) |
| Firefighting & Prevention | 9 (100.0%) | 0 (0.0%) |
| Law Enforcement | 0 (0.0%) | 0 (0.0%) |
| Food Preparation & Serving | 31 (53.4%) | 27 (46.6%) |
| Cleaning & Maintenance | 22 (36.1%) | 39 (63.9%) |
| Personal Care & Service | 0 (0.0%) | 15 (100.0%) |
| Total (Category) | 62 (43.4%) | 81 (56.6%) |
| Total (Overall) | 700 (59.0%) | 486 (41.0%) |
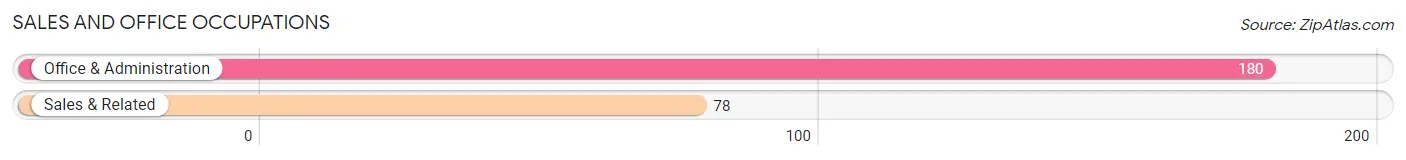
Sales and Office Occupations
The most common Sales and Office occupations in Hyde Park are Office & Administration (180 | 15.2%), and Sales & Related (78 | 6.6%).
Sales and Office Occupations by Sex
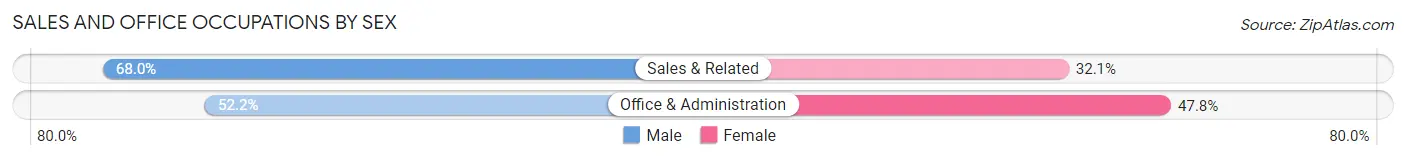
| Occupation | Male | Female |
| Sales & Related | 53 (67.9%) | 25 (32.1%) |
| Office & Administration | 94 (52.2%) | 86 (47.8%) |
| Total (Category) | 147 (57.0%) | 111 (43.0%) |
| Total (Overall) | 700 (59.0%) | 486 (41.0%) |
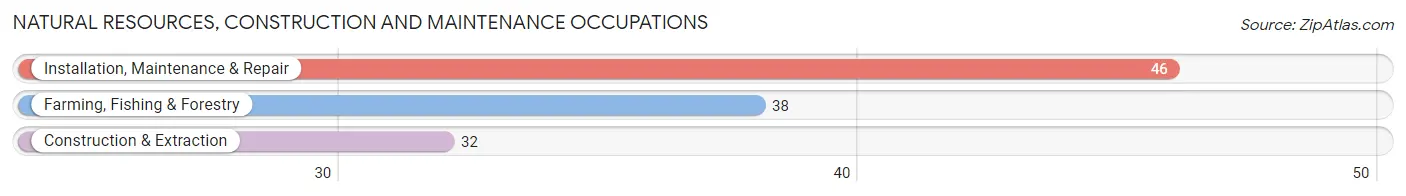
Natural Resources, Construction and Maintenance Occupations
The most common Natural Resources, Construction and Maintenance occupations in Hyde Park are Installation, Maintenance & Repair (46 | 3.9%), Farming, Fishing & Forestry (38 | 3.2%), and Construction & Extraction (32 | 2.7%).
Natural Resources, Construction and Maintenance Occupations by Sex
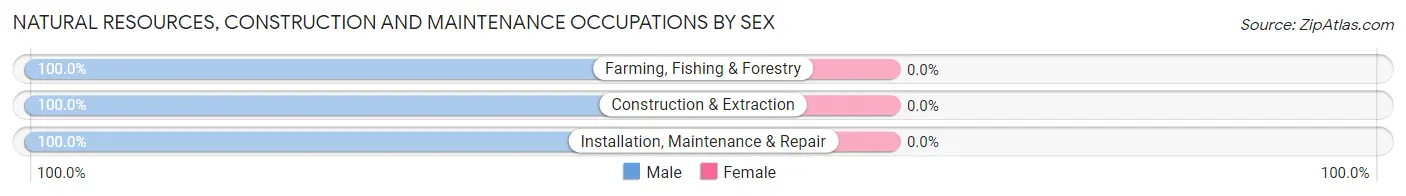
| Occupation | Male | Female |
| Farming, Fishing & Forestry | 38 (100.0%) | 0 (0.0%) |
| Construction & Extraction | 32 (100.0%) | 0 (0.0%) |
| Installation, Maintenance & Repair | 46 (100.0%) | 0 (0.0%) |
| Total (Category) | 116 (100.0%) | 0 (0.0%) |
| Total (Overall) | 700 (59.0%) | 486 (41.0%) |
Production, Transportation and Moving Occupations
The most common Production, Transportation and Moving occupations in Hyde Park are Production (159 | 13.4%), Material Moving (135 | 11.4%), and Transportation (70 | 5.9%).
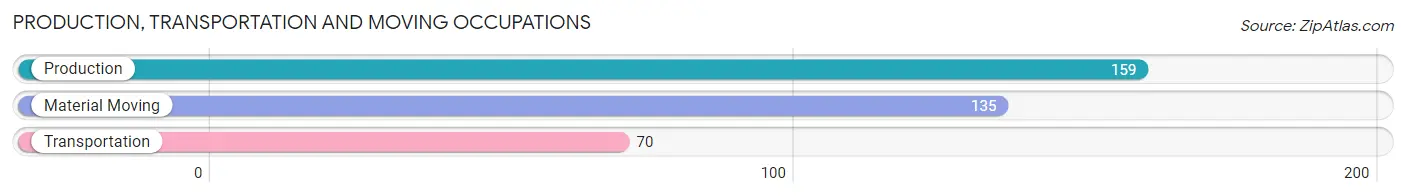
Production, Transportation and Moving Occupations by Sex
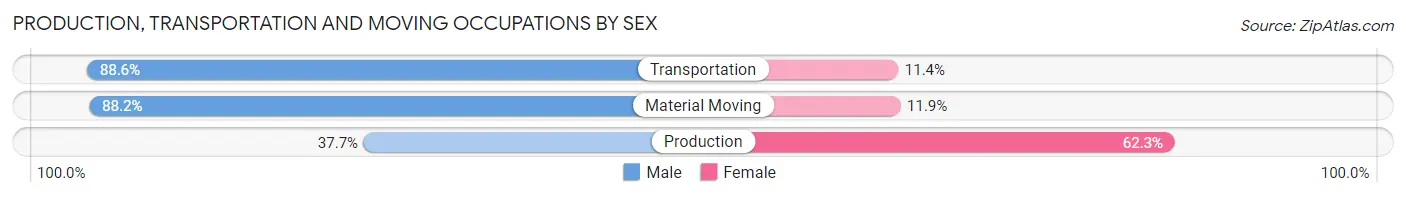
| Occupation | Male | Female |
| Production | 60 (37.7%) | 99 (62.3%) |
| Transportation | 62 (88.6%) | 8 (11.4%) |
| Material Moving | 119 (88.1%) | 16 (11.8%) |
| Total (Category) | 241 (66.2%) | 123 (33.8%) |
| Total (Overall) | 700 (59.0%) | 486 (41.0%) |
Employment Industries by Sex in Hyde Park
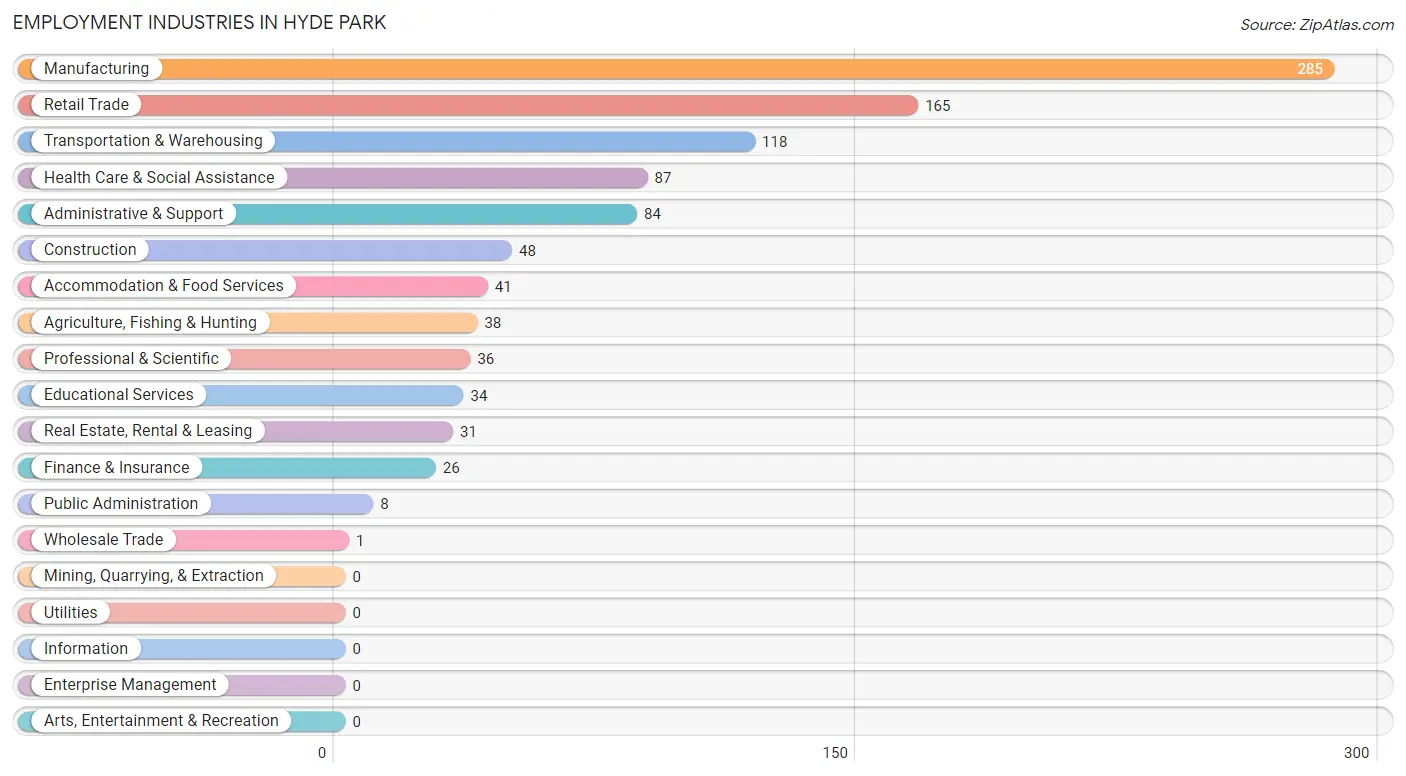
Employment Industries in Hyde Park
The major employment industries in Hyde Park include Manufacturing (285 | 24.0%), Retail Trade (165 | 13.9%), Transportation & Warehousing (118 | 10.0%), Health Care & Social Assistance (87 | 7.3%), and Administrative & Support (84 | 7.1%).
Employment Industries by Sex in Hyde Park
The Hyde Park industries that see more men than women are Agriculture, Fishing & Hunting (100.0%), Construction (100.0%), and Transportation & Warehousing (100.0%), whereas the industries that tend to have a higher number of women are Wholesale Trade (100.0%), Public Administration (100.0%), and Educational Services (76.5%).
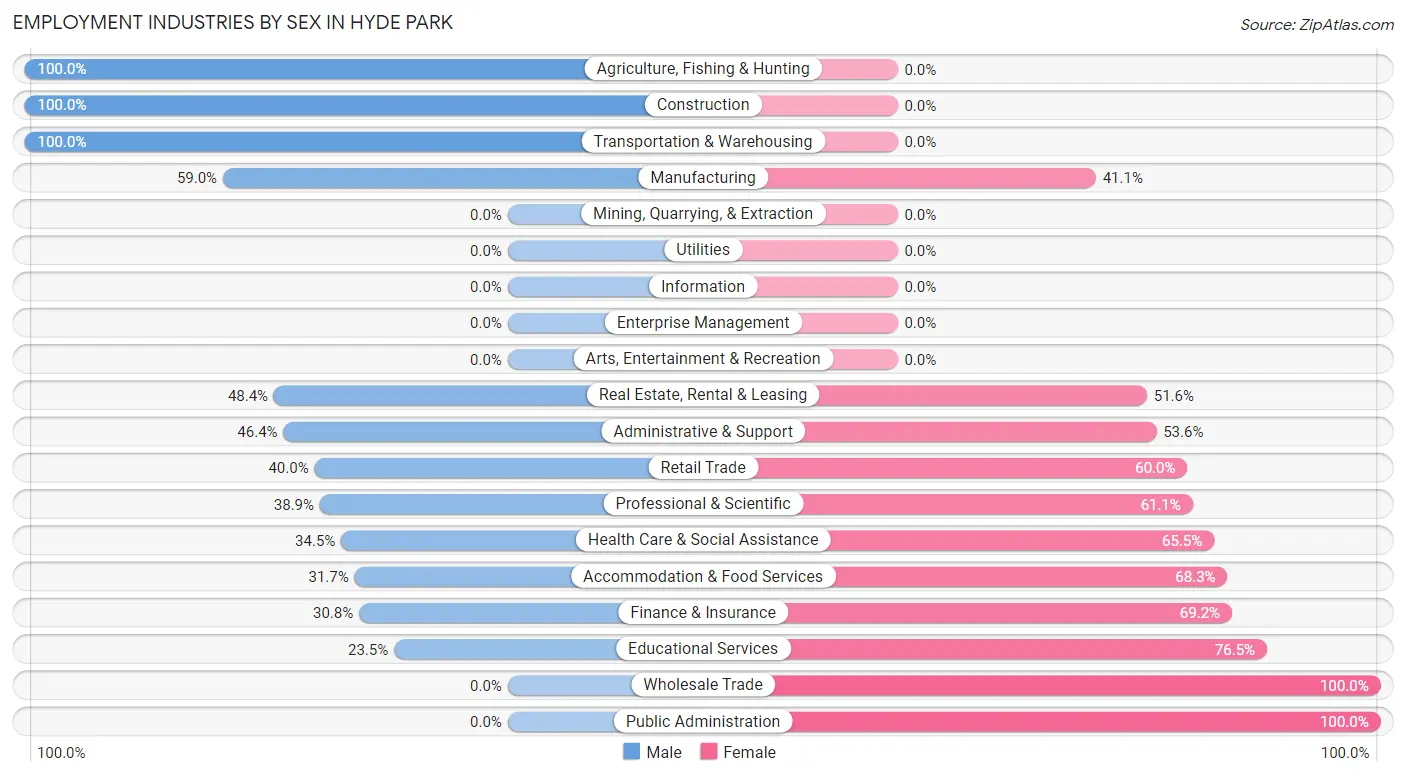
| Industry | Male | Female |
| Agriculture, Fishing & Hunting | 38 (100.0%) | 0 (0.0%) |
| Mining, Quarrying, & Extraction | 0 (0.0%) | 0 (0.0%) |
| Construction | 48 (100.0%) | 0 (0.0%) |
| Manufacturing | 168 (59.0%) | 117 (41.0%) |
| Wholesale Trade | 0 (0.0%) | 1 (100.0%) |
| Retail Trade | 66 (40.0%) | 99 (60.0%) |
| Transportation & Warehousing | 118 (100.0%) | 0 (0.0%) |
| Utilities | 0 (0.0%) | 0 (0.0%) |
| Information | 0 (0.0%) | 0 (0.0%) |
| Finance & Insurance | 8 (30.8%) | 18 (69.2%) |
| Real Estate, Rental & Leasing | 15 (48.4%) | 16 (51.6%) |
| Professional & Scientific | 14 (38.9%) | 22 (61.1%) |
| Enterprise Management | 0 (0.0%) | 0 (0.0%) |
| Administrative & Support | 39 (46.4%) | 45 (53.6%) |
| Educational Services | 8 (23.5%) | 26 (76.5%) |
| Health Care & Social Assistance | 30 (34.5%) | 57 (65.5%) |
| Arts, Entertainment & Recreation | 0 (0.0%) | 0 (0.0%) |
| Accommodation & Food Services | 13 (31.7%) | 28 (68.3%) |
| Public Administration | 0 (0.0%) | 8 (100.0%) |
| Total | 700 (59.0%) | 486 (41.0%) |
Education in Hyde Park
School Enrollment in Hyde Park
The most common levels of schooling among the 450 students in Hyde Park are high school (154 | 34.2%), elementary school (135 | 30.0%), and middle school (62 | 13.8%).
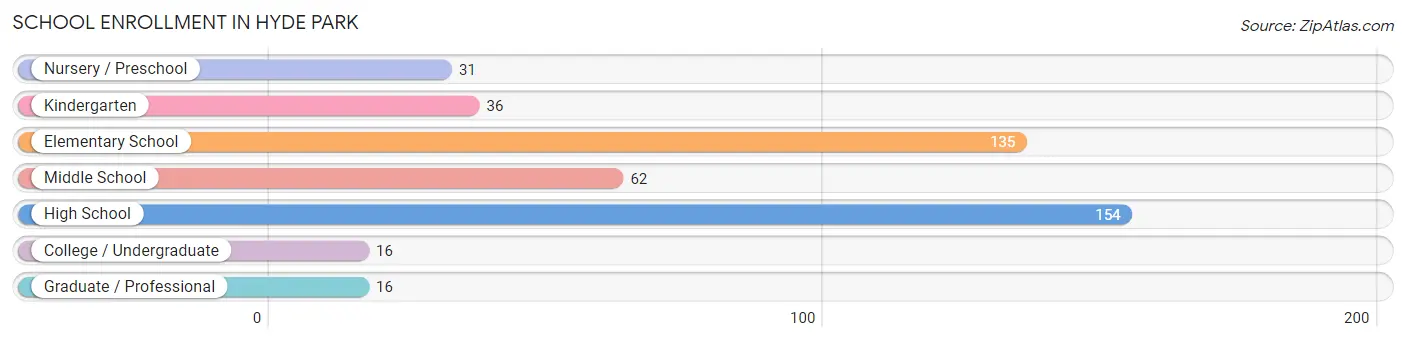
| School Level | # Students | % Students |
| Nursery / Preschool | 31 | 6.9% |
| Kindergarten | 36 | 8.0% |
| Elementary School | 135 | 30.0% |
| Middle School | 62 | 13.8% |
| High School | 154 | 34.2% |
| College / Undergraduate | 16 | 3.6% |
| Graduate / Professional | 16 | 3.6% |
| Total | 450 | 100.0% |
School Enrollment by Age by Funding Source in Hyde Park
Out of a total of 450 students who are enrolled in schools in Hyde Park, 50 (11.1%) attend a private institution, while the remaining 400 (88.9%) are enrolled in public schools. The age group of 3 to 4 year olds has the highest likelihood of being enrolled in private schools, with 7 (100.0% in the age bracket) enrolled. Conversely, the age group of 10 to 14 year olds has the lowest likelihood of being enrolled in a private school, with 93 (100.0% in the age bracket) attending a public institution.
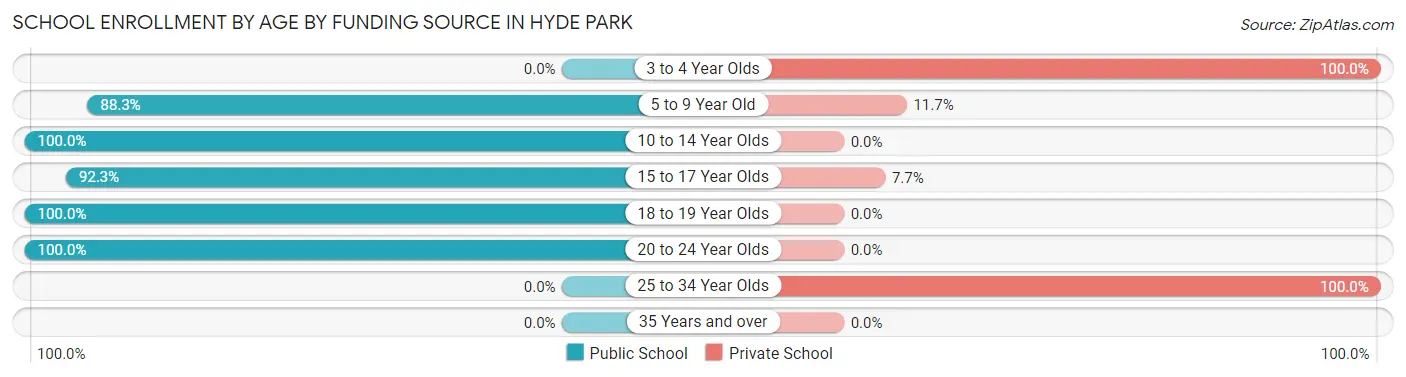
| Age Bracket | Public School | Private School |
| 3 to 4 Year Olds | 0 (0.0%) | 7 (100.0%) |
| 5 to 9 Year Old | 151 (88.3%) | 20 (11.7%) |
| 10 to 14 Year Olds | 93 (100.0%) | 0 (0.0%) |
| 15 to 17 Year Olds | 84 (92.3%) | 7 (7.7%) |
| 18 to 19 Year Olds | 35 (100.0%) | 0 (0.0%) |
| 20 to 24 Year Olds | 37 (100.0%) | 0 (0.0%) |
| 25 to 34 Year Olds | 0 (0.0%) | 16 (100.0%) |
| 35 Years and over | 0 (0.0%) | 0 (0.0%) |
| Total | 400 (88.9%) | 50 (11.1%) |
Educational Attainment by Field of Study in Hyde Park
Business (90 | 32.9%), liberal arts & history (55 | 20.1%), psychology (31 | 11.3%), science & technology (21 | 7.7%), and education (18 | 6.6%) are the most common fields of study among 274 individuals in Hyde Park who have obtained a bachelor's degree or higher.
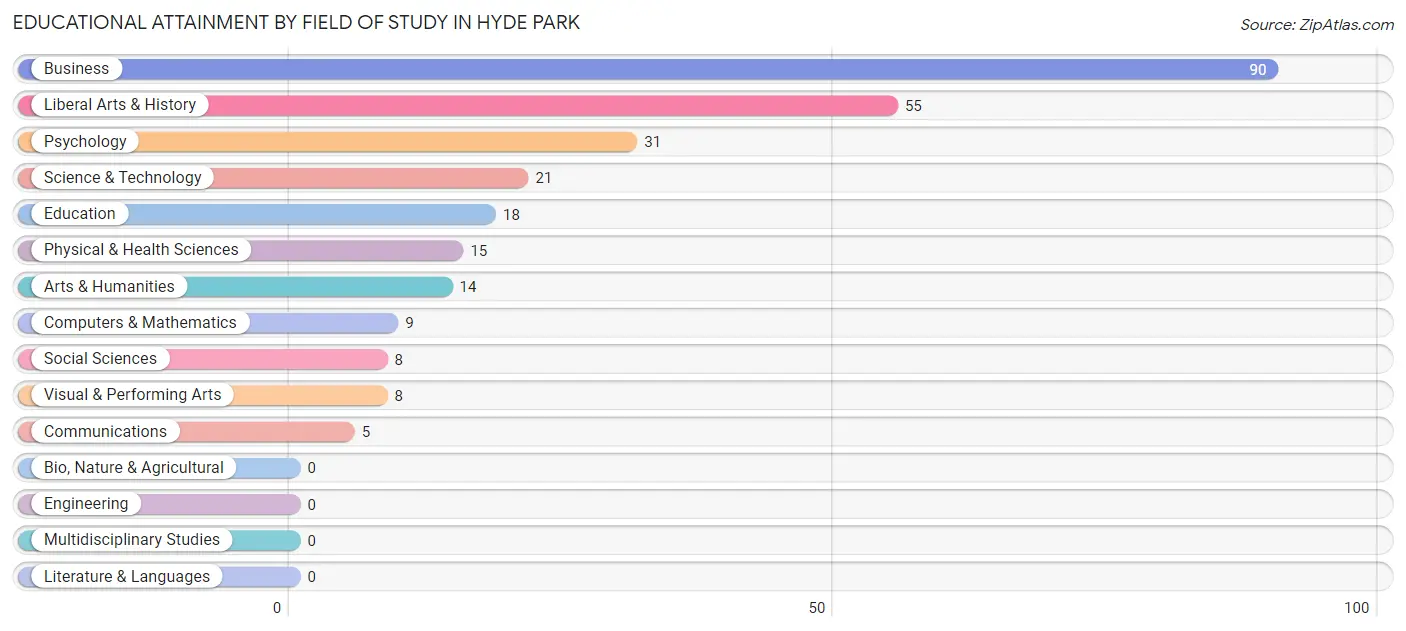
| Field of Study | # Graduates | % Graduates |
| Computers & Mathematics | 9 | 3.3% |
| Bio, Nature & Agricultural | 0 | 0.0% |
| Physical & Health Sciences | 15 | 5.5% |
| Psychology | 31 | 11.3% |
| Social Sciences | 8 | 2.9% |
| Engineering | 0 | 0.0% |
| Multidisciplinary Studies | 0 | 0.0% |
| Science & Technology | 21 | 7.7% |
| Business | 90 | 32.9% |
| Education | 18 | 6.6% |
| Literature & Languages | 0 | 0.0% |
| Liberal Arts & History | 55 | 20.1% |
| Visual & Performing Arts | 8 | 2.9% |
| Communications | 5 | 1.8% |
| Arts & Humanities | 14 | 5.1% |
| Total | 274 | 100.0% |
Transportation & Commute in Hyde Park
Vehicle Availability by Sex in Hyde Park
The most prevalent vehicle ownership categories in Hyde Park are males with 3 vehicles (257, accounting for 38.4%) and females with 3 vehicles (140, making up 53.2%).
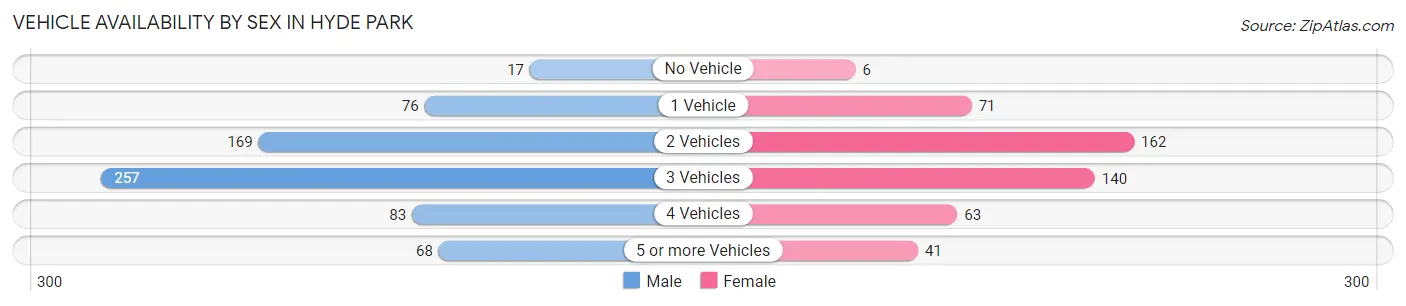
| Vehicles Available | Male | Female |
| No Vehicle | 17 (2.5%) | 6 (1.2%) |
| 1 Vehicle | 76 (11.3%) | 71 (14.7%) |
| 2 Vehicles | 169 (25.2%) | 162 (33.5%) |
| 3 Vehicles | 257 (38.4%) | 140 (29.0%) |
| 4 Vehicles | 83 (12.4%) | 63 (13.0%) |
| 5 or more Vehicles | 68 (10.2%) | 41 (8.5%) |
| Total | 670 (100.0%) | 483 (100.0%) |
Commute Time in Hyde Park
The most frequently occuring commute durations in Hyde Park are 15 to 19 minutes (277 commuters, 24.9%), 20 to 24 minutes (203 commuters, 18.2%), and 5 to 9 minutes (161 commuters, 14.5%).
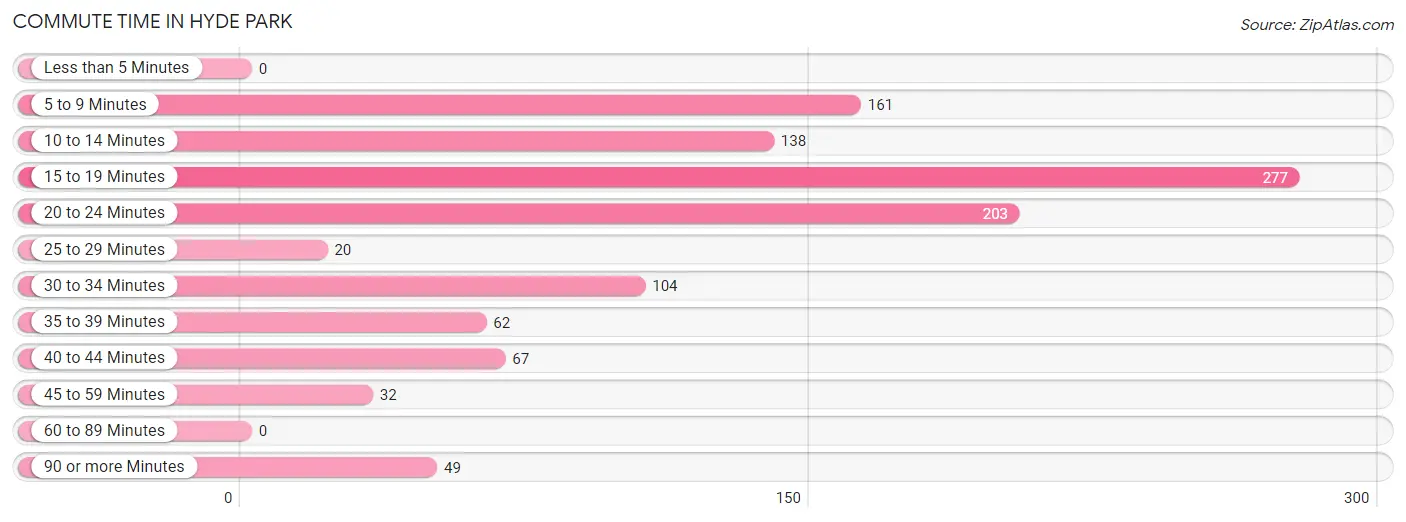
| Commute Time | # Commuters | % Commuters |
| Less than 5 Minutes | 0 | 0.0% |
| 5 to 9 Minutes | 161 | 14.5% |
| 10 to 14 Minutes | 138 | 12.4% |
| 15 to 19 Minutes | 277 | 24.9% |
| 20 to 24 Minutes | 203 | 18.2% |
| 25 to 29 Minutes | 20 | 1.8% |
| 30 to 34 Minutes | 104 | 9.3% |
| 35 to 39 Minutes | 62 | 5.6% |
| 40 to 44 Minutes | 67 | 6.0% |
| 45 to 59 Minutes | 32 | 2.9% |
| 60 to 89 Minutes | 0 | 0.0% |
| 90 or more Minutes | 49 | 4.4% |
Commute Time by Sex in Hyde Park
The most common commute times in Hyde Park are 15 to 19 minutes (193 commuters, 28.8%) for males and 15 to 19 minutes (84 commuters, 19.0%) for females.
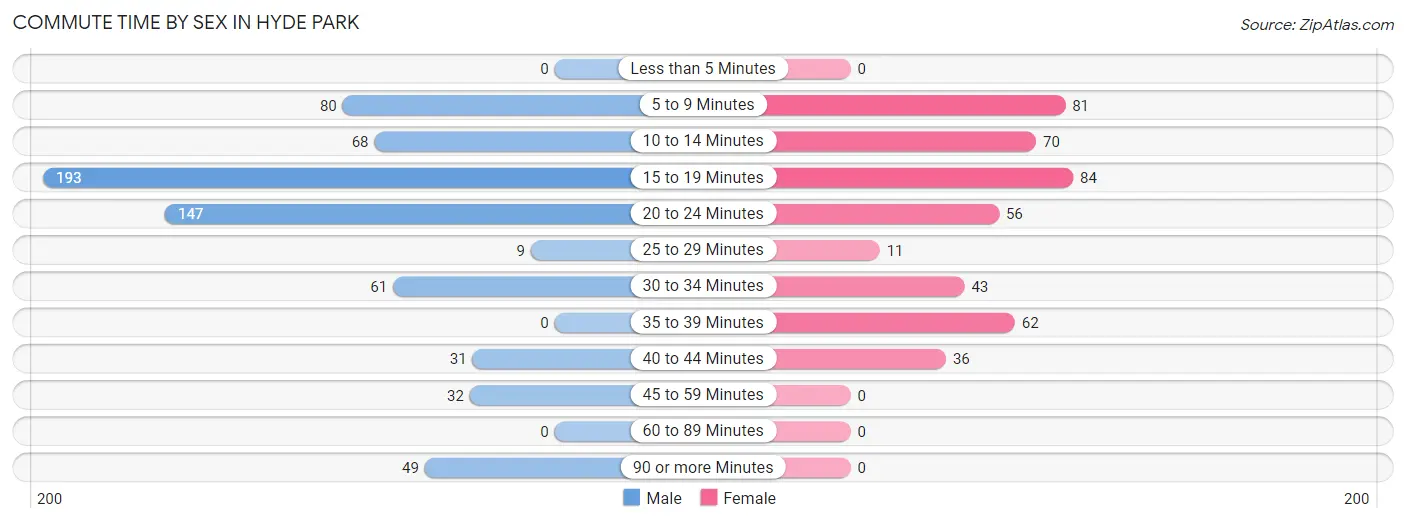
| Commute Time | Male | Female |
| Less than 5 Minutes | 0 (0.0%) | 0 (0.0%) |
| 5 to 9 Minutes | 80 (11.9%) | 81 (18.3%) |
| 10 to 14 Minutes | 68 (10.2%) | 70 (15.8%) |
| 15 to 19 Minutes | 193 (28.8%) | 84 (19.0%) |
| 20 to 24 Minutes | 147 (21.9%) | 56 (12.6%) |
| 25 to 29 Minutes | 9 (1.3%) | 11 (2.5%) |
| 30 to 34 Minutes | 61 (9.1%) | 43 (9.7%) |
| 35 to 39 Minutes | 0 (0.0%) | 62 (14.0%) |
| 40 to 44 Minutes | 31 (4.6%) | 36 (8.1%) |
| 45 to 59 Minutes | 32 (4.8%) | 0 (0.0%) |
| 60 to 89 Minutes | 0 (0.0%) | 0 (0.0%) |
| 90 or more Minutes | 49 (7.3%) | 0 (0.0%) |
Time of Departure to Work by Sex in Hyde Park
The most frequent times of departure to work in Hyde Park are 7:00 AM to 7:29 AM (138, 20.6%) for males and 12:00 AM to 4:59 AM (73, 16.5%) for females.
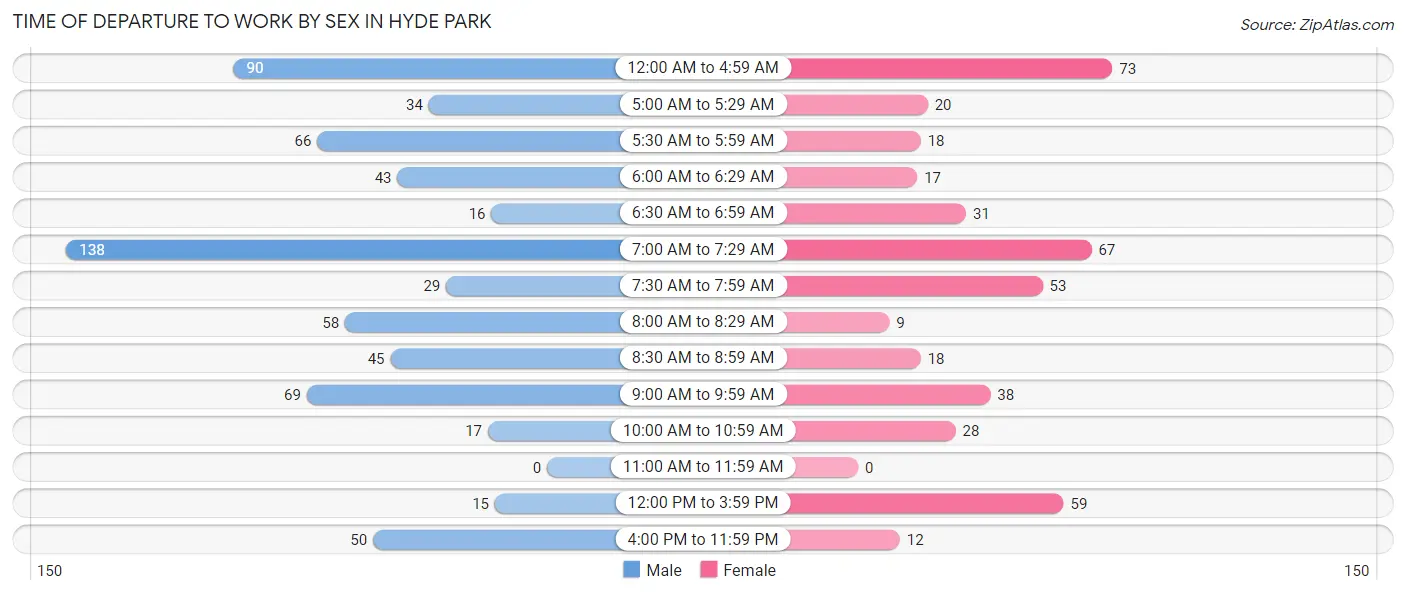
| Time of Departure | Male | Female |
| 12:00 AM to 4:59 AM | 90 (13.4%) | 73 (16.5%) |
| 5:00 AM to 5:29 AM | 34 (5.1%) | 20 (4.5%) |
| 5:30 AM to 5:59 AM | 66 (9.9%) | 18 (4.1%) |
| 6:00 AM to 6:29 AM | 43 (6.4%) | 17 (3.8%) |
| 6:30 AM to 6:59 AM | 16 (2.4%) | 31 (7.0%) |
| 7:00 AM to 7:29 AM | 138 (20.6%) | 67 (15.1%) |
| 7:30 AM to 7:59 AM | 29 (4.3%) | 53 (12.0%) |
| 8:00 AM to 8:29 AM | 58 (8.7%) | 9 (2.0%) |
| 8:30 AM to 8:59 AM | 45 (6.7%) | 18 (4.1%) |
| 9:00 AM to 9:59 AM | 69 (10.3%) | 38 (8.6%) |
| 10:00 AM to 10:59 AM | 17 (2.5%) | 28 (6.3%) |
| 11:00 AM to 11:59 AM | 0 (0.0%) | 0 (0.0%) |
| 12:00 PM to 3:59 PM | 15 (2.2%) | 59 (13.3%) |
| 4:00 PM to 11:59 PM | 50 (7.5%) | 12 (2.7%) |
| Total | 670 (100.0%) | 443 (100.0%) |
Housing Occupancy in Hyde Park
Occupancy by Ownership in Hyde Park
Of the total 781 dwellings in Hyde Park, owner-occupied units account for 590 (75.5%), while renter-occupied units make up 191 (24.5%).
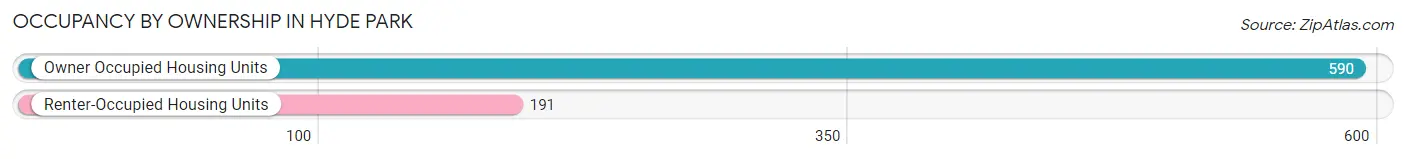
| Occupancy | # Housing Units | % Housing Units |
| Owner Occupied Housing Units | 590 | 75.5% |
| Renter-Occupied Housing Units | 191 | 24.5% |
| Total Occupied Housing Units | 781 | 100.0% |
Occupancy by Household Size in Hyde Park
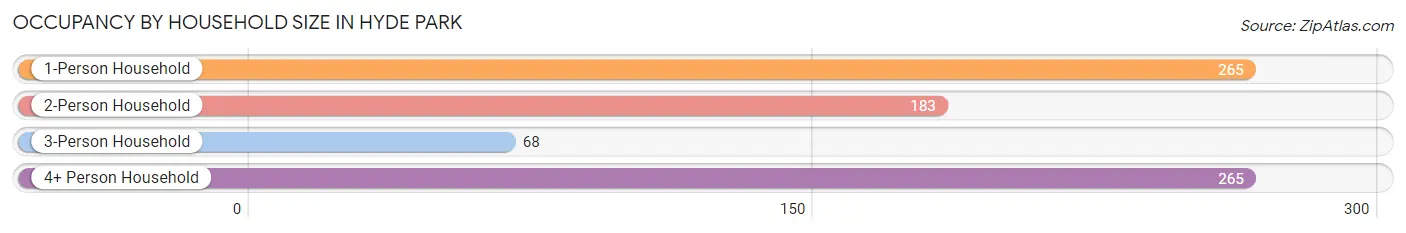
| Household Size | # Housing Units | % Housing Units |
| 1-Person Household | 265 | 33.9% |
| 2-Person Household | 183 | 23.4% |
| 3-Person Household | 68 | 8.7% |
| 4+ Person Household | 265 | 33.9% |
| Total Housing Units | 781 | 100.0% |
Occupancy by Ownership by Household Size in Hyde Park
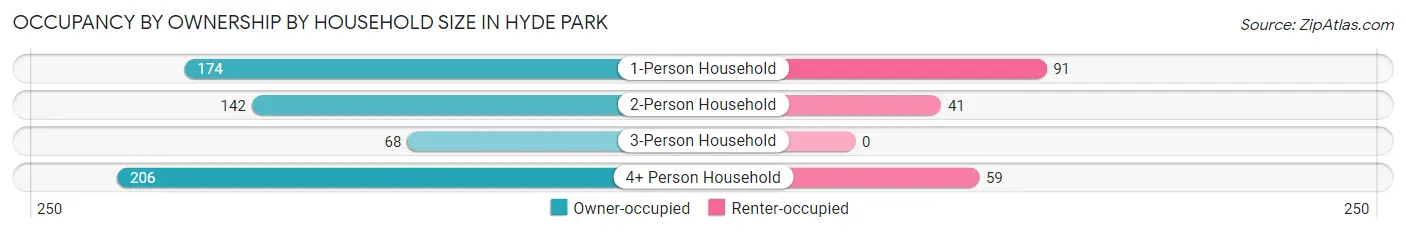
| Household Size | Owner-occupied | Renter-occupied |
| 1-Person Household | 174 (65.7%) | 91 (34.3%) |
| 2-Person Household | 142 (77.6%) | 41 (22.4%) |
| 3-Person Household | 68 (100.0%) | 0 (0.0%) |
| 4+ Person Household | 206 (77.7%) | 59 (22.3%) |
| Total Housing Units | 590 (75.5%) | 191 (24.5%) |
Occupancy by Educational Attainment in Hyde Park
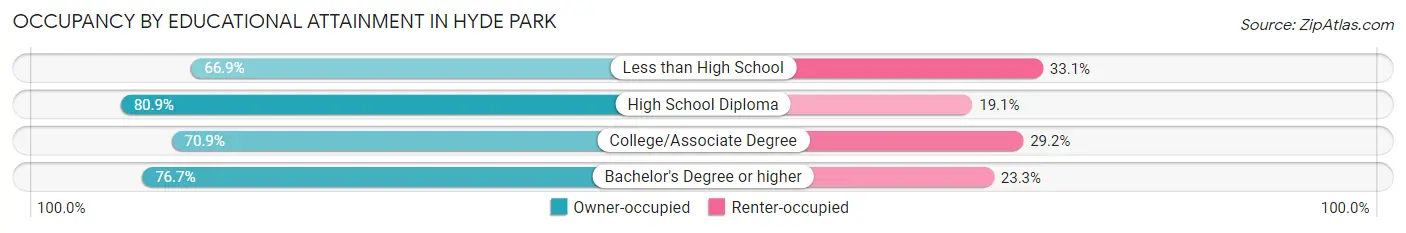
| Household Size | Owner-occupied | Renter-occupied |
| Less than High School | 81 (66.9%) | 40 (33.1%) |
| High School Diploma | 276 (80.9%) | 65 (19.1%) |
| College/Associate Degree | 141 (70.9%) | 58 (29.1%) |
| Bachelor's Degree or higher | 92 (76.7%) | 28 (23.3%) |
Occupancy by Age of Householder in Hyde Park
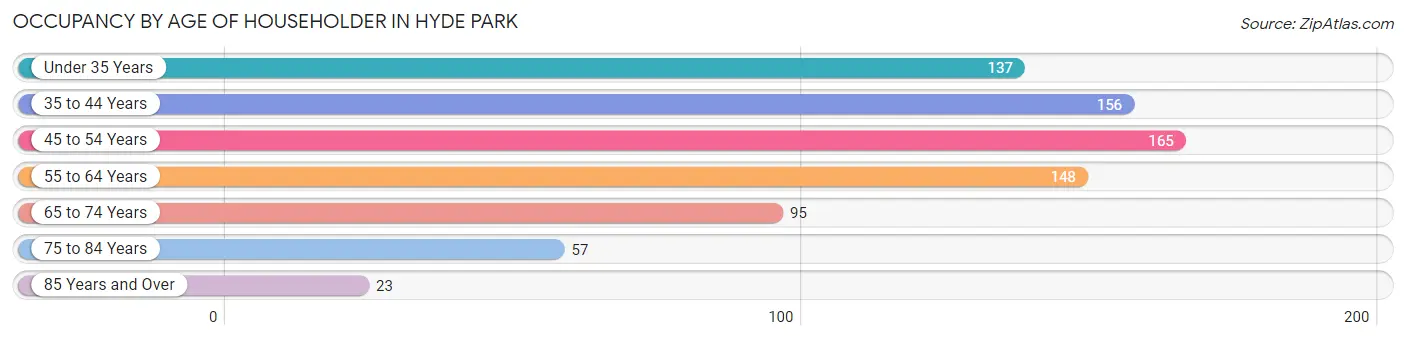
| Age Bracket | # Households | % Households |
| Under 35 Years | 137 | 17.5% |
| 35 to 44 Years | 156 | 20.0% |
| 45 to 54 Years | 165 | 21.1% |
| 55 to 64 Years | 148 | 19.0% |
| 65 to 74 Years | 95 | 12.2% |
| 75 to 84 Years | 57 | 7.3% |
| 85 Years and Over | 23 | 2.9% |
| Total | 781 | 100.0% |
Housing Finances in Hyde Park
Median Income by Occupancy in Hyde Park
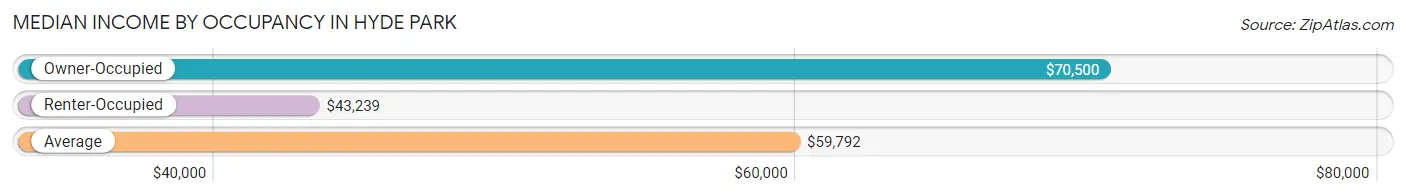
| Occupancy Type | # Households | Median Income |
| Owner-Occupied | 590 (75.5%) | $70,500 |
| Renter-Occupied | 191 (24.5%) | $43,239 |
| Average | 781 (100.0%) | $59,792 |
Occupancy by Householder Income Bracket in Hyde Park
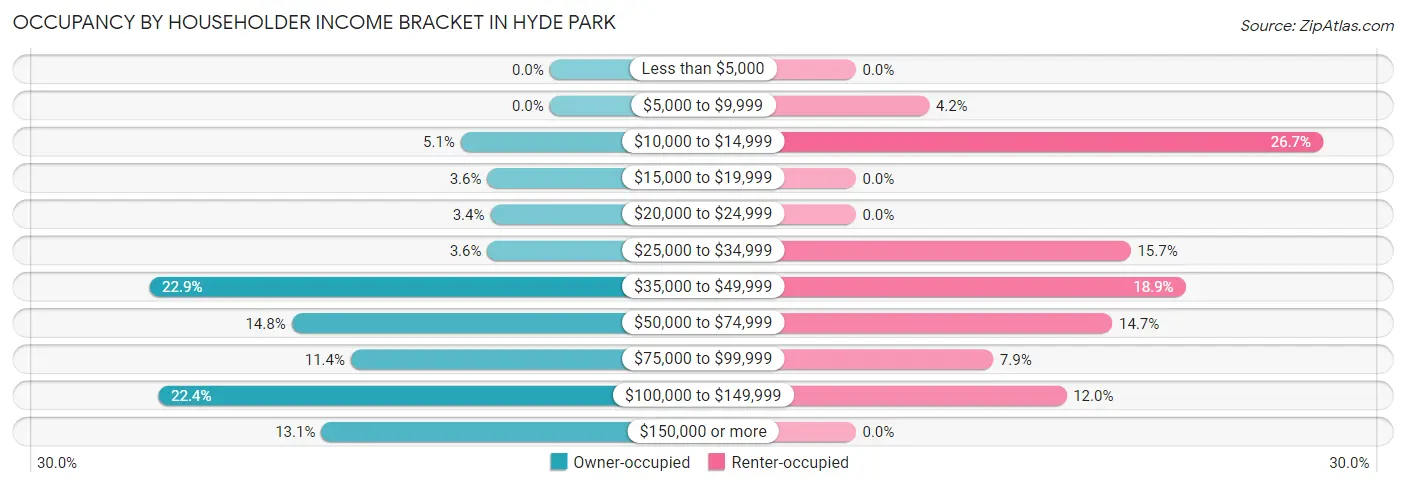
| Income Bracket | Owner-occupied | Renter-occupied |
| Less than $5,000 | 0 (0.0%) | 0 (0.0%) |
| $5,000 to $9,999 | 0 (0.0%) | 8 (4.2%) |
| $10,000 to $14,999 | 30 (5.1%) | 51 (26.7%) |
| $15,000 to $19,999 | 21 (3.6%) | 0 (0.0%) |
| $20,000 to $24,999 | 20 (3.4%) | 0 (0.0%) |
| $25,000 to $34,999 | 21 (3.6%) | 30 (15.7%) |
| $35,000 to $49,999 | 135 (22.9%) | 36 (18.9%) |
| $50,000 to $74,999 | 87 (14.7%) | 28 (14.7%) |
| $75,000 to $99,999 | 67 (11.4%) | 15 (7.9%) |
| $100,000 to $149,999 | 132 (22.4%) | 23 (12.0%) |
| $150,000 or more | 77 (13.1%) | 0 (0.0%) |
| Total | 590 (100.0%) | 191 (100.0%) |
Monthly Housing Cost Tiers in Hyde Park
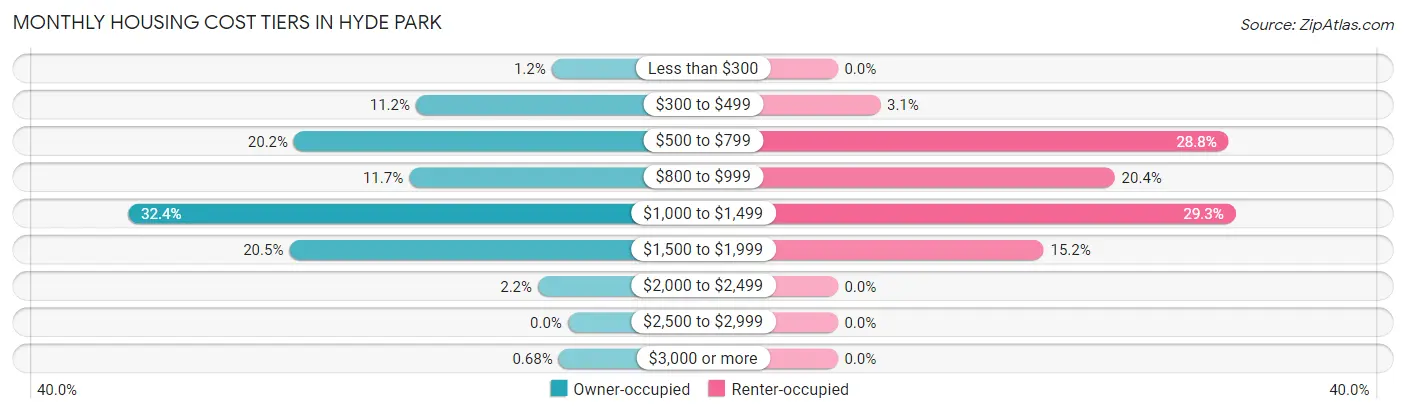
| Monthly Cost | Owner-occupied | Renter-occupied |
| Less than $300 | 7 (1.2%) | 0 (0.0%) |
| $300 to $499 | 66 (11.2%) | 6 (3.1%) |
| $500 to $799 | 119 (20.2%) | 55 (28.8%) |
| $800 to $999 | 69 (11.7%) | 39 (20.4%) |
| $1,000 to $1,499 | 191 (32.4%) | 56 (29.3%) |
| $1,500 to $1,999 | 121 (20.5%) | 29 (15.2%) |
| $2,000 to $2,499 | 13 (2.2%) | 0 (0.0%) |
| $2,500 to $2,999 | 0 (0.0%) | 0 (0.0%) |
| $3,000 or more | 4 (0.7%) | 0 (0.0%) |
| Total | 590 (100.0%) | 191 (100.0%) |
Physical Housing Characteristics in Hyde Park
Housing Structures in Hyde Park
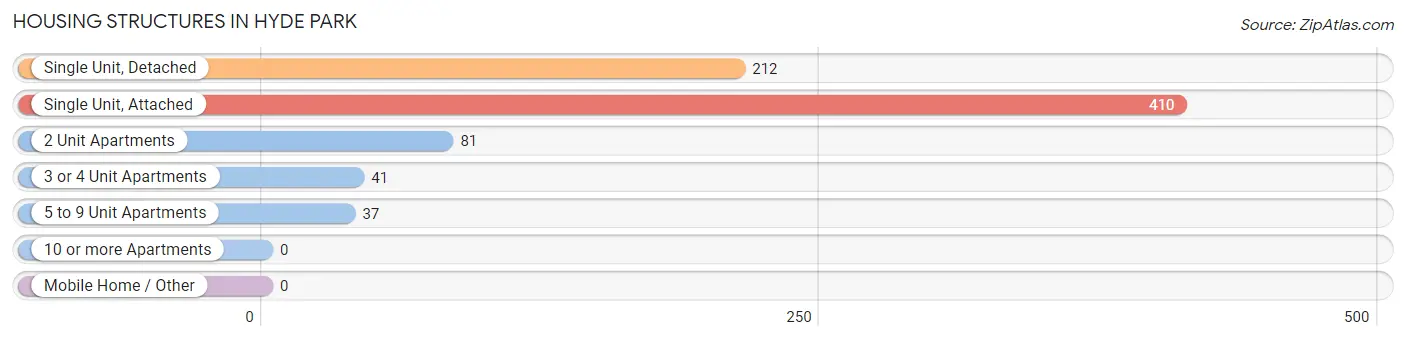
| Structure Type | # Housing Units | % Housing Units |
| Single Unit, Detached | 212 | 27.1% |
| Single Unit, Attached | 410 | 52.5% |
| 2 Unit Apartments | 81 | 10.4% |
| 3 or 4 Unit Apartments | 41 | 5.2% |
| 5 to 9 Unit Apartments | 37 | 4.7% |
| 10 or more Apartments | 0 | 0.0% |
| Mobile Home / Other | 0 | 0.0% |
| Total | 781 | 100.0% |
Housing Structures by Occupancy in Hyde Park
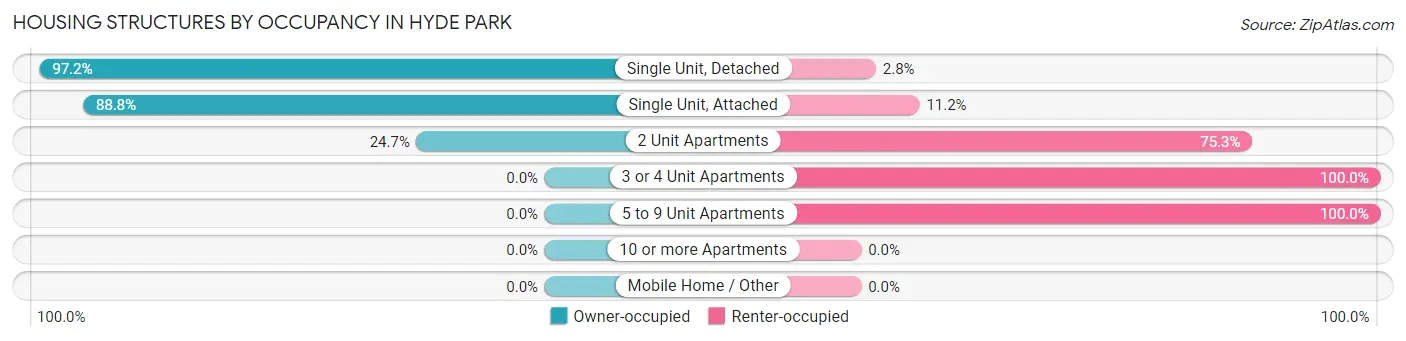
| Structure Type | Owner-occupied | Renter-occupied |
| Single Unit, Detached | 206 (97.2%) | 6 (2.8%) |
| Single Unit, Attached | 364 (88.8%) | 46 (11.2%) |
| 2 Unit Apartments | 20 (24.7%) | 61 (75.3%) |
| 3 or 4 Unit Apartments | 0 (0.0%) | 41 (100.0%) |
| 5 to 9 Unit Apartments | 0 (0.0%) | 37 (100.0%) |
| 10 or more Apartments | 0 (0.0%) | 0 (0.0%) |
| Mobile Home / Other | 0 (0.0%) | 0 (0.0%) |
| Total | 590 (75.5%) | 191 (24.5%) |
Housing Structures by Number of Rooms in Hyde Park
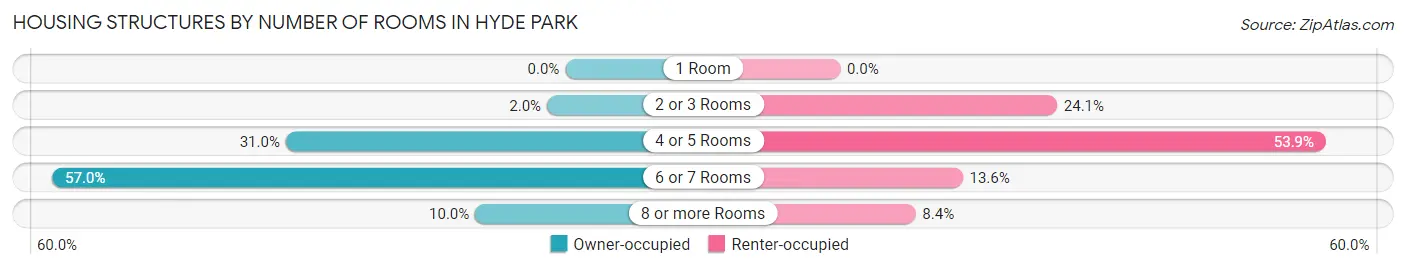
| Number of Rooms | Owner-occupied | Renter-occupied |
| 1 Room | 0 (0.0%) | 0 (0.0%) |
| 2 or 3 Rooms | 12 (2.0%) | 46 (24.1%) |
| 4 or 5 Rooms | 183 (31.0%) | 103 (53.9%) |
| 6 or 7 Rooms | 336 (57.0%) | 26 (13.6%) |
| 8 or more Rooms | 59 (10.0%) | 16 (8.4%) |
| Total | 590 (100.0%) | 191 (100.0%) |
Housing Structure by Heating Type in Hyde Park
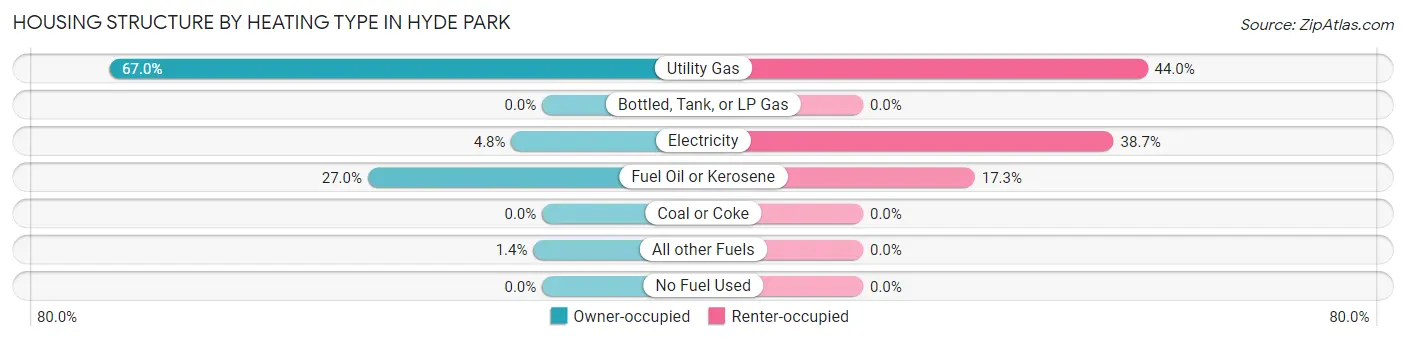
| Heating Type | Owner-occupied | Renter-occupied |
| Utility Gas | 395 (66.9%) | 84 (44.0%) |
| Bottled, Tank, or LP Gas | 0 (0.0%) | 0 (0.0%) |
| Electricity | 28 (4.8%) | 74 (38.7%) |
| Fuel Oil or Kerosene | 159 (27.0%) | 33 (17.3%) |
| Coal or Coke | 0 (0.0%) | 0 (0.0%) |
| All other Fuels | 8 (1.4%) | 0 (0.0%) |
| No Fuel Used | 0 (0.0%) | 0 (0.0%) |
| Total | 590 (100.0%) | 191 (100.0%) |
Household Vehicle Usage in Hyde Park
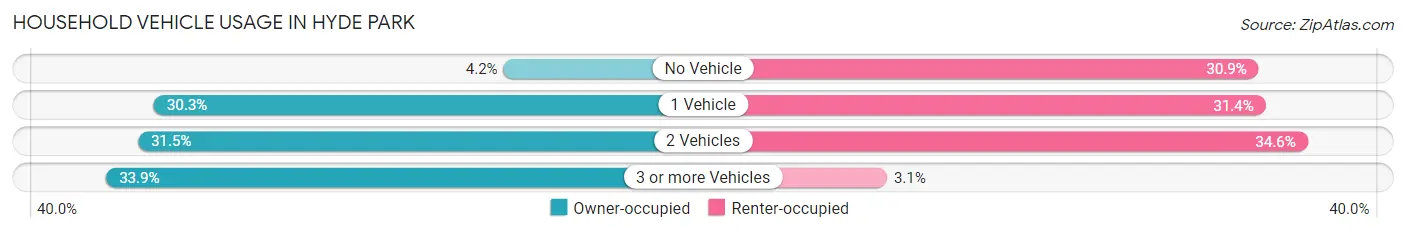
| Vehicles per Household | Owner-occupied | Renter-occupied |
| No Vehicle | 25 (4.2%) | 59 (30.9%) |
| 1 Vehicle | 179 (30.3%) | 60 (31.4%) |
| 2 Vehicles | 186 (31.5%) | 66 (34.5%) |
| 3 or more Vehicles | 200 (33.9%) | 6 (3.1%) |
| Total | 590 (100.0%) | 191 (100.0%) |
Real Estate & Mortgages in Hyde Park
Real Estate and Mortgage Overview in Hyde Park
| Characteristic | Without Mortgage | With Mortgage |
| Housing Units | 247 | 343 |
| Median Property Value | $145,100 | $144,500 |
| Median Household Income | $52,292 | $58 |
| Monthly Housing Costs | $649 | $4 |
| Real Estate Taxes | $2,961 | $54 |
Property Value by Mortgage Status in Hyde Park
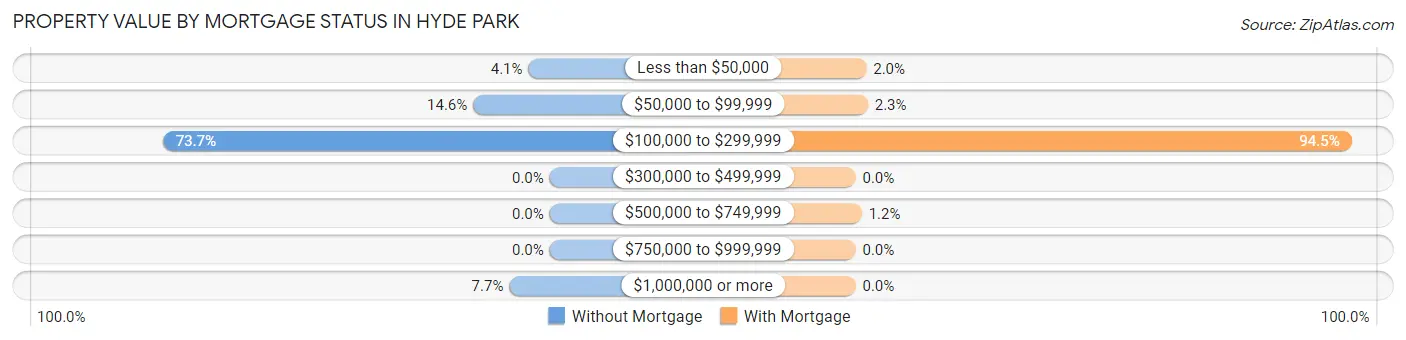
| Property Value | Without Mortgage | With Mortgage |
| Less than $50,000 | 10 (4.1%) | 7 (2.0%) |
| $50,000 to $99,999 | 36 (14.6%) | 8 (2.3%) |
| $100,000 to $299,999 | 182 (73.7%) | 324 (94.5%) |
| $300,000 to $499,999 | 0 (0.0%) | 0 (0.0%) |
| $500,000 to $749,999 | 0 (0.0%) | 4 (1.2%) |
| $750,000 to $999,999 | 0 (0.0%) | 0 (0.0%) |
| $1,000,000 or more | 19 (7.7%) | 0 (0.0%) |
| Total | 247 (100.0%) | 343 (100.0%) |
Household Income by Mortgage Status in Hyde Park
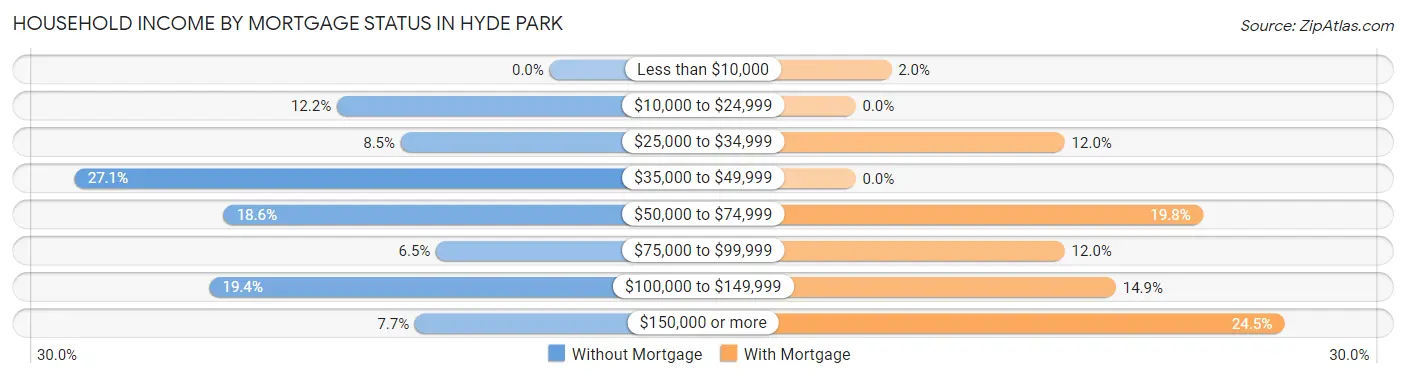
| Household Income | Without Mortgage | With Mortgage |
| Less than $10,000 | 0 (0.0%) | 7 (2.0%) |
| $10,000 to $24,999 | 30 (12.1%) | 0 (0.0%) |
| $25,000 to $34,999 | 21 (8.5%) | 41 (11.9%) |
| $35,000 to $49,999 | 67 (27.1%) | 0 (0.0%) |
| $50,000 to $74,999 | 46 (18.6%) | 68 (19.8%) |
| $75,000 to $99,999 | 16 (6.5%) | 41 (11.9%) |
| $100,000 to $149,999 | 48 (19.4%) | 51 (14.9%) |
| $150,000 or more | 19 (7.7%) | 84 (24.5%) |
| Total | 247 (100.0%) | 343 (100.0%) |
Property Value to Household Income Ratio in Hyde Park
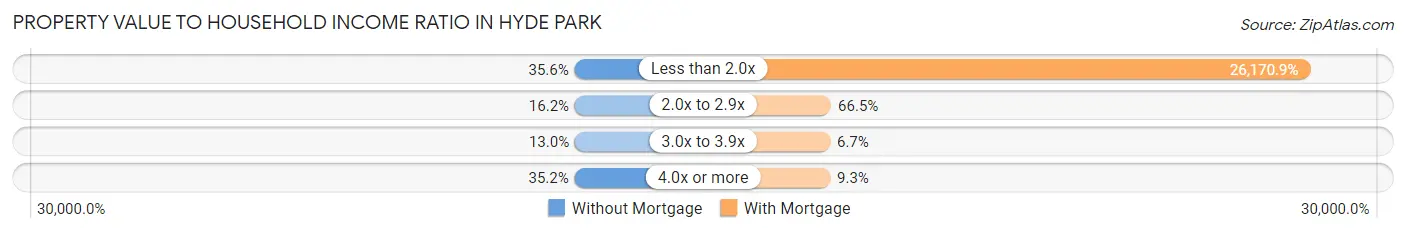
| Value-to-Income Ratio | Without Mortgage | With Mortgage |
| Less than 2.0x | 88 (35.6%) | 89,766 (26,170.9%) |
| 2.0x to 2.9x | 40 (16.2%) | 228 (66.5%) |
| 3.0x to 3.9x | 32 (13.0%) | 23 (6.7%) |
| 4.0x or more | 87 (35.2%) | 32 (9.3%) |
| Total | 247 (100.0%) | 343 (100.0%) |
Real Estate Taxes by Mortgage Status in Hyde Park
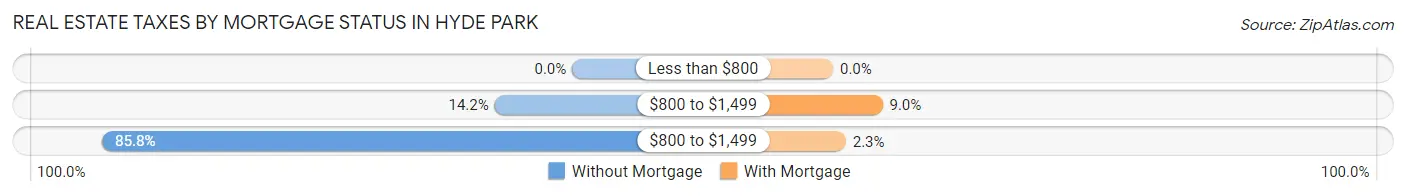
| Property Taxes | Without Mortgage | With Mortgage |
| Less than $800 | 0 (0.0%) | 0 (0.0%) |
| $800 to $1,499 | 35 (14.2%) | 31 (9.0%) |
| $800 to $1,499 | 212 (85.8%) | 8 (2.3%) |
| Total | 247 (100.0%) | 343 (100.0%) |
Health & Disability in Hyde Park
Health Insurance Coverage by Age in Hyde Park
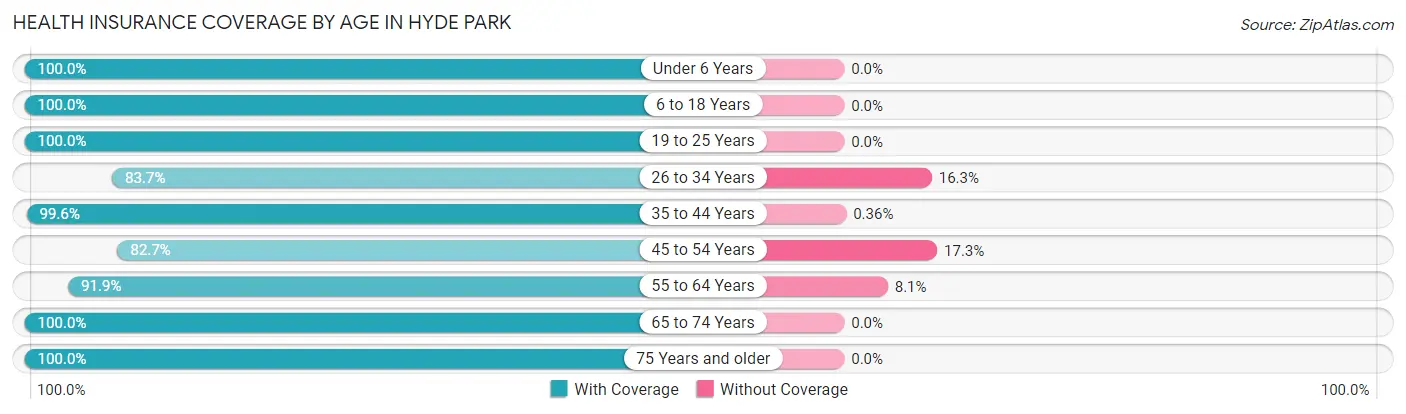
| Age Bracket | With Coverage | Without Coverage |
| Under 6 Years | 244 (100.0%) | 0 (0.0%) |
| 6 to 18 Years | 393 (100.0%) | 0 (0.0%) |
| 19 to 25 Years | 204 (100.0%) | 0 (0.0%) |
| 26 to 34 Years | 200 (83.7%) | 39 (16.3%) |
| 35 to 44 Years | 277 (99.6%) | 1 (0.4%) |
| 45 to 54 Years | 258 (82.7%) | 54 (17.3%) |
| 55 to 64 Years | 238 (91.9%) | 21 (8.1%) |
| 65 to 74 Years | 147 (100.0%) | 0 (0.0%) |
| 75 Years and older | 237 (100.0%) | 0 (0.0%) |
| Total | 2,198 (95.0%) | 115 (5.0%) |
Health Insurance Coverage by Citizenship Status in Hyde Park
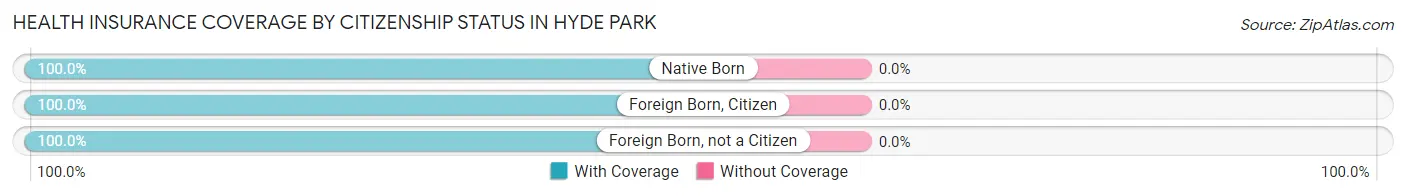
| Citizenship Status | With Coverage | Without Coverage |
| Native Born | 244 (100.0%) | 0 (0.0%) |
| Foreign Born, Citizen | 393 (100.0%) | 0 (0.0%) |
| Foreign Born, not a Citizen | 204 (100.0%) | 0 (0.0%) |
Health Insurance Coverage by Household Income in Hyde Park
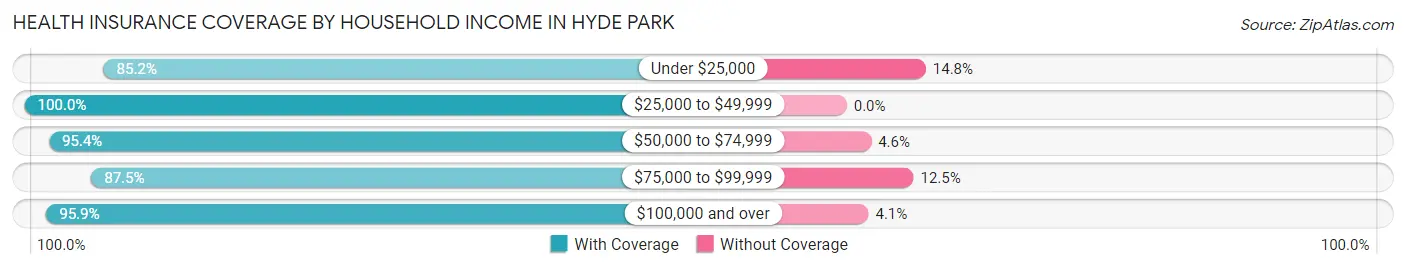
| Household Income | With Coverage | Without Coverage |
| Under $25,000 | 138 (85.2%) | 24 (14.8%) |
| $25,000 to $49,999 | 562 (100.0%) | 0 (0.0%) |
| $50,000 to $74,999 | 313 (95.4%) | 15 (4.6%) |
| $75,000 to $99,999 | 259 (87.5%) | 37 (12.5%) |
| $100,000 and over | 919 (95.9%) | 39 (4.1%) |
Public vs Private Health Insurance Coverage by Age in Hyde Park
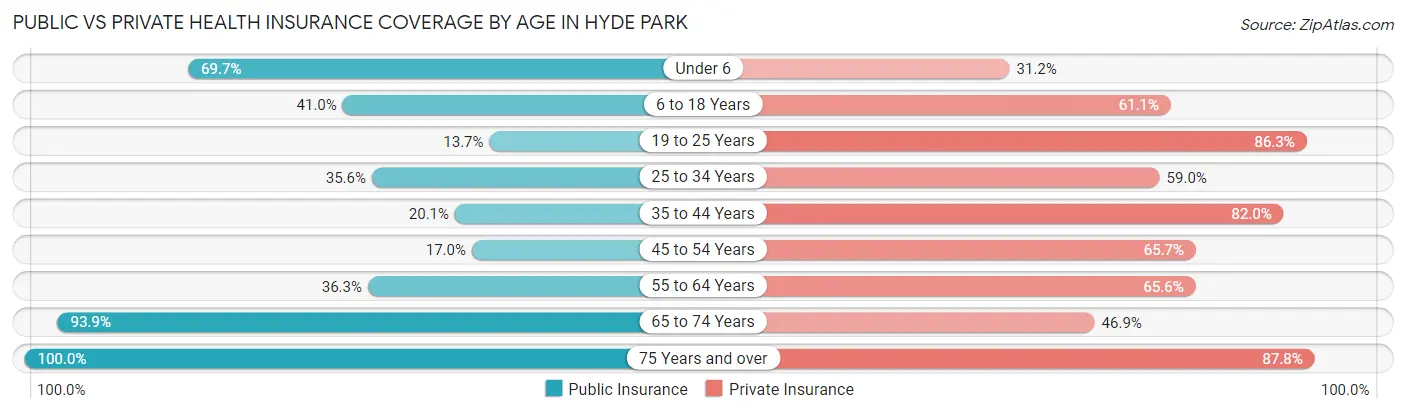
| Age Bracket | Public Insurance | Private Insurance |
| Under 6 | 170 (69.7%) | 76 (31.1%) |
| 6 to 18 Years | 161 (41.0%) | 240 (61.1%) |
| 19 to 25 Years | 28 (13.7%) | 176 (86.3%) |
| 25 to 34 Years | 85 (35.6%) | 141 (59.0%) |
| 35 to 44 Years | 56 (20.1%) | 228 (82.0%) |
| 45 to 54 Years | 53 (17.0%) | 205 (65.7%) |
| 55 to 64 Years | 94 (36.3%) | 170 (65.6%) |
| 65 to 74 Years | 138 (93.9%) | 69 (46.9%) |
| 75 Years and over | 237 (100.0%) | 208 (87.8%) |
| Total | 1,022 (44.2%) | 1,513 (65.4%) |
Disability Status by Sex by Age in Hyde Park
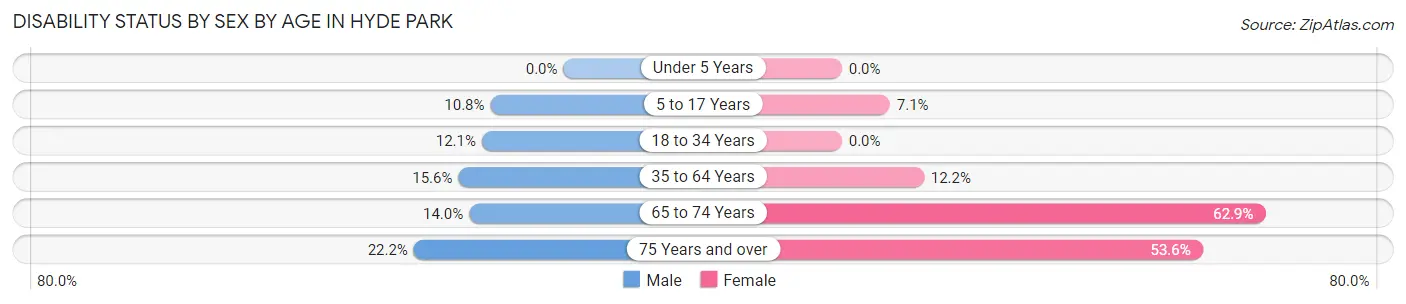
| Age Bracket | Male | Female |
| Under 5 Years | 0 (0.0%) | 0 (0.0%) |
| 5 to 17 Years | 22 (10.8%) | 14 (7.1%) |
| 18 to 34 Years | 35 (12.1%) | 0 (0.0%) |
| 35 to 64 Years | 71 (15.6%) | 48 (12.2%) |
| 65 to 74 Years | 7 (14.0%) | 61 (62.9%) |
| 75 Years and over | 34 (22.2%) | 45 (53.6%) |
Disability Class by Sex by Age in Hyde Park
Disability Class: Hearing Difficulty
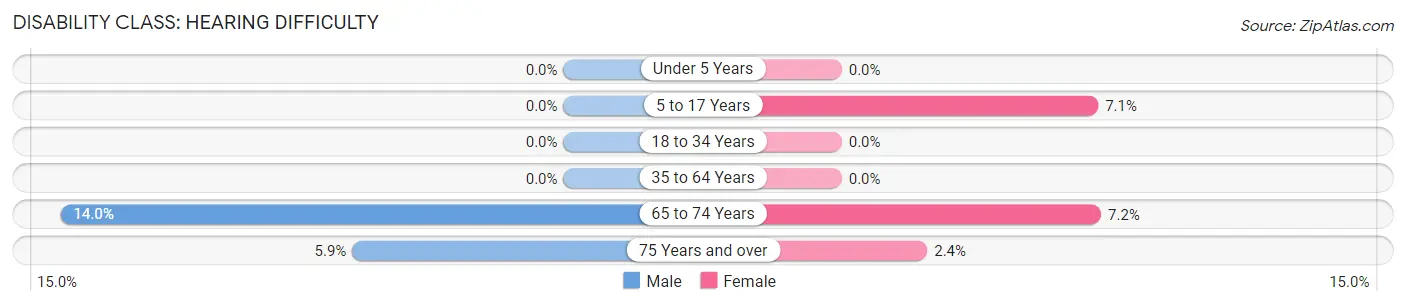
| Age Bracket | Male | Female |
| Under 5 Years | 0 (0.0%) | 0 (0.0%) |
| 5 to 17 Years | 0 (0.0%) | 14 (7.1%) |
| 18 to 34 Years | 0 (0.0%) | 0 (0.0%) |
| 35 to 64 Years | 0 (0.0%) | 0 (0.0%) |
| 65 to 74 Years | 7 (14.0%) | 7 (7.2%) |
| 75 Years and over | 9 (5.9%) | 2 (2.4%) |
Disability Class: Vision Difficulty
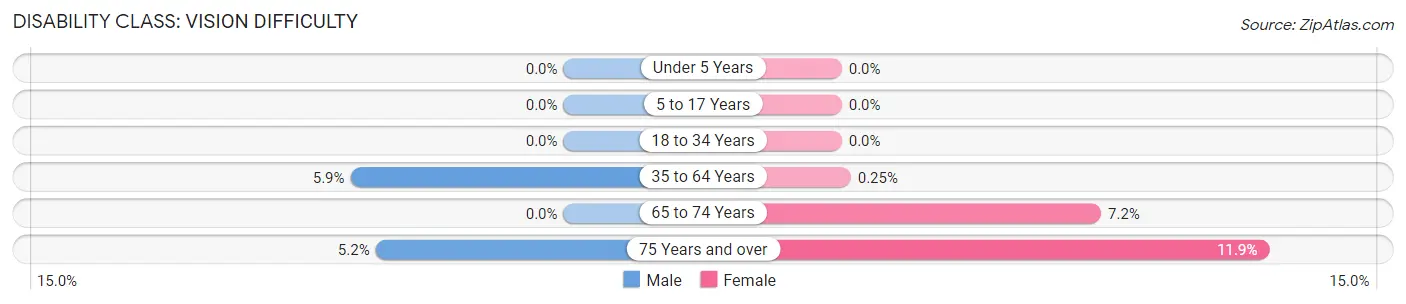
| Age Bracket | Male | Female |
| Under 5 Years | 0 (0.0%) | 0 (0.0%) |
| 5 to 17 Years | 0 (0.0%) | 0 (0.0%) |
| 18 to 34 Years | 0 (0.0%) | 0 (0.0%) |
| 35 to 64 Years | 27 (5.9%) | 1 (0.3%) |
| 65 to 74 Years | 0 (0.0%) | 7 (7.2%) |
| 75 Years and over | 8 (5.2%) | 10 (11.9%) |
Disability Class: Cognitive Difficulty
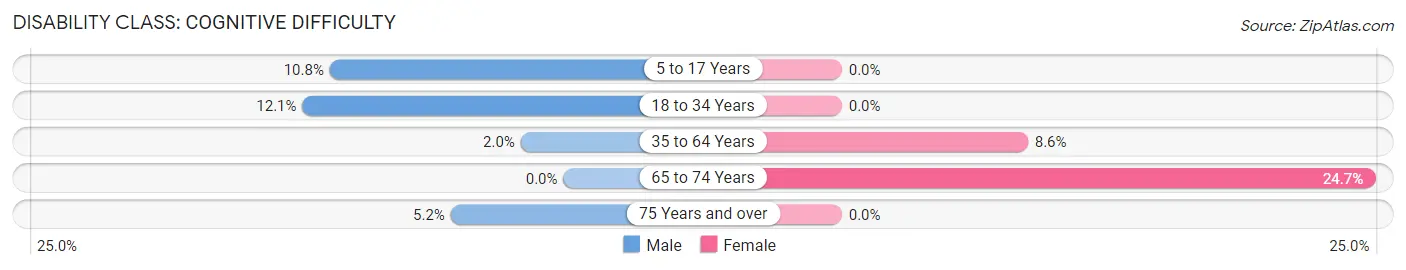
| Age Bracket | Male | Female |
| 5 to 17 Years | 22 (10.8%) | 0 (0.0%) |
| 18 to 34 Years | 35 (12.1%) | 0 (0.0%) |
| 35 to 64 Years | 9 (2.0%) | 34 (8.6%) |
| 65 to 74 Years | 0 (0.0%) | 24 (24.7%) |
| 75 Years and over | 8 (5.2%) | 0 (0.0%) |
Disability Class: Ambulatory Difficulty
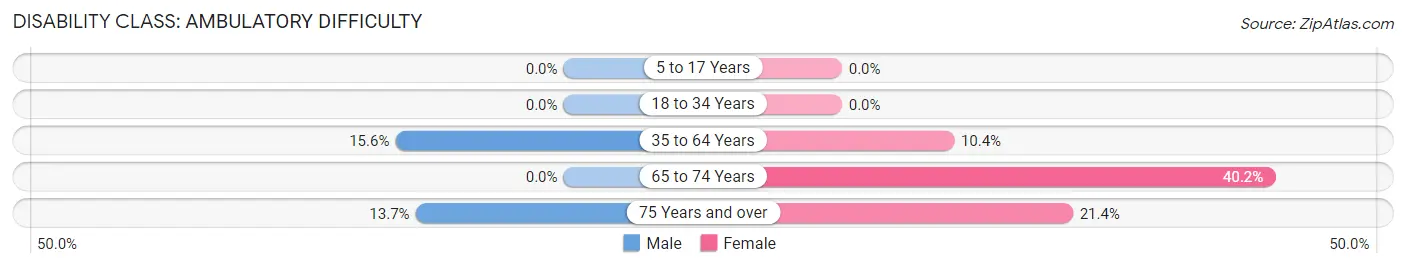
| Age Bracket | Male | Female |
| 5 to 17 Years | 0 (0.0%) | 0 (0.0%) |
| 18 to 34 Years | 0 (0.0%) | 0 (0.0%) |
| 35 to 64 Years | 71 (15.6%) | 41 (10.4%) |
| 65 to 74 Years | 0 (0.0%) | 39 (40.2%) |
| 75 Years and over | 21 (13.7%) | 18 (21.4%) |
Disability Class: Self-Care Difficulty
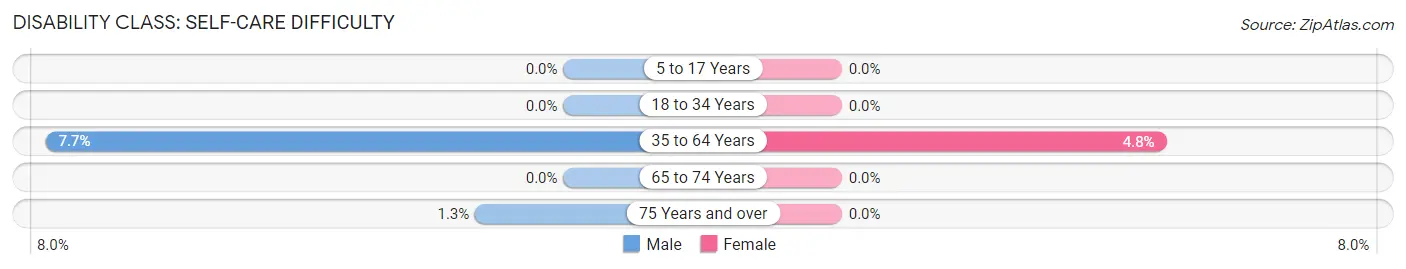
| Age Bracket | Male | Female |
| 5 to 17 Years | 0 (0.0%) | 0 (0.0%) |
| 18 to 34 Years | 0 (0.0%) | 0 (0.0%) |
| 35 to 64 Years | 35 (7.7%) | 19 (4.8%) |
| 65 to 74 Years | 0 (0.0%) | 0 (0.0%) |
| 75 Years and over | 2 (1.3%) | 0 (0.0%) |
Technology Access in Hyde Park
Computing Device Access in Hyde Park
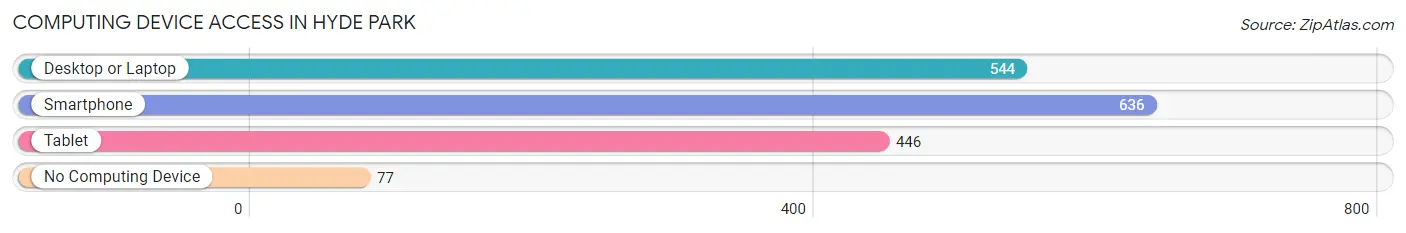
| Device Type | # Households | % Households |
| Desktop or Laptop | 544 | 69.7% |
| Smartphone | 636 | 81.4% |
| Tablet | 446 | 57.1% |
| No Computing Device | 77 | 9.9% |
| Total | 781 | 100.0% |
Internet Access in Hyde Park
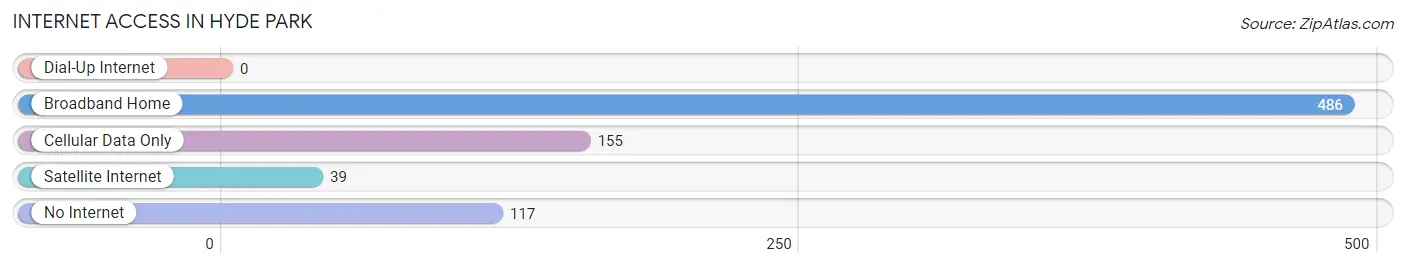
| Internet Type | # Households | % Households |
| Dial-Up Internet | 0 | 0.0% |
| Broadband Home | 486 | 62.2% |
| Cellular Data Only | 155 | 19.9% |
| Satellite Internet | 39 | 5.0% |
| No Internet | 117 | 15.0% |
| Total | 781 | 100.0% |
Hyde Park Summary
Hyde Park is a small borough located in Allegheny County, Pennsylvania. It is situated approximately 10 miles east of the city of Pittsburgh. The borough was incorporated in 1891 and has a population of 1,845 as of the 2010 census.
History
Hyde Park was originally part of Plum Township, which was established in 1788. The area was first settled in the late 1700s by a group of German immigrants. The area was known as “Hyde’s Park” after the first settler, John Hyde. The name was later changed to Hyde Park.
The area was primarily agricultural until the late 1800s when the Pittsburgh and Castle Shannon Railroad was built through the area. This allowed for the development of the area and the growth of industry. The borough was officially incorporated in 1891.
Geography
Hyde Park is located at 40°22'17" North, 79°59'45" West (40.3714, -79.9958). It is situated in the Allegheny Plateau region of Pennsylvania. The borough has a total area of 0.6 square miles, all of which is land.
The borough is bordered by Plum Township to the north, east, and south, and by the city of Pittsburgh to the west. The borough is located approximately 10 miles east of downtown Pittsburgh.
Economy
The economy of Hyde Park is primarily based on small businesses and services. The borough is home to a variety of small businesses, including restaurants, retail stores, and professional services.
The borough is also home to a number of industrial businesses, including a steel mill, a chemical plant, and a paper mill. These businesses provide employment opportunities for many of the borough’s residents.
Demographics
As of the 2010 census, there were 1,845 people, 745 households, and 486 families residing in the borough. The population density was 3,072.3 people per square mile. The racial makeup of the borough was 94.2% White, 2.7% African American, 0.2% Native American, 0.7% Asian, 0.1% Pacific Islander, 0.7% from other races, and 1.4% from two or more races. Hispanic or Latino of any race were 1.7% of the population.
The median income for a household in the borough was $37,917, and the median income for a family was $45,000. The per capita income for the borough was $19,945. About 8.2% of families and 10.2% of the population were below the poverty line, including 14.2% of those under age 18 and 6.2% of those age 65 or over.
Common Questions
What is Per Capita Income in Hyde Park?
Per Capita income in Hyde Park is $27,068.
What is the Median Family Income in Hyde Park?
Median Family Income in Hyde Park is $95,781.
What is the Median Household income in Hyde Park?
Median Household Income in Hyde Park is $59,792.
What is Income or Wage Gap in Hyde Park?
Income or Wage Gap in Hyde Park is 21.1%.
Women in Hyde Park earn 78.9 cents for every dollar earned by a man.
What is Inequality or Gini Index in Hyde Park?
Inequality or Gini Index in Hyde Park is 0.38.
What is the Total Population of Hyde Park?
Total Population of Hyde Park is 2,332.
What is the Total Male Population of Hyde Park?
Total Male Population of Hyde Park is 1,275.
What is the Total Female Population of Hyde Park?
Total Female Population of Hyde Park is 1,057.
What is the Ratio of Males per 100 Females in Hyde Park?
There are 120.62 Males per 100 Females in Hyde Park.
What is the Ratio of Females per 100 Males in Hyde Park?
There are 82.90 Females per 100 Males in Hyde Park.
What is the Median Population Age in Hyde Park?
Median Population Age in Hyde Park is 36.9 Years.
What is the Average Family Size in Hyde Park
Average Family Size in Hyde Park is 3.9 People.
What is the Average Household Size in Hyde Park
Average Household Size in Hyde Park is 3.0 People.
How Large is the Labor Force in Hyde Park?
There are 1,284 People in the Labor Forcein in Hyde Park.
What is the Percentage of People in the Labor Force in Hyde Park?
69.8% of People are in the Labor Force in Hyde Park.
What is the Unemployment Rate in Hyde Park?
Unemployment Rate in Hyde Park is 7.6%.