Columbia borough, PA Map & Demographics
Columbia borough Overview
$30,615
PER CAPITA INCOME
$68,974
AVG FAMILY INCOME
$50,309
AVG HOUSEHOLD INCOME
16.4%
WAGE / INCOME GAP [ % ]
83.6¢/ $1
WAGE / INCOME GAP [ $ ]
$10,097
FAMILY INCOME DEFICIT
0.43
INEQUALITY / GINI INDEX
10,203
TOTAL POPULATION
5,280
MALE POPULATION
4,923
FEMALE POPULATION
107.25
MALES / 100 FEMALES
93.24
FEMALES / 100 MALES
42.7
MEDIAN AGE
2.9
AVG FAMILY SIZE
2.2
AVG HOUSEHOLD SIZE
5,270
LABOR FORCE [ PEOPLE ]
59.8%
PERCENT IN LABOR FORCE
4.2%
UNEMPLOYMENT RATE
Income in Columbia borough
Income Overview in Columbia borough
Per Capita Income in Columbia borough is $30,615, while median incomes of families and households are $68,974 and $50,309 respectively.
| Characteristic | Number | Measure |
| Per Capita Income | 10,203 | $30,615 |
| Median Family Income | 2,474 | $68,974 |
| Mean Family Income | 2,474 | $85,659 |
| Median Household Income | 4,515 | $50,309 |
| Mean Household Income | 4,515 | $66,959 |
| Income Deficit | 2,474 | $10,097 |
| Wage / Income Gap (%) | 10,203 | 16.39% |
| Wage / Income Gap ($) | 10,203 | 83.61¢ per $1 |
| Gini / Inequality Index | 10,203 | 0.43 |
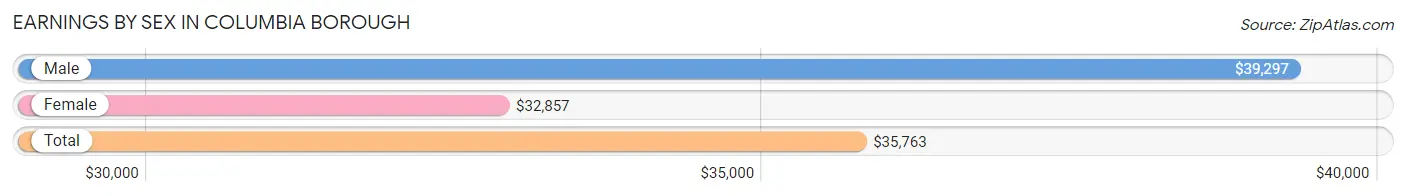
Earnings by Sex in Columbia borough
Average Earnings in Columbia borough are $35,763, $39,297 for men and $32,857 for women, a difference of 16.4%.
| Sex | Number | Average Earnings |
| Male | 2,953 (53.4%) | $39,297 |
| Female | 2,574 (46.6%) | $32,857 |
| Total | 5,527 (100.0%) | $35,763 |
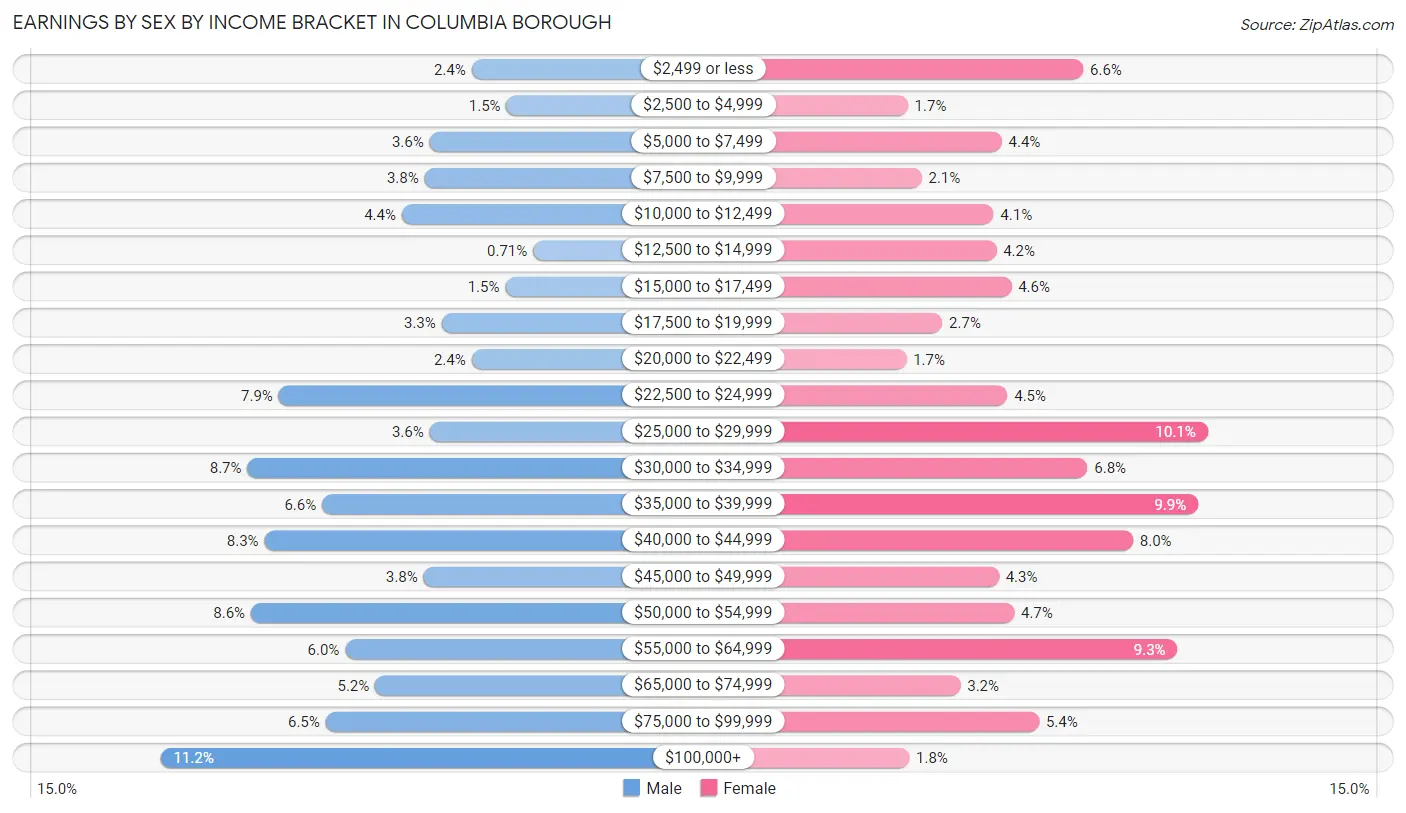
Earnings by Sex by Income Bracket in Columbia borough
The most common earnings brackets in Columbia borough are $100,000+ for men (330 | 11.2%) and $25,000 to $29,999 for women (261 | 10.1%).
| Income | Male | Female |
| $2,499 or less | 72 (2.4%) | 171 (6.6%) |
| $2,500 to $4,999 | 43 (1.5%) | 44 (1.7%) |
| $5,000 to $7,499 | 107 (3.6%) | 112 (4.3%) |
| $7,500 to $9,999 | 111 (3.8%) | 54 (2.1%) |
| $10,000 to $12,499 | 130 (4.4%) | 106 (4.1%) |
| $12,500 to $14,999 | 21 (0.7%) | 108 (4.2%) |
| $15,000 to $17,499 | 44 (1.5%) | 119 (4.6%) |
| $17,500 to $19,999 | 97 (3.3%) | 69 (2.7%) |
| $20,000 to $22,499 | 72 (2.4%) | 43 (1.7%) |
| $22,500 to $24,999 | 232 (7.9%) | 116 (4.5%) |
| $25,000 to $29,999 | 107 (3.6%) | 261 (10.1%) |
| $30,000 to $34,999 | 258 (8.7%) | 174 (6.8%) |
| $35,000 to $39,999 | 196 (6.6%) | 254 (9.9%) |
| $40,000 to $44,999 | 244 (8.3%) | 207 (8.0%) |
| $45,000 to $49,999 | 112 (3.8%) | 110 (4.3%) |
| $50,000 to $54,999 | 255 (8.6%) | 121 (4.7%) |
| $55,000 to $64,999 | 177 (6.0%) | 239 (9.3%) |
| $65,000 to $74,999 | 152 (5.1%) | 82 (3.2%) |
| $75,000 to $99,999 | 193 (6.5%) | 139 (5.4%) |
| $100,000+ | 330 (11.2%) | 45 (1.8%) |
| Total | 2,953 (100.0%) | 2,574 (100.0%) |
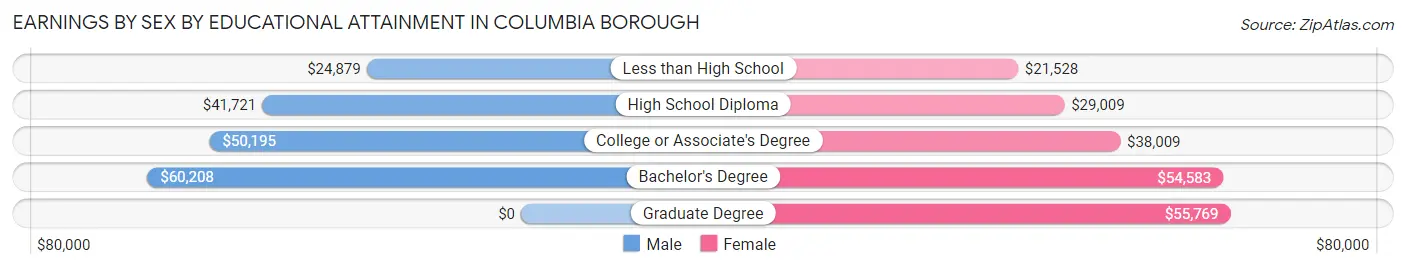
Earnings by Sex by Educational Attainment in Columbia borough
Average earnings in Columbia borough are $42,102 for men and $35,038 for women, a difference of 16.8%. Men with an educational attainment of bachelor's degree enjoy the highest average annual earnings of $60,208, while those with less than high school education earn the least with $24,879. Women with an educational attainment of graduate degree earn the most with the average annual earnings of $55,769, while those with less than high school education have the smallest earnings of $21,528.
| Educational Attainment | Male Income | Female Income |
| Less than High School | $24,879 | $21,528 |
| High School Diploma | $41,721 | $29,009 |
| College or Associate's Degree | $50,195 | $38,009 |
| Bachelor's Degree | $60,208 | $54,583 |
| Graduate Degree | - | - |
| Total | $42,102 | $35,038 |
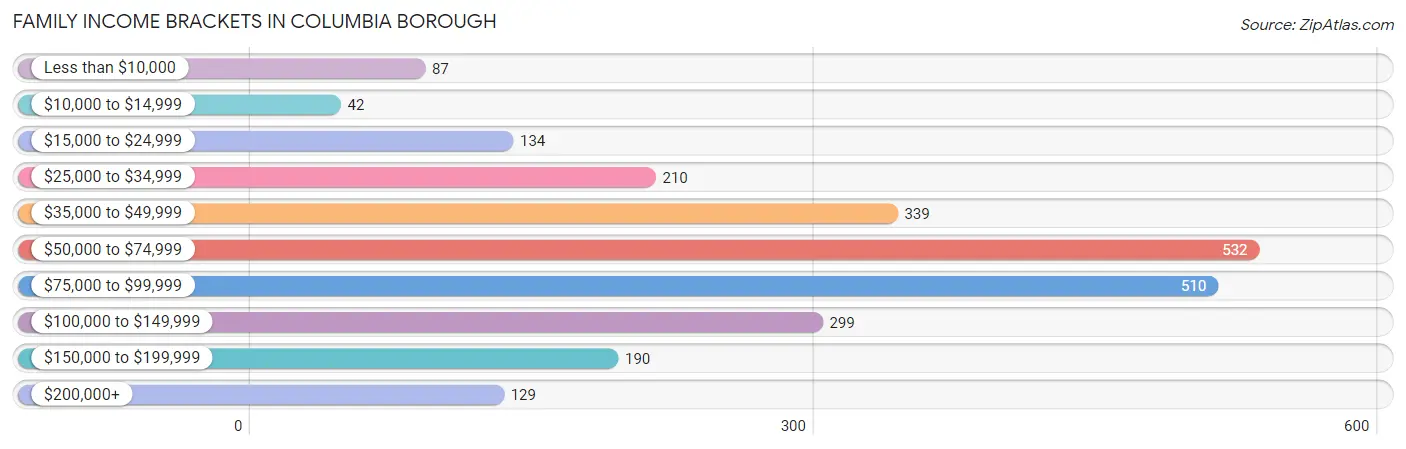
Family Income in Columbia borough
Family Income Brackets in Columbia borough
According to the Columbia borough family income data, there are 532 families falling into the $50,000 to $74,999 income range, which is the most common income bracket and makes up 21.5% of all families. Conversely, the $10,000 to $14,999 income bracket is the least frequent group with only 42 families (1.7%) belonging to this category.
| Income Bracket | # Families | % Families |
| Less than $10,000 | 87 | 3.5% |
| $10,000 to $14,999 | 42 | 1.7% |
| $15,000 to $24,999 | 134 | 5.4% |
| $25,000 to $34,999 | 210 | 8.5% |
| $35,000 to $49,999 | 339 | 13.7% |
| $50,000 to $74,999 | 532 | 21.5% |
| $75,000 to $99,999 | 510 | 20.6% |
| $100,000 to $149,999 | 299 | 12.1% |
| $150,000 to $199,999 | 190 | 7.7% |
| $200,000+ | 129 | 5.2% |
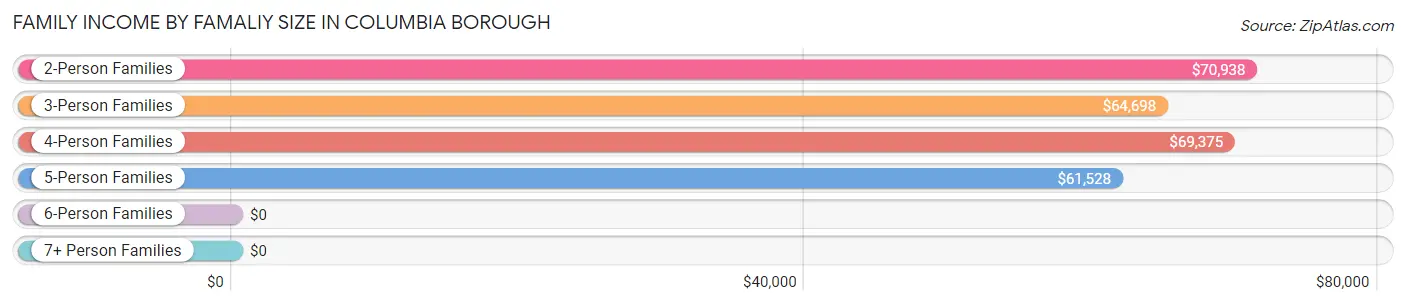
Family Income by Famaliy Size in Columbia borough
2-person families (1,486 | 60.1%) account for the highest median family income in Columbia borough with $70,938 per family, while 2-person families (1,486 | 60.1%) have the highest median income of $35,469 per family member.
| Income Bracket | # Families | Median Income |
| 2-Person Families | 1,486 (60.1%) | $70,938 |
| 3-Person Families | 419 (16.9%) | $64,698 |
| 4-Person Families | 369 (14.9%) | $69,375 |
| 5-Person Families | 117 (4.7%) | $61,528 |
| 6-Person Families | 58 (2.3%) | $0 |
| 7+ Person Families | 25 (1.0%) | $0 |
| Total | 2,474 (100.0%) | $68,974 |
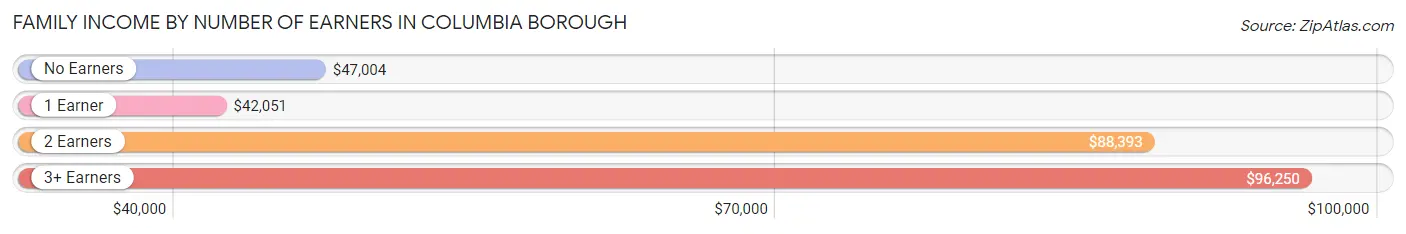
Family Income by Number of Earners in Columbia borough
The median family income in Columbia borough is $68,974, with families comprising 3+ earners (284) having the highest median family income of $96,250, while families with 1 earner (774) have the lowest median family income of $42,051, accounting for 11.5% and 31.3% of families, respectively.
| Number of Earners | # Families | Median Income |
| No Earners | 309 (12.5%) | $47,004 |
| 1 Earner | 774 (31.3%) | $42,051 |
| 2 Earners | 1,107 (44.8%) | $88,393 |
| 3+ Earners | 284 (11.5%) | $96,250 |
| Total | 2,474 (100.0%) | $68,974 |
Household Income in Columbia borough
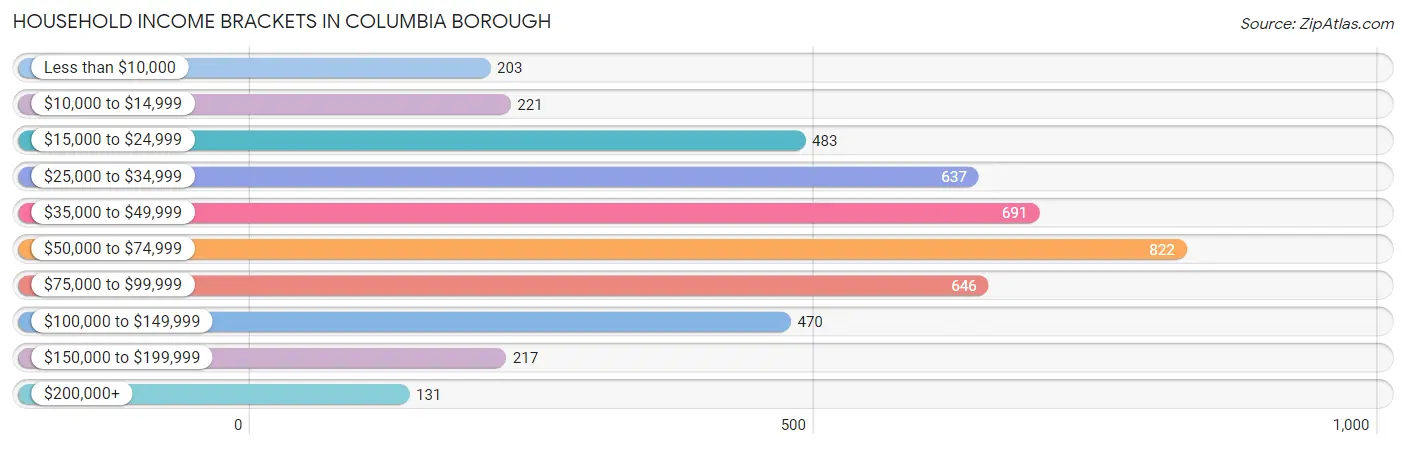
Household Income Brackets in Columbia borough
With 822 households falling in the category, the $50,000 to $74,999 income range is the most frequent in Columbia borough, accounting for 18.2% of all households. In contrast, only 131 households (2.9%) fall into the $200,000+ income bracket, making it the least populous group.
| Income Bracket | # Households | % Households |
| Less than $10,000 | 203 | 4.5% |
| $10,000 to $14,999 | 221 | 4.9% |
| $15,000 to $24,999 | 483 | 10.7% |
| $25,000 to $34,999 | 637 | 14.1% |
| $35,000 to $49,999 | 691 | 15.3% |
| $50,000 to $74,999 | 822 | 18.2% |
| $75,000 to $99,999 | 646 | 14.3% |
| $100,000 to $149,999 | 470 | 10.4% |
| $150,000 to $199,999 | 217 | 4.8% |
| $200,000+ | 131 | 2.9% |
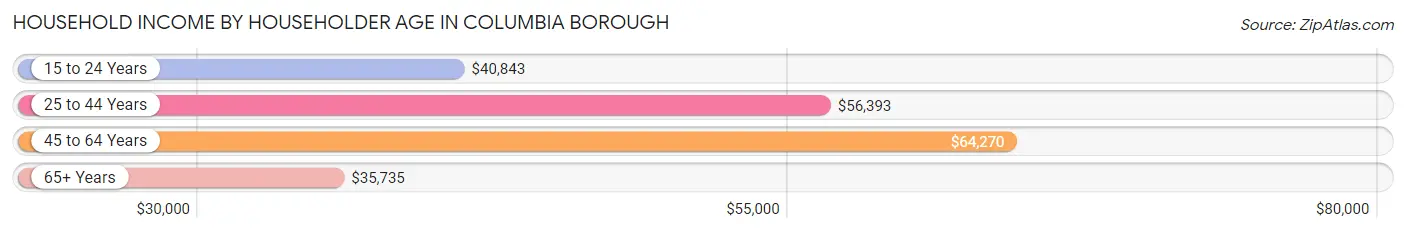
Household Income by Householder Age in Columbia borough
The median household income in Columbia borough is $50,309, with the highest median household income of $64,270 found in the 45 to 64 years age bracket for the primary householder. A total of 1,431 households (31.7%) fall into this category. Meanwhile, the 65+ years age bracket for the primary householder has the lowest median household income of $35,735, with 1,450 households (32.1%) in this group.
| Income Bracket | # Households | Median Income |
| 15 to 24 Years | 169 (3.7%) | $40,843 |
| 25 to 44 Years | 1,465 (32.5%) | $56,393 |
| 45 to 64 Years | 1,431 (31.7%) | $64,270 |
| 65+ Years | 1,450 (32.1%) | $35,735 |
| Total | 4,515 (100.0%) | $50,309 |
Poverty in Columbia borough
Income Below Poverty by Sex and Age in Columbia borough
With 18.1% poverty level for males and 14.9% for females among the residents of Columbia borough, 5 year old males and 15 year old females are the most vulnerable to poverty, with 25 males (100.0%) and 11 females (84.6%) in their respective age groups living below the poverty level.
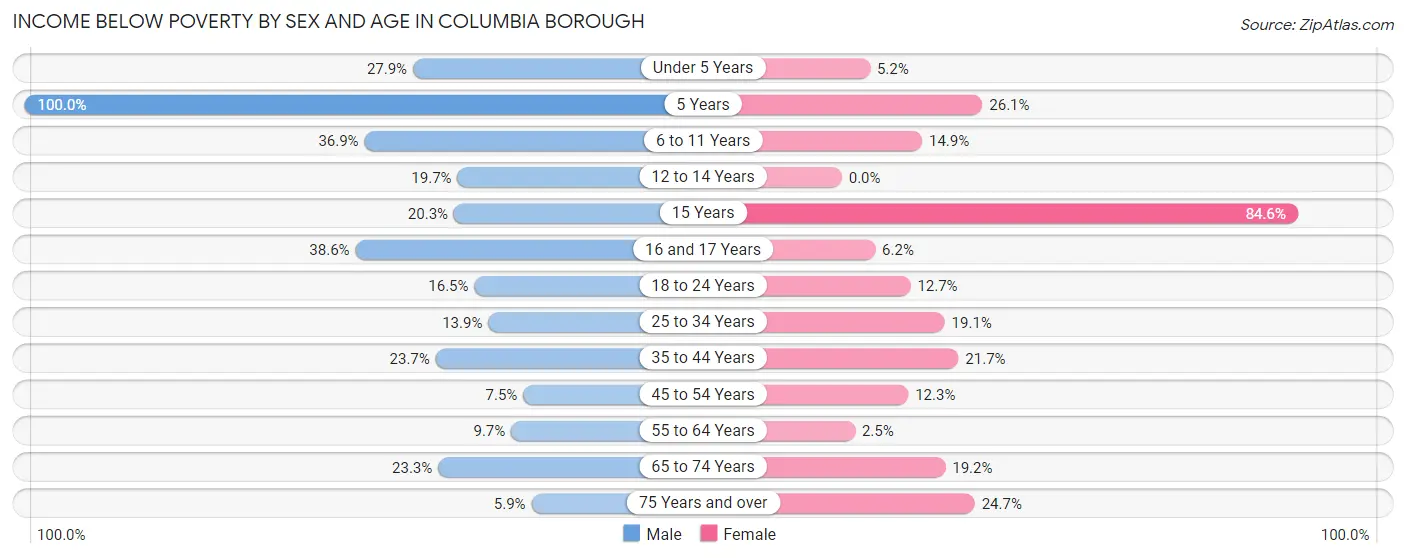
| Age Bracket | Male | Female |
| Under 5 Years | 43 (27.9%) | 9 (5.2%) |
| 5 Years | 25 (100.0%) | 12 (26.1%) |
| 6 to 11 Years | 120 (36.9%) | 39 (14.9%) |
| 12 to 14 Years | 35 (19.7%) | 0 (0.0%) |
| 15 Years | 13 (20.3%) | 11 (84.6%) |
| 16 and 17 Years | 66 (38.6%) | 7 (6.2%) |
| 18 to 24 Years | 58 (16.5%) | 60 (12.7%) |
| 25 to 34 Years | 127 (13.9%) | 122 (19.1%) |
| 35 to 44 Years | 156 (23.7%) | 147 (21.6%) |
| 45 to 54 Years | 47 (7.5%) | 56 (12.3%) |
| 55 to 64 Years | 68 (9.7%) | 20 (2.5%) |
| 65 to 74 Years | 163 (23.3%) | 88 (19.2%) |
| 75 Years and over | 20 (5.9%) | 134 (24.7%) |
| Total | 941 (18.1%) | 705 (14.9%) |
Income Above Poverty by Sex and Age in Columbia borough
According to the poverty statistics in Columbia borough, males aged 75 years and over and females aged 12 to 14 years are the age groups that are most secure financially, with 94.1% of males and 100.0% of females in these age groups living above the poverty line.
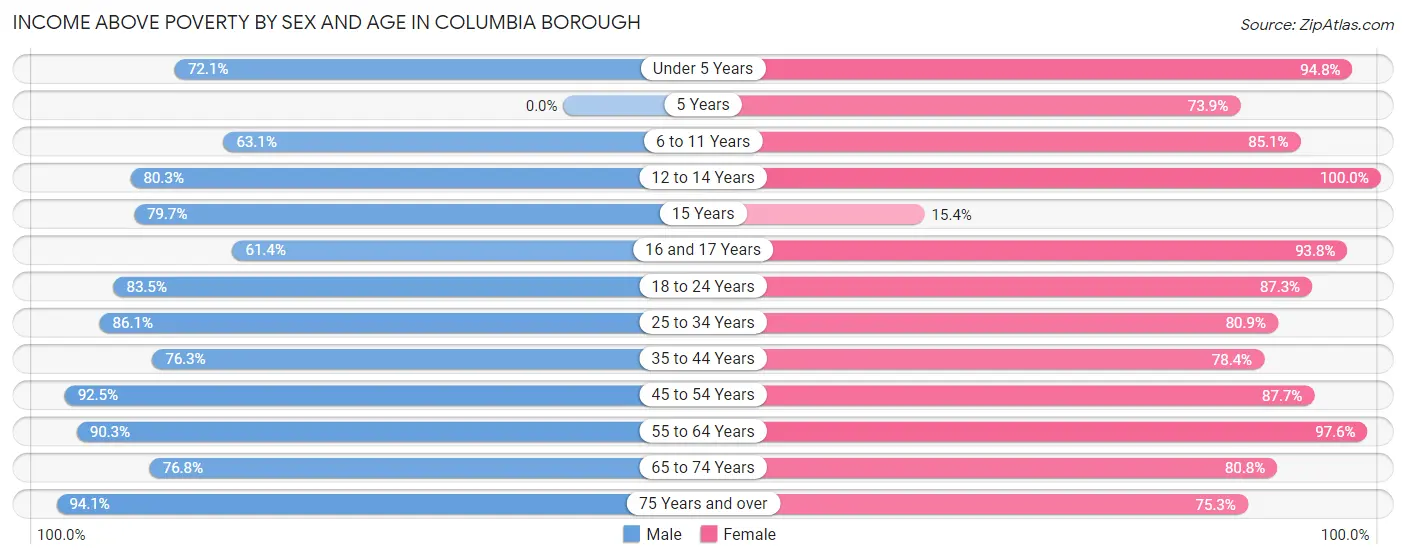
| Age Bracket | Male | Female |
| Under 5 Years | 111 (72.1%) | 163 (94.8%) |
| 5 Years | 0 (0.0%) | 34 (73.9%) |
| 6 to 11 Years | 205 (63.1%) | 223 (85.1%) |
| 12 to 14 Years | 143 (80.3%) | 78 (100.0%) |
| 15 Years | 51 (79.7%) | 2 (15.4%) |
| 16 and 17 Years | 105 (61.4%) | 106 (93.8%) |
| 18 to 24 Years | 293 (83.5%) | 411 (87.3%) |
| 25 to 34 Years | 784 (86.1%) | 517 (80.9%) |
| 35 to 44 Years | 502 (76.3%) | 532 (78.3%) |
| 45 to 54 Years | 583 (92.5%) | 398 (87.7%) |
| 55 to 64 Years | 633 (90.3%) | 795 (97.6%) |
| 65 to 74 Years | 538 (76.7%) | 370 (80.8%) |
| 75 Years and over | 318 (94.1%) | 409 (75.3%) |
| Total | 4,266 (81.9%) | 4,038 (85.1%) |
Income Below Poverty Among Married-Couple Families in Columbia borough
The poverty statistics for married-couple families in Columbia borough show that 4.7% or 73 of the total 1,561 families live below the poverty line. Families with 5 or more children have the highest poverty rate of 100.0%, comprising of 9 families. On the other hand, families with 3 or 4 children have the lowest poverty rate of 0.0%, which includes 0 families.
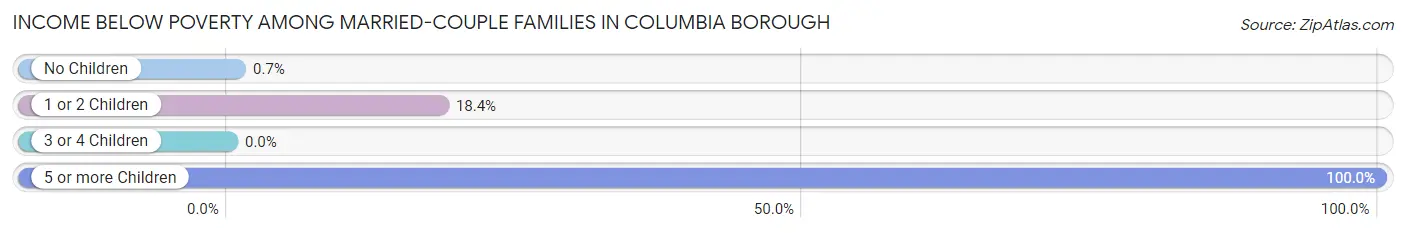
| Children | Above Poverty | Below Poverty |
| No Children | 1,136 (99.3%) | 8 (0.7%) |
| 1 or 2 Children | 249 (81.6%) | 56 (18.4%) |
| 3 or 4 Children | 103 (100.0%) | 0 (0.0%) |
| 5 or more Children | 0 (0.0%) | 9 (100.0%) |
| Total | 1,488 (95.3%) | 73 (4.7%) |
Income Below Poverty Among Single-Parent Households in Columbia borough
According to the poverty data in Columbia borough, 7.2% or 25 single-father households and 24.6% or 140 single-mother households are living below the poverty line. Among single-father households, those with 1 or 2 children have the highest poverty rate, with 19 households (22.6%) experiencing poverty. Likewise, among single-mother households, those with 3 or 4 children have the highest poverty rate, with 33 households (48.5%) falling below the poverty line.
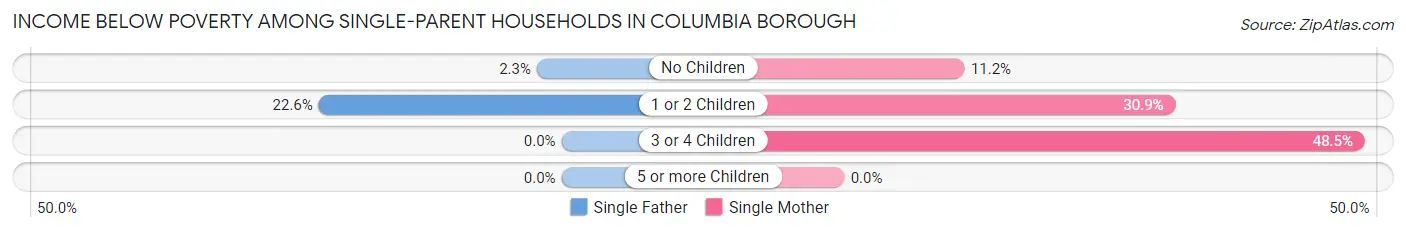
| Children | Single Father | Single Mother |
| No Children | 6 (2.3%) | 27 (11.2%) |
| 1 or 2 Children | 19 (22.6%) | 80 (30.9%) |
| 3 or 4 Children | 0 (0.0%) | 33 (48.5%) |
| 5 or more Children | 0 (0.0%) | 0 (0.0%) |
| Total | 25 (7.2%) | 140 (24.6%) |
Income Below Poverty Among Married-Couple vs Single-Parent Households in Columbia borough
The poverty data for Columbia borough shows that 73 of the married-couple family households (4.7%) and 165 of the single-parent households (18.1%) are living below the poverty level. Within the married-couple family households, those with 5 or more children have the highest poverty rate, with 9 households (100.0%) falling below the poverty line. Among the single-parent households, those with 3 or 4 children have the highest poverty rate, with 33 household (48.5%) living below poverty.
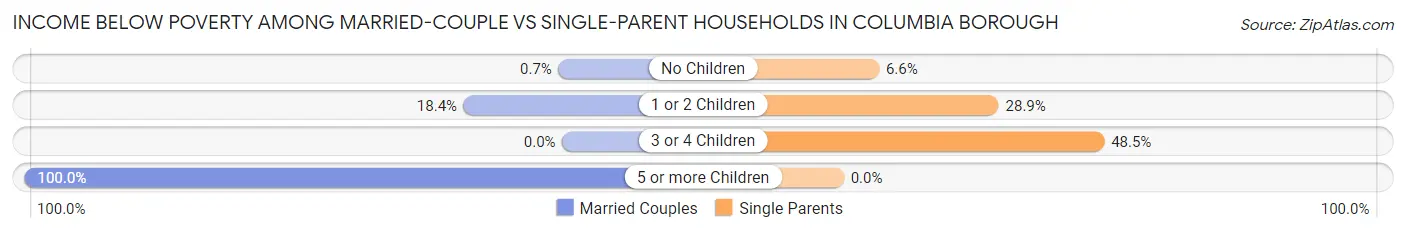
| Children | Married-Couple Families | Single-Parent Households |
| No Children | 8 (0.7%) | 33 (6.6%) |
| 1 or 2 Children | 56 (18.4%) | 99 (28.9%) |
| 3 or 4 Children | 0 (0.0%) | 33 (48.5%) |
| 5 or more Children | 9 (100.0%) | 0 (0.0%) |
| Total | 73 (4.7%) | 165 (18.1%) |
Race in Columbia borough
The most populous races in Columbia borough are White / Caucasian (8,264 | 81.0%), Hispanic or Latino (2,393 | 23.4%), and Black / African American (794 | 7.8%).
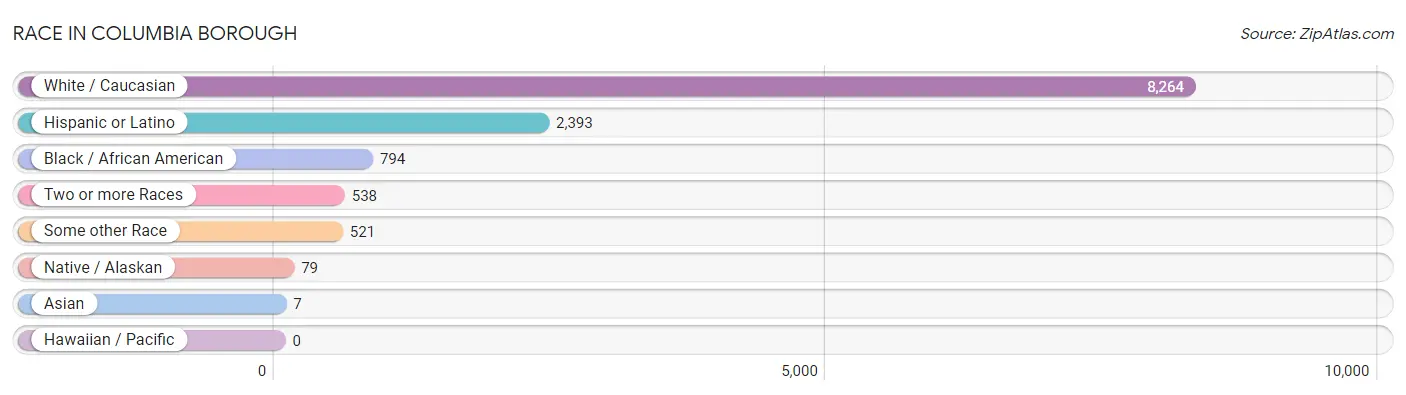
| Race | # Population | % Population |
| Asian | 7 | 0.1% |
| Black / African American | 794 | 7.8% |
| Hawaiian / Pacific | 0 | 0.0% |
| Hispanic or Latino | 2,393 | 23.4% |
| Native / Alaskan | 79 | 0.8% |
| White / Caucasian | 8,264 | 81.0% |
| Two or more Races | 538 | 5.3% |
| Some other Race | 521 | 5.1% |
| Total | 10,203 | 100.0% |
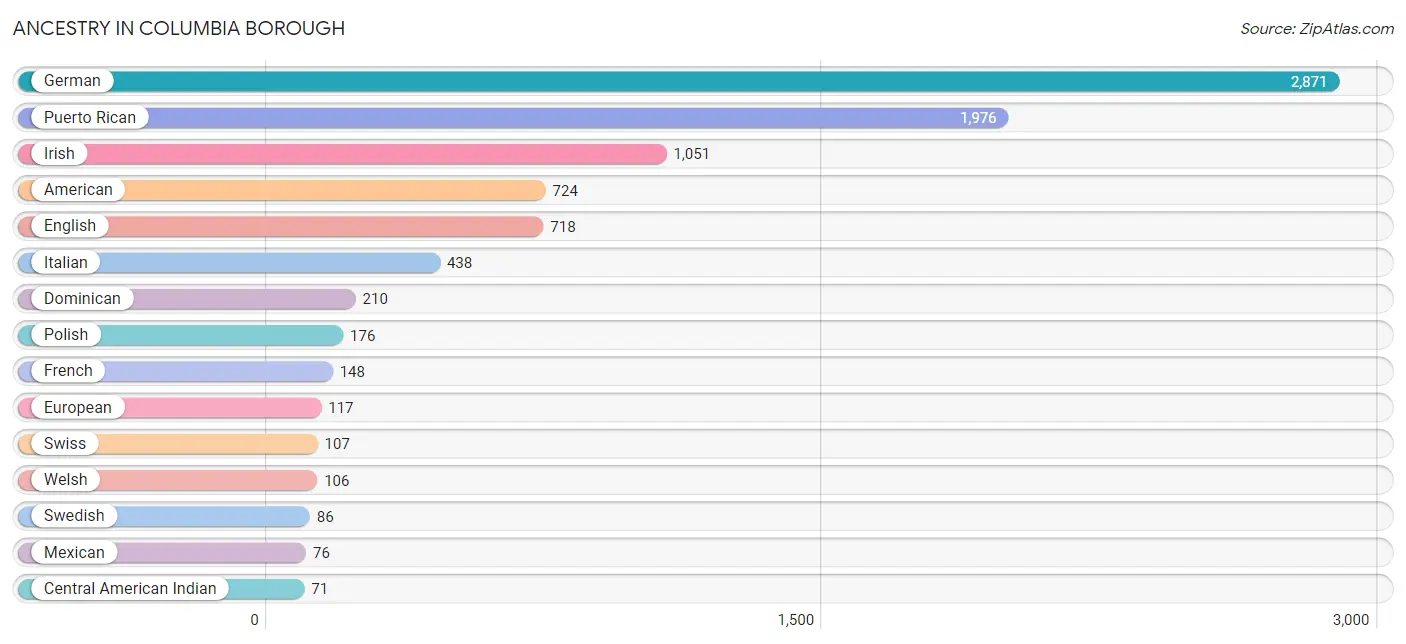
Ancestry in Columbia borough
The most populous ancestries reported in Columbia borough are German (2,871 | 28.1%), Puerto Rican (1,976 | 19.4%), Irish (1,051 | 10.3%), American (724 | 7.1%), and English (718 | 7.0%), together accounting for 71.9% of all Columbia borough residents.
| Ancestry | # Population | % Population |
| American | 724 | 7.1% |
| Arab | 58 | 0.6% |
| Austrian | 25 | 0.3% |
| Bhutanese | 1 | 0.0% |
| Blackfeet | 10 | 0.1% |
| Canadian | 33 | 0.3% |
| Central American | 44 | 0.4% |
| Central American Indian | 71 | 0.7% |
| Cherokee | 6 | 0.1% |
| Colombian | 37 | 0.4% |
| Cuban | 14 | 0.1% |
| Czechoslovakian | 23 | 0.2% |
| Dominican | 210 | 2.1% |
| Dutch | 49 | 0.5% |
| Dutch West Indian | 1 | 0.0% |
| Egyptian | 58 | 0.6% |
| English | 718 | 7.0% |
| European | 117 | 1.1% |
| French | 148 | 1.5% |
| French Canadian | 16 | 0.2% |
| German | 2,871 | 28.1% |
| Guatemalan | 44 | 0.4% |
| Haitian | 11 | 0.1% |
| Hungarian | 3 | 0.0% |
| Irish | 1,051 | 10.3% |
| Italian | 438 | 4.3% |
| Jamaican | 8 | 0.1% |
| Japanese | 7 | 0.1% |
| Lithuanian | 10 | 0.1% |
| Mexican | 76 | 0.7% |
| Navajo | 12 | 0.1% |
| Norwegian | 27 | 0.3% |
| Polish | 176 | 1.7% |
| Portuguese | 18 | 0.2% |
| Puerto Rican | 1,976 | 19.4% |
| Scotch-Irish | 48 | 0.5% |
| Scottish | 44 | 0.4% |
| Serbian | 16 | 0.2% |
| Slovak | 44 | 0.4% |
| South American | 37 | 0.4% |
| Spanish | 20 | 0.2% |
| Subsaharan African | 9 | 0.1% |
| Swedish | 86 | 0.8% |
| Swiss | 107 | 1.1% |
| Turkish | 7 | 0.1% |
| Ukrainian | 14 | 0.1% |
| Welsh | 106 | 1.0% |
| Yugoslavian | 16 | 0.2% | View All 48 Rows |
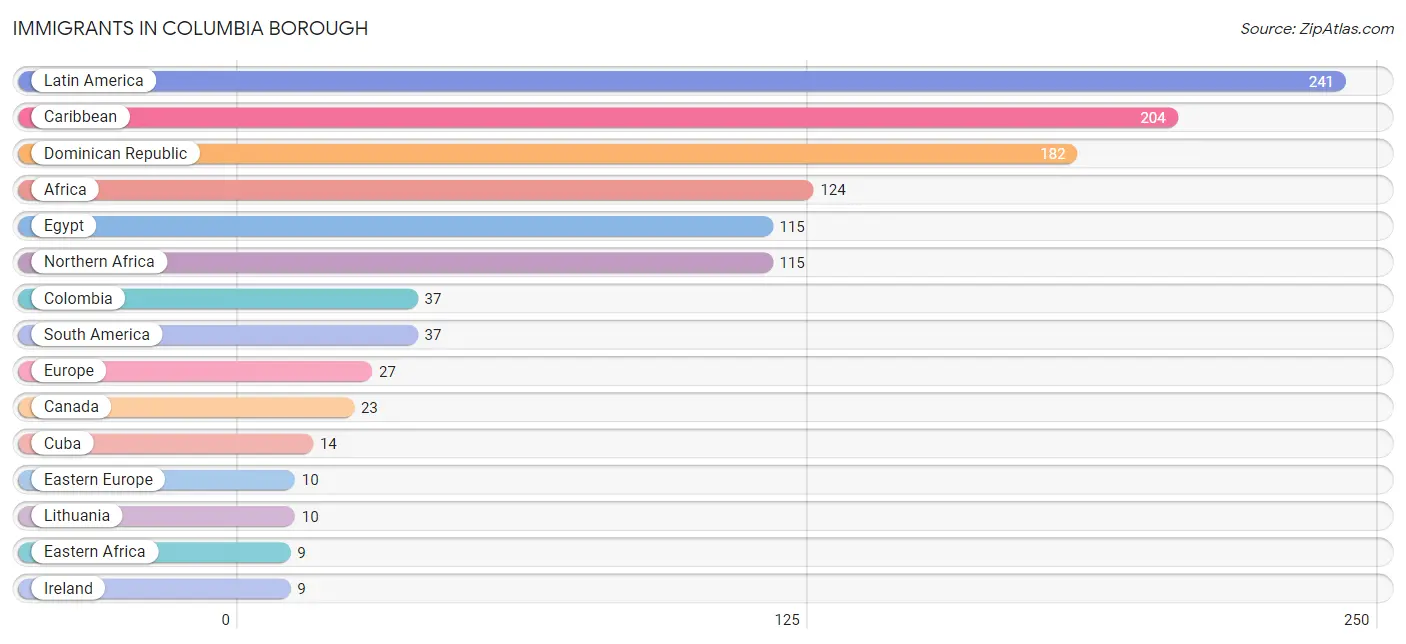
Immigrants in Columbia borough
The most numerous immigrant groups reported in Columbia borough came from Latin America (241 | 2.4%), Caribbean (204 | 2.0%), Dominican Republic (182 | 1.8%), Africa (124 | 1.2%), and Egypt (115 | 1.1%), together accounting for 8.5% of all Columbia borough residents.
| Immigration Origin | # Population | % Population |
| Africa | 124 | 1.2% |
| Canada | 23 | 0.2% |
| Caribbean | 204 | 2.0% |
| Colombia | 37 | 0.4% |
| Cuba | 14 | 0.1% |
| Dominican Republic | 182 | 1.8% |
| Eastern Africa | 9 | 0.1% |
| Eastern Europe | 10 | 0.1% |
| Egypt | 115 | 1.1% |
| Europe | 27 | 0.3% |
| Germany | 8 | 0.1% |
| Ireland | 9 | 0.1% |
| Jamaica | 8 | 0.1% |
| Latin America | 241 | 2.4% |
| Lithuania | 10 | 0.1% |
| Northern Africa | 115 | 1.1% |
| Northern Europe | 9 | 0.1% |
| South America | 37 | 0.4% |
| Western Europe | 8 | 0.1% | View All 19 Rows |
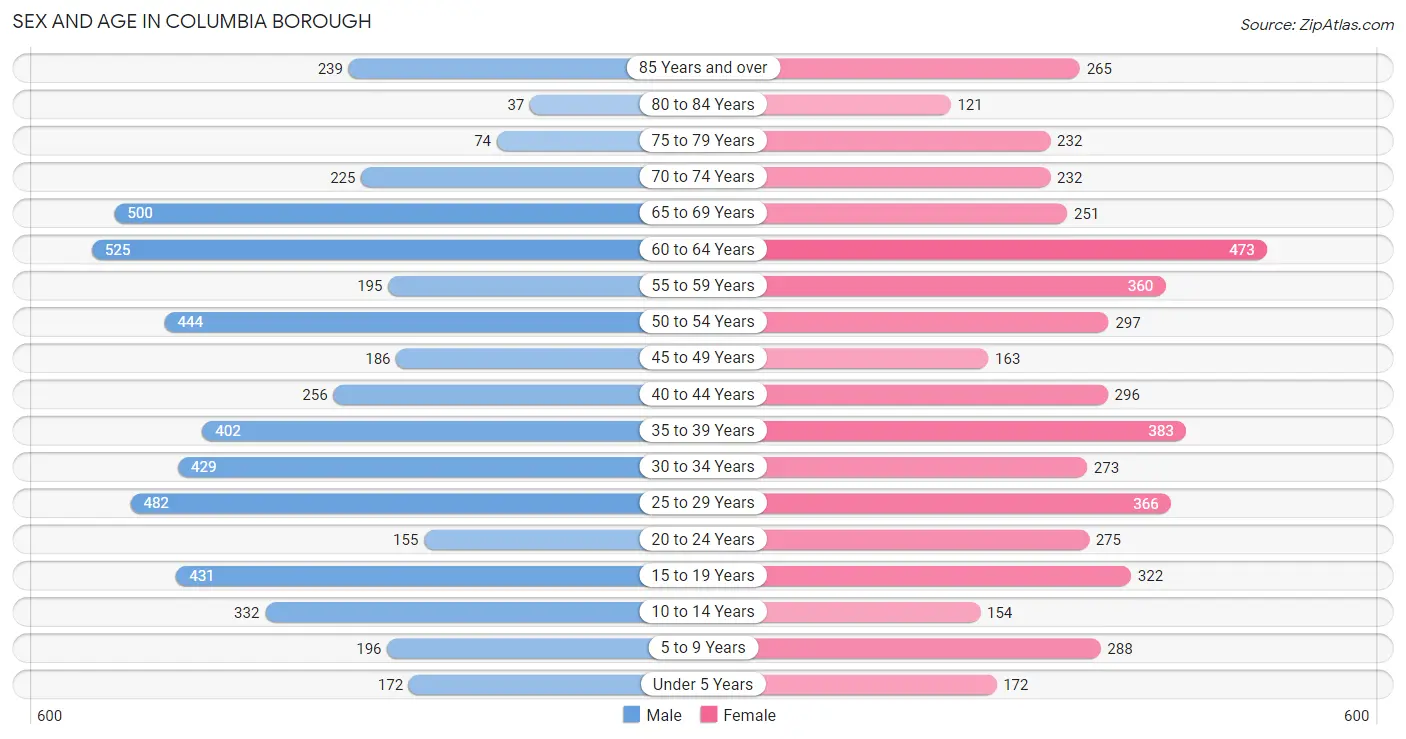
Sex and Age in Columbia borough
Sex and Age in Columbia borough
The most populous age groups in Columbia borough are 60 to 64 Years (525 | 9.9%) for men and 60 to 64 Years (473 | 9.6%) for women.
| Age Bracket | Male | Female |
| Under 5 Years | 172 (3.3%) | 172 (3.5%) |
| 5 to 9 Years | 196 (3.7%) | 288 (5.9%) |
| 10 to 14 Years | 332 (6.3%) | 154 (3.1%) |
| 15 to 19 Years | 431 (8.2%) | 322 (6.5%) |
| 20 to 24 Years | 155 (2.9%) | 275 (5.6%) |
| 25 to 29 Years | 482 (9.1%) | 366 (7.4%) |
| 30 to 34 Years | 429 (8.1%) | 273 (5.6%) |
| 35 to 39 Years | 402 (7.6%) | 383 (7.8%) |
| 40 to 44 Years | 256 (4.9%) | 296 (6.0%) |
| 45 to 49 Years | 186 (3.5%) | 163 (3.3%) |
| 50 to 54 Years | 444 (8.4%) | 297 (6.0%) |
| 55 to 59 Years | 195 (3.7%) | 360 (7.3%) |
| 60 to 64 Years | 525 (9.9%) | 473 (9.6%) |
| 65 to 69 Years | 500 (9.5%) | 251 (5.1%) |
| 70 to 74 Years | 225 (4.3%) | 232 (4.7%) |
| 75 to 79 Years | 74 (1.4%) | 232 (4.7%) |
| 80 to 84 Years | 37 (0.7%) | 121 (2.5%) |
| 85 Years and over | 239 (4.5%) | 265 (5.4%) |
| Total | 5,280 (100.0%) | 4,923 (100.0%) |
Families and Households in Columbia borough
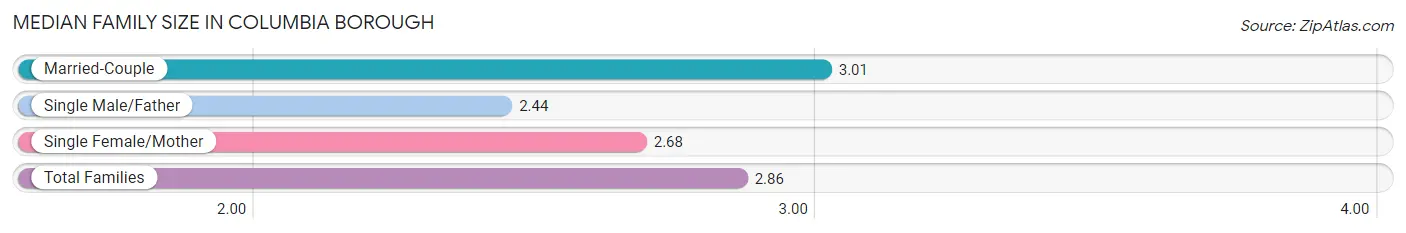
Median Family Size in Columbia borough
The median family size in Columbia borough is 2.86 persons per family, with married-couple families (1,561 | 63.1%) accounting for the largest median family size of 3.01 persons per family. On the other hand, single male/father families (345 | 14.0%) represent the smallest median family size with 2.44 persons per family.
| Family Type | # Families | Family Size |
| Married-Couple | 1,561 (63.1%) | 3.01 |
| Single Male/Father | 345 (14.0%) | 2.44 |
| Single Female/Mother | 568 (23.0%) | 2.68 |
| Total Families | 2,474 (100.0%) | 2.86 |
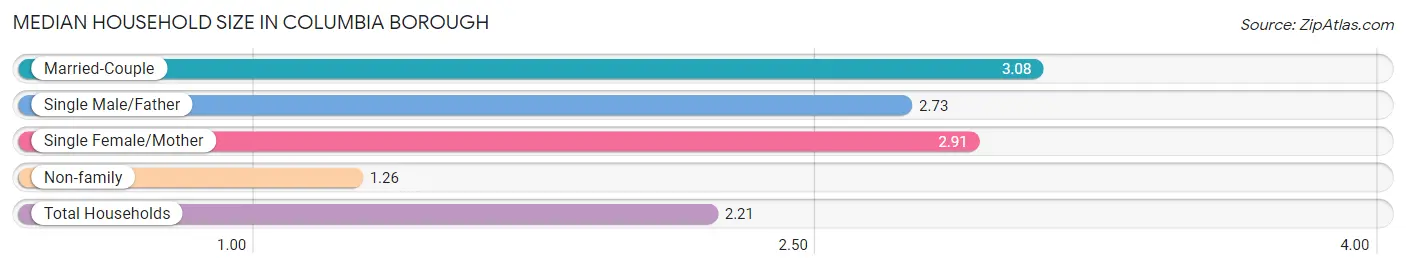
Median Household Size in Columbia borough
The median household size in Columbia borough is 2.21 persons per household, with married-couple households (1,561 | 34.6%) accounting for the largest median household size of 3.08 persons per household. non-family households (2,041 | 45.2%) represent the smallest median household size with 1.26 persons per household.
| Household Type | # Households | Household Size |
| Married-Couple | 1,561 (34.6%) | 3.08 |
| Single Male/Father | 345 (7.6%) | 2.73 |
| Single Female/Mother | 568 (12.6%) | 2.91 |
| Non-family | 2,041 (45.2%) | 1.26 |
| Total Households | 4,515 (100.0%) | 2.21 |
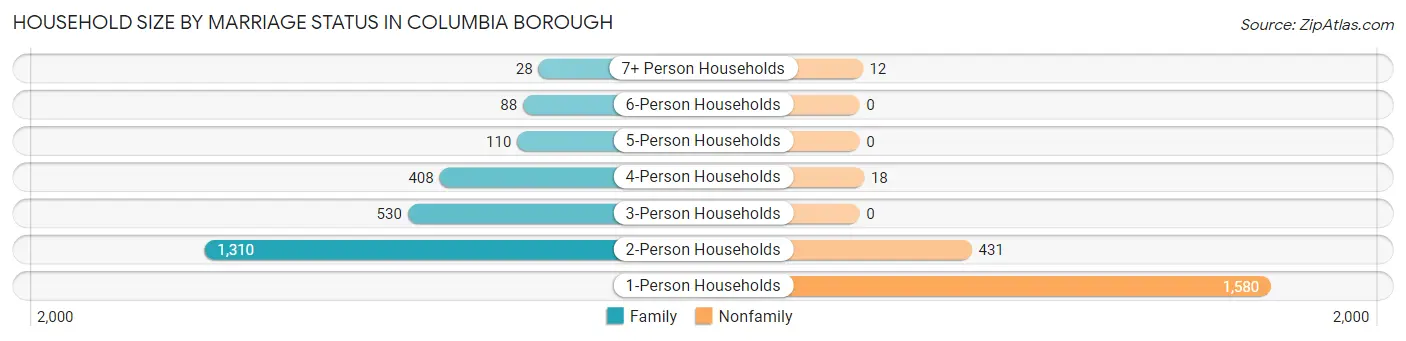
Household Size by Marriage Status in Columbia borough
Out of a total of 4,515 households in Columbia borough, 2,474 (54.8%) are family households, while 2,041 (45.2%) are nonfamily households. The most numerous type of family households are 2-person households, comprising 1,310, and the most common type of nonfamily households are 1-person households, comprising 1,580.
| Household Size | Family Households | Nonfamily Households |
| 1-Person Households | - | 1,580 (35.0%) |
| 2-Person Households | 1,310 (29.0%) | 431 (9.6%) |
| 3-Person Households | 530 (11.7%) | 0 (0.0%) |
| 4-Person Households | 408 (9.0%) | 18 (0.4%) |
| 5-Person Households | 110 (2.4%) | 0 (0.0%) |
| 6-Person Households | 88 (1.9%) | 0 (0.0%) |
| 7+ Person Households | 28 (0.6%) | 12 (0.3%) |
| Total | 2,474 (54.8%) | 2,041 (45.2%) |
Female Fertility in Columbia borough
Fertility by Age in Columbia borough
Average fertility rate in Columbia borough is 47.0 births per 1,000 women. Women in the age bracket of 15 to 19 years have the highest fertility rate with 81.0 births per 1,000 women. Women in the age bracket of 20 to 34 years acount for 58.6% of all women with births.
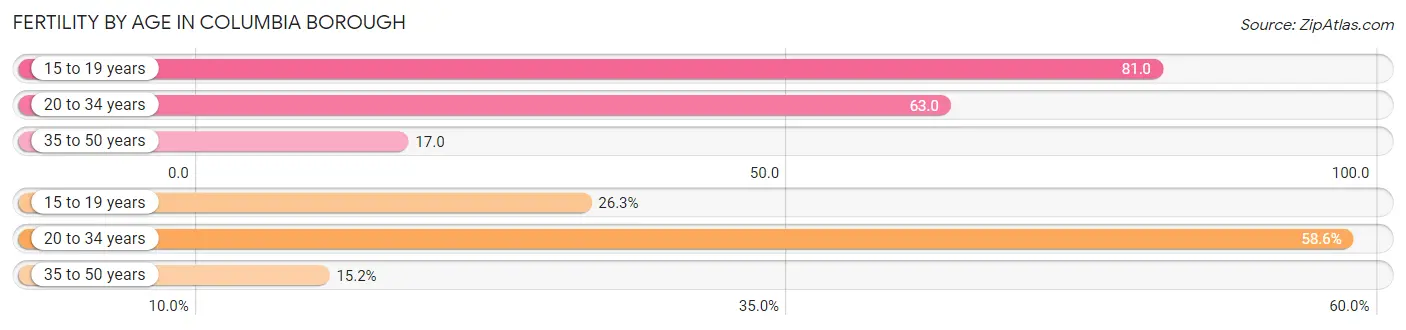
| Age Bracket | Women with Births | Births / 1,000 Women |
| 15 to 19 years | 26 (26.3%) | 81.0 |
| 20 to 34 years | 58 (58.6%) | 63.0 |
| 35 to 50 years | 15 (15.1%) | 17.0 |
| Total | 99 (100.0%) | 47.0 |
Fertility by Age by Marriage Status in Columbia borough
29.3% of women with births (99) in Columbia borough are married. The highest percentage of unmarried women with births falls into 15 to 19 years age bracket with 100.0% of them unmarried at the time of birth, while the lowest percentage of unmarried women with births belong to 35 to 50 years age bracket with 33.3% of them unmarried.
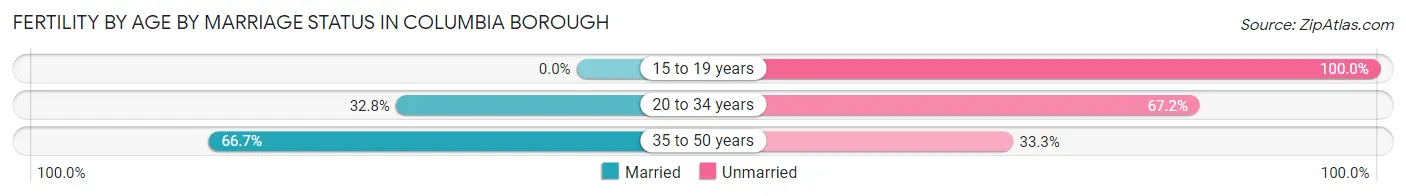
| Age Bracket | Married | Unmarried |
| 15 to 19 years | 0 (0.0%) | 26 (100.0%) |
| 20 to 34 years | 19 (32.8%) | 39 (67.2%) |
| 35 to 50 years | 10 (66.7%) | 5 (33.3%) |
| Total | 29 (29.3%) | 70 (70.7%) |
Fertility by Education in Columbia borough
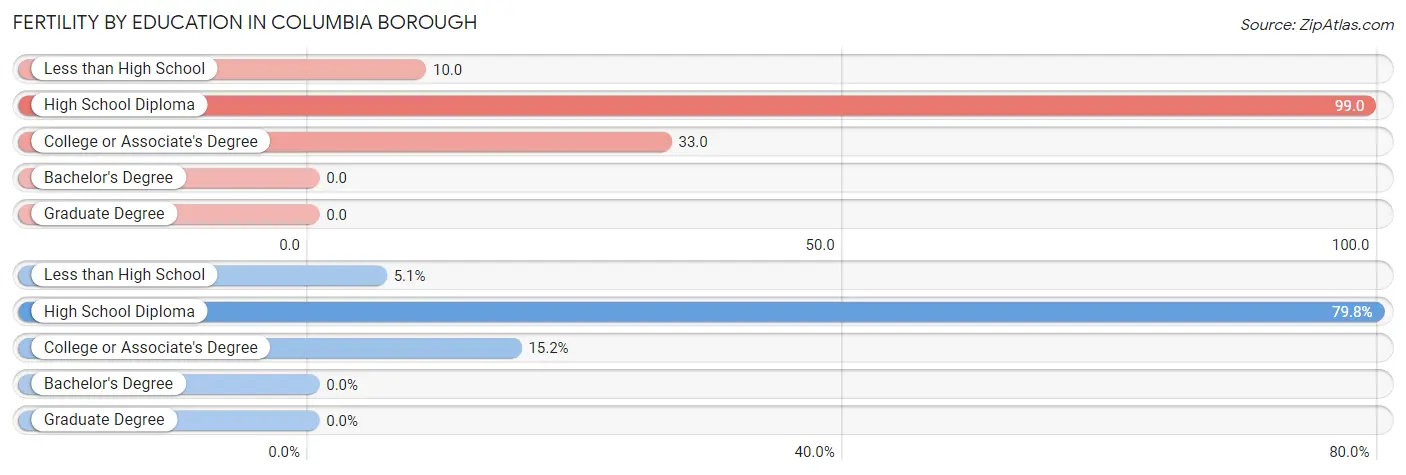
| Educational Attainment | Women with Births | Births / 1,000 Women |
| Less than High School | 5 (5.1%) | 10.0 |
| High School Diploma | 79 (79.8%) | 99.0 |
| College or Associate's Degree | 15 (15.1%) | 33.0 |
| Bachelor's Degree | 0 (0.0%) | 0.0 |
| Graduate Degree | 0 (0.0%) | 0.0 |
| Total | 99 (100.0%) | 47.0 |
Fertility by Education by Marriage Status in Columbia borough
70.7% of women with births in Columbia borough are unmarried. Women with the educational attainment of college or associate's degree are most likely to be married with 66.7% of them married at childbirth, while women with the educational attainment of less than high school are least likely to be married with 100.0% of them unmarried at childbirth.
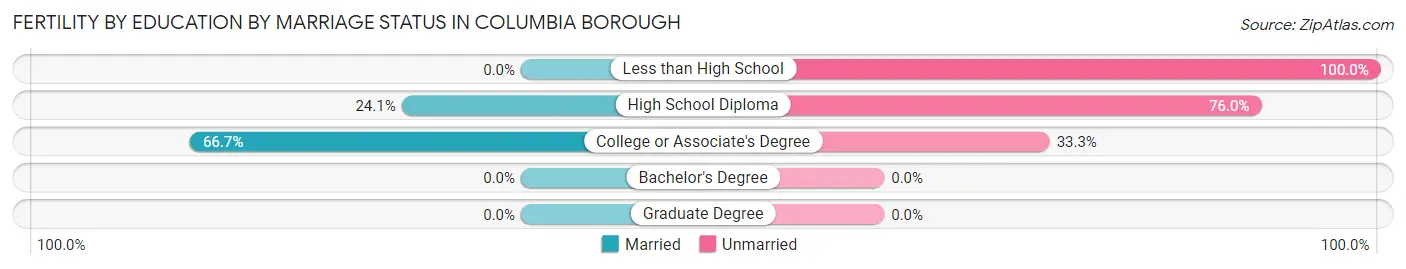
| Educational Attainment | Married | Unmarried |
| Less than High School | 0 (0.0%) | 5 (100.0%) |
| High School Diploma | 19 (24.0%) | 60 (75.9%) |
| College or Associate's Degree | 10 (66.7%) | 5 (33.3%) |
| Bachelor's Degree | 0 (0.0%) | 0 (0.0%) |
| Graduate Degree | 0 (0.0%) | 0 (0.0%) |
| Total | 29 (29.3%) | 70 (70.7%) |
Employment Characteristics in Columbia borough
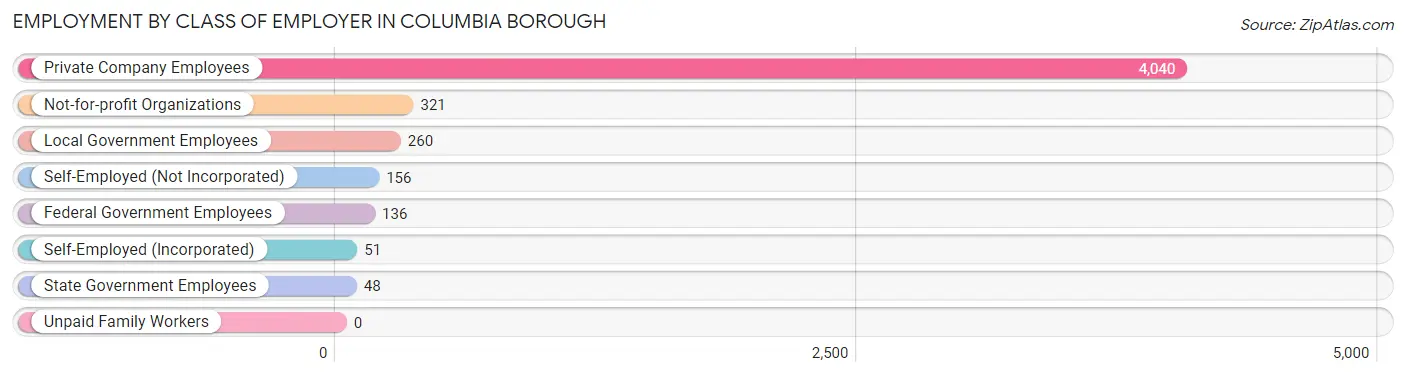
Employment by Class of Employer in Columbia borough
Among the 5,012 employed individuals in Columbia borough, private company employees (4,040 | 80.6%), not-for-profit organizations (321 | 6.4%), and local government employees (260 | 5.2%) make up the most common classes of employment.
| Employer Class | # Employees | % Employees |
| Private Company Employees | 4,040 | 80.6% |
| Self-Employed (Incorporated) | 51 | 1.0% |
| Self-Employed (Not Incorporated) | 156 | 3.1% |
| Not-for-profit Organizations | 321 | 6.4% |
| Local Government Employees | 260 | 5.2% |
| State Government Employees | 48 | 1.0% |
| Federal Government Employees | 136 | 2.7% |
| Unpaid Family Workers | 0 | 0.0% |
| Total | 5,012 | 100.0% |
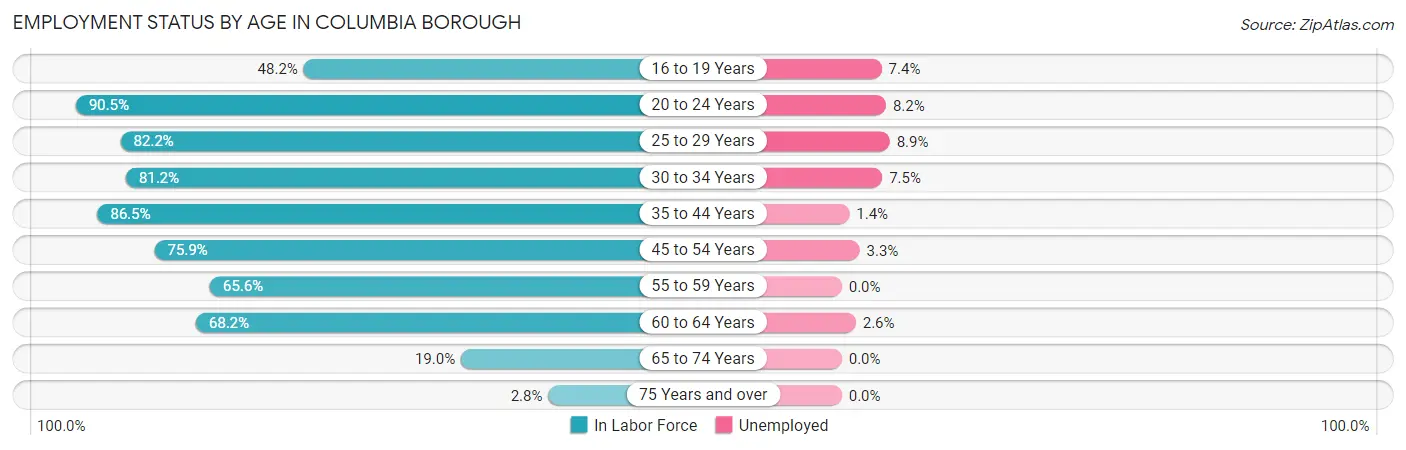
Employment Status by Age in Columbia borough
According to the labor force statistics for Columbia borough, out of the total population over 16 years of age (8,812), 59.8% or 5,270 individuals are in the labor force, with 4.2% or 221 of them unemployed. The age group with the highest labor force participation rate is 20 to 24 years, with 90.5% or 389 individuals in the labor force. Within the labor force, the 25 to 29 years age range has the highest percentage of unemployed individuals, with 8.9% or 62 of them being unemployed.
| Age Bracket | In Labor Force | Unemployed |
| 16 to 19 Years | 326 (48.2%) | 24 (7.4%) |
| 20 to 24 Years | 389 (90.5%) | 32 (8.2%) |
| 25 to 29 Years | 697 (82.2%) | 62 (8.9%) |
| 30 to 34 Years | 570 (81.2%) | 43 (7.5%) |
| 35 to 44 Years | 1,157 (86.5%) | 16 (1.4%) |
| 45 to 54 Years | 827 (75.9%) | 27 (3.3%) |
| 55 to 59 Years | 364 (65.6%) | 0 (0.0%) |
| 60 to 64 Years | 681 (68.2%) | 18 (2.6%) |
| 65 to 74 Years | 230 (19.0%) | 0 (0.0%) |
| 75 Years and over | 27 (2.8%) | 0 (0.0%) |
| Total | 5,270 (59.8%) | 221 (4.2%) |
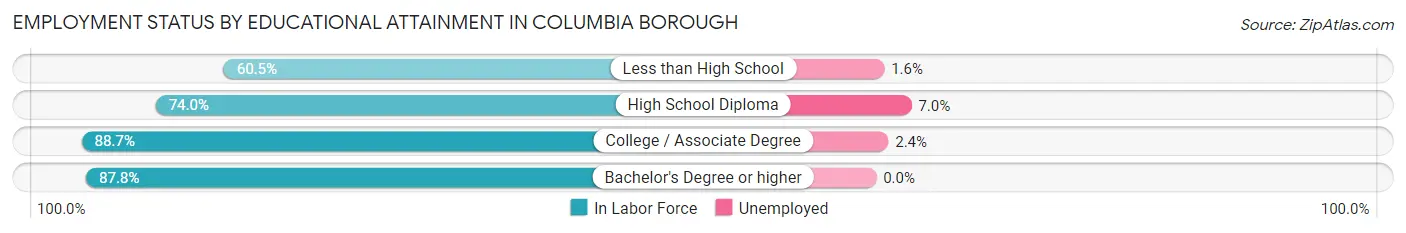
Employment Status by Educational Attainment in Columbia borough
According to labor force statistics for Columbia borough, 77.7% of individuals (4,297) out of the total population between 25 and 64 years of age (5,530) are in the labor force, with 3.9% or 168 of them being unemployed. The group with the highest labor force participation rate are those with the educational attainment of college / associate degree, with 88.7% or 1,116 individuals in the labor force. Within the labor force, individuals with high school diploma education have the highest percentage of unemployment, with 7.0% or 131 of them being unemployed.
| Educational Attainment | In Labor Force | Unemployed |
| Less than High School | 494 (60.5%) | 13 (1.6%) |
| High School Diploma | 1,865 (74.0%) | 176 (7.0%) |
| College / Associate Degree | 1,116 (88.7%) | 30 (2.4%) |
| Bachelor's Degree or higher | 822 (87.8%) | 0 (0.0%) |
| Total | 4,297 (77.7%) | 216 (3.9%) |
Employment Occupations by Sex in Columbia borough
Management, Business, Science and Arts Occupations
The most common Management, Business, Science and Arts occupations in Columbia borough are Community & Social Service (348 | 6.9%), Health Diagnosing & Treating (272 | 5.4%), Management (212 | 4.2%), Business & Financial (183 | 3.6%), and Education Instruction & Library (181 | 3.6%).
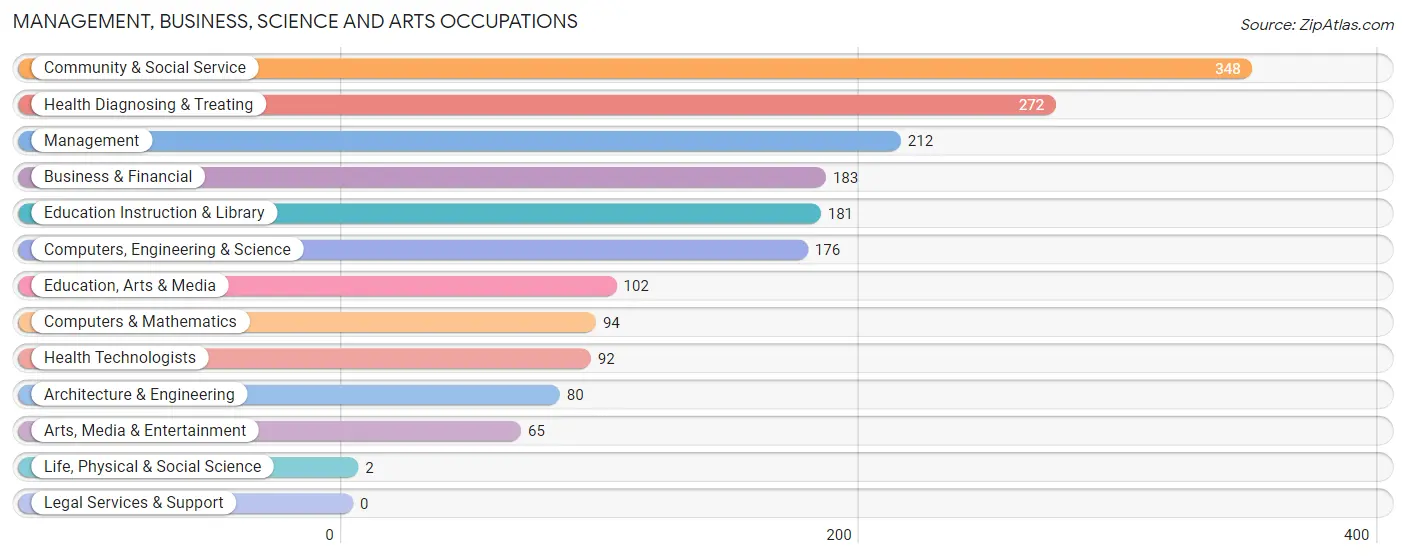
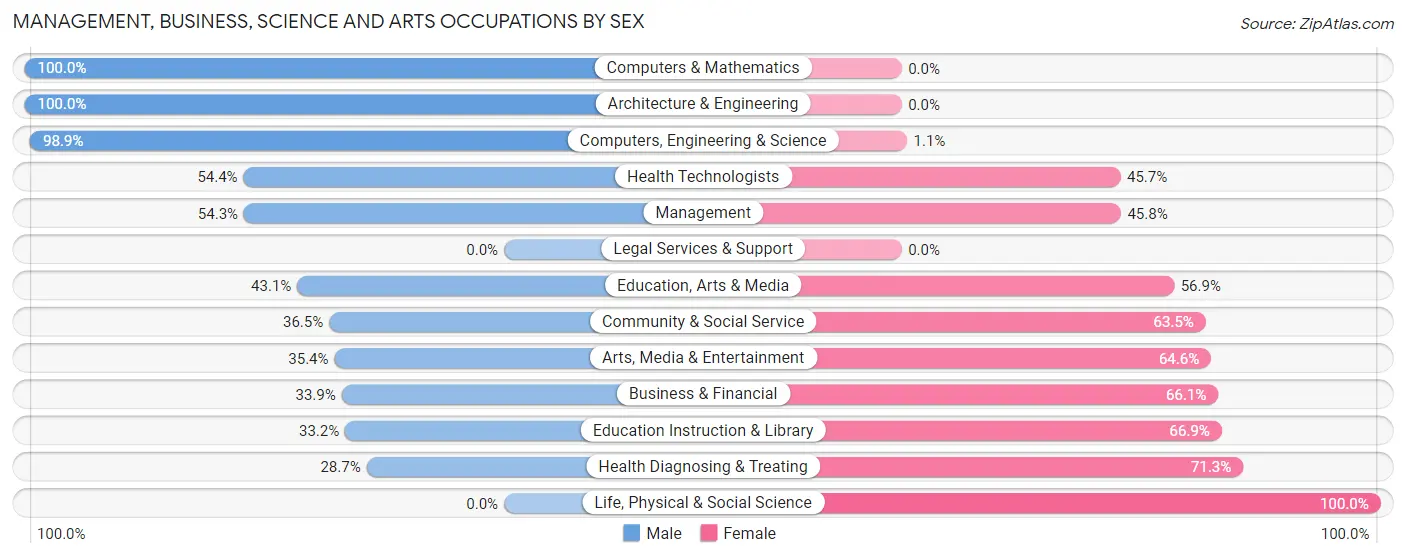
Management, Business, Science and Arts Occupations by Sex
Within the Management, Business, Science and Arts occupations in Columbia borough, the most male-oriented occupations are Computers & Mathematics (100.0%), Architecture & Engineering (100.0%), and Computers, Engineering & Science (98.9%), while the most female-oriented occupations are Life, Physical & Social Science (100.0%), Health Diagnosing & Treating (71.3%), and Education Instruction & Library (66.8%).
| Occupation | Male | Female |
| Management | 115 (54.2%) | 97 (45.8%) |
| Business & Financial | 62 (33.9%) | 121 (66.1%) |
| Computers, Engineering & Science | 174 (98.9%) | 2 (1.1%) |
| Computers & Mathematics | 94 (100.0%) | 0 (0.0%) |
| Architecture & Engineering | 80 (100.0%) | 0 (0.0%) |
| Life, Physical & Social Science | 0 (0.0%) | 2 (100.0%) |
| Community & Social Service | 127 (36.5%) | 221 (63.5%) |
| Education, Arts & Media | 44 (43.1%) | 58 (56.9%) |
| Legal Services & Support | 0 (0.0%) | 0 (0.0%) |
| Education Instruction & Library | 60 (33.2%) | 121 (66.8%) |
| Arts, Media & Entertainment | 23 (35.4%) | 42 (64.6%) |
| Health Diagnosing & Treating | 78 (28.7%) | 194 (71.3%) |
| Health Technologists | 50 (54.3%) | 42 (45.7%) |
| Total (Category) | 556 (46.7%) | 635 (53.3%) |
| Total (Overall) | 2,749 (54.5%) | 2,296 (45.5%) |
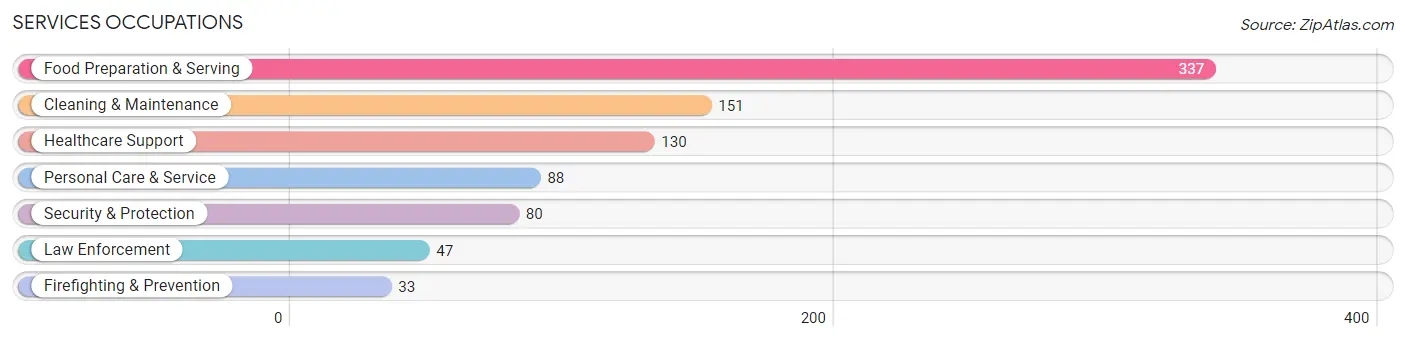
Services Occupations
The most common Services occupations in Columbia borough are Food Preparation & Serving (337 | 6.7%), Cleaning & Maintenance (151 | 3.0%), Healthcare Support (130 | 2.6%), Personal Care & Service (88 | 1.7%), and Security & Protection (80 | 1.6%).
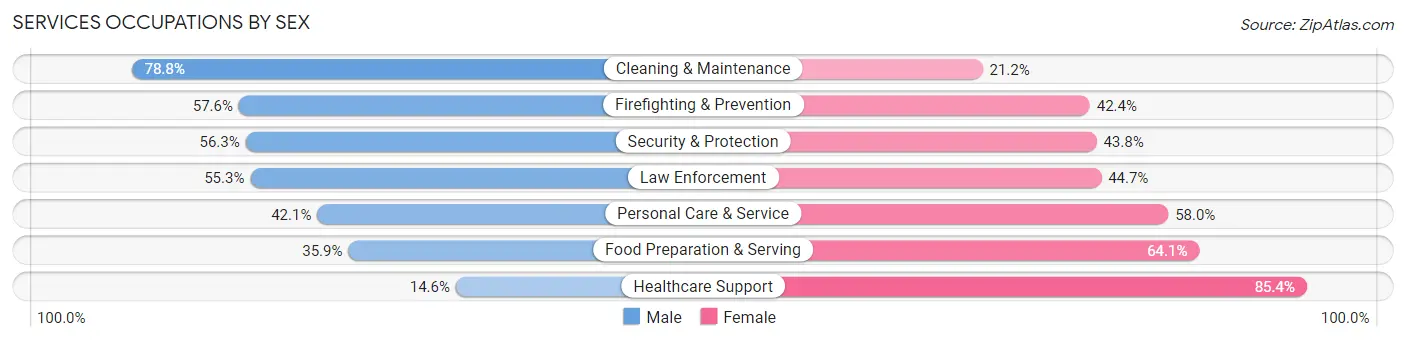
Services Occupations by Sex
Within the Services occupations in Columbia borough, the most male-oriented occupations are Cleaning & Maintenance (78.8%), Firefighting & Prevention (57.6%), and Security & Protection (56.2%), while the most female-oriented occupations are Healthcare Support (85.4%), Food Preparation & Serving (64.1%), and Personal Care & Service (58.0%).
| Occupation | Male | Female |
| Healthcare Support | 19 (14.6%) | 111 (85.4%) |
| Security & Protection | 45 (56.2%) | 35 (43.8%) |
| Firefighting & Prevention | 19 (57.6%) | 14 (42.4%) |
| Law Enforcement | 26 (55.3%) | 21 (44.7%) |
| Food Preparation & Serving | 121 (35.9%) | 216 (64.1%) |
| Cleaning & Maintenance | 119 (78.8%) | 32 (21.2%) |
| Personal Care & Service | 37 (42.0%) | 51 (58.0%) |
| Total (Category) | 341 (43.4%) | 445 (56.6%) |
| Total (Overall) | 2,749 (54.5%) | 2,296 (45.5%) |
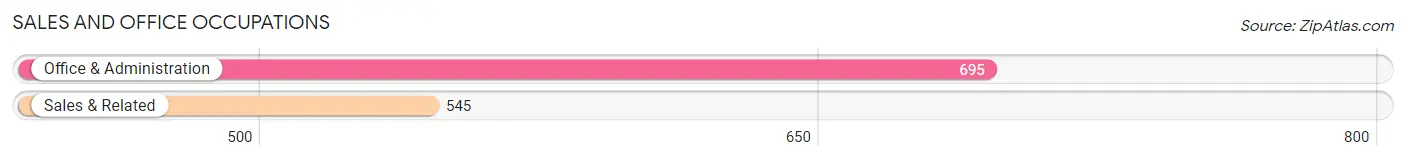
Sales and Office Occupations
The most common Sales and Office occupations in Columbia borough are Office & Administration (695 | 13.8%), and Sales & Related (545 | 10.8%).
Sales and Office Occupations by Sex
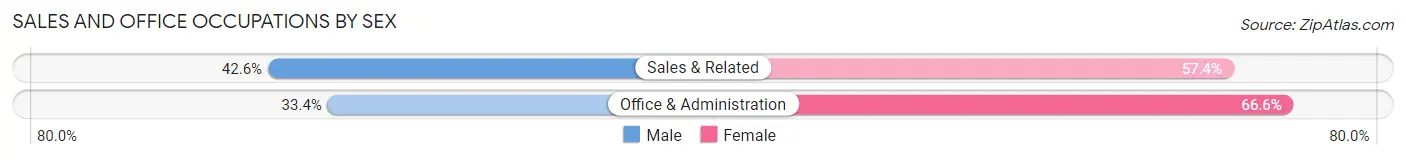
| Occupation | Male | Female |
| Sales & Related | 232 (42.6%) | 313 (57.4%) |
| Office & Administration | 232 (33.4%) | 463 (66.6%) |
| Total (Category) | 464 (37.4%) | 776 (62.6%) |
| Total (Overall) | 2,749 (54.5%) | 2,296 (45.5%) |
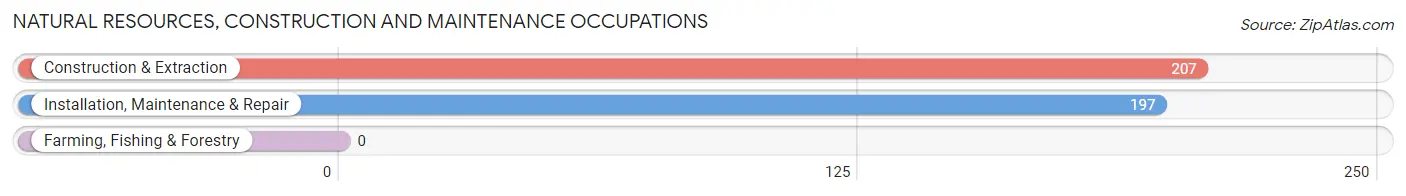
Natural Resources, Construction and Maintenance Occupations
The most common Natural Resources, Construction and Maintenance occupations in Columbia borough are Construction & Extraction (207 | 4.1%), and Installation, Maintenance & Repair (197 | 3.9%).
Natural Resources, Construction and Maintenance Occupations by Sex
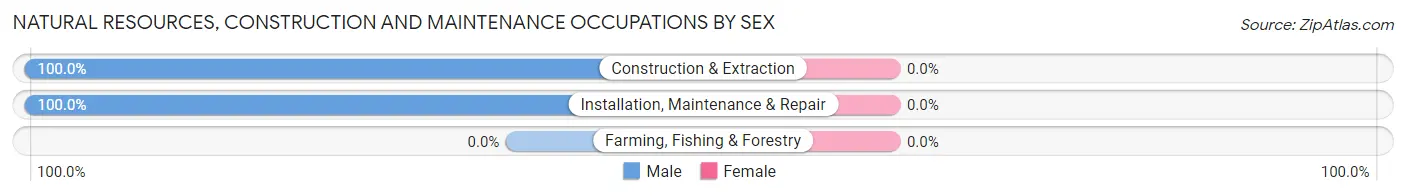
| Occupation | Male | Female |
| Farming, Fishing & Forestry | 0 (0.0%) | 0 (0.0%) |
| Construction & Extraction | 207 (100.0%) | 0 (0.0%) |
| Installation, Maintenance & Repair | 197 (100.0%) | 0 (0.0%) |
| Total (Category) | 404 (100.0%) | 0 (0.0%) |
| Total (Overall) | 2,749 (54.5%) | 2,296 (45.5%) |
Production, Transportation and Moving Occupations
The most common Production, Transportation and Moving occupations in Columbia borough are Material Moving (664 | 13.2%), Production (545 | 10.8%), and Transportation (215 | 4.3%).
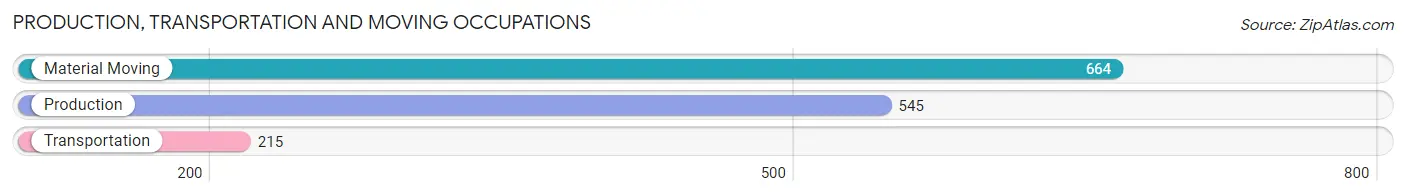
Production, Transportation and Moving Occupations by Sex
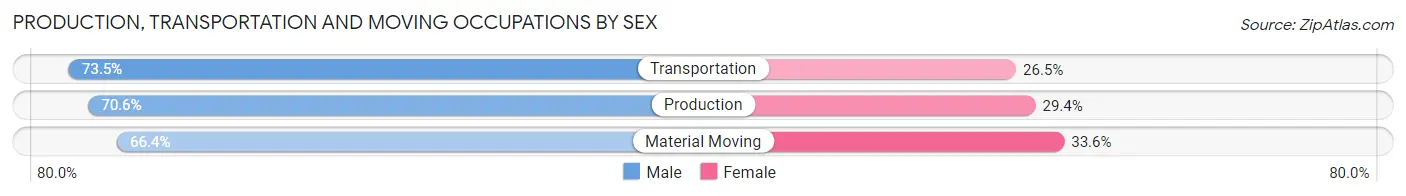
| Occupation | Male | Female |
| Production | 385 (70.6%) | 160 (29.4%) |
| Transportation | 158 (73.5%) | 57 (26.5%) |
| Material Moving | 441 (66.4%) | 223 (33.6%) |
| Total (Category) | 984 (69.1%) | 440 (30.9%) |
| Total (Overall) | 2,749 (54.5%) | 2,296 (45.5%) |
Employment Industries by Sex in Columbia borough
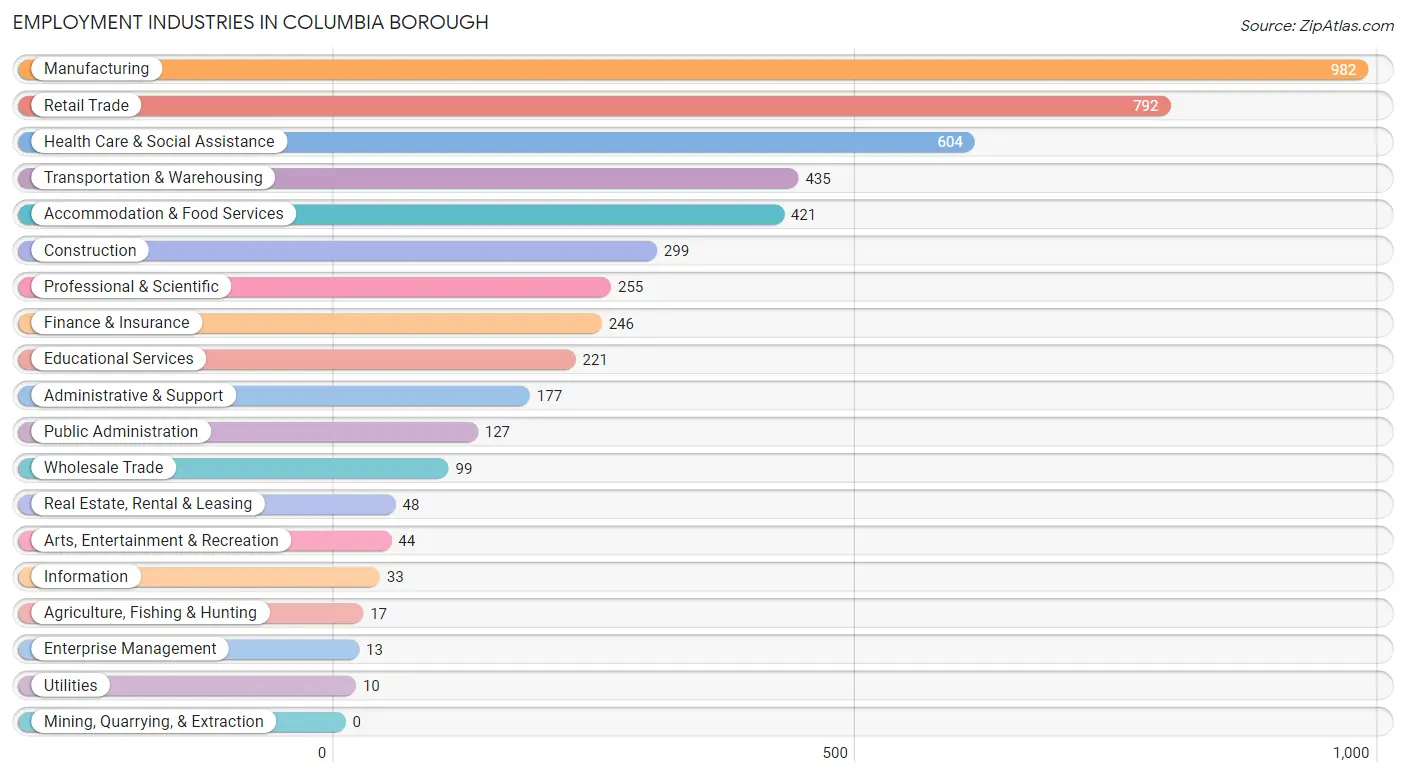
Employment Industries in Columbia borough
The major employment industries in Columbia borough include Manufacturing (982 | 19.5%), Retail Trade (792 | 15.7%), Health Care & Social Assistance (604 | 12.0%), Transportation & Warehousing (435 | 8.6%), and Accommodation & Food Services (421 | 8.3%).
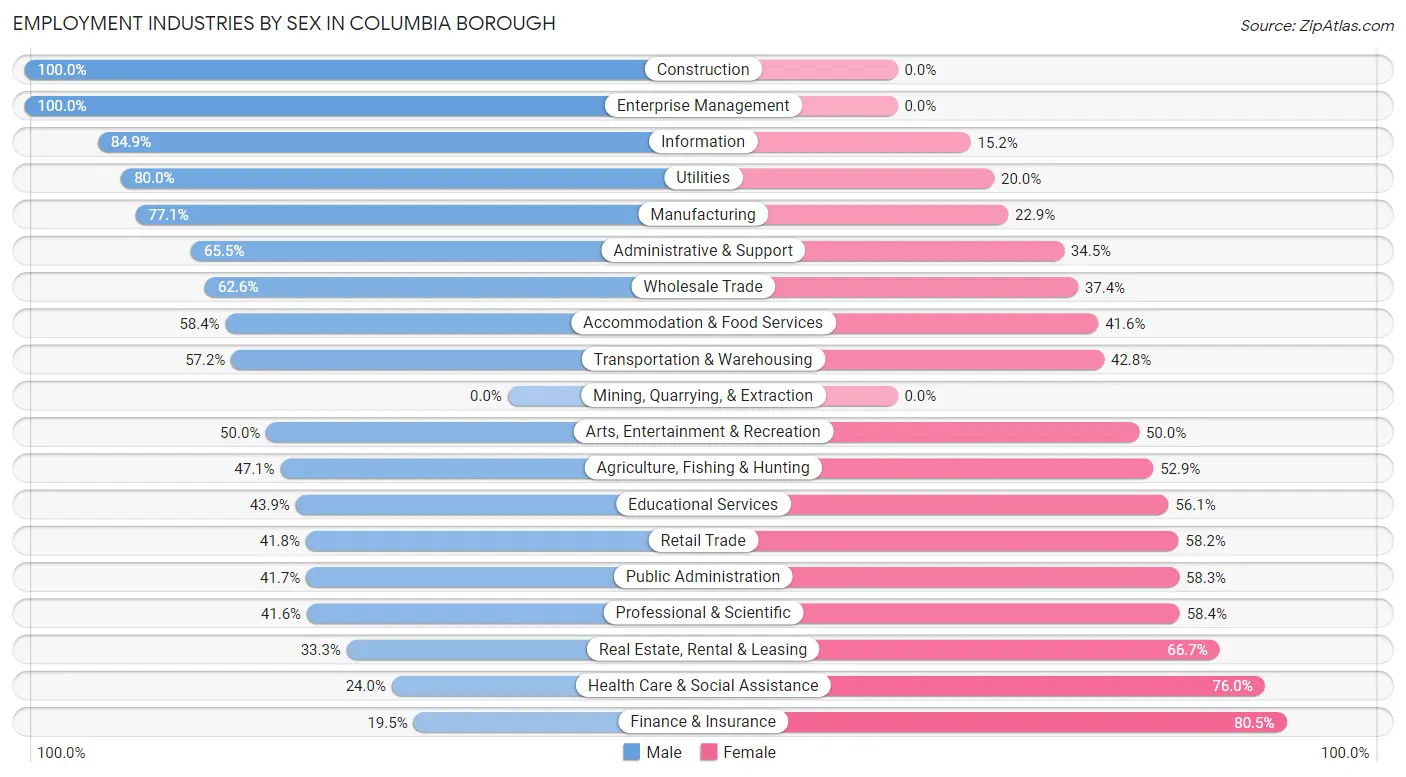
Employment Industries by Sex in Columbia borough
The Columbia borough industries that see more men than women are Construction (100.0%), Enterprise Management (100.0%), and Information (84.9%), whereas the industries that tend to have a higher number of women are Finance & Insurance (80.5%), Health Care & Social Assistance (76.0%), and Real Estate, Rental & Leasing (66.7%).
| Industry | Male | Female |
| Agriculture, Fishing & Hunting | 8 (47.1%) | 9 (52.9%) |
| Mining, Quarrying, & Extraction | 0 (0.0%) | 0 (0.0%) |
| Construction | 299 (100.0%) | 0 (0.0%) |
| Manufacturing | 757 (77.1%) | 225 (22.9%) |
| Wholesale Trade | 62 (62.6%) | 37 (37.4%) |
| Retail Trade | 331 (41.8%) | 461 (58.2%) |
| Transportation & Warehousing | 249 (57.2%) | 186 (42.8%) |
| Utilities | 8 (80.0%) | 2 (20.0%) |
| Information | 28 (84.9%) | 5 (15.1%) |
| Finance & Insurance | 48 (19.5%) | 198 (80.5%) |
| Real Estate, Rental & Leasing | 16 (33.3%) | 32 (66.7%) |
| Professional & Scientific | 106 (41.6%) | 149 (58.4%) |
| Enterprise Management | 13 (100.0%) | 0 (0.0%) |
| Administrative & Support | 116 (65.5%) | 61 (34.5%) |
| Educational Services | 97 (43.9%) | 124 (56.1%) |
| Health Care & Social Assistance | 145 (24.0%) | 459 (76.0%) |
| Arts, Entertainment & Recreation | 22 (50.0%) | 22 (50.0%) |
| Accommodation & Food Services | 246 (58.4%) | 175 (41.6%) |
| Public Administration | 53 (41.7%) | 74 (58.3%) |
| Total | 2,749 (54.5%) | 2,296 (45.5%) |
Education in Columbia borough
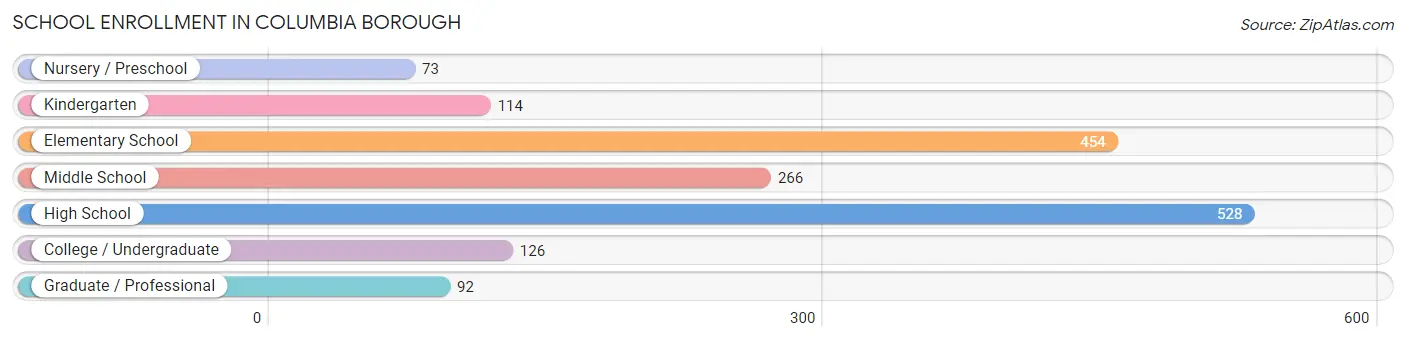
School Enrollment in Columbia borough
The most common levels of schooling among the 1,653 students in Columbia borough are high school (528 | 31.9%), elementary school (454 | 27.5%), and middle school (266 | 16.1%).
| School Level | # Students | % Students |
| Nursery / Preschool | 73 | 4.4% |
| Kindergarten | 114 | 6.9% |
| Elementary School | 454 | 27.5% |
| Middle School | 266 | 16.1% |
| High School | 528 | 31.9% |
| College / Undergraduate | 126 | 7.6% |
| Graduate / Professional | 92 | 5.6% |
| Total | 1,653 | 100.0% |
School Enrollment by Age by Funding Source in Columbia borough
Out of a total of 1,653 students who are enrolled in schools in Columbia borough, 446 (27.0%) attend a private institution, while the remaining 1,207 (73.0%) are enrolled in public schools. The age group of 3 to 4 year olds has the highest likelihood of being enrolled in private schools, with 36 (100.0% in the age bracket) enrolled. Conversely, the age group of 15 to 17 year olds has the lowest likelihood of being enrolled in a private school, with 331 (91.7% in the age bracket) attending a public institution.
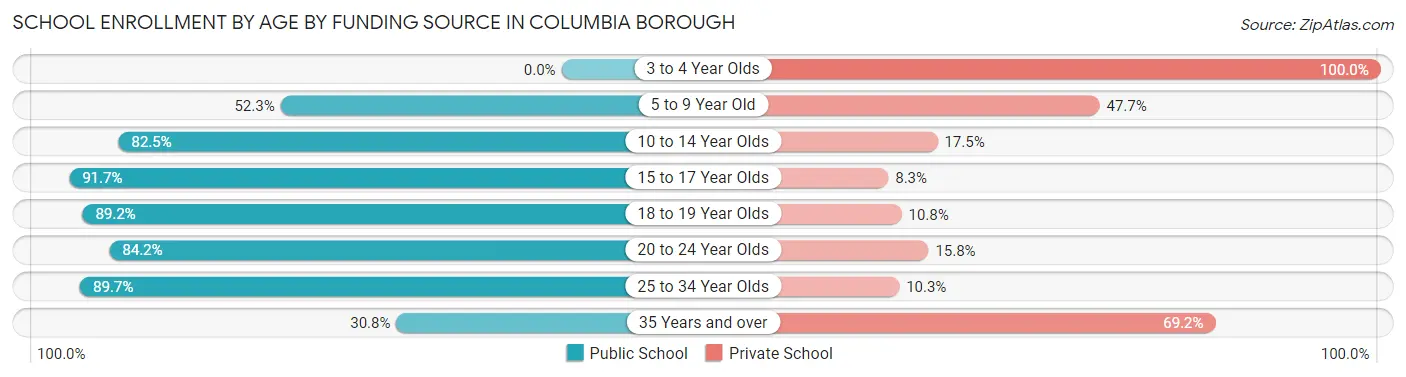
| Age Bracket | Public School | Private School |
| 3 to 4 Year Olds | 0 (0.0%) | 36 (100.0%) |
| 5 to 9 Year Old | 246 (52.3%) | 224 (47.7%) |
| 10 to 14 Year Olds | 392 (82.5%) | 83 (17.5%) |
| 15 to 17 Year Olds | 331 (91.7%) | 30 (8.3%) |
| 18 to 19 Year Olds | 91 (89.2%) | 11 (10.8%) |
| 20 to 24 Year Olds | 48 (84.2%) | 9 (15.8%) |
| 25 to 34 Year Olds | 78 (89.7%) | 9 (10.3%) |
| 35 Years and over | 20 (30.8%) | 45 (69.2%) |
| Total | 1,207 (73.0%) | 446 (27.0%) |
Educational Attainment by Field of Study in Columbia borough
Education (264 | 18.8%), business (259 | 18.4%), science & technology (142 | 10.1%), arts & humanities (129 | 9.2%), and liberal arts & history (109 | 7.7%) are the most common fields of study among 1,407 individuals in Columbia borough who have obtained a bachelor's degree or higher.
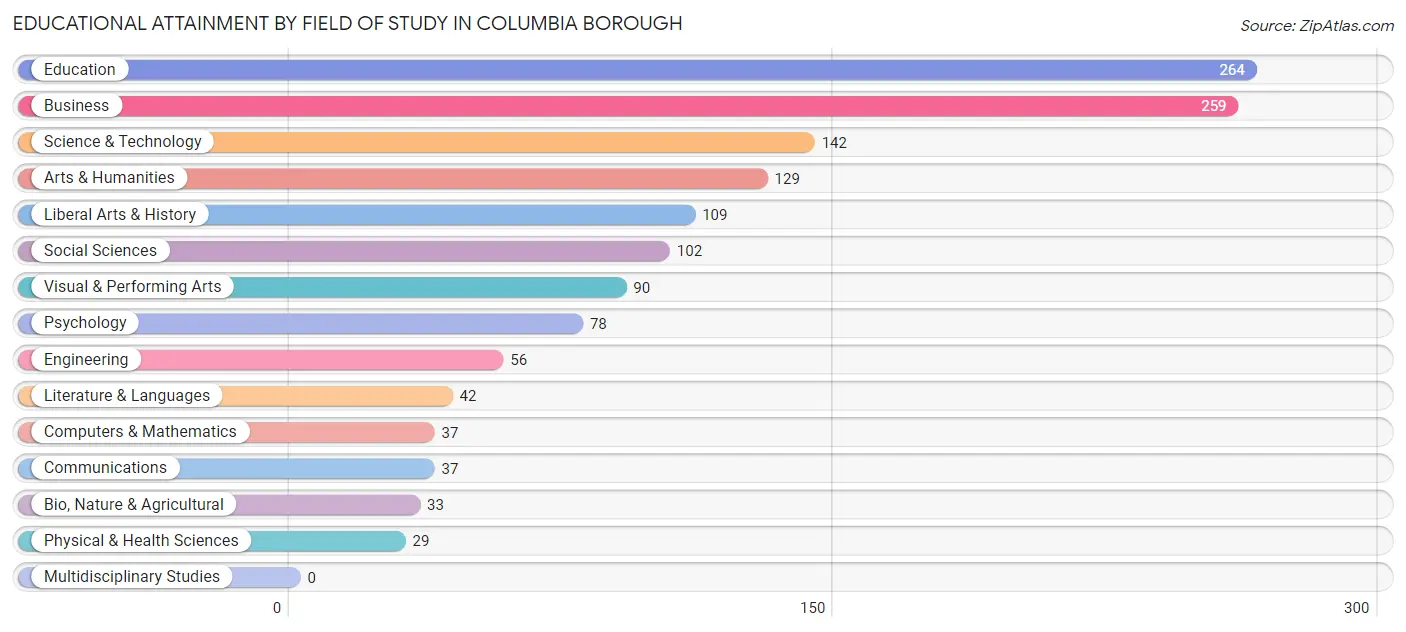
| Field of Study | # Graduates | % Graduates |
| Computers & Mathematics | 37 | 2.6% |
| Bio, Nature & Agricultural | 33 | 2.4% |
| Physical & Health Sciences | 29 | 2.1% |
| Psychology | 78 | 5.5% |
| Social Sciences | 102 | 7.2% |
| Engineering | 56 | 4.0% |
| Multidisciplinary Studies | 0 | 0.0% |
| Science & Technology | 142 | 10.1% |
| Business | 259 | 18.4% |
| Education | 264 | 18.8% |
| Literature & Languages | 42 | 3.0% |
| Liberal Arts & History | 109 | 7.7% |
| Visual & Performing Arts | 90 | 6.4% |
| Communications | 37 | 2.6% |
| Arts & Humanities | 129 | 9.2% |
| Total | 1,407 | 100.0% |
Transportation & Commute in Columbia borough
Vehicle Availability by Sex in Columbia borough
The most prevalent vehicle ownership categories in Columbia borough are males with 2 vehicles (1,013, accounting for 37.0%) and females with 2 vehicles (915, making up 44.8%).
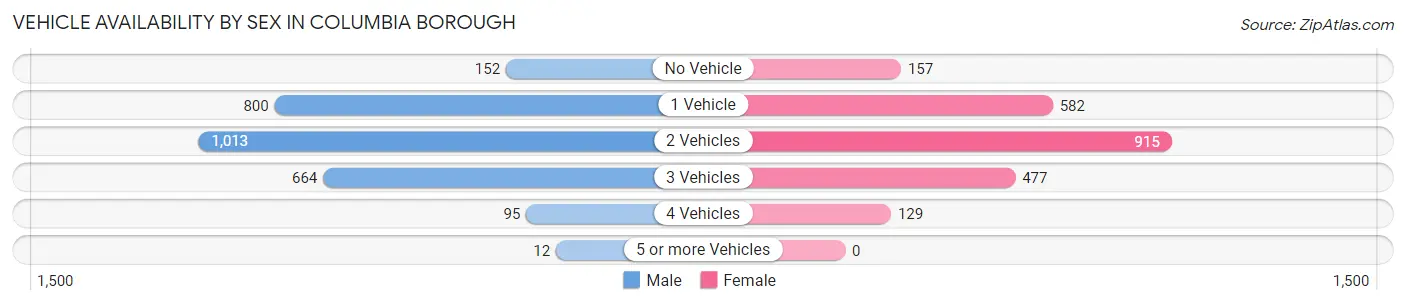
| Vehicles Available | Male | Female |
| No Vehicle | 152 (5.6%) | 157 (7.0%) |
| 1 Vehicle | 800 (29.2%) | 582 (25.8%) |
| 2 Vehicles | 1,013 (37.0%) | 915 (40.5%) |
| 3 Vehicles | 664 (24.3%) | 477 (21.1%) |
| 4 Vehicles | 95 (3.5%) | 129 (5.7%) |
| 5 or more Vehicles | 12 (0.4%) | 0 (0.0%) |
| Total | 2,736 (100.0%) | 2,260 (100.0%) |
Commute Time in Columbia borough
The most frequently occuring commute durations in Columbia borough are 20 to 24 minutes (833 commuters, 17.4%), 15 to 19 minutes (744 commuters, 15.5%), and 25 to 29 minutes (613 commuters, 12.8%).
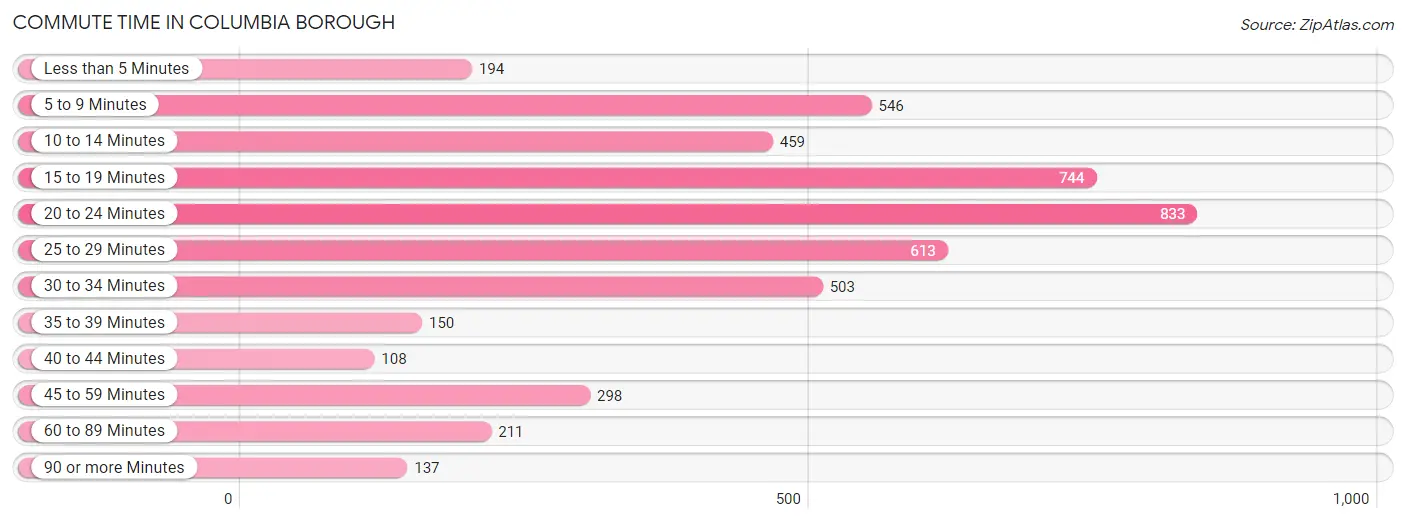
| Commute Time | # Commuters | % Commuters |
| Less than 5 Minutes | 194 | 4.1% |
| 5 to 9 Minutes | 546 | 11.4% |
| 10 to 14 Minutes | 459 | 9.6% |
| 15 to 19 Minutes | 744 | 15.5% |
| 20 to 24 Minutes | 833 | 17.4% |
| 25 to 29 Minutes | 613 | 12.8% |
| 30 to 34 Minutes | 503 | 10.5% |
| 35 to 39 Minutes | 150 | 3.1% |
| 40 to 44 Minutes | 108 | 2.2% |
| 45 to 59 Minutes | 298 | 6.2% |
| 60 to 89 Minutes | 211 | 4.4% |
| 90 or more Minutes | 137 | 2.9% |
Commute Time by Sex in Columbia borough
The most common commute times in Columbia borough are 20 to 24 minutes (536 commuters, 20.5%) for males and 15 to 19 minutes (317 commuters, 14.5%) for females.
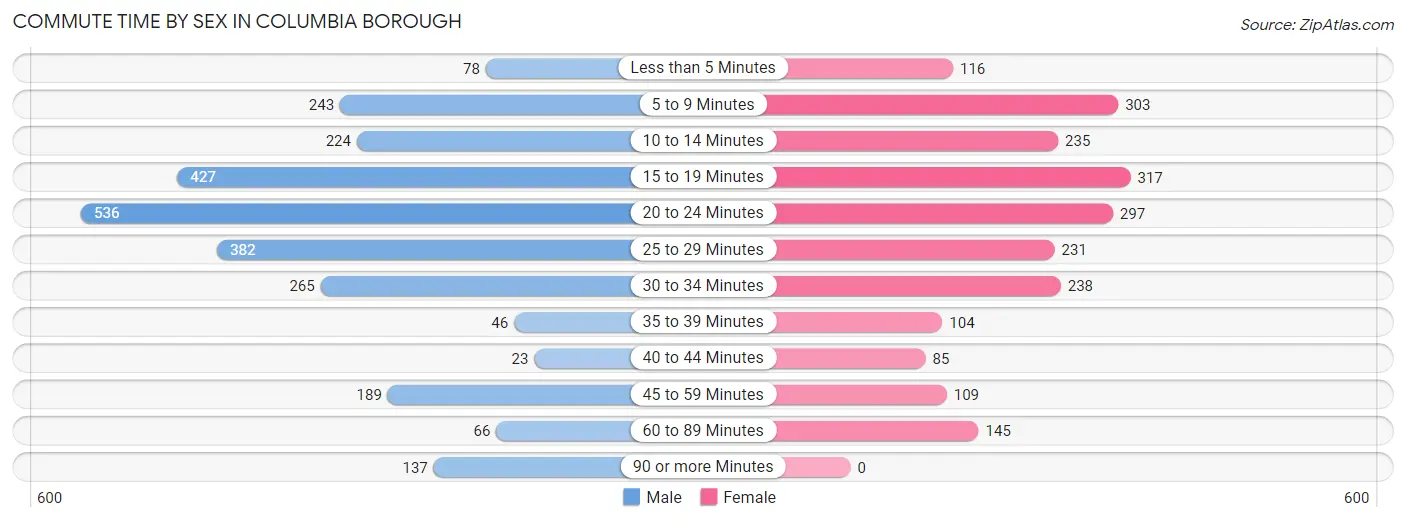
| Commute Time | Male | Female |
| Less than 5 Minutes | 78 (3.0%) | 116 (5.3%) |
| 5 to 9 Minutes | 243 (9.3%) | 303 (13.9%) |
| 10 to 14 Minutes | 224 (8.6%) | 235 (10.8%) |
| 15 to 19 Minutes | 427 (16.3%) | 317 (14.5%) |
| 20 to 24 Minutes | 536 (20.5%) | 297 (13.6%) |
| 25 to 29 Minutes | 382 (14.6%) | 231 (10.6%) |
| 30 to 34 Minutes | 265 (10.1%) | 238 (10.9%) |
| 35 to 39 Minutes | 46 (1.8%) | 104 (4.8%) |
| 40 to 44 Minutes | 23 (0.9%) | 85 (3.9%) |
| 45 to 59 Minutes | 189 (7.2%) | 109 (5.0%) |
| 60 to 89 Minutes | 66 (2.5%) | 145 (6.7%) |
| 90 or more Minutes | 137 (5.2%) | 0 (0.0%) |
Time of Departure to Work by Sex in Columbia borough
The most frequent times of departure to work in Columbia borough are 6:00 AM to 6:29 AM (315, 12.0%) for males and 7:00 AM to 7:29 AM (364, 16.7%) for females.
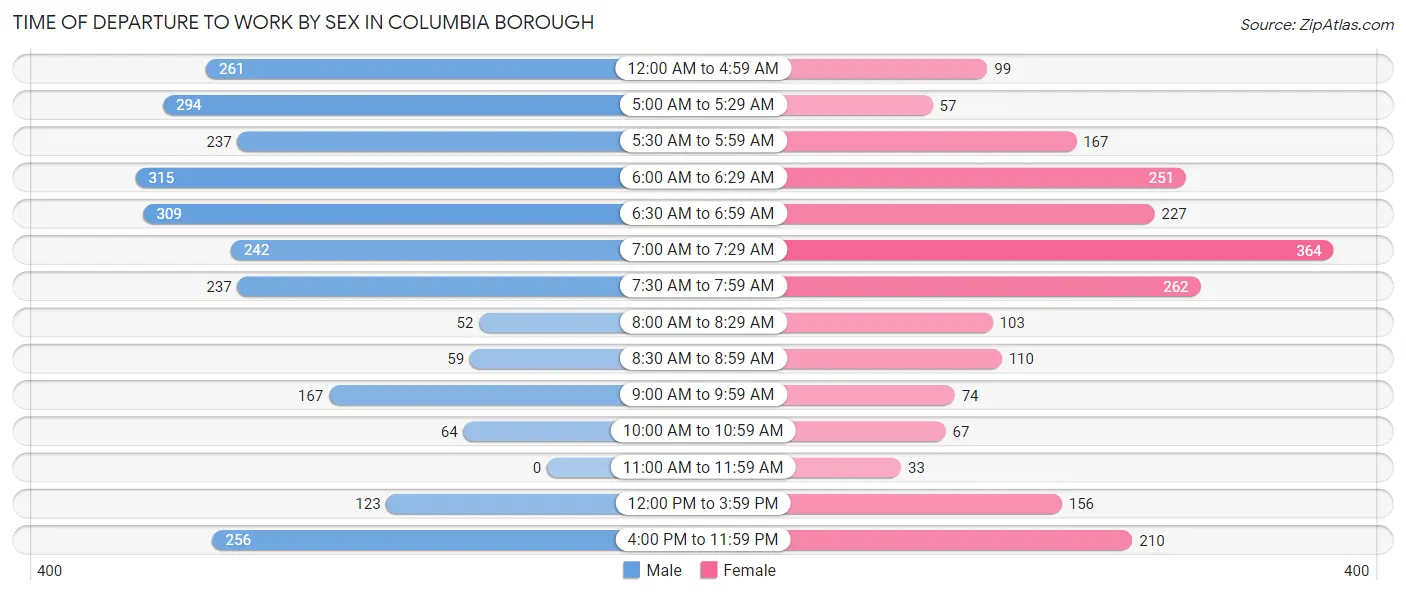
| Time of Departure | Male | Female |
| 12:00 AM to 4:59 AM | 261 (10.0%) | 99 (4.5%) |
| 5:00 AM to 5:29 AM | 294 (11.2%) | 57 (2.6%) |
| 5:30 AM to 5:59 AM | 237 (9.1%) | 167 (7.7%) |
| 6:00 AM to 6:29 AM | 315 (12.0%) | 251 (11.5%) |
| 6:30 AM to 6:59 AM | 309 (11.8%) | 227 (10.4%) |
| 7:00 AM to 7:29 AM | 242 (9.2%) | 364 (16.7%) |
| 7:30 AM to 7:59 AM | 237 (9.1%) | 262 (12.0%) |
| 8:00 AM to 8:29 AM | 52 (2.0%) | 103 (4.7%) |
| 8:30 AM to 8:59 AM | 59 (2.3%) | 110 (5.1%) |
| 9:00 AM to 9:59 AM | 167 (6.4%) | 74 (3.4%) |
| 10:00 AM to 10:59 AM | 64 (2.5%) | 67 (3.1%) |
| 11:00 AM to 11:59 AM | 0 (0.0%) | 33 (1.5%) |
| 12:00 PM to 3:59 PM | 123 (4.7%) | 156 (7.2%) |
| 4:00 PM to 11:59 PM | 256 (9.8%) | 210 (9.6%) |
| Total | 2,616 (100.0%) | 2,180 (100.0%) |
Housing Occupancy in Columbia borough
Occupancy by Ownership in Columbia borough
Of the total 4,515 dwellings in Columbia borough, owner-occupied units account for 2,300 (50.9%), while renter-occupied units make up 2,215 (49.1%).
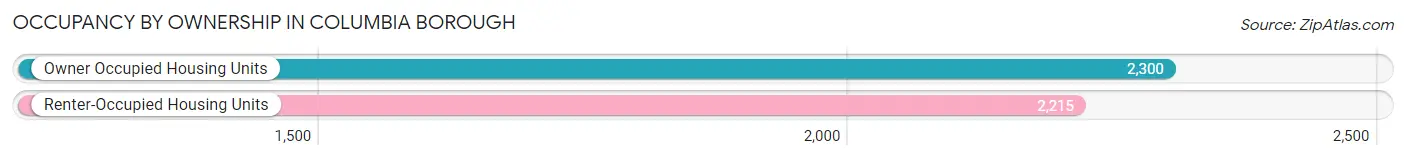
| Occupancy | # Housing Units | % Housing Units |
| Owner Occupied Housing Units | 2,300 | 50.9% |
| Renter-Occupied Housing Units | 2,215 | 49.1% |
| Total Occupied Housing Units | 4,515 | 100.0% |
Occupancy by Household Size in Columbia borough
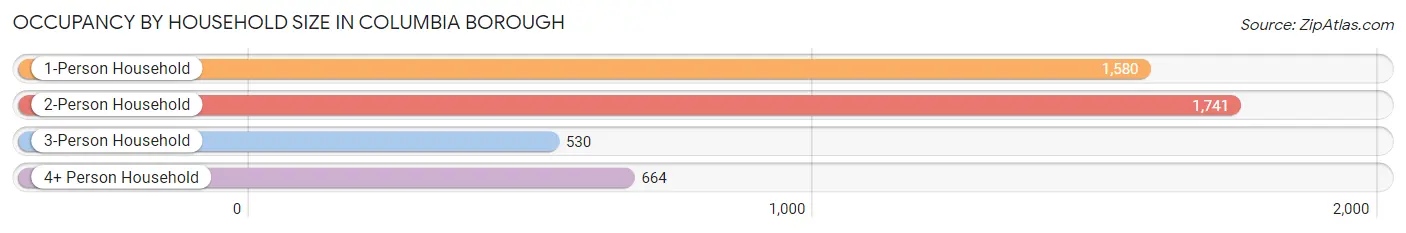
| Household Size | # Housing Units | % Housing Units |
| 1-Person Household | 1,580 | 35.0% |
| 2-Person Household | 1,741 | 38.6% |
| 3-Person Household | 530 | 11.7% |
| 4+ Person Household | 664 | 14.7% |
| Total Housing Units | 4,515 | 100.0% |
Occupancy by Ownership by Household Size in Columbia borough
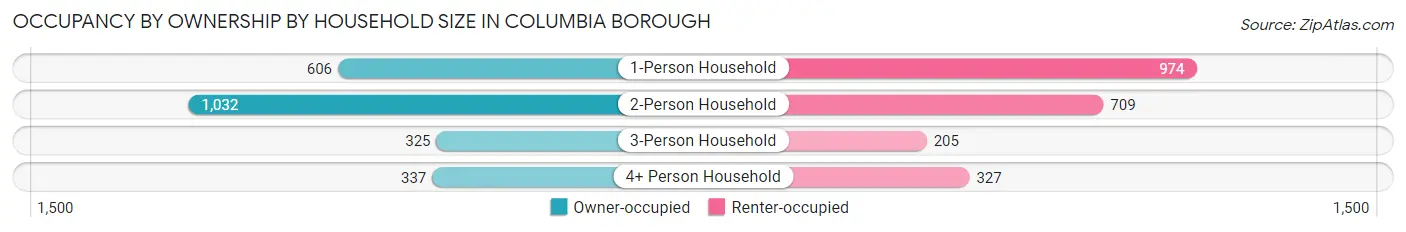
| Household Size | Owner-occupied | Renter-occupied |
| 1-Person Household | 606 (38.4%) | 974 (61.7%) |
| 2-Person Household | 1,032 (59.3%) | 709 (40.7%) |
| 3-Person Household | 325 (61.3%) | 205 (38.7%) |
| 4+ Person Household | 337 (50.7%) | 327 (49.2%) |
| Total Housing Units | 2,300 (50.9%) | 2,215 (49.1%) |
Occupancy by Educational Attainment in Columbia borough
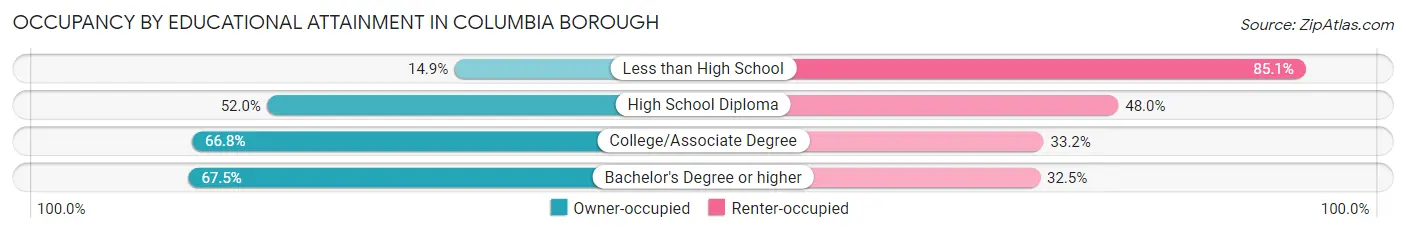
| Household Size | Owner-occupied | Renter-occupied |
| Less than High School | 126 (14.9%) | 722 (85.1%) |
| High School Diploma | 988 (52.0%) | 912 (48.0%) |
| College/Associate Degree | 654 (66.8%) | 325 (33.2%) |
| Bachelor's Degree or higher | 532 (67.5%) | 256 (32.5%) |
Occupancy by Age of Householder in Columbia borough
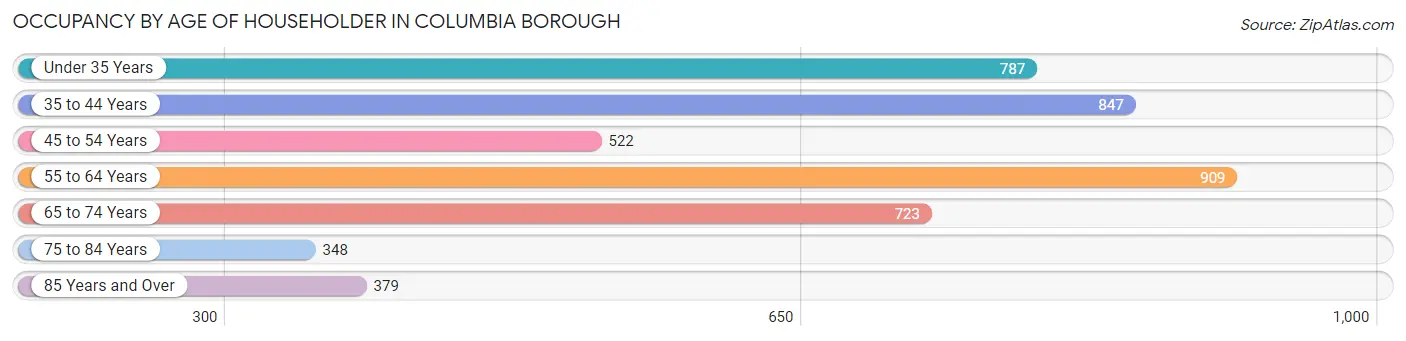
| Age Bracket | # Households | % Households |
| Under 35 Years | 787 | 17.4% |
| 35 to 44 Years | 847 | 18.8% |
| 45 to 54 Years | 522 | 11.6% |
| 55 to 64 Years | 909 | 20.1% |
| 65 to 74 Years | 723 | 16.0% |
| 75 to 84 Years | 348 | 7.7% |
| 85 Years and Over | 379 | 8.4% |
| Total | 4,515 | 100.0% |
Housing Finances in Columbia borough
Median Income by Occupancy in Columbia borough
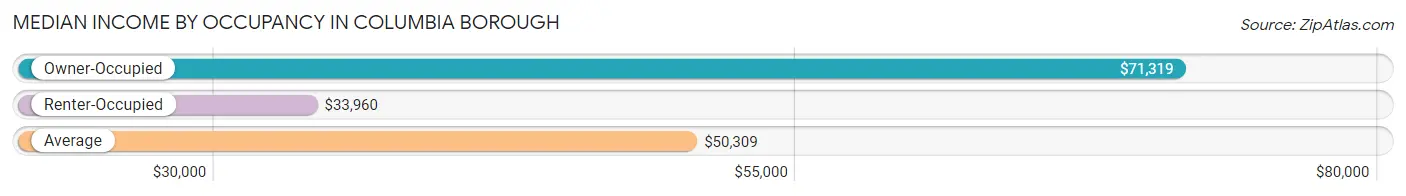
| Occupancy Type | # Households | Median Income |
| Owner-Occupied | 2,300 (50.9%) | $71,319 |
| Renter-Occupied | 2,215 (49.1%) | $33,960 |
| Average | 4,515 (100.0%) | $50,309 |
Occupancy by Householder Income Bracket in Columbia borough
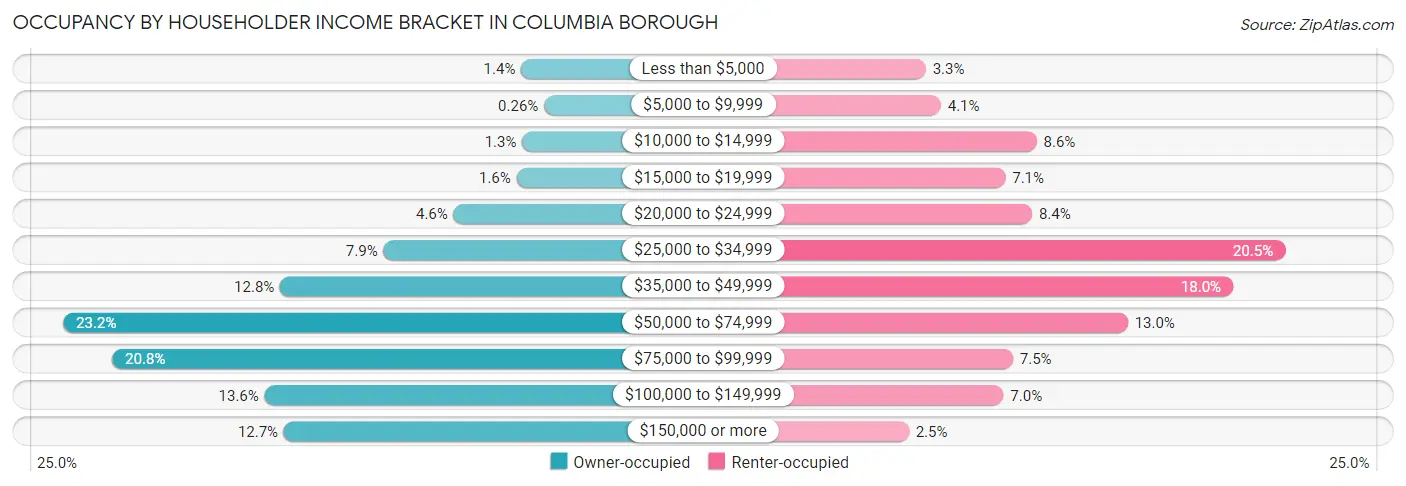
| Income Bracket | Owner-occupied | Renter-occupied |
| Less than $5,000 | 31 (1.3%) | 74 (3.3%) |
| $5,000 to $9,999 | 6 (0.3%) | 90 (4.1%) |
| $10,000 to $14,999 | 30 (1.3%) | 191 (8.6%) |
| $15,000 to $19,999 | 36 (1.6%) | 158 (7.1%) |
| $20,000 to $24,999 | 105 (4.6%) | 186 (8.4%) |
| $25,000 to $34,999 | 182 (7.9%) | 453 (20.4%) |
| $35,000 to $49,999 | 295 (12.8%) | 398 (18.0%) |
| $50,000 to $74,999 | 533 (23.2%) | 287 (13.0%) |
| $75,000 to $99,999 | 479 (20.8%) | 166 (7.5%) |
| $100,000 to $149,999 | 312 (13.6%) | 156 (7.0%) |
| $150,000 or more | 291 (12.7%) | 56 (2.5%) |
| Total | 2,300 (100.0%) | 2,215 (100.0%) |
Monthly Housing Cost Tiers in Columbia borough
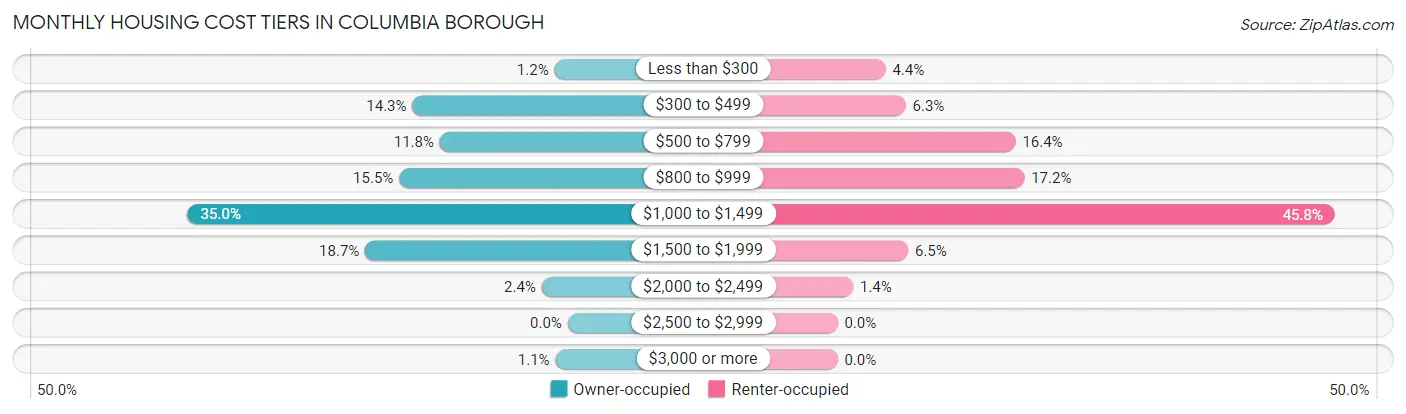
| Monthly Cost | Owner-occupied | Renter-occupied |
| Less than $300 | 28 (1.2%) | 98 (4.4%) |
| $300 to $499 | 329 (14.3%) | 139 (6.3%) |
| $500 to $799 | 271 (11.8%) | 363 (16.4%) |
| $800 to $999 | 357 (15.5%) | 381 (17.2%) |
| $1,000 to $1,499 | 805 (35.0%) | 1,014 (45.8%) |
| $1,500 to $1,999 | 429 (18.6%) | 144 (6.5%) |
| $2,000 to $2,499 | 55 (2.4%) | 32 (1.4%) |
| $2,500 to $2,999 | 0 (0.0%) | 0 (0.0%) |
| $3,000 or more | 26 (1.1%) | 0 (0.0%) |
| Total | 2,300 (100.0%) | 2,215 (100.0%) |
Physical Housing Characteristics in Columbia borough
Housing Structures in Columbia borough
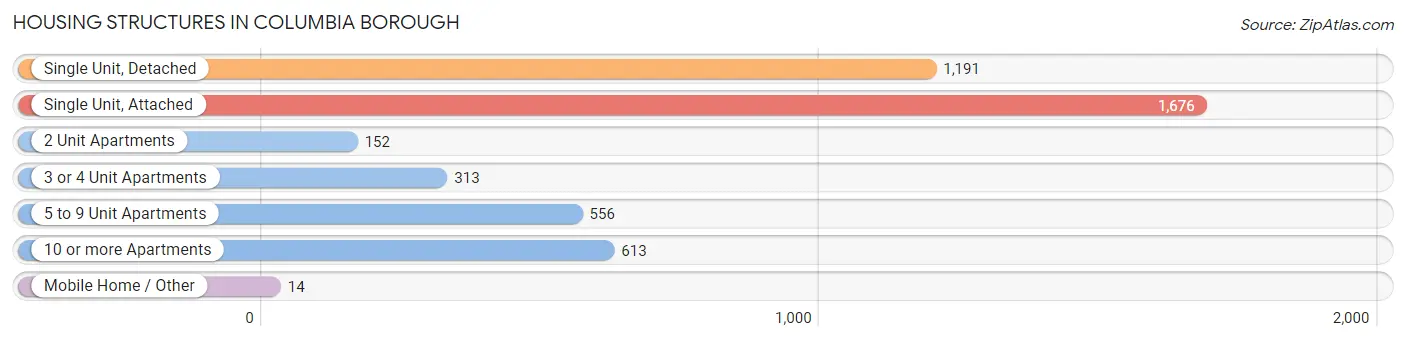
| Structure Type | # Housing Units | % Housing Units |
| Single Unit, Detached | 1,191 | 26.4% |
| Single Unit, Attached | 1,676 | 37.1% |
| 2 Unit Apartments | 152 | 3.4% |
| 3 or 4 Unit Apartments | 313 | 6.9% |
| 5 to 9 Unit Apartments | 556 | 12.3% |
| 10 or more Apartments | 613 | 13.6% |
| Mobile Home / Other | 14 | 0.3% |
| Total | 4,515 | 100.0% |
Housing Structures by Occupancy in Columbia borough
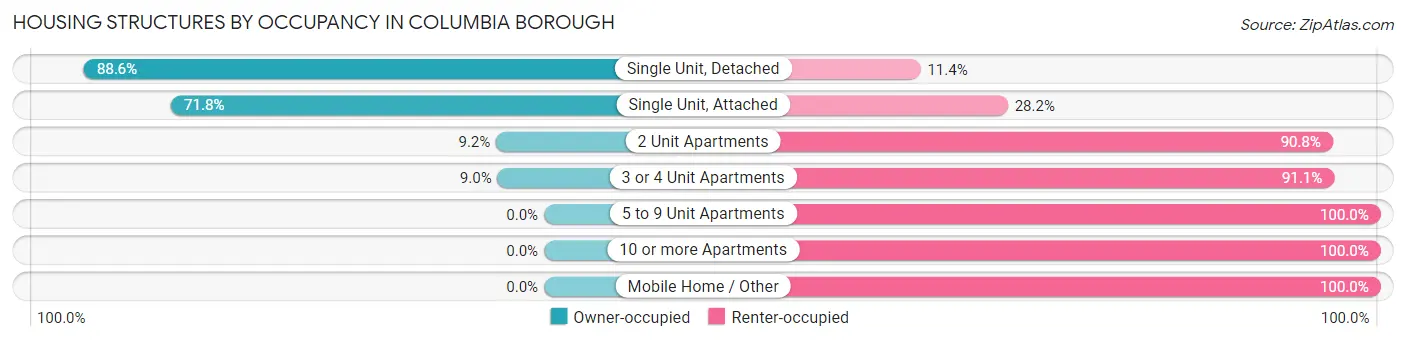
| Structure Type | Owner-occupied | Renter-occupied |
| Single Unit, Detached | 1,055 (88.6%) | 136 (11.4%) |
| Single Unit, Attached | 1,203 (71.8%) | 473 (28.2%) |
| 2 Unit Apartments | 14 (9.2%) | 138 (90.8%) |
| 3 or 4 Unit Apartments | 28 (8.9%) | 285 (91.0%) |
| 5 to 9 Unit Apartments | 0 (0.0%) | 556 (100.0%) |
| 10 or more Apartments | 0 (0.0%) | 613 (100.0%) |
| Mobile Home / Other | 0 (0.0%) | 14 (100.0%) |
| Total | 2,300 (50.9%) | 2,215 (49.1%) |
Housing Structures by Number of Rooms in Columbia borough
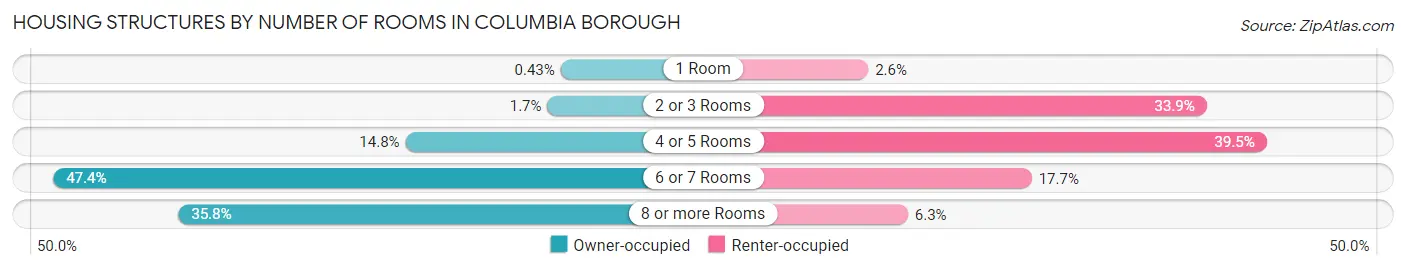
| Number of Rooms | Owner-occupied | Renter-occupied |
| 1 Room | 10 (0.4%) | 58 (2.6%) |
| 2 or 3 Rooms | 38 (1.7%) | 751 (33.9%) |
| 4 or 5 Rooms | 340 (14.8%) | 874 (39.5%) |
| 6 or 7 Rooms | 1,089 (47.3%) | 393 (17.7%) |
| 8 or more Rooms | 823 (35.8%) | 139 (6.3%) |
| Total | 2,300 (100.0%) | 2,215 (100.0%) |
Housing Structure by Heating Type in Columbia borough
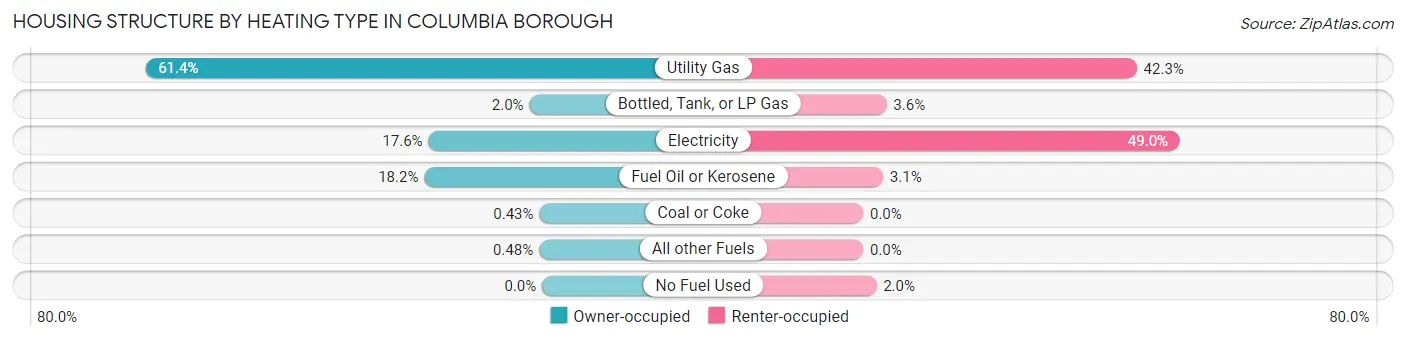
| Heating Type | Owner-occupied | Renter-occupied |
| Utility Gas | 1,411 (61.4%) | 937 (42.3%) |
| Bottled, Tank, or LP Gas | 45 (2.0%) | 80 (3.6%) |
| Electricity | 404 (17.6%) | 1,085 (49.0%) |
| Fuel Oil or Kerosene | 419 (18.2%) | 68 (3.1%) |
| Coal or Coke | 10 (0.4%) | 0 (0.0%) |
| All other Fuels | 11 (0.5%) | 0 (0.0%) |
| No Fuel Used | 0 (0.0%) | 45 (2.0%) |
| Total | 2,300 (100.0%) | 2,215 (100.0%) |
Household Vehicle Usage in Columbia borough
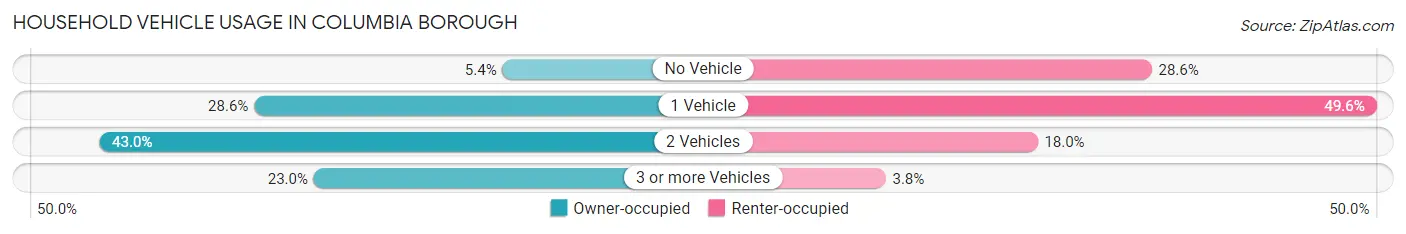
| Vehicles per Household | Owner-occupied | Renter-occupied |
| No Vehicle | 124 (5.4%) | 634 (28.6%) |
| 1 Vehicle | 657 (28.6%) | 1,099 (49.6%) |
| 2 Vehicles | 990 (43.0%) | 398 (18.0%) |
| 3 or more Vehicles | 529 (23.0%) | 84 (3.8%) |
| Total | 2,300 (100.0%) | 2,215 (100.0%) |
Real Estate & Mortgages in Columbia borough
Real Estate and Mortgage Overview in Columbia borough
| Characteristic | Without Mortgage | With Mortgage |
| Housing Units | 849 | 1,451 |
| Median Property Value | $148,000 | $157,200 |
| Median Household Income | $60,859 | $174 |
| Monthly Housing Costs | $581 | $26 |
| Real Estate Taxes | $3,184 | $0 |
Property Value by Mortgage Status in Columbia borough
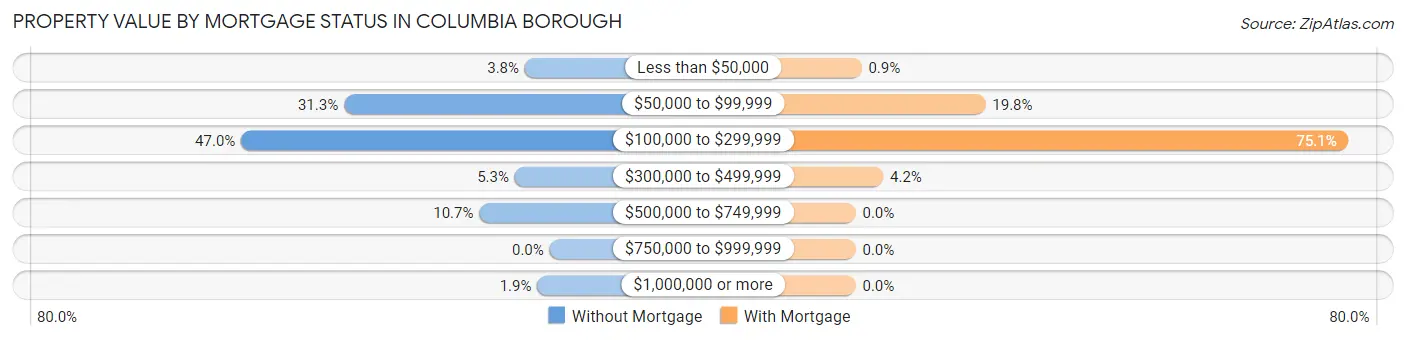
| Property Value | Without Mortgage | With Mortgage |
| Less than $50,000 | 32 (3.8%) | 13 (0.9%) |
| $50,000 to $99,999 | 266 (31.3%) | 287 (19.8%) |
| $100,000 to $299,999 | 399 (47.0%) | 1,090 (75.1%) |
| $300,000 to $499,999 | 45 (5.3%) | 61 (4.2%) |
| $500,000 to $749,999 | 91 (10.7%) | 0 (0.0%) |
| $750,000 to $999,999 | 0 (0.0%) | 0 (0.0%) |
| $1,000,000 or more | 16 (1.9%) | 0 (0.0%) |
| Total | 849 (100.0%) | 1,451 (100.0%) |
Household Income by Mortgage Status in Columbia borough
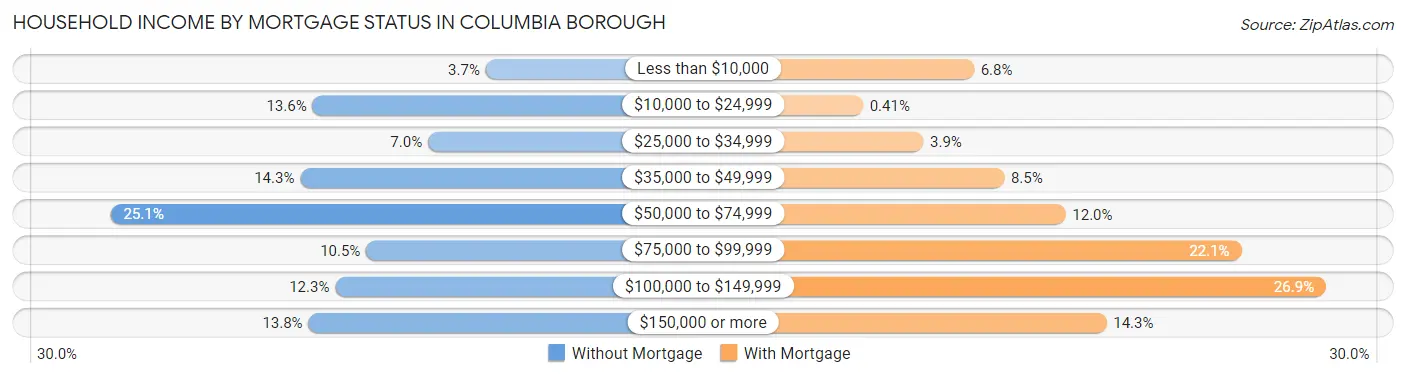
| Household Income | Without Mortgage | With Mortgage |
| Less than $10,000 | 31 (3.6%) | 98 (6.8%) |
| $10,000 to $24,999 | 115 (13.6%) | 6 (0.4%) |
| $25,000 to $34,999 | 59 (7.0%) | 56 (3.9%) |
| $35,000 to $49,999 | 121 (14.2%) | 123 (8.5%) |
| $50,000 to $74,999 | 213 (25.1%) | 174 (12.0%) |
| $75,000 to $99,999 | 89 (10.5%) | 320 (22.1%) |
| $100,000 to $149,999 | 104 (12.2%) | 390 (26.9%) |
| $150,000 or more | 117 (13.8%) | 208 (14.3%) |
| Total | 849 (100.0%) | 1,451 (100.0%) |
Property Value to Household Income Ratio in Columbia borough
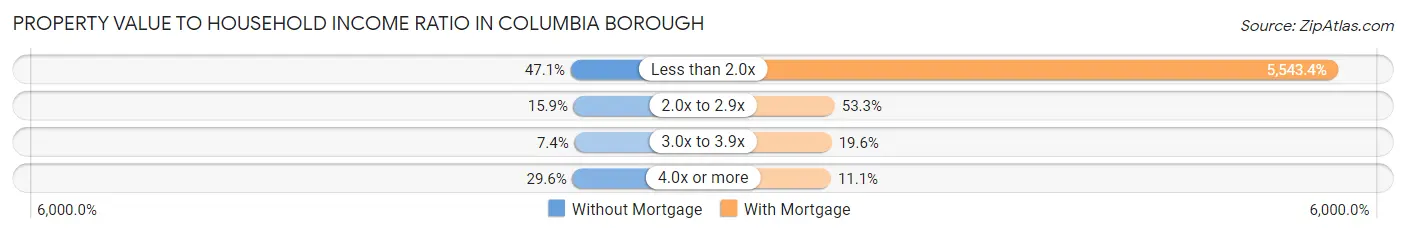
| Value-to-Income Ratio | Without Mortgage | With Mortgage |
| Less than 2.0x | 400 (47.1%) | 80,434 (5,543.4%) |
| 2.0x to 2.9x | 135 (15.9%) | 774 (53.3%) |
| 3.0x to 3.9x | 63 (7.4%) | 284 (19.6%) |
| 4.0x or more | 251 (29.6%) | 161 (11.1%) |
| Total | 849 (100.0%) | 1,451 (100.0%) |
Real Estate Taxes by Mortgage Status in Columbia borough
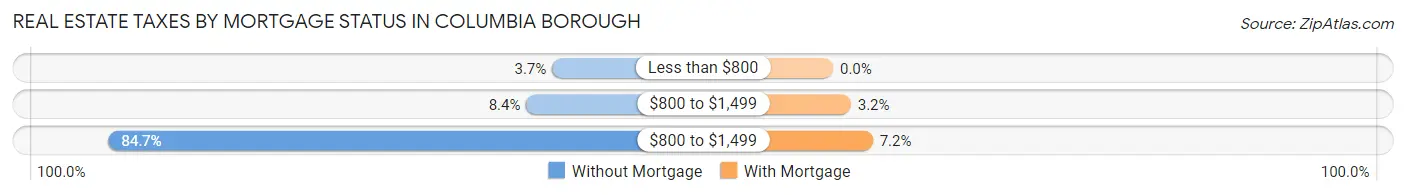
| Property Taxes | Without Mortgage | With Mortgage |
| Less than $800 | 31 (3.6%) | 0 (0.0%) |
| $800 to $1,499 | 71 (8.4%) | 47 (3.2%) |
| $800 to $1,499 | 719 (84.7%) | 105 (7.2%) |
| Total | 849 (100.0%) | 1,451 (100.0%) |
Health & Disability in Columbia borough
Health Insurance Coverage by Age in Columbia borough
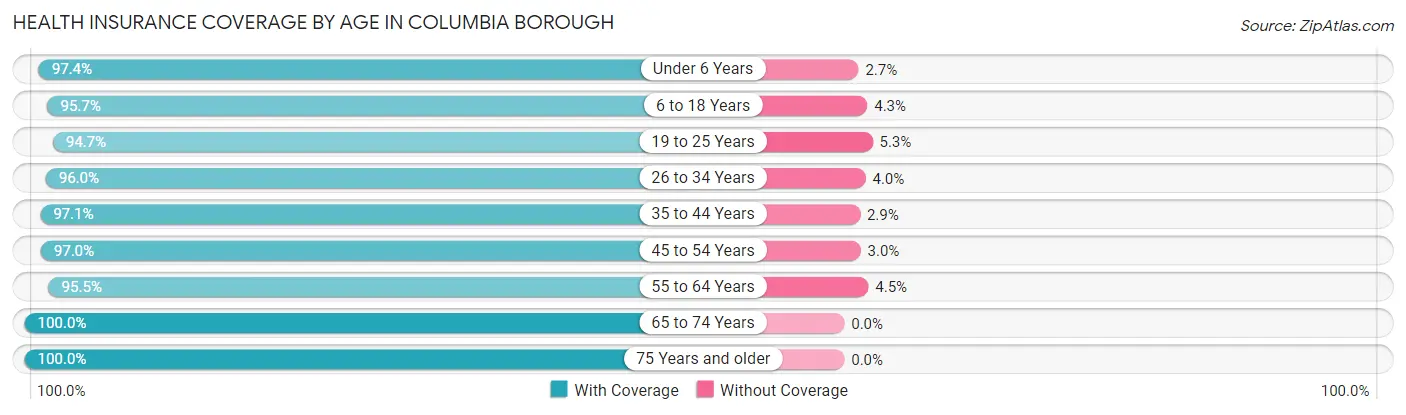
| Age Bracket | With Coverage | Without Coverage |
| Under 6 Years | 404 (97.4%) | 11 (2.6%) |
| 6 to 18 Years | 1,384 (95.7%) | 62 (4.3%) |
| 19 to 25 Years | 900 (94.7%) | 50 (5.3%) |
| 26 to 34 Years | 1,187 (96.0%) | 49 (4.0%) |
| 35 to 44 Years | 1,298 (97.1%) | 39 (2.9%) |
| 45 to 54 Years | 1,051 (97.0%) | 33 (3.0%) |
| 55 to 64 Years | 1,448 (95.5%) | 68 (4.5%) |
| 65 to 74 Years | 1,159 (100.0%) | 0 (0.0%) |
| 75 Years and older | 881 (100.0%) | 0 (0.0%) |
| Total | 9,712 (96.9%) | 312 (3.1%) |
Health Insurance Coverage by Citizenship Status in Columbia borough
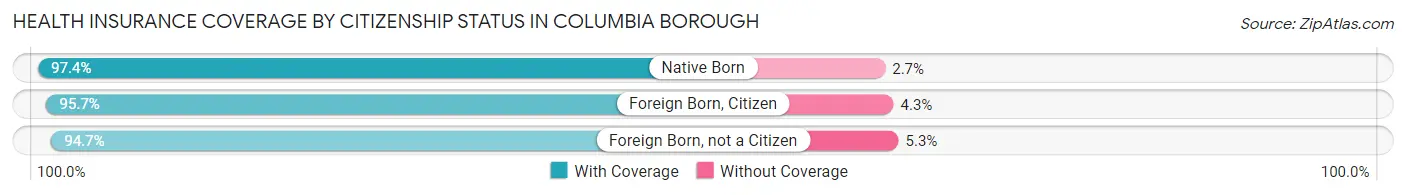
| Citizenship Status | With Coverage | Without Coverage |
| Native Born | 404 (97.4%) | 11 (2.6%) |
| Foreign Born, Citizen | 1,384 (95.7%) | 62 (4.3%) |
| Foreign Born, not a Citizen | 900 (94.7%) | 50 (5.3%) |
Health Insurance Coverage by Household Income in Columbia borough
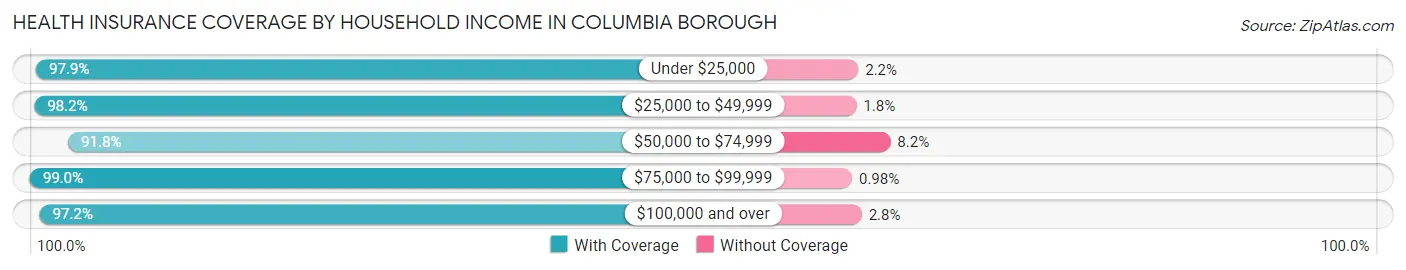
| Household Income | With Coverage | Without Coverage |
| Under $25,000 | 1,364 (97.9%) | 30 (2.1%) |
| $25,000 to $49,999 | 2,440 (98.2%) | 45 (1.8%) |
| $50,000 to $74,999 | 1,743 (91.8%) | 155 (8.2%) |
| $75,000 to $99,999 | 1,925 (99.0%) | 19 (1.0%) |
| $100,000 and over | 2,188 (97.2%) | 63 (2.8%) |
Public vs Private Health Insurance Coverage by Age in Columbia borough
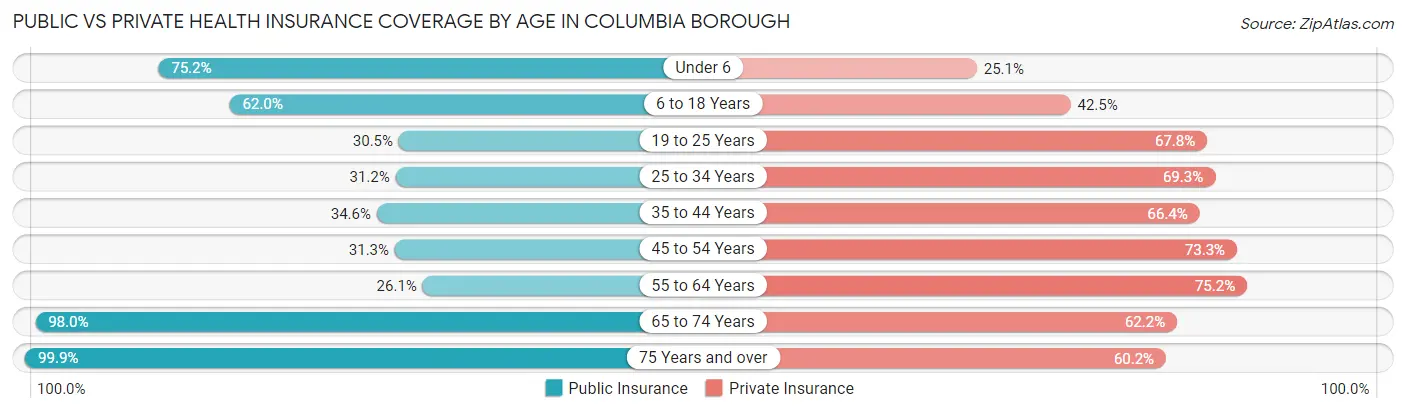
| Age Bracket | Public Insurance | Private Insurance |
| Under 6 | 312 (75.2%) | 104 (25.1%) |
| 6 to 18 Years | 896 (62.0%) | 614 (42.5%) |
| 19 to 25 Years | 290 (30.5%) | 644 (67.8%) |
| 25 to 34 Years | 385 (31.1%) | 856 (69.3%) |
| 35 to 44 Years | 463 (34.6%) | 888 (66.4%) |
| 45 to 54 Years | 339 (31.3%) | 795 (73.3%) |
| 55 to 64 Years | 396 (26.1%) | 1,140 (75.2%) |
| 65 to 74 Years | 1,136 (98.0%) | 721 (62.2%) |
| 75 Years and over | 880 (99.9%) | 530 (60.2%) |
| Total | 5,097 (50.8%) | 6,292 (62.8%) |
Disability Status by Sex by Age in Columbia borough
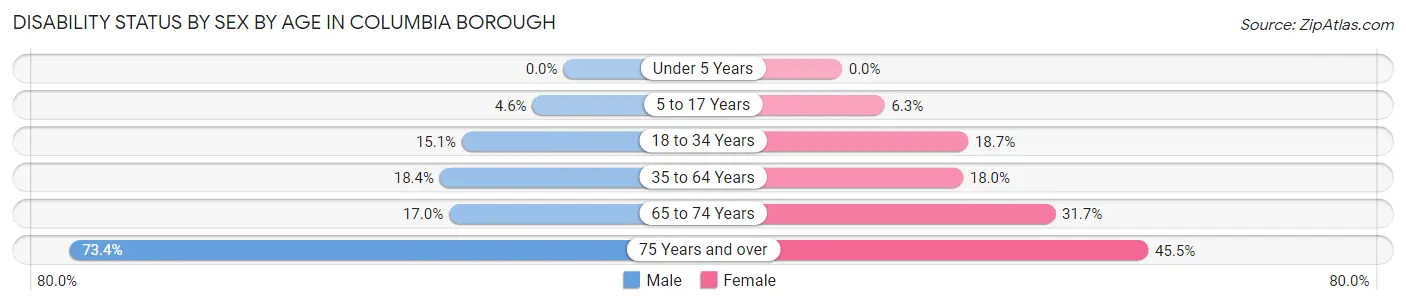
| Age Bracket | Male | Female |
| Under 5 Years | 0 (0.0%) | 0 (0.0%) |
| 5 to 17 Years | 35 (4.6%) | 36 (6.3%) |
| 18 to 34 Years | 190 (15.1%) | 208 (18.7%) |
| 35 to 64 Years | 365 (18.3%) | 350 (18.0%) |
| 65 to 74 Years | 119 (17.0%) | 145 (31.7%) |
| 75 Years and over | 248 (73.4%) | 247 (45.5%) |
Disability Class by Sex by Age in Columbia borough
Disability Class: Hearing Difficulty
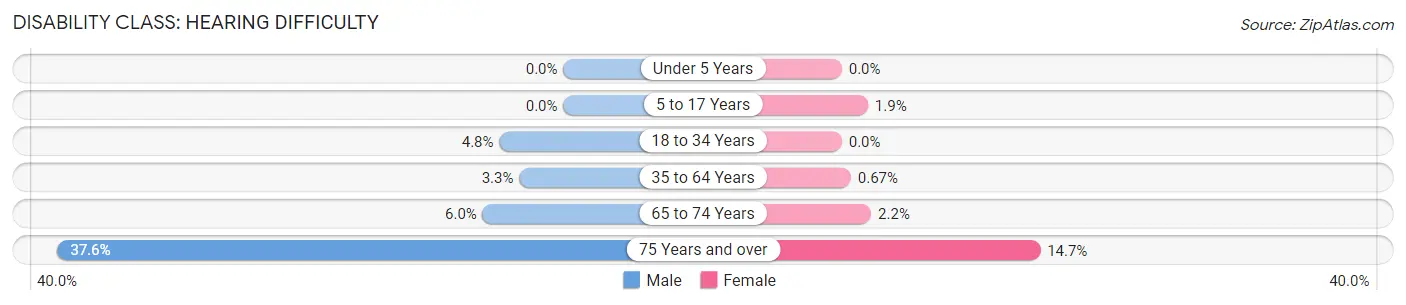
| Age Bracket | Male | Female |
| Under 5 Years | 0 (0.0%) | 0 (0.0%) |
| 5 to 17 Years | 0 (0.0%) | 11 (1.9%) |
| 18 to 34 Years | 60 (4.8%) | 0 (0.0%) |
| 35 to 64 Years | 65 (3.3%) | 13 (0.7%) |
| 65 to 74 Years | 42 (6.0%) | 10 (2.2%) |
| 75 Years and over | 127 (37.6%) | 80 (14.7%) |
Disability Class: Vision Difficulty
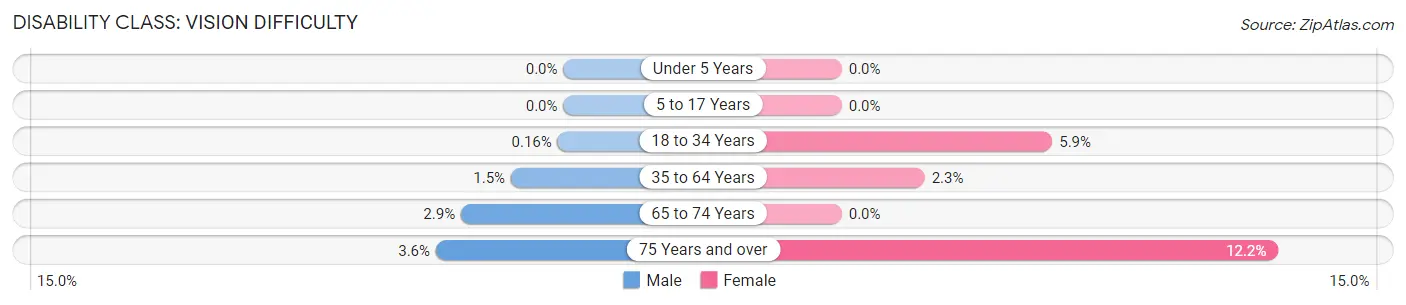
| Age Bracket | Male | Female |
| Under 5 Years | 0 (0.0%) | 0 (0.0%) |
| 5 to 17 Years | 0 (0.0%) | 0 (0.0%) |
| 18 to 34 Years | 2 (0.2%) | 65 (5.9%) |
| 35 to 64 Years | 29 (1.5%) | 45 (2.3%) |
| 65 to 74 Years | 20 (2.9%) | 0 (0.0%) |
| 75 Years and over | 12 (3.5%) | 66 (12.1%) |
Disability Class: Cognitive Difficulty
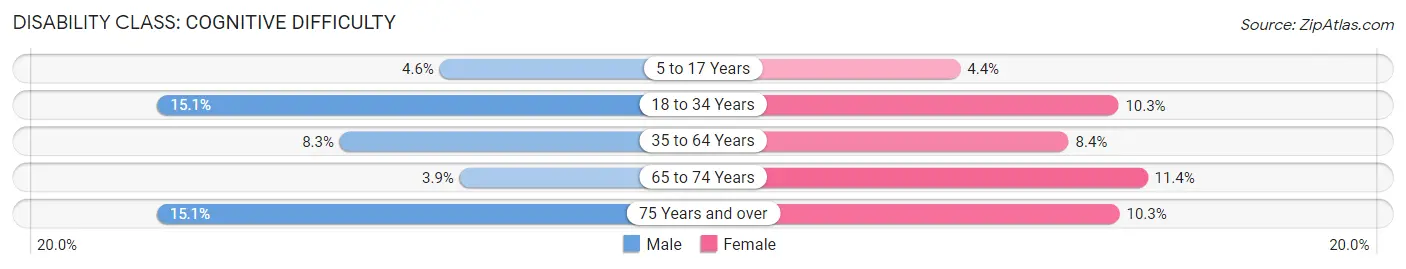
| Age Bracket | Male | Female |
| 5 to 17 Years | 35 (4.6%) | 25 (4.4%) |
| 18 to 34 Years | 190 (15.1%) | 114 (10.3%) |
| 35 to 64 Years | 165 (8.3%) | 164 (8.4%) |
| 65 to 74 Years | 27 (3.8%) | 52 (11.4%) |
| 75 Years and over | 51 (15.1%) | 56 (10.3%) |
Disability Class: Ambulatory Difficulty
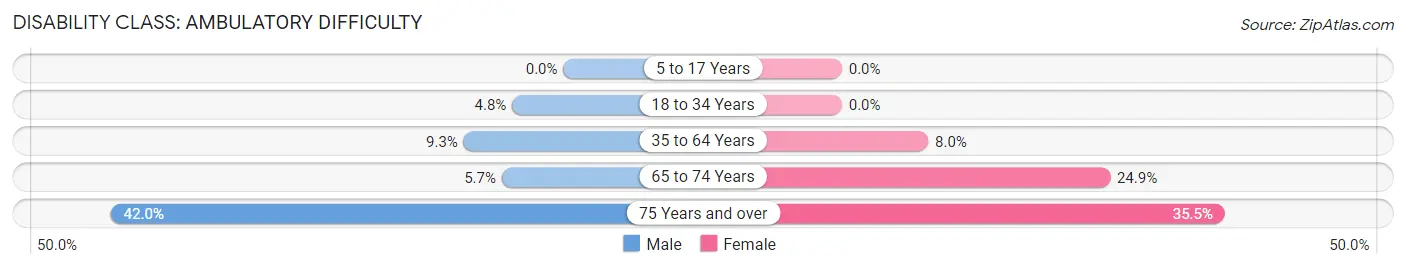
| Age Bracket | Male | Female |
| 5 to 17 Years | 0 (0.0%) | 0 (0.0%) |
| 18 to 34 Years | 60 (4.8%) | 0 (0.0%) |
| 35 to 64 Years | 184 (9.2%) | 156 (8.0%) |
| 65 to 74 Years | 40 (5.7%) | 114 (24.9%) |
| 75 Years and over | 142 (42.0%) | 193 (35.5%) |
Disability Class: Self-Care Difficulty
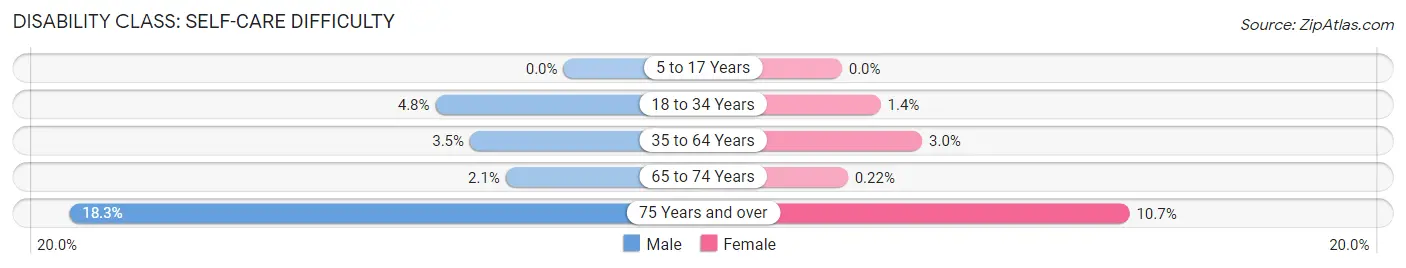
| Age Bracket | Male | Female |
| 5 to 17 Years | 0 (0.0%) | 0 (0.0%) |
| 18 to 34 Years | 60 (4.8%) | 16 (1.4%) |
| 35 to 64 Years | 69 (3.5%) | 58 (3.0%) |
| 65 to 74 Years | 15 (2.1%) | 1 (0.2%) |
| 75 Years and over | 62 (18.3%) | 58 (10.7%) |
Technology Access in Columbia borough
Computing Device Access in Columbia borough
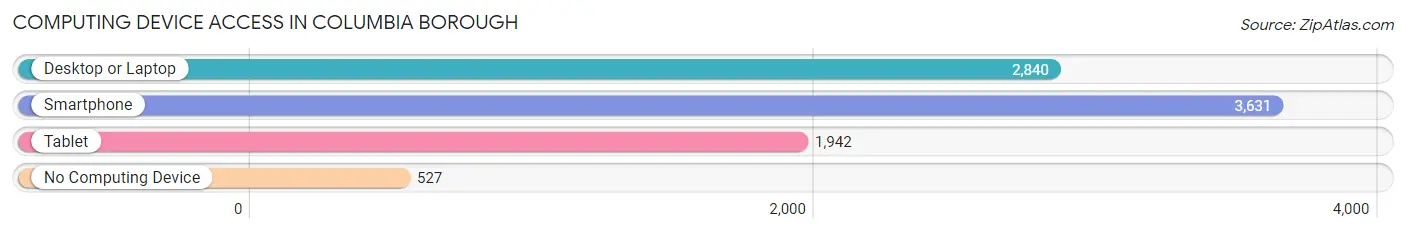
| Device Type | # Households | % Households |
| Desktop or Laptop | 2,840 | 62.9% |
| Smartphone | 3,631 | 80.4% |
| Tablet | 1,942 | 43.0% |
| No Computing Device | 527 | 11.7% |
| Total | 4,515 | 100.0% |
Internet Access in Columbia borough
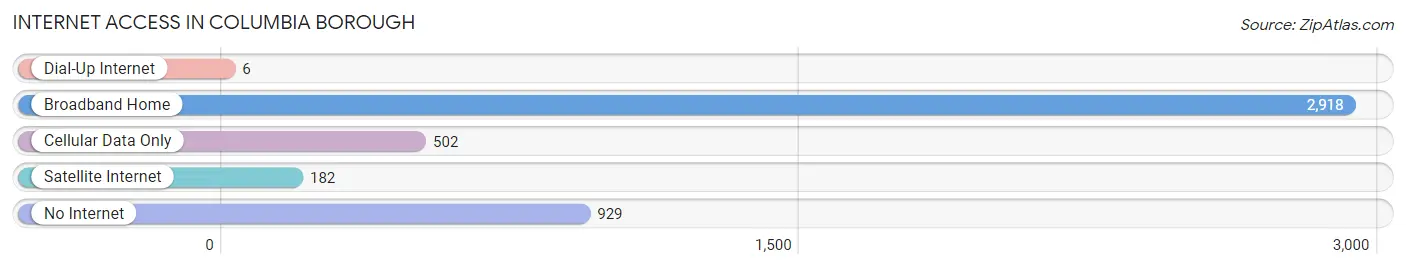
| Internet Type | # Households | % Households |
| Dial-Up Internet | 6 | 0.1% |
| Broadband Home | 2,918 | 64.6% |
| Cellular Data Only | 502 | 11.1% |
| Satellite Internet | 182 | 4.0% |
| No Internet | 929 | 20.6% |
| Total | 4,515 | 100.0% |
Columbia borough Summary
Columbia Borough is a borough located in Lancaster County, Pennsylvania, United States. The population was 10,400 at the 2010 census. It is part of the Lancaster, PA Metropolitan Statistical Area.
History
The area that is now Columbia Borough was first settled in 1728 by a group of Mennonites from Germany. The town was originally known as "Steitztown" after the Steitz family, who were among the first settlers. In 1788, the town was renamed "Columbia" after Christopher Columbus.
The town was officially incorporated as a borough in 1814. During the 19th century, Columbia was a major industrial center, with several factories and mills located in the area. The town was also home to several prominent businesses, including the Columbia Carriage Works, which produced horse-drawn carriages.
In the early 20th century, Columbia began to decline as the industrial economy shifted away from the area. The town's population decreased steadily throughout the century, and by the 2000 census, the population had dropped to 8,788.
Geography
Columbia Borough is located in southeastern Lancaster County, Pennsylvania. It is bordered to the north by East Hempfield Township, to the east by Mountville Borough, to the south by West Hempfield Township, and to the west by Manor Township.
The borough is located in the Susquehanna River Valley, and is situated on the east bank of the river. The borough is approximately 2.5 miles (4 km) wide and 1.5 miles (2.4 km) long.
Economy
The economy of Columbia Borough is largely based on manufacturing and retail. The borough is home to several factories and industrial parks, including the Columbia Industrial Park and the Columbia Business Park.
The borough is also home to several retail stores, including a Walmart Supercenter, a Lowe's Home Improvement store, and a Giant Food Store.
Demographics
As of the 2010 census, the population of Columbia Borough was 10,400. The racial makeup of the borough was 90.2% White, 4.2% African American, 0.3% Native American, 1.2% Asian, 0.1% Pacific Islander, 1.3% from other races, and 2.9% from two or more races. Hispanic or Latino of any race were 4.2% of the population.
The median household income in Columbia Borough was $45,945, and the median family income was $54,945. The per capita income for the borough was $22,845. About 8.2% of families and 10.2% of the population were below the poverty line, including 14.2% of those under age 18 and 6.2% of those age 65 or over.
Conclusion
Columbia Borough is a borough located in Lancaster County, Pennsylvania. It has a long history, dating back to the 18th century, when it was first settled by a group of Mennonites from Germany. The borough has a population of 10,400, and its economy is largely based on manufacturing and retail. The median household income in Columbia Borough is $45,945, and the per capita income is $22,845.
Common Questions
What is Per Capita Income in Columbia borough?
Per Capita income in Columbia borough is $30,615.
What is the Median Family Income in Columbia borough?
Median Family Income in Columbia borough is $68,974.
What is the Median Household income in Columbia borough?
Median Household Income in Columbia borough is $50,309.
What is Income or Wage Gap in Columbia borough?
Income or Wage Gap in Columbia borough is 16.4%.
Women in Columbia borough earn 83.6 cents for every dollar earned by a man.
What is Family Income Deficit in Columbia borough?
Family Income Deficit in Columbia borough is $10,097.
Families that are below poverty line in Columbia borough earn $10,097 less on average than the poverty threshold level.
What is Inequality or Gini Index in Columbia borough?
Inequality or Gini Index in Columbia borough is 0.43.
What is the Total Population of Columbia borough?
Total Population of Columbia borough is 10,203.
What is the Total Male Population of Columbia borough?
Total Male Population of Columbia borough is 5,280.
What is the Total Female Population of Columbia borough?
Total Female Population of Columbia borough is 4,923.
What is the Ratio of Males per 100 Females in Columbia borough?
There are 107.25 Males per 100 Females in Columbia borough.
What is the Ratio of Females per 100 Males in Columbia borough?
There are 93.24 Females per 100 Males in Columbia borough.
What is the Median Population Age in Columbia borough?
Median Population Age in Columbia borough is 42.7 Years.
What is the Average Family Size in Columbia borough
Average Family Size in Columbia borough is 2.9 People.
What is the Average Household Size in Columbia borough
Average Household Size in Columbia borough is 2.2 People.
How Large is the Labor Force in Columbia borough?
There are 5,270 People in the Labor Forcein in Columbia borough.
What is the Percentage of People in the Labor Force in Columbia borough?
59.8% of People are in the Labor Force in Columbia borough.
What is the Unemployment Rate in Columbia borough?
Unemployment Rate in Columbia borough is 4.2%.