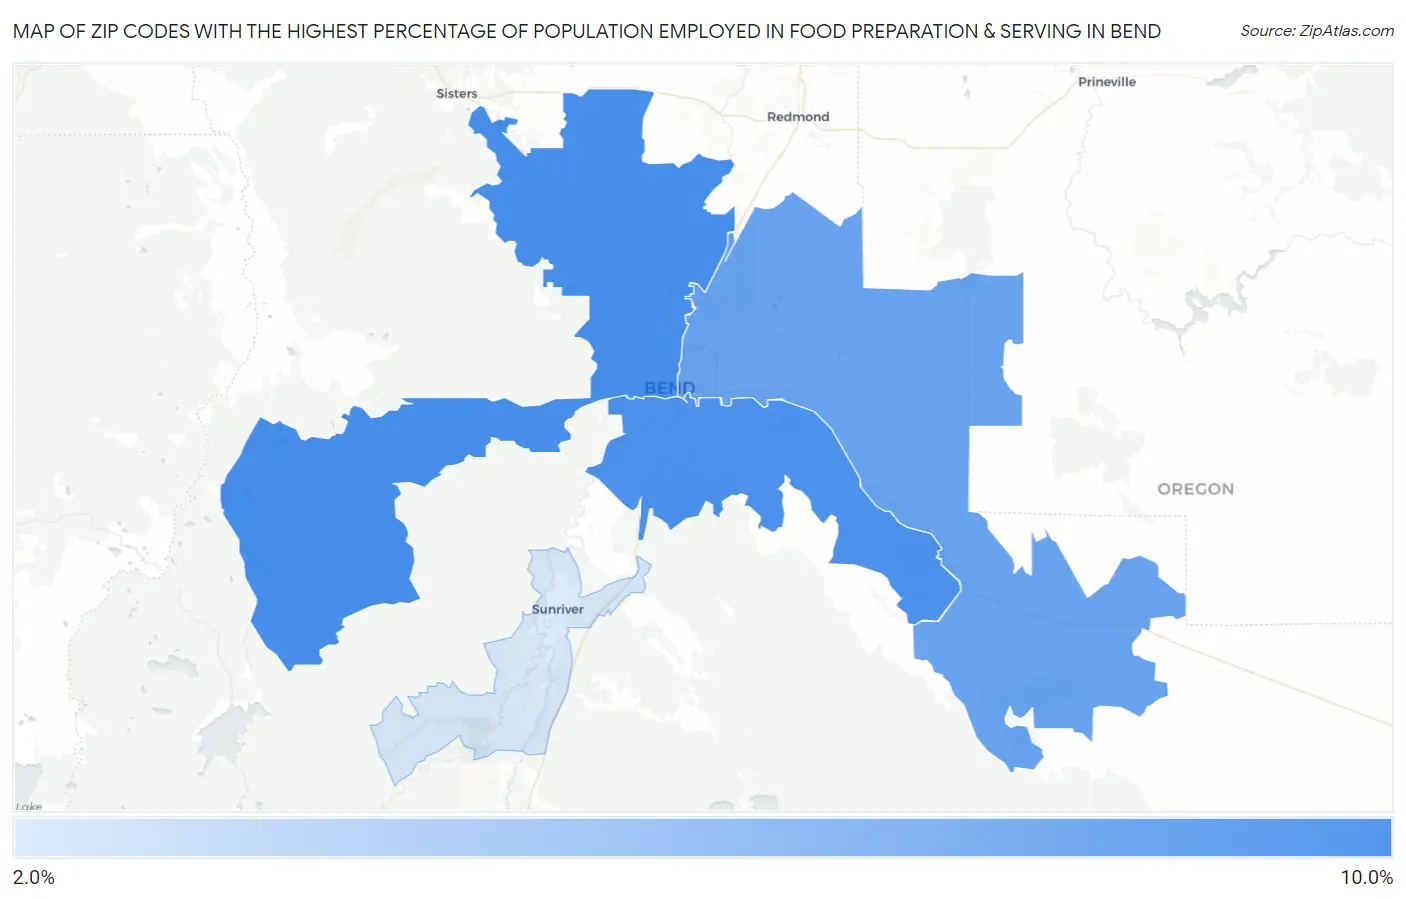
Zip Codes with the Highest Percentage of Population Employed in Food Preparation & Serving in Bend, OR
RELATED REPORTS & OPTIONS
Food Preparation & Serving
Bend
Compare Zip Codes
Map of Zip Codes with the Highest Percentage of Population Employed in Food Preparation & Serving in Bend
2.6%
8.2%
Zip Codes with the Highest Percentage of Population Employed in Food Preparation & Serving in Bend, OR
| Zip Code | % Employed | vs State | vs National | |
| 1. | 97703 | 8.2% | 5.9%(+2.27)#81 | 5.3%(+2.91)#4,438 |
| 2. | 97702 | 8.1% | 5.9%(+2.13)#85 | 5.3%(+2.77)#4,646 |
| 3. | 97701 | 6.9% | 5.9%(+1.01)#116 | 5.3%(+1.65)#6,724 |
| 4. | 97707 | 2.6% | 5.9%(-3.32)#288 | 5.3%(-2.68)#22,758 |
1
Common Questions
What are the Top 3 Zip Codes with the Highest Percentage of Population Employed in Food Preparation & Serving in Bend, OR?
Top 3 Zip Codes with the Highest Percentage of Population Employed in Food Preparation & Serving in Bend, OR are:
What zip code has the Highest Percentage of Population Employed in Food Preparation & Serving in Bend, OR?
97703 has the Highest Percentage of Population Employed in Food Preparation & Serving in Bend, OR with 8.2%.
What is the Percentage of Population Employed in Food Preparation & Serving in Bend, OR?
Percentage of Population Employed in Food Preparation & Serving in Bend is 8.5%.
What is the Percentage of Population Employed in Food Preparation & Serving in Oregon?
Percentage of Population Employed in Food Preparation & Serving in Oregon is 5.9%.
What is the Percentage of Population Employed in Food Preparation & Serving in the United States?
Percentage of Population Employed in Food Preparation & Serving in the United States is 5.3%.