Zip Codes with the Highest Percentage of Population Employed in Food Preparation & Serving in Eugene, OR
RELATED REPORTS & OPTIONS
Food Preparation & Serving
Eugene
Compare Zip Codes
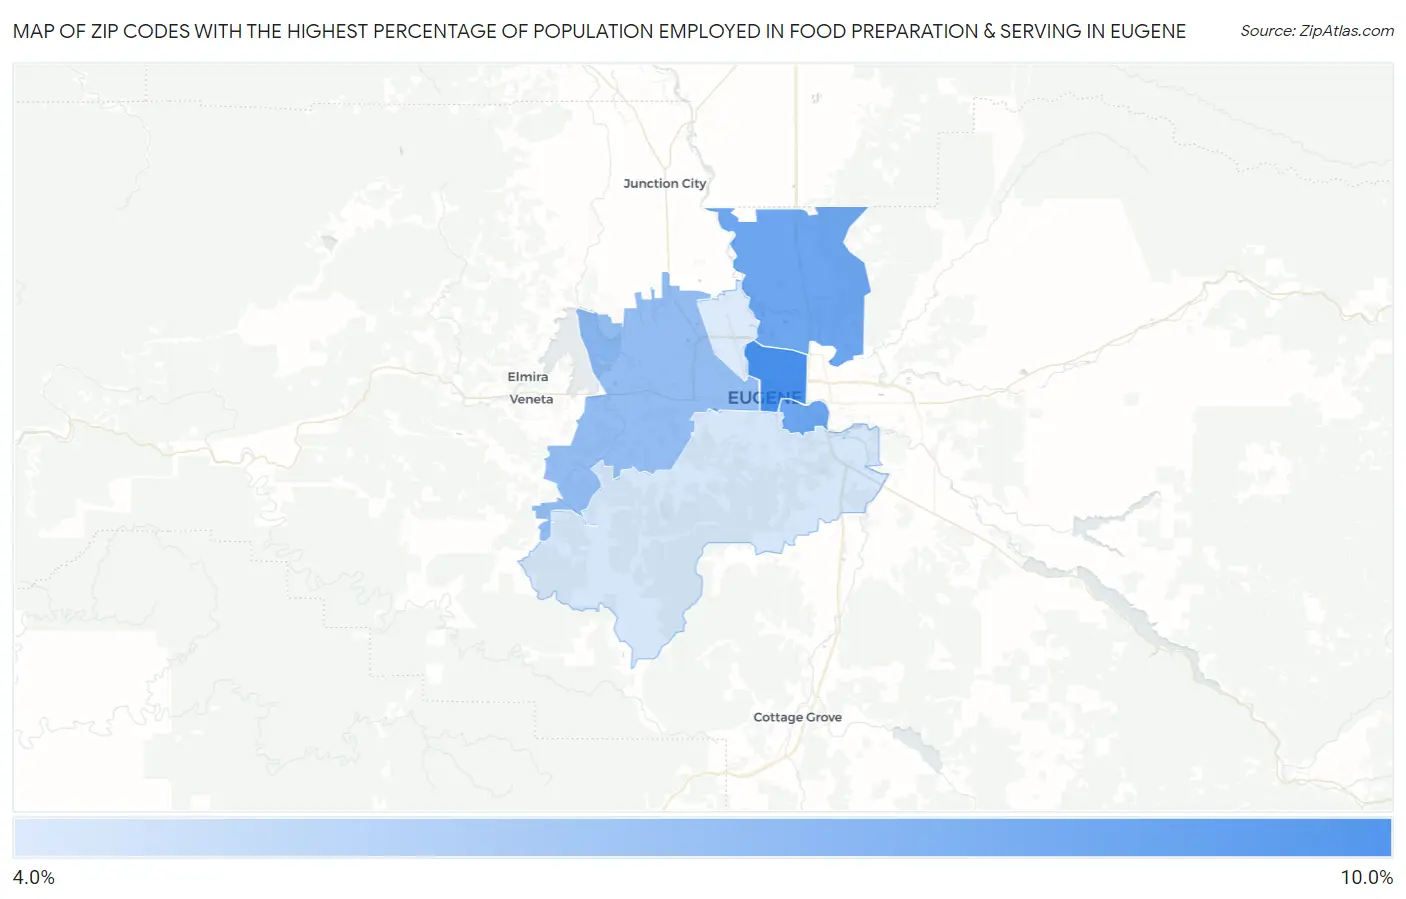
Map of Zip Codes with the Highest Percentage of Population Employed in Food Preparation & Serving in Eugene
4.4%
10.0%
Zip Codes with the Highest Percentage of Population Employed in Food Preparation & Serving in Eugene, OR
| Zip Code | % Employed | vs State | vs National | |
| 1. | 97401 | 10.0% | 5.9%(+4.04)#46 | 5.3%(+4.69)#2,657 |
| 2. | 97403 | 8.6% | 5.9%(+2.69)#70 | 5.3%(+3.33)#3,943 |
| 3. | 97408 | 8.5% | 5.9%(+2.59)#73 | 5.3%(+3.23)#4,052 |
| 4. | 97402 | 7.1% | 5.9%(+1.19)#113 | 5.3%(+1.84)#6,295 |
| 5. | 97405 | 4.7% | 5.9%(-1.23)#204 | 5.3%(-0.592)#14,180 |
| 6. | 97404 | 4.4% | 5.9%(-1.49)#223 | 5.3%(-0.851)#15,261 |
1
Common Questions
What are the Top 5 Zip Codes with the Highest Percentage of Population Employed in Food Preparation & Serving in Eugene, OR?
Top 5 Zip Codes with the Highest Percentage of Population Employed in Food Preparation & Serving in Eugene, OR are:
What zip code has the Highest Percentage of Population Employed in Food Preparation & Serving in Eugene, OR?
97401 has the Highest Percentage of Population Employed in Food Preparation & Serving in Eugene, OR with 10.0%.
What is the Percentage of Population Employed in Food Preparation & Serving in Eugene, OR?
Percentage of Population Employed in Food Preparation & Serving in Eugene is 7.4%.
What is the Percentage of Population Employed in Food Preparation & Serving in Oregon?
Percentage of Population Employed in Food Preparation & Serving in Oregon is 5.9%.
What is the Percentage of Population Employed in Food Preparation & Serving in the United States?
Percentage of Population Employed in Food Preparation & Serving in the United States is 5.3%.