Zip Codes with the Highest Percentage of Population Employed in Food Preparation & Serving in Springfield, OR
RELATED REPORTS & OPTIONS
Food Preparation & Serving
Springfield
Compare Zip Codes
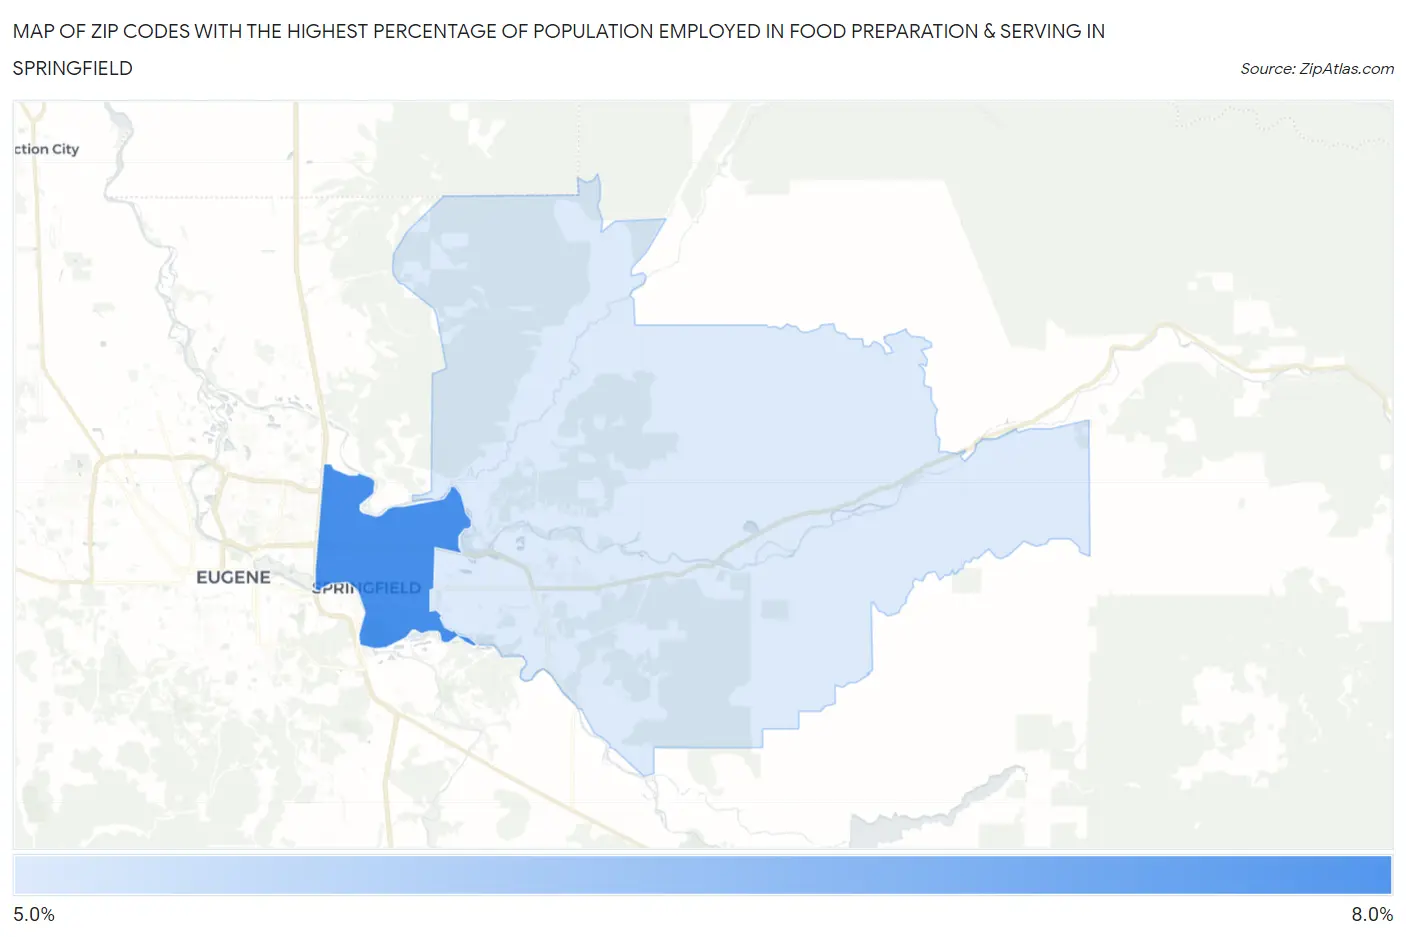
Map of Zip Codes with the Highest Percentage of Population Employed in Food Preparation & Serving in Springfield
5.6%
6.9%
Zip Codes with the Highest Percentage of Population Employed in Food Preparation & Serving in Springfield, OR
| Zip Code | % Employed | vs State | vs National | |
| 1. | 97477 | 6.9% | 5.9%(+1.01)#117 | 5.3%(+1.65)#6,733 |
| 2. | 97478 | 5.6% | 5.9%(-0.293)#170 | 5.3%(+0.348)#10,580 |
1
Common Questions
What are the Top Zip Codes with the Highest Percentage of Population Employed in Food Preparation & Serving in Springfield, OR?
Top Zip Codes with the Highest Percentage of Population Employed in Food Preparation & Serving in Springfield, OR are:
What zip code has the Highest Percentage of Population Employed in Food Preparation & Serving in Springfield, OR?
97477 has the Highest Percentage of Population Employed in Food Preparation & Serving in Springfield, OR with 6.9%.
What is the Percentage of Population Employed in Food Preparation & Serving in Springfield, OR?
Percentage of Population Employed in Food Preparation & Serving in Springfield is 7.2%.
What is the Percentage of Population Employed in Food Preparation & Serving in Oregon?
Percentage of Population Employed in Food Preparation & Serving in Oregon is 5.9%.
What is the Percentage of Population Employed in Food Preparation & Serving in the United States?
Percentage of Population Employed in Food Preparation & Serving in the United States is 5.3%.