Zip Codes with the Highest Percentage of Population Employed in Food Preparation & Serving in Roseburg, OR
RELATED REPORTS & OPTIONS
Food Preparation & Serving
Roseburg
Compare Zip Codes
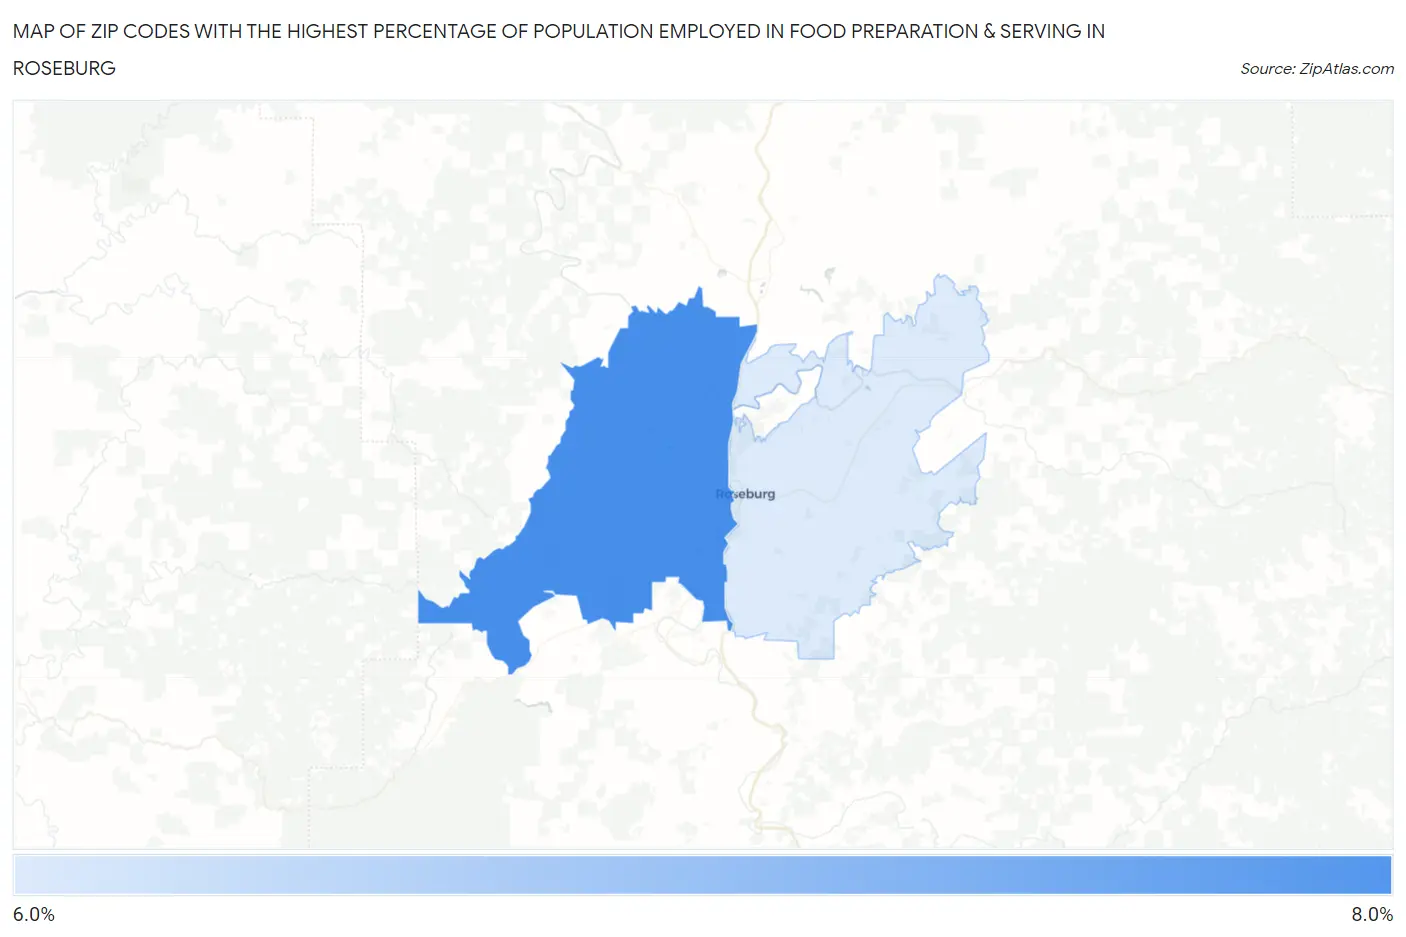
Map of Zip Codes with the Highest Percentage of Population Employed in Food Preparation & Serving in Roseburg
6.8%
7.7%
Zip Codes with the Highest Percentage of Population Employed in Food Preparation & Serving in Roseburg, OR
| Zip Code | % Employed | vs State | vs National | |
| 1. | 97471 | 7.7% | 5.9%(+1.75)#97 | 5.3%(+2.39)#5,252 |
| 2. | 97470 | 6.8% | 5.9%(+0.900)#124 | 5.3%(+1.54)#6,996 |
1
Common Questions
What are the Top Zip Codes with the Highest Percentage of Population Employed in Food Preparation & Serving in Roseburg, OR?
Top Zip Codes with the Highest Percentage of Population Employed in Food Preparation & Serving in Roseburg, OR are:
What zip code has the Highest Percentage of Population Employed in Food Preparation & Serving in Roseburg, OR?
97471 has the Highest Percentage of Population Employed in Food Preparation & Serving in Roseburg, OR with 7.7%.
What is the Percentage of Population Employed in Food Preparation & Serving in Roseburg, OR?
Percentage of Population Employed in Food Preparation & Serving in Roseburg is 5.4%.
What is the Percentage of Population Employed in Food Preparation & Serving in Oregon?
Percentage of Population Employed in Food Preparation & Serving in Oregon is 5.9%.
What is the Percentage of Population Employed in Food Preparation & Serving in the United States?
Percentage of Population Employed in Food Preparation & Serving in the United States is 5.3%.