Cedarville, OH Map & Demographics
Cedarville Map
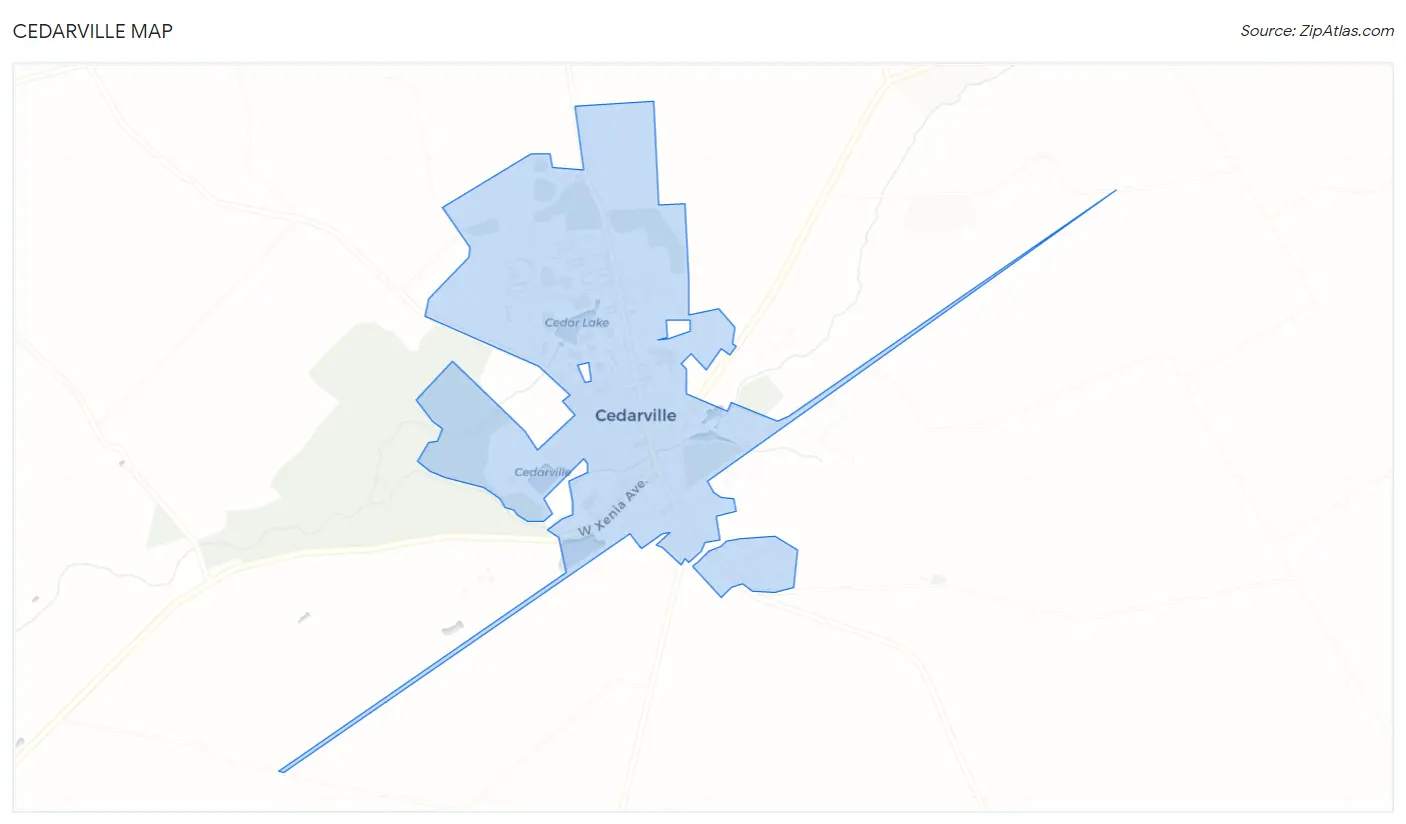
Cedarville Overview
$14,544
PER CAPITA INCOME
$63,889
AVG FAMILY INCOME
$53,365
AVG HOUSEHOLD INCOME
8.3%
WAGE / INCOME GAP [ % ]
91.7¢/ $1
WAGE / INCOME GAP [ $ ]
0.38
INEQUALITY / GINI INDEX
3,915
TOTAL POPULATION
1,855
MALE POPULATION
2,060
FEMALE POPULATION
90.05
MALES / 100 FEMALES
111.05
FEMALES / 100 MALES
20.3
MEDIAN AGE
2.9
AVG FAMILY SIZE
2.6
AVG HOUSEHOLD SIZE
2,101
LABOR FORCE [ PEOPLE ]
58.1%
PERCENT IN LABOR FORCE
9.1%
UNEMPLOYMENT RATE
Cedarville Zip Codes
Cedarville Area Codes
Income in Cedarville
Income Overview in Cedarville
Per Capita Income in Cedarville is $14,544, while median incomes of families and households are $63,889 and $53,365 respectively.
| Characteristic | Number | Measure |
| Per Capita Income | 3,915 | $14,544 |
| Median Family Income | 394 | $63,889 |
| Mean Family Income | 394 | $73,847 |
| Median Household Income | 627 | $53,365 |
| Mean Household Income | 627 | $68,314 |
| Income Deficit | 394 | $0 |
| Wage / Income Gap (%) | 3,915 | 8.31% |
| Wage / Income Gap ($) | 3,915 | 91.69¢ per $1 |
| Gini / Inequality Index | 3,915 | 0.38 |
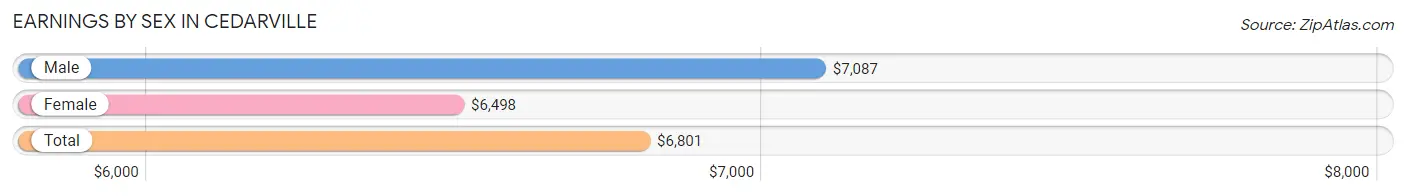
Earnings by Sex in Cedarville
Average Earnings in Cedarville are $6,801, $7,087 for men and $6,498 for women, a difference of 8.3%.
| Sex | Number | Average Earnings |
| Male | 1,410 (48.0%) | $7,087 |
| Female | 1,526 (52.0%) | $6,498 |
| Total | 2,936 (100.0%) | $6,801 |
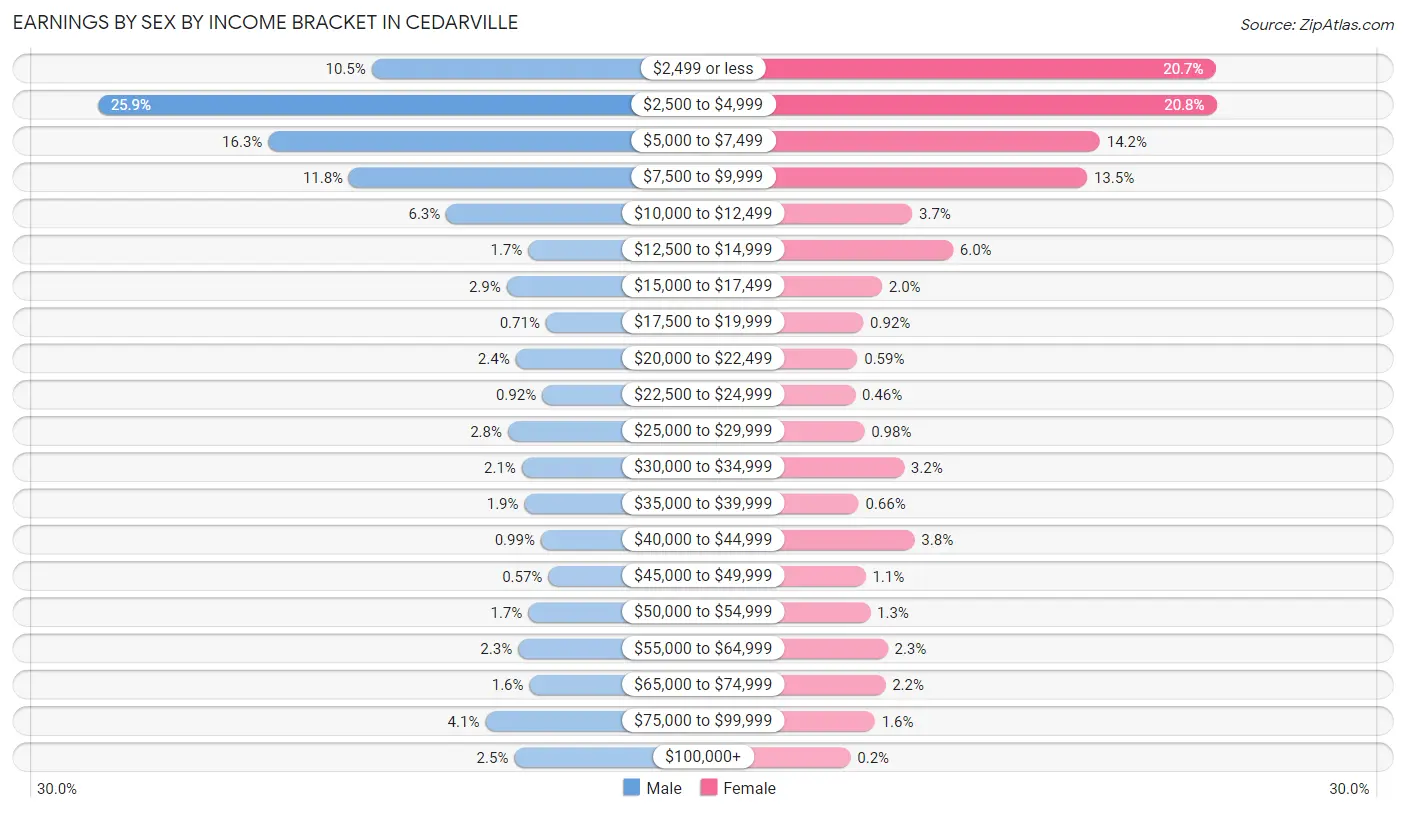
Earnings by Sex by Income Bracket in Cedarville
The most common earnings brackets in Cedarville are $2,500 to $4,999 for men (365 | 25.9%) and $2,500 to $4,999 for women (317 | 20.8%).
| Income | Male | Female |
| $2,499 or less | 148 (10.5%) | 316 (20.7%) |
| $2,500 to $4,999 | 365 (25.9%) | 317 (20.8%) |
| $5,000 to $7,499 | 230 (16.3%) | 217 (14.2%) |
| $7,500 to $9,999 | 166 (11.8%) | 206 (13.5%) |
| $10,000 to $12,499 | 89 (6.3%) | 56 (3.7%) |
| $12,500 to $14,999 | 24 (1.7%) | 91 (6.0%) |
| $15,000 to $17,499 | 41 (2.9%) | 30 (2.0%) |
| $17,500 to $19,999 | 10 (0.7%) | 14 (0.9%) |
| $20,000 to $22,499 | 34 (2.4%) | 9 (0.6%) |
| $22,500 to $24,999 | 13 (0.9%) | 7 (0.5%) |
| $25,000 to $29,999 | 40 (2.8%) | 15 (1.0%) |
| $30,000 to $34,999 | 29 (2.1%) | 49 (3.2%) |
| $35,000 to $39,999 | 27 (1.9%) | 10 (0.7%) |
| $40,000 to $44,999 | 14 (1.0%) | 58 (3.8%) |
| $45,000 to $49,999 | 8 (0.6%) | 16 (1.1%) |
| $50,000 to $54,999 | 24 (1.7%) | 20 (1.3%) |
| $55,000 to $64,999 | 32 (2.3%) | 35 (2.3%) |
| $65,000 to $74,999 | 23 (1.6%) | 33 (2.2%) |
| $75,000 to $99,999 | 58 (4.1%) | 24 (1.6%) |
| $100,000+ | 35 (2.5%) | 3 (0.2%) |
| Total | 1,410 (100.0%) | 1,526 (100.0%) |
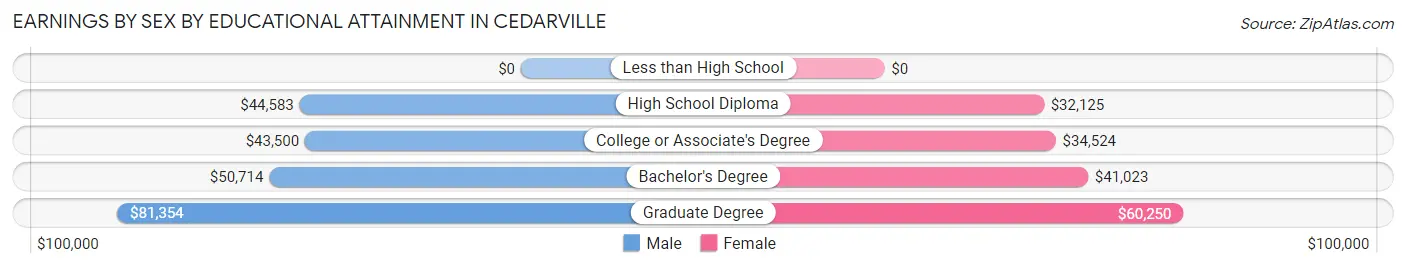
Earnings by Sex by Educational Attainment in Cedarville
Average earnings in Cedarville are $56,563 for men and $40,924 for women, a difference of 27.7%. Men with an educational attainment of graduate degree enjoy the highest average annual earnings of $81,354, while those with college or associate's degree education earn the least with $43,500. Women with an educational attainment of graduate degree earn the most with the average annual earnings of $60,250, while those with high school diploma education have the smallest earnings of $32,125.
| Educational Attainment | Male Income | Female Income |
| Less than High School | - | - |
| High School Diploma | $44,583 | $32,125 |
| College or Associate's Degree | $43,500 | $34,524 |
| Bachelor's Degree | $50,714 | $41,023 |
| Graduate Degree | $81,354 | $60,250 |
| Total | $56,563 | $40,924 |
Family Income in Cedarville
Family Income Brackets in Cedarville
According to the Cedarville family income data, there are 84 families falling into the $100,000 to $149,999 income range, which is the most common income bracket and makes up 21.3% of all families. Conversely, the $200,000+ income bracket is the least frequent group with only 3 families (0.8%) belonging to this category.
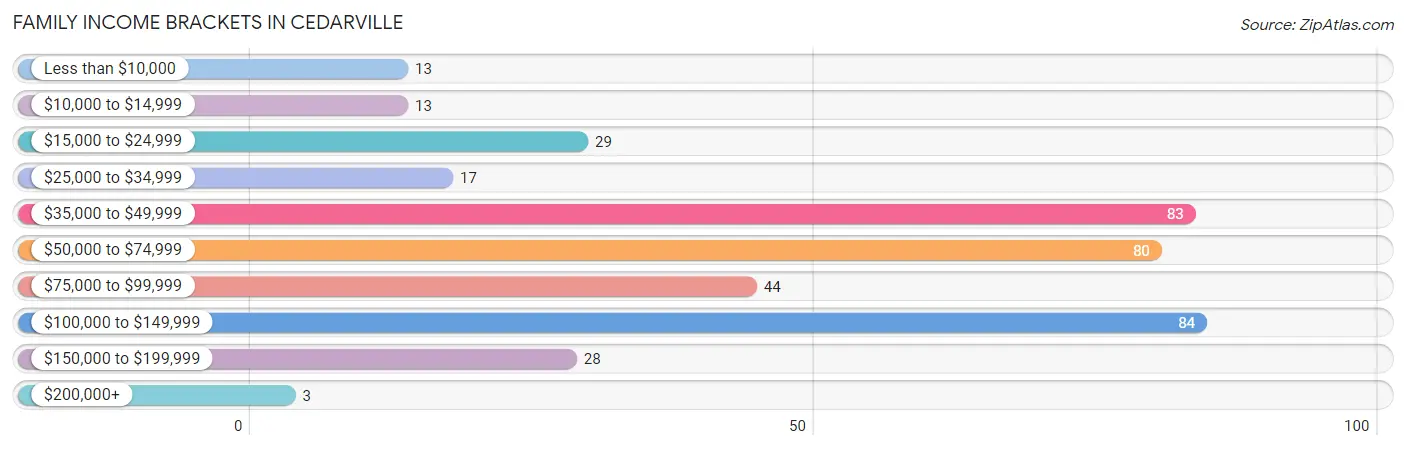
| Income Bracket | # Families | % Families |
| Less than $10,000 | 13 | 3.3% |
| $10,000 to $14,999 | 13 | 3.3% |
| $15,000 to $24,999 | 29 | 7.4% |
| $25,000 to $34,999 | 17 | 4.3% |
| $35,000 to $49,999 | 83 | 21.1% |
| $50,000 to $74,999 | 80 | 20.3% |
| $75,000 to $99,999 | 44 | 11.2% |
| $100,000 to $149,999 | 84 | 21.3% |
| $150,000 to $199,999 | 28 | 7.1% |
| $200,000+ | 3 | 0.8% |
Family Income by Famaliy Size in Cedarville
4-person families (26 | 6.6%) account for the highest median family income in Cedarville with $135,833 per family, while 4-person families (26 | 6.6%) have the highest median income of $33,958 per family member.
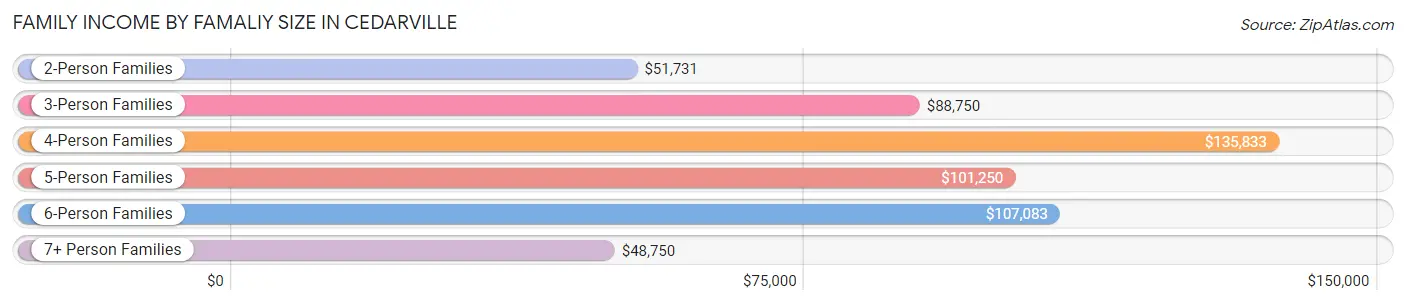
| Income Bracket | # Families | Median Income |
| 2-Person Families | 256 (65.0%) | $51,731 |
| 3-Person Families | 45 (11.4%) | $88,750 |
| 4-Person Families | 26 (6.6%) | $135,833 |
| 5-Person Families | 32 (8.1%) | $101,250 |
| 6-Person Families | 11 (2.8%) | $107,083 |
| 7+ Person Families | 24 (6.1%) | $48,750 |
| Total | 394 (100.0%) | $63,889 |
Family Income by Number of Earners in Cedarville
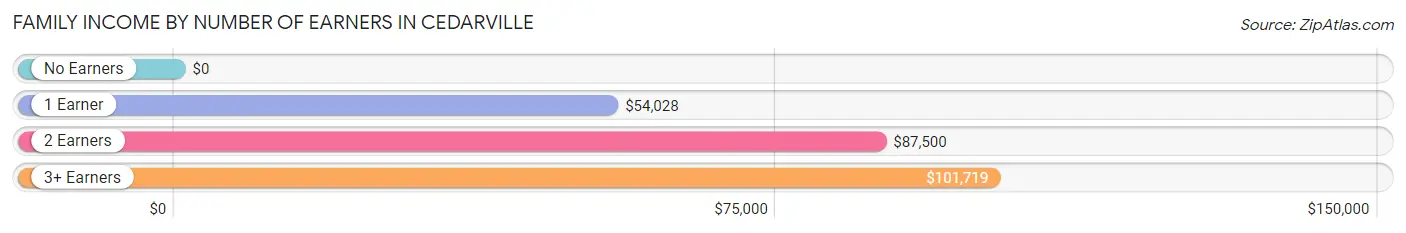
| Number of Earners | # Families | Median Income |
| No Earners | 76 (19.3%) | $0 |
| 1 Earner | 111 (28.2%) | $54,028 |
| 2 Earners | 166 (42.1%) | $87,500 |
| 3+ Earners | 41 (10.4%) | $101,719 |
| Total | 394 (100.0%) | $63,889 |
Household Income in Cedarville
Household Income Brackets in Cedarville
With 137 households falling in the category, the $35,000 to $49,999 income range is the most frequent in Cedarville, accounting for 21.8% of all households. In contrast, only 14 households (2.2%) fall into the $200,000+ income bracket, making it the least populous group.
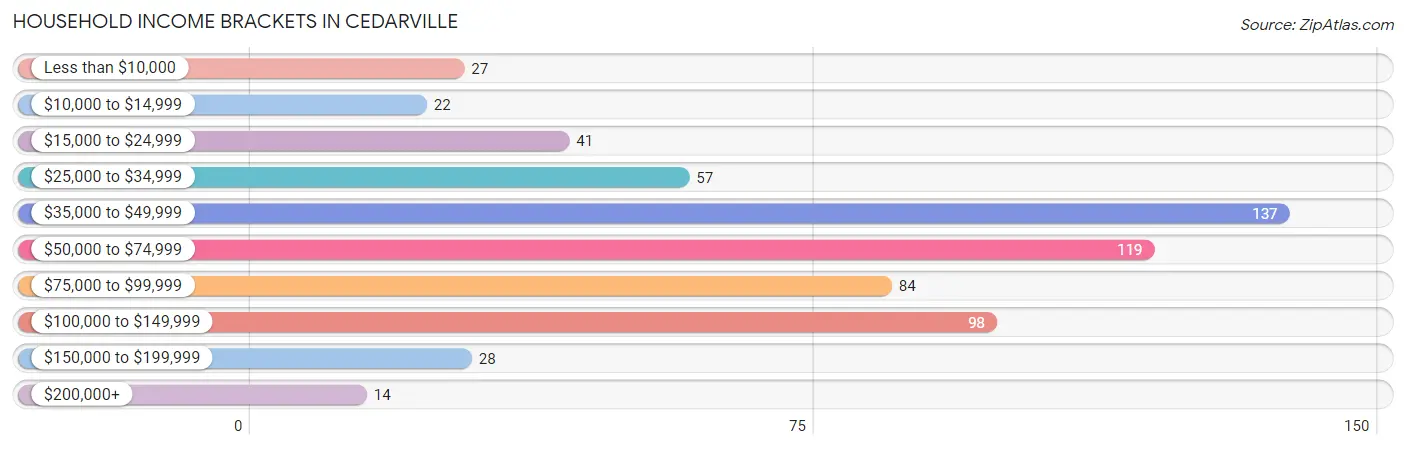
| Income Bracket | # Households | % Households |
| Less than $10,000 | 27 | 4.3% |
| $10,000 to $14,999 | 22 | 3.5% |
| $15,000 to $24,999 | 41 | 6.5% |
| $25,000 to $34,999 | 57 | 9.1% |
| $35,000 to $49,999 | 137 | 21.9% |
| $50,000 to $74,999 | 119 | 19.0% |
| $75,000 to $99,999 | 84 | 13.4% |
| $100,000 to $149,999 | 98 | 15.6% |
| $150,000 to $199,999 | 28 | 4.5% |
| $200,000+ | 14 | 2.2% |
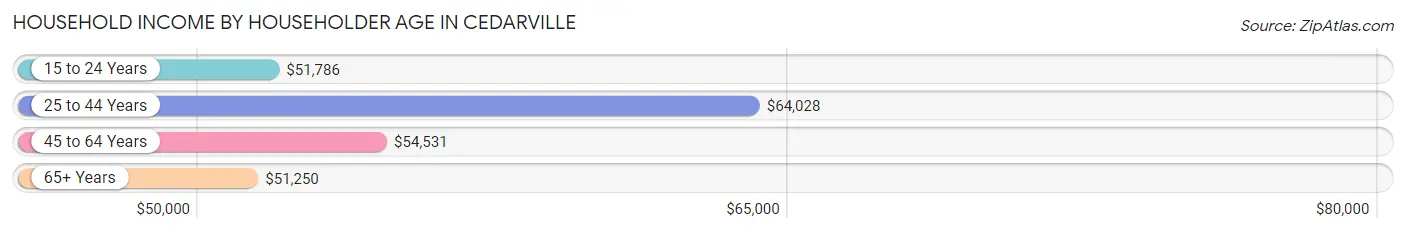
Household Income by Householder Age in Cedarville
The median household income in Cedarville is $53,365, with the highest median household income of $64,028 found in the 25 to 44 years age bracket for the primary householder. A total of 155 households (24.7%) fall into this category. Meanwhile, the 65+ years age bracket for the primary householder has the lowest median household income of $51,250, with 129 households (20.6%) in this group.
| Income Bracket | # Households | Median Income |
| 15 to 24 Years | 110 (17.5%) | $51,786 |
| 25 to 44 Years | 155 (24.7%) | $64,028 |
| 45 to 64 Years | 233 (37.2%) | $54,531 |
| 65+ Years | 129 (20.6%) | $51,250 |
| Total | 627 (100.0%) | $53,365 |
Poverty in Cedarville
Income Below Poverty by Sex and Age in Cedarville
With 16.0% poverty level for males and 27.5% for females among the residents of Cedarville, 12 to 14 year old males and under 5 year old females are the most vulnerable to poverty, with 19 males (36.5%) and 41 females (65.1%) in their respective age groups living below the poverty level.
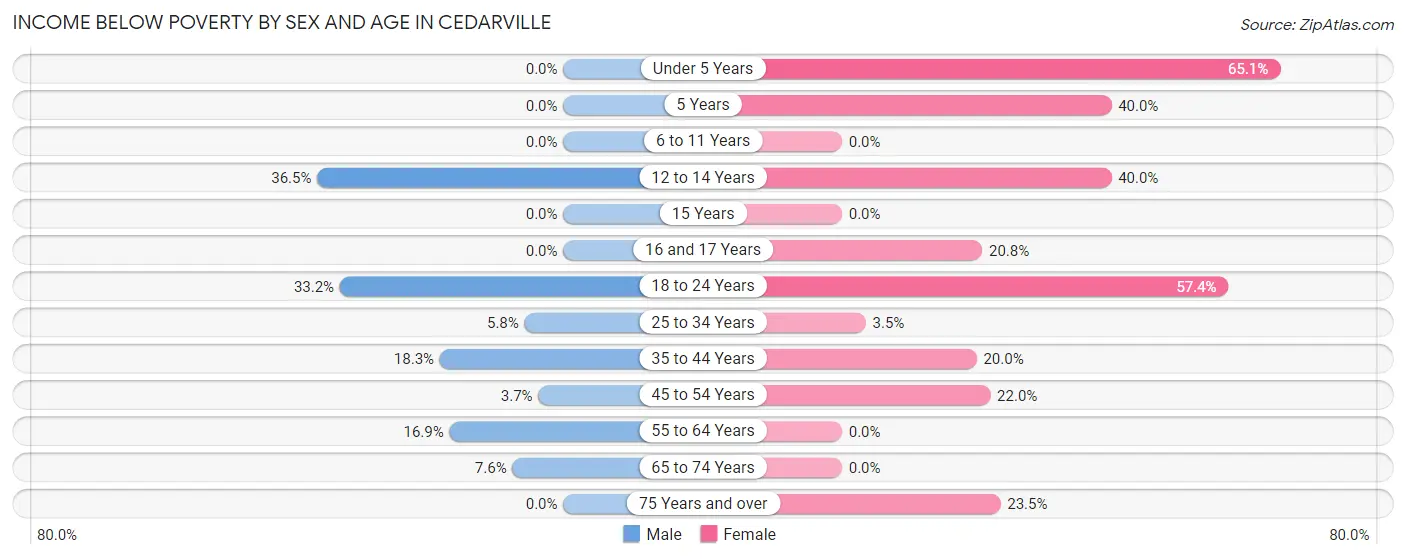
| Age Bracket | Male | Female |
| Under 5 Years | 0 (0.0%) | 41 (65.1%) |
| 5 Years | 0 (0.0%) | 8 (40.0%) |
| 6 to 11 Years | 0 (0.0%) | 0 (0.0%) |
| 12 to 14 Years | 19 (36.5%) | 10 (40.0%) |
| 15 Years | 0 (0.0%) | 0 (0.0%) |
| 16 and 17 Years | 0 (0.0%) | 5 (20.8%) |
| 18 to 24 Years | 66 (33.2%) | 124 (57.4%) |
| 25 to 34 Years | 5 (5.8%) | 3 (3.5%) |
| 35 to 44 Years | 11 (18.3%) | 13 (20.0%) |
| 45 to 54 Years | 3 (3.7%) | 26 (22.0%) |
| 55 to 64 Years | 12 (16.9%) | 0 (0.0%) |
| 65 to 74 Years | 4 (7.5%) | 0 (0.0%) |
| 75 Years and over | 0 (0.0%) | 8 (23.5%) |
| Total | 120 (16.0%) | 238 (27.5%) |
Income Above Poverty by Sex and Age in Cedarville
According to the poverty statistics in Cedarville, males aged under 5 years and females aged 6 to 11 years are the age groups that are most secure financially, with 100.0% of males and 100.0% of females in these age groups living above the poverty line.
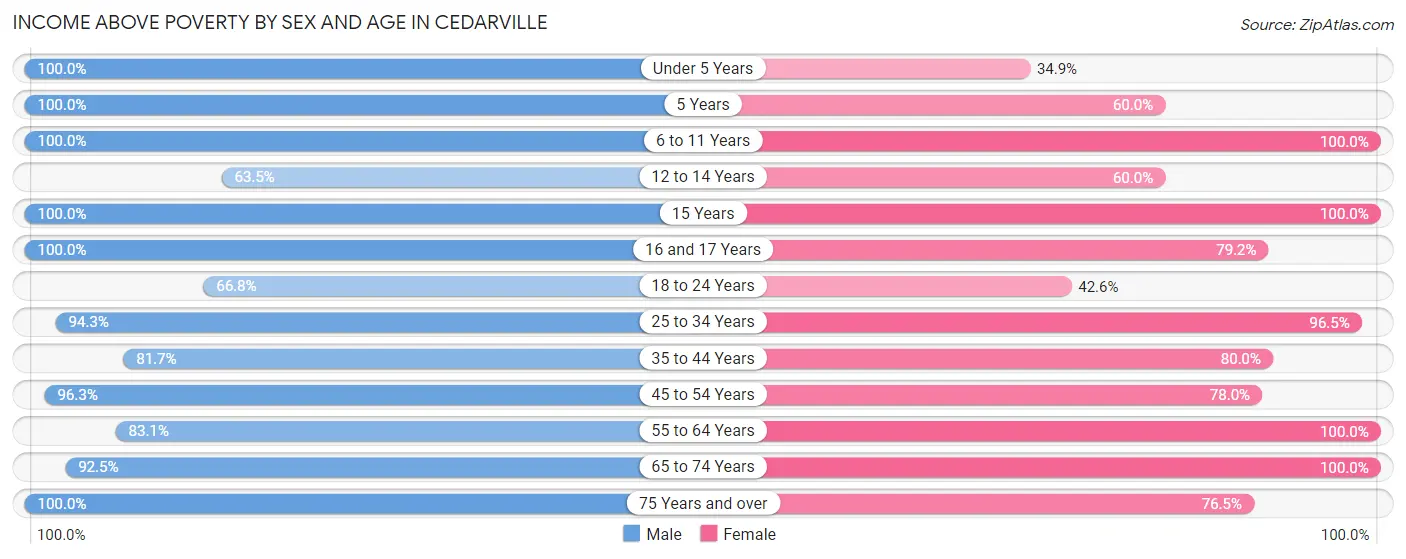
| Age Bracket | Male | Female |
| Under 5 Years | 34 (100.0%) | 22 (34.9%) |
| 5 Years | 3 (100.0%) | 12 (60.0%) |
| 6 to 11 Years | 52 (100.0%) | 28 (100.0%) |
| 12 to 14 Years | 33 (63.5%) | 15 (60.0%) |
| 15 Years | 4 (100.0%) | 17 (100.0%) |
| 16 and 17 Years | 9 (100.0%) | 19 (79.2%) |
| 18 to 24 Years | 133 (66.8%) | 92 (42.6%) |
| 25 to 34 Years | 82 (94.3%) | 82 (96.5%) |
| 35 to 44 Years | 49 (81.7%) | 52 (80.0%) |
| 45 to 54 Years | 78 (96.3%) | 92 (78.0%) |
| 55 to 64 Years | 59 (83.1%) | 107 (100.0%) |
| 65 to 74 Years | 49 (92.4%) | 63 (100.0%) |
| 75 Years and over | 44 (100.0%) | 26 (76.5%) |
| Total | 629 (84.0%) | 627 (72.5%) |
Income Below Poverty Among Married-Couple Families in Cedarville
The poverty statistics for married-couple families in Cedarville show that 6.8% or 21 of the total 307 families live below the poverty line. Families with no children have the highest poverty rate of 10.1%, comprising of 21 families. On the other hand, families with 1 or 2 children have the lowest poverty rate of 0.0%, which includes 0 families.
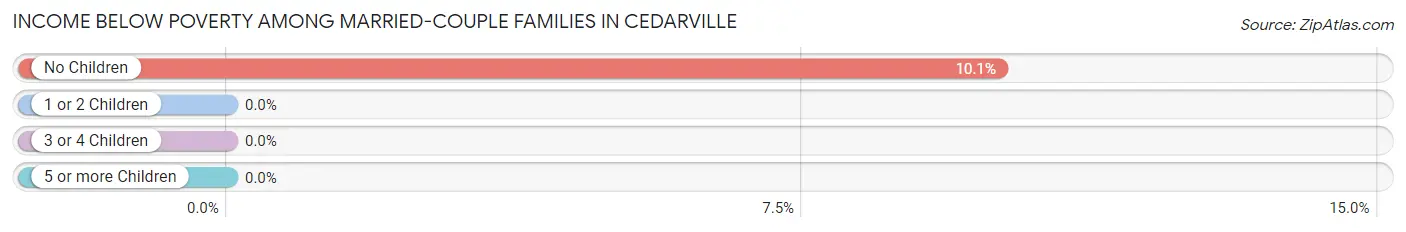
| Children | Above Poverty | Below Poverty |
| No Children | 188 (89.9%) | 21 (10.1%) |
| 1 or 2 Children | 64 (100.0%) | 0 (0.0%) |
| 3 or 4 Children | 27 (100.0%) | 0 (0.0%) |
| 5 or more Children | 7 (100.0%) | 0 (0.0%) |
| Total | 286 (93.2%) | 21 (6.8%) |
Income Below Poverty Among Single-Parent Households in Cedarville
According to the poverty data in Cedarville, 57.9% or 11 single-father households and 39.7% or 27 single-mother households are living below the poverty line. Among single-father households, those with 1 or 2 children have the highest poverty rate, with 11 households (68.8%) experiencing poverty. Likewise, among single-mother households, those with 5 or more children have the highest poverty rate, with 10 households (100.0%) falling below the poverty line.
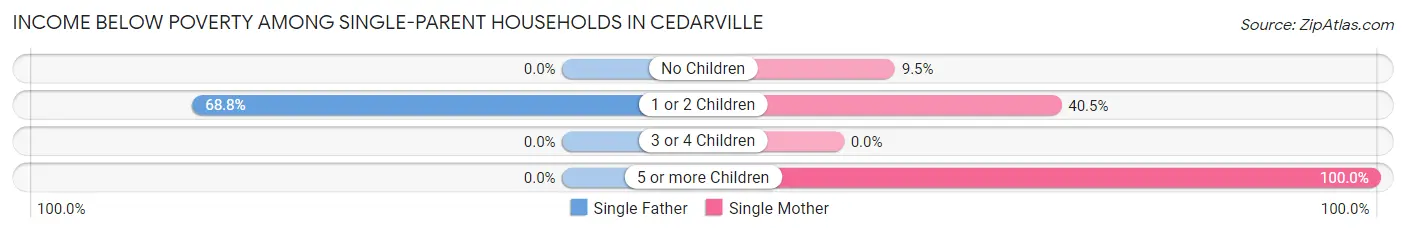
| Children | Single Father | Single Mother |
| No Children | 0 (0.0%) | 2 (9.5%) |
| 1 or 2 Children | 11 (68.8%) | 15 (40.5%) |
| 3 or 4 Children | 0 (0.0%) | 0 (0.0%) |
| 5 or more Children | 0 (0.0%) | 10 (100.0%) |
| Total | 11 (57.9%) | 27 (39.7%) |
Income Below Poverty Among Married-Couple vs Single-Parent Households in Cedarville
The poverty data for Cedarville shows that 21 of the married-couple family households (6.8%) and 38 of the single-parent households (43.7%) are living below the poverty level. Within the married-couple family households, those with no children have the highest poverty rate, with 21 households (10.1%) falling below the poverty line. Among the single-parent households, those with 5 or more children have the highest poverty rate, with 10 household (100.0%) living below poverty.
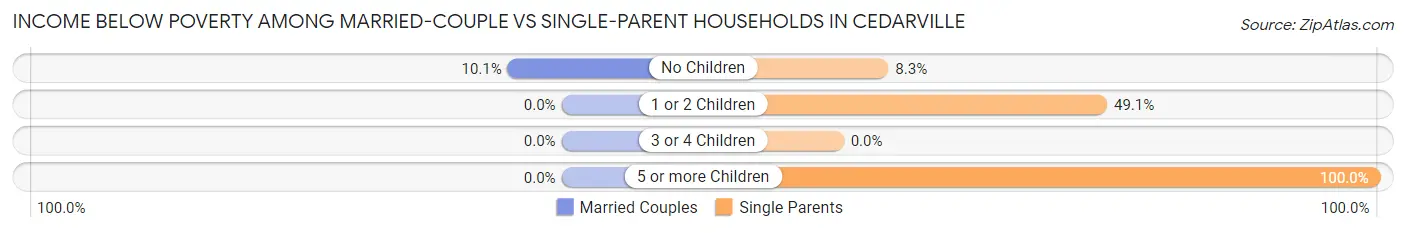
| Children | Married-Couple Families | Single-Parent Households |
| No Children | 21 (10.1%) | 2 (8.3%) |
| 1 or 2 Children | 0 (0.0%) | 26 (49.1%) |
| 3 or 4 Children | 0 (0.0%) | 0 (0.0%) |
| 5 or more Children | 0 (0.0%) | 10 (100.0%) |
| Total | 21 (6.8%) | 38 (43.7%) |
Race in Cedarville
The most populous races in Cedarville are White / Caucasian (3,022 | 77.2%), Black / African American (587 | 15.0%), and Two or more Races (171 | 4.4%).
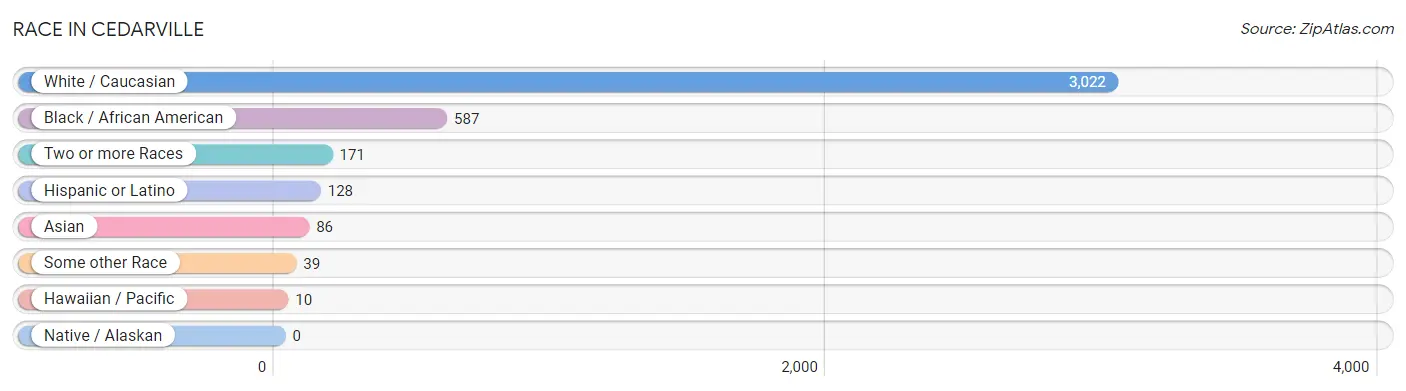
| Race | # Population | % Population |
| Asian | 86 | 2.2% |
| Black / African American | 587 | 15.0% |
| Hawaiian / Pacific | 10 | 0.3% |
| Hispanic or Latino | 128 | 3.3% |
| Native / Alaskan | 0 | 0.0% |
| White / Caucasian | 3,022 | 77.2% |
| Two or more Races | 171 | 4.4% |
| Some other Race | 39 | 1.0% |
| Total | 3,915 | 100.0% |
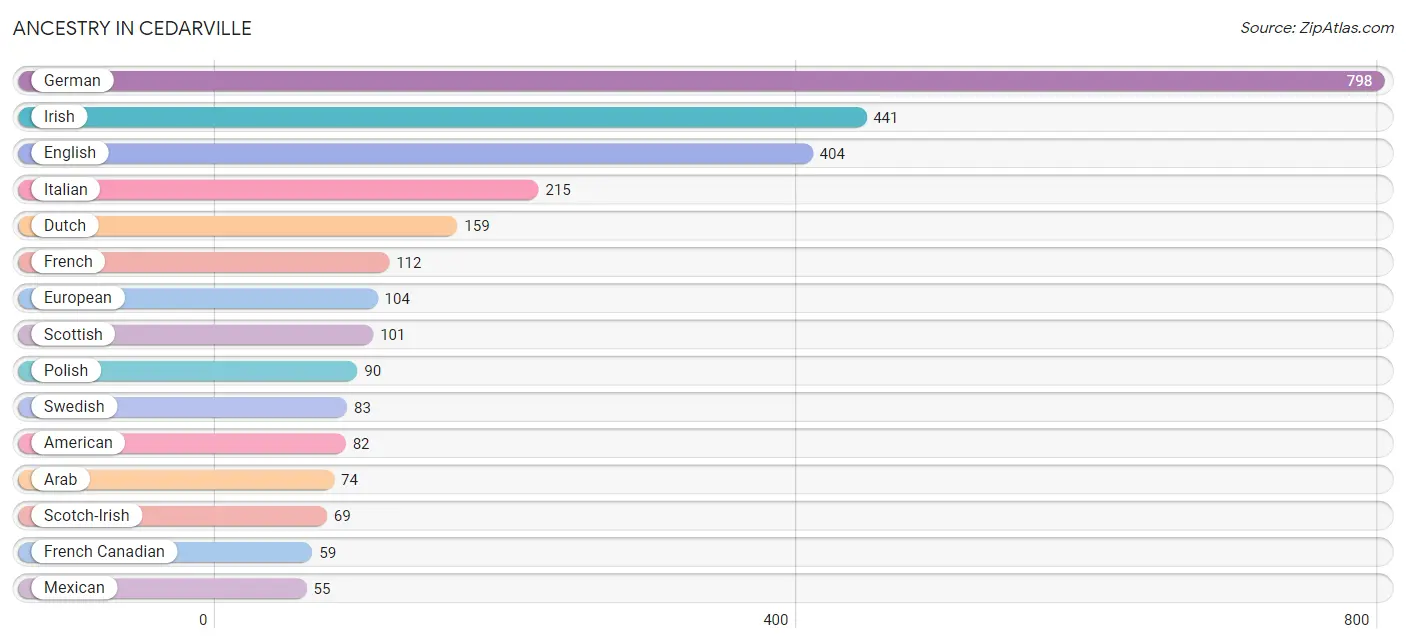
Ancestry in Cedarville
The most populous ancestries reported in Cedarville are German (798 | 20.4%), Irish (441 | 11.3%), English (404 | 10.3%), Italian (215 | 5.5%), and Dutch (159 | 4.1%), together accounting for 51.5% of all Cedarville residents.
| Ancestry | # Population | % Population |
| African | 46 | 1.2% |
| American | 82 | 2.1% |
| Arab | 74 | 1.9% |
| Australian | 4 | 0.1% |
| Bahamian | 20 | 0.5% |
| Bhutanese | 17 | 0.4% |
| British | 15 | 0.4% |
| Bulgarian | 5 | 0.1% |
| Burmese | 13 | 0.3% |
| Canadian | 39 | 1.0% |
| Central American | 10 | 0.3% |
| Cherokee | 12 | 0.3% |
| Croatian | 12 | 0.3% |
| Czech | 3 | 0.1% |
| Czechoslovakian | 6 | 0.2% |
| Danish | 4 | 0.1% |
| Dutch | 159 | 4.1% |
| Ecuadorian | 35 | 0.9% |
| English | 404 | 10.3% |
| European | 104 | 2.7% |
| Filipino | 1 | 0.0% |
| Finnish | 6 | 0.2% |
| French | 112 | 2.9% |
| French Canadian | 59 | 1.5% |
| German | 798 | 20.4% |
| Greek | 32 | 0.8% |
| Guatemalan | 5 | 0.1% |
| Hungarian | 31 | 0.8% |
| Indian (Asian) | 33 | 0.8% |
| Irish | 441 | 11.3% |
| Iroquois | 1 | 0.0% |
| Italian | 215 | 5.5% |
| Jamaican | 12 | 0.3% |
| Korean | 7 | 0.2% |
| Latvian | 7 | 0.2% |
| Mexican | 55 | 1.4% |
| Northern European | 3 | 0.1% |
| Norwegian | 18 | 0.5% |
| Pakistani | 4 | 0.1% |
| Pennsylvania German | 4 | 0.1% |
| Peruvian | 9 | 0.2% |
| Polish | 90 | 2.3% |
| Portuguese | 5 | 0.1% |
| Puerto Rican | 16 | 0.4% |
| Romanian | 1 | 0.0% |
| Russian | 12 | 0.3% |
| Salvadoran | 5 | 0.1% |
| Scandinavian | 6 | 0.2% |
| Scotch-Irish | 69 | 1.8% |
| Scottish | 101 | 2.6% |
| Serbian | 13 | 0.3% |
| Slovak | 9 | 0.2% |
| South American | 44 | 1.1% |
| Spaniard | 3 | 0.1% |
| Sri Lankan | 13 | 0.3% |
| Subsaharan African | 46 | 1.2% |
| Swedish | 83 | 2.1% |
| Swiss | 20 | 0.5% |
| Syrian | 6 | 0.2% |
| Thai | 39 | 1.0% |
| Ukrainian | 2 | 0.1% |
| Welsh | 30 | 0.8% |
| Yup'ik | 9 | 0.2% | View All 63 Rows |
Immigrants in Cedarville
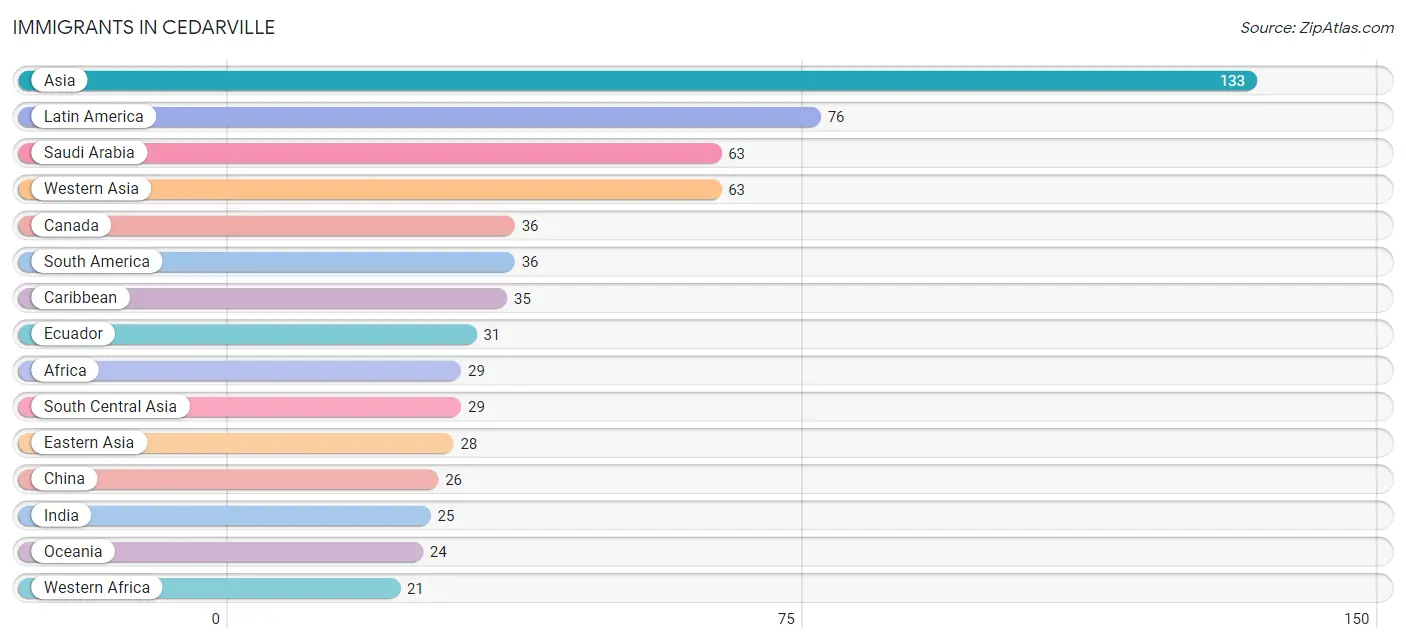
The most numerous immigrant groups reported in Cedarville came from Asia (133 | 3.4%), Latin America (76 | 1.9%), Saudi Arabia (63 | 1.6%), Western Asia (63 | 1.6%), and Canada (36 | 0.9%), together accounting for 9.5% of all Cedarville residents.
| Immigration Origin | # Population | % Population |
| Africa | 29 | 0.7% |
| Asia | 133 | 3.4% |
| Australia | 14 | 0.4% |
| Bahamas | 20 | 0.5% |
| Bulgaria | 5 | 0.1% |
| Canada | 36 | 0.9% |
| Caribbean | 35 | 0.9% |
| Central America | 5 | 0.1% |
| China | 26 | 0.7% |
| Dominican Republic | 3 | 0.1% |
| Eastern Africa | 8 | 0.2% |
| Eastern Asia | 28 | 0.7% |
| Eastern Europe | 5 | 0.1% |
| Ecuador | 31 | 0.8% |
| Europe | 18 | 0.5% |
| Germany | 10 | 0.3% |
| Guatemala | 5 | 0.1% |
| India | 25 | 0.6% |
| Jamaica | 12 | 0.3% |
| Korea | 2 | 0.1% |
| Latin America | 76 | 1.9% |
| Malaysia | 5 | 0.1% |
| Nepal | 4 | 0.1% |
| Oceania | 24 | 0.6% |
| Peru | 5 | 0.1% |
| Saudi Arabia | 63 | 1.6% |
| South America | 36 | 0.9% |
| South Central Asia | 29 | 0.7% |
| South Eastern Asia | 13 | 0.3% |
| Southern Europe | 3 | 0.1% |
| Spain | 3 | 0.1% |
| Taiwan | 1 | 0.0% |
| Vietnam | 8 | 0.2% |
| Western Africa | 21 | 0.5% |
| Western Asia | 63 | 1.6% |
| Western Europe | 10 | 0.3% |
| Zimbabwe | 4 | 0.1% | View All 37 Rows |
Sex and Age in Cedarville
Sex and Age in Cedarville
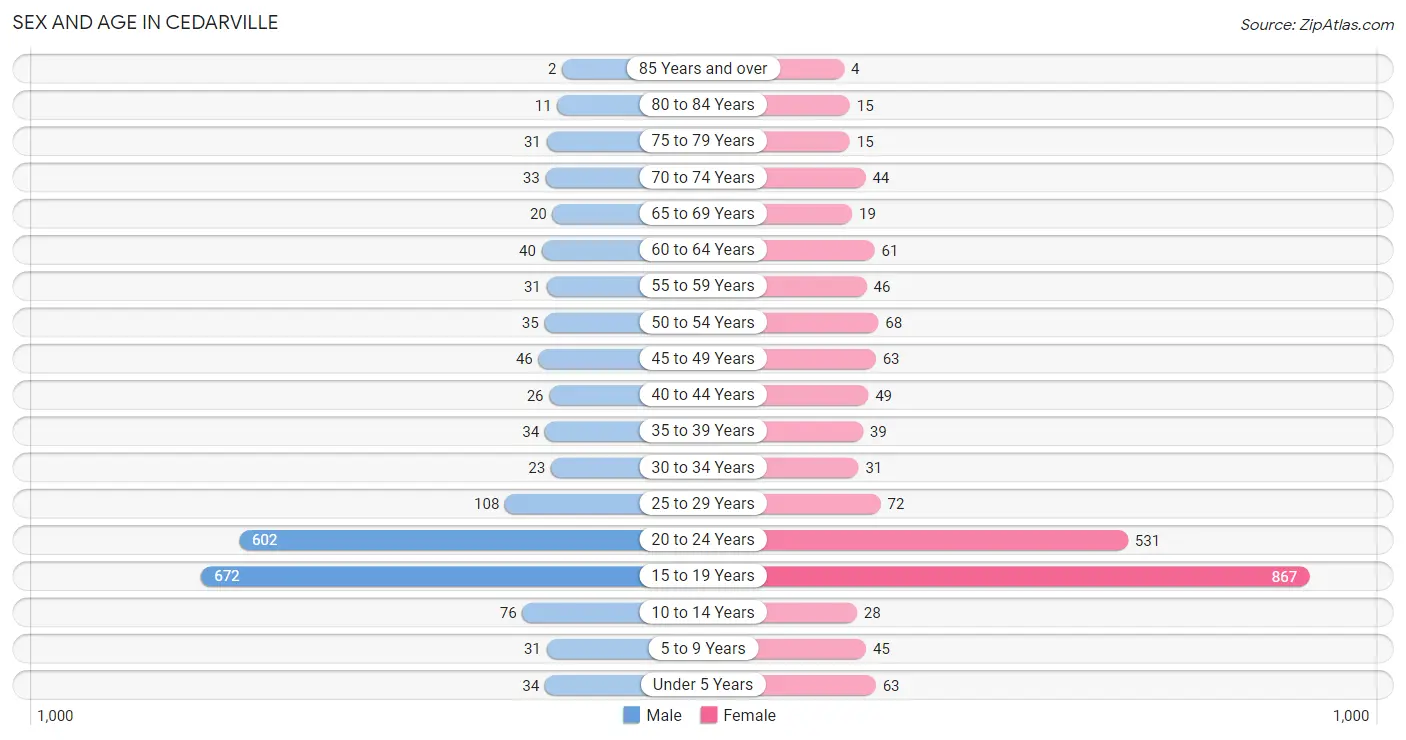
The most populous age groups in Cedarville are 15 to 19 Years (672 | 36.2%) for men and 15 to 19 Years (867 | 42.1%) for women.
| Age Bracket | Male | Female |
| Under 5 Years | 34 (1.8%) | 63 (3.1%) |
| 5 to 9 Years | 31 (1.7%) | 45 (2.2%) |
| 10 to 14 Years | 76 (4.1%) | 28 (1.4%) |
| 15 to 19 Years | 672 (36.2%) | 867 (42.1%) |
| 20 to 24 Years | 602 (32.5%) | 531 (25.8%) |
| 25 to 29 Years | 108 (5.8%) | 72 (3.5%) |
| 30 to 34 Years | 23 (1.2%) | 31 (1.5%) |
| 35 to 39 Years | 34 (1.8%) | 39 (1.9%) |
| 40 to 44 Years | 26 (1.4%) | 49 (2.4%) |
| 45 to 49 Years | 46 (2.5%) | 63 (3.1%) |
| 50 to 54 Years | 35 (1.9%) | 68 (3.3%) |
| 55 to 59 Years | 31 (1.7%) | 46 (2.2%) |
| 60 to 64 Years | 40 (2.2%) | 61 (3.0%) |
| 65 to 69 Years | 20 (1.1%) | 19 (0.9%) |
| 70 to 74 Years | 33 (1.8%) | 44 (2.1%) |
| 75 to 79 Years | 31 (1.7%) | 15 (0.7%) |
| 80 to 84 Years | 11 (0.6%) | 15 (0.7%) |
| 85 Years and over | 2 (0.1%) | 4 (0.2%) |
| Total | 1,855 (100.0%) | 2,060 (100.0%) |
Families and Households in Cedarville
Median Family Size in Cedarville
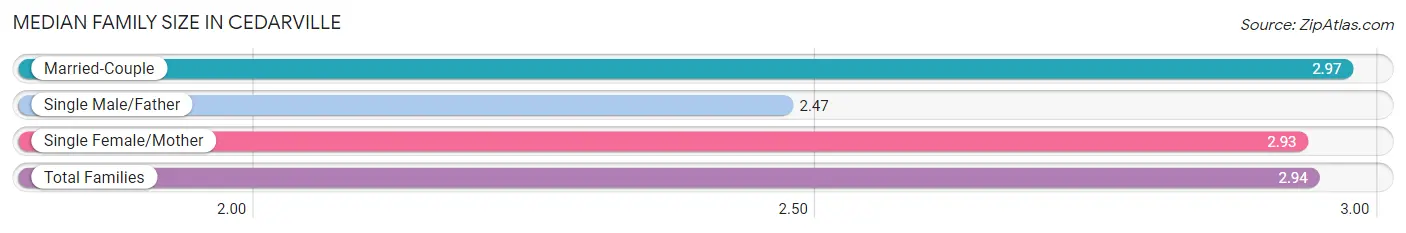
The median family size in Cedarville is 2.94 persons per family, with married-couple families (307 | 77.9%) accounting for the largest median family size of 2.97 persons per family. On the other hand, single male/father families (19 | 4.8%) represent the smallest median family size with 2.47 persons per family.
| Family Type | # Families | Family Size |
| Married-Couple | 307 (77.9%) | 2.97 |
| Single Male/Father | 19 (4.8%) | 2.47 |
| Single Female/Mother | 68 (17.3%) | 2.93 |
| Total Families | 394 (100.0%) | 2.94 |
Median Household Size in Cedarville
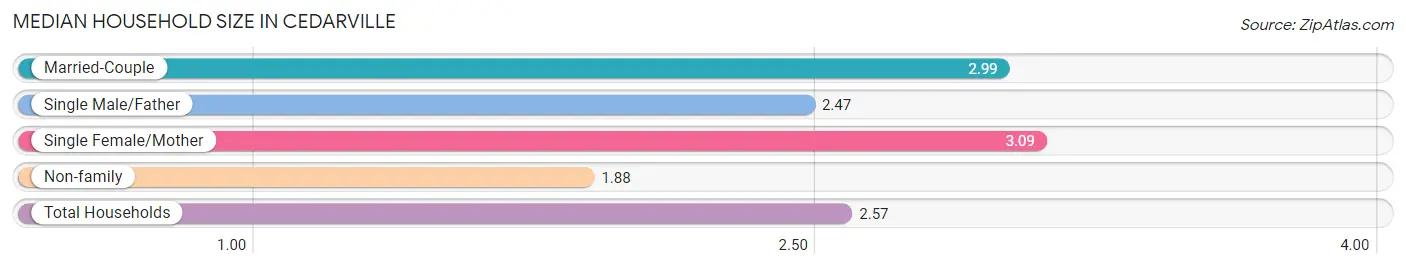
The median household size in Cedarville is 2.57 persons per household, with single female/mother households (68 | 10.8%) accounting for the largest median household size of 3.09 persons per household. non-family households (233 | 37.2%) represent the smallest median household size with 1.88 persons per household.
| Household Type | # Households | Household Size |
| Married-Couple | 307 (49.0%) | 2.99 |
| Single Male/Father | 19 (3.0%) | 2.47 |
| Single Female/Mother | 68 (10.8%) | 3.09 |
| Non-family | 233 (37.2%) | 1.88 |
| Total Households | 627 (100.0%) | 2.57 |
Household Size by Marriage Status in Cedarville
Out of a total of 627 households in Cedarville, 394 (62.8%) are family households, while 233 (37.2%) are nonfamily households. The most numerous type of family households are 2-person households, comprising 254, and the most common type of nonfamily households are 1-person households, comprising 168.
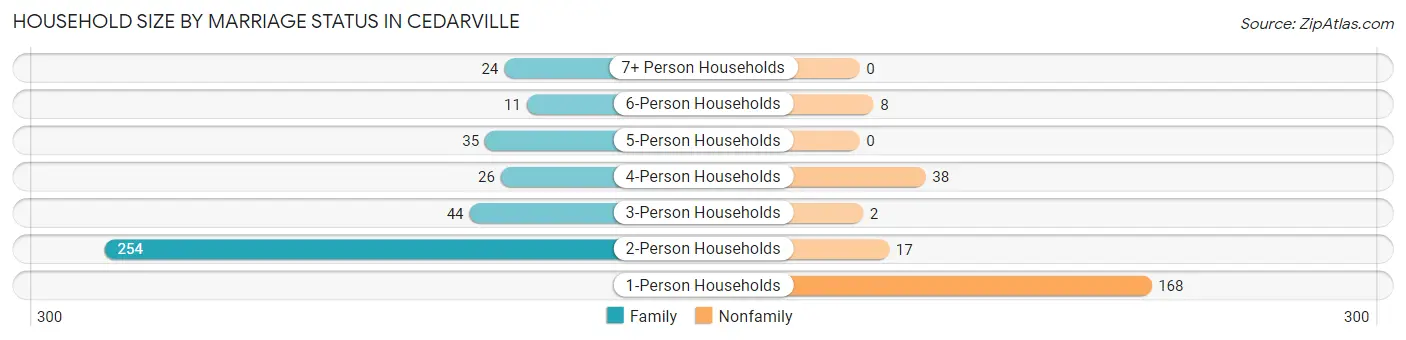
| Household Size | Family Households | Nonfamily Households |
| 1-Person Households | - | 168 (26.8%) |
| 2-Person Households | 254 (40.5%) | 17 (2.7%) |
| 3-Person Households | 44 (7.0%) | 2 (0.3%) |
| 4-Person Households | 26 (4.2%) | 38 (6.1%) |
| 5-Person Households | 35 (5.6%) | 0 (0.0%) |
| 6-Person Households | 11 (1.8%) | 8 (1.3%) |
| 7+ Person Households | 24 (3.8%) | 0 (0.0%) |
| Total | 394 (62.8%) | 233 (37.2%) |
Female Fertility in Cedarville
Fertility by Age in Cedarville
Average fertility rate in Cedarville is 19.0 births per 1,000 women. Women in the age bracket of 35 to 50 years have the highest fertility rate with 138.0 births per 1,000 women. Women in the age bracket of 35 to 50 years acount for 68.8% of all women with births.
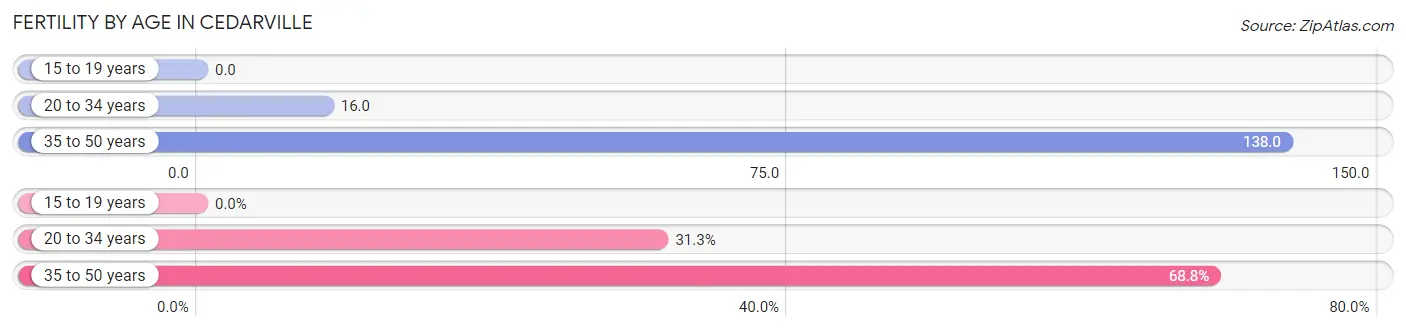
| Age Bracket | Women with Births | Births / 1,000 Women |
| 15 to 19 years | 0 (0.0%) | 0.0 |
| 20 to 34 years | 10 (31.2%) | 16.0 |
| 35 to 50 years | 22 (68.8%) | 138.0 |
| Total | 32 (100.0%) | 19.0 |
Fertility by Age by Marriage Status in Cedarville
56.2% of women with births (32) in Cedarville are married. The highest percentage of unmarried women with births falls into 35 to 50 years age bracket with 45.5% of them unmarried at the time of birth, while the lowest percentage of unmarried women with births belong to 20 to 34 years age bracket with 40.0% of them unmarried.
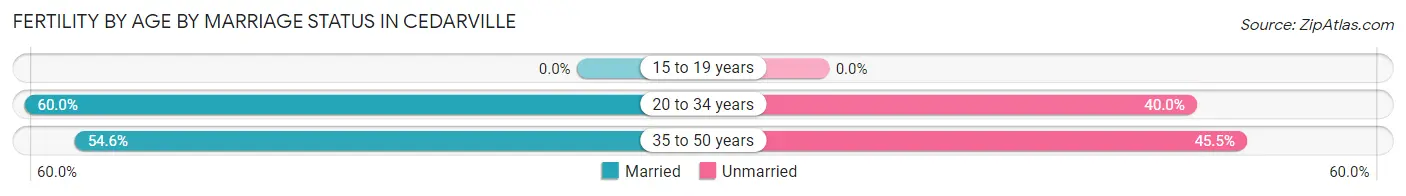
| Age Bracket | Married | Unmarried |
| 15 to 19 years | 0 (0.0%) | 0 (0.0%) |
| 20 to 34 years | 6 (60.0%) | 4 (40.0%) |
| 35 to 50 years | 12 (54.5%) | 10 (45.5%) |
| Total | 18 (56.2%) | 14 (43.8%) |
Fertility by Education in Cedarville
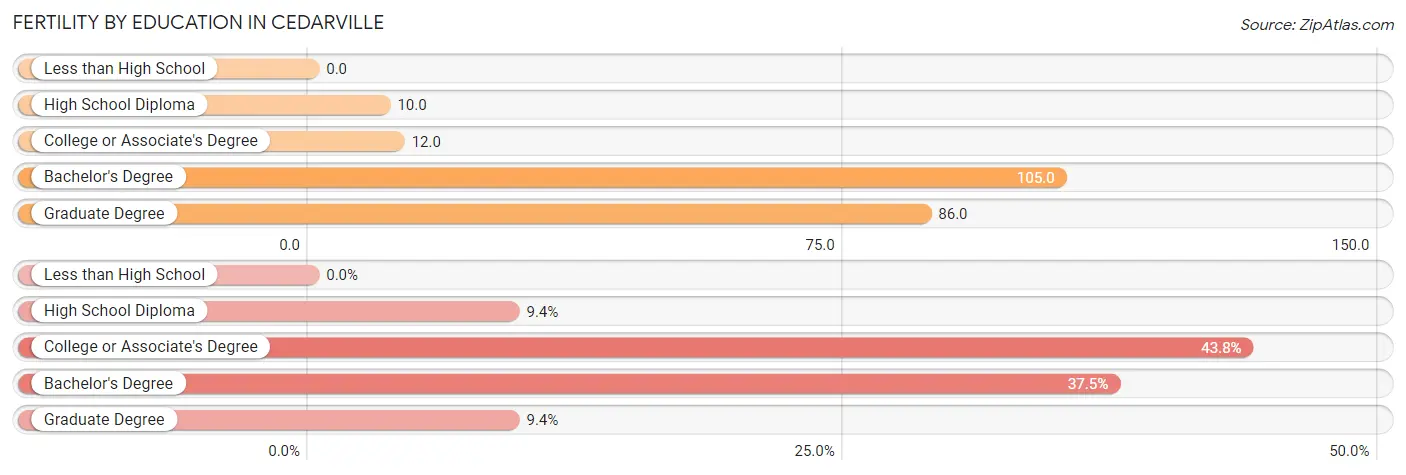
| Educational Attainment | Women with Births | Births / 1,000 Women |
| Less than High School | 0 (0.0%) | 0.0 |
| High School Diploma | 3 (9.4%) | 10.0 |
| College or Associate's Degree | 14 (43.8%) | 12.0 |
| Bachelor's Degree | 12 (37.5%) | 105.0 |
| Graduate Degree | 3 (9.4%) | 86.0 |
| Total | 32 (100.0%) | 19.0 |
Fertility by Education by Marriage Status in Cedarville
43.8% of women with births in Cedarville are unmarried. Women with the educational attainment of high school diploma are most likely to be married with 100.0% of them married at childbirth, while women with the educational attainment of college or associate's degree are least likely to be married with 100.0% of them unmarried at childbirth.
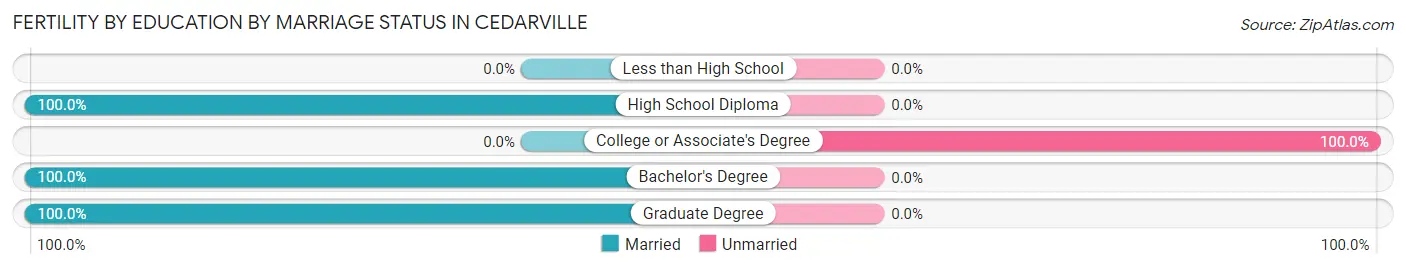
| Educational Attainment | Married | Unmarried |
| Less than High School | 0 (0.0%) | 0 (0.0%) |
| High School Diploma | 3 (100.0%) | 0 (0.0%) |
| College or Associate's Degree | 0 (0.0%) | 14 (100.0%) |
| Bachelor's Degree | 12 (100.0%) | 0 (0.0%) |
| Graduate Degree | 3 (100.0%) | 0 (0.0%) |
| Total | 18 (56.2%) | 14 (43.8%) |
Employment Characteristics in Cedarville
Employment by Class of Employer in Cedarville
Among the 1,787 employed individuals in Cedarville, private company employees (991 | 55.5%), not-for-profit organizations (517 | 28.9%), and state government employees (133 | 7.4%) make up the most common classes of employment.
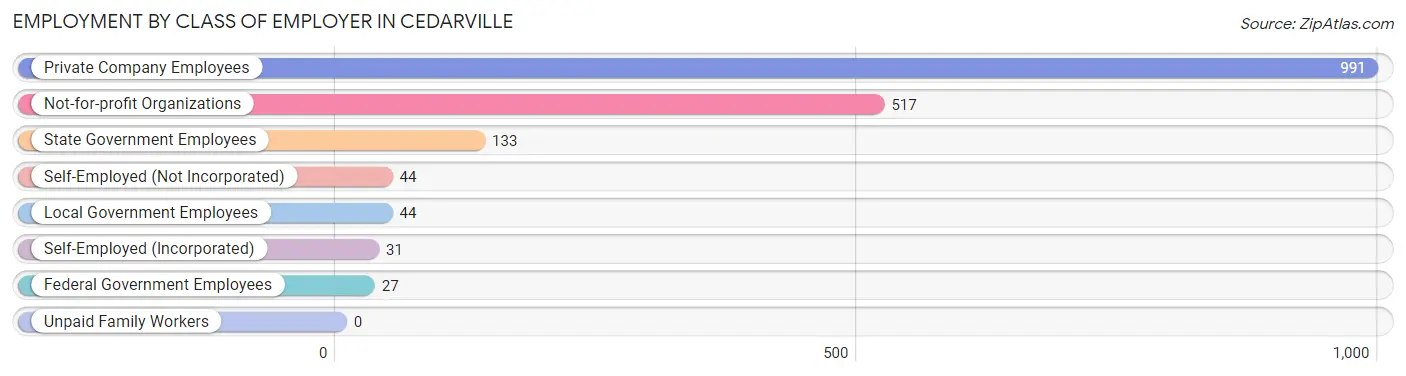
| Employer Class | # Employees | % Employees |
| Private Company Employees | 991 | 55.5% |
| Self-Employed (Incorporated) | 31 | 1.7% |
| Self-Employed (Not Incorporated) | 44 | 2.5% |
| Not-for-profit Organizations | 517 | 28.9% |
| Local Government Employees | 44 | 2.5% |
| State Government Employees | 133 | 7.4% |
| Federal Government Employees | 27 | 1.5% |
| Unpaid Family Workers | 0 | 0.0% |
| Total | 1,787 | 100.0% |
Employment Status by Age in Cedarville
According to the labor force statistics for Cedarville, out of the total population over 16 years of age (3,617), 58.1% or 2,101 individuals are in the labor force, with 9.1% or 191 of them unemployed. The age group with the highest labor force participation rate is 60 to 64 years, with 76.2% or 77 individuals in the labor force. Within the labor force, the 16 to 19 years age range has the highest percentage of unemployed individuals, with 17.4% or 136 of them being unemployed.
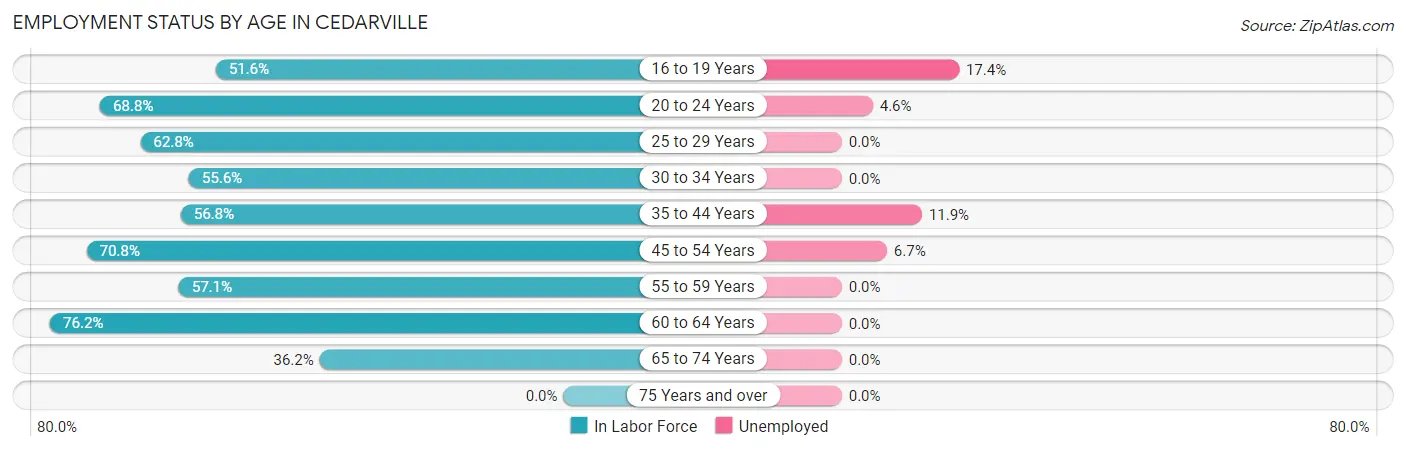
| Age Bracket | In Labor Force | Unemployed |
| 16 to 19 Years | 783 (51.6%) | 136 (17.4%) |
| 20 to 24 Years | 780 (68.8%) | 36 (4.6%) |
| 25 to 29 Years | 113 (62.8%) | 0 (0.0%) |
| 30 to 34 Years | 30 (55.6%) | 0 (0.0%) |
| 35 to 44 Years | 84 (56.8%) | 10 (11.9%) |
| 45 to 54 Years | 150 (70.8%) | 10 (6.7%) |
| 55 to 59 Years | 44 (57.1%) | 0 (0.0%) |
| 60 to 64 Years | 77 (76.2%) | 0 (0.0%) |
| 65 to 74 Years | 42 (36.2%) | 0 (0.0%) |
| 75 Years and over | 0 (0.0%) | 0 (0.0%) |
| Total | 2,101 (58.1%) | 191 (9.1%) |
Employment Status by Educational Attainment in Cedarville
According to labor force statistics for Cedarville, 64.5% of individuals (498) out of the total population between 25 and 64 years of age (772) are in the labor force, with 4.0% or 20 of them being unemployed. The group with the highest labor force participation rate are those with the educational attainment of bachelor's degree or higher, with 78.5% or 249 individuals in the labor force. Within the labor force, individuals with high school diploma education have the highest percentage of unemployment, with 10.9% or 10 of them being unemployed.
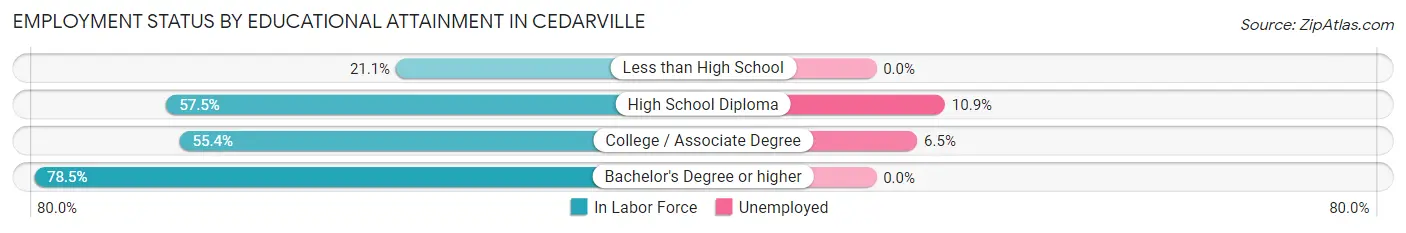
| Educational Attainment | In Labor Force | Unemployed |
| Less than High School | 4 (21.1%) | 0 (0.0%) |
| High School Diploma | 92 (57.5%) | 17 (10.9%) |
| College / Associate Degree | 153 (55.4%) | 18 (6.5%) |
| Bachelor's Degree or higher | 249 (78.5%) | 0 (0.0%) |
| Total | 498 (64.5%) | 31 (4.0%) |
Employment Occupations by Sex in Cedarville
Management, Business, Science and Arts Occupations
The most common Management, Business, Science and Arts occupations in Cedarville are Community & Social Service (346 | 18.2%), Education Instruction & Library (228 | 12.0%), Management (86 | 4.5%), Business & Financial (79 | 4.2%), and Health Diagnosing & Treating (79 | 4.2%).
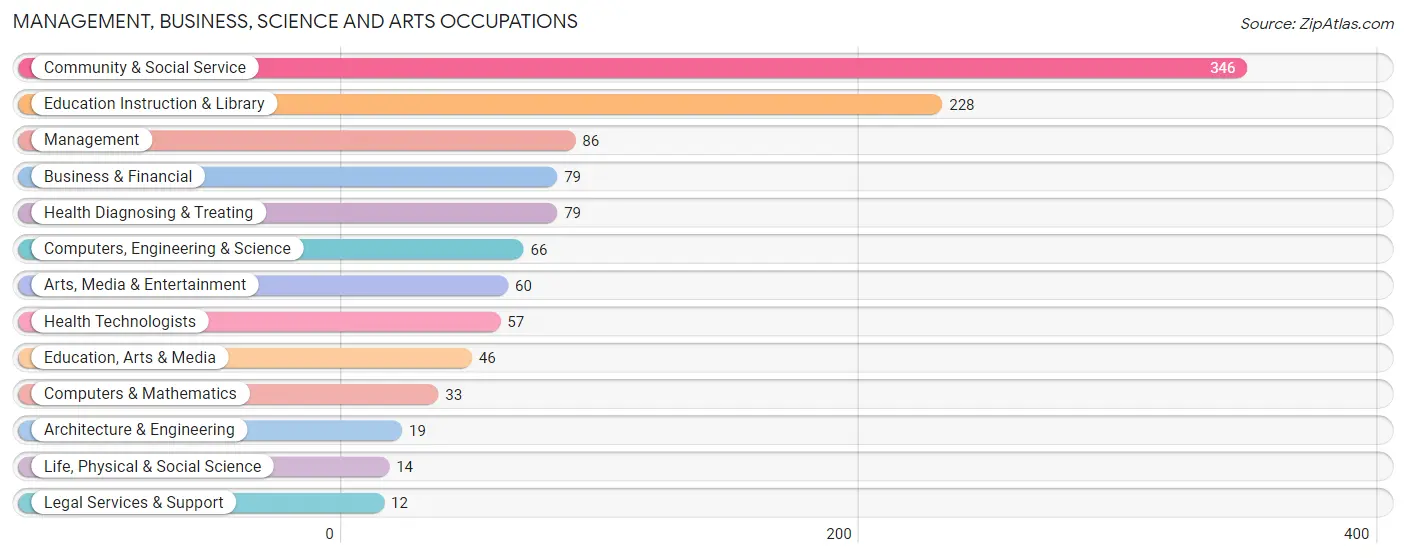
Management, Business, Science and Arts Occupations by Sex
Within the Management, Business, Science and Arts occupations in Cedarville, the most male-oriented occupations are Computers, Engineering & Science (100.0%), Computers & Mathematics (100.0%), and Architecture & Engineering (100.0%), while the most female-oriented occupations are Legal Services & Support (75.0%), Health Diagnosing & Treating (64.6%), and Health Technologists (61.4%).
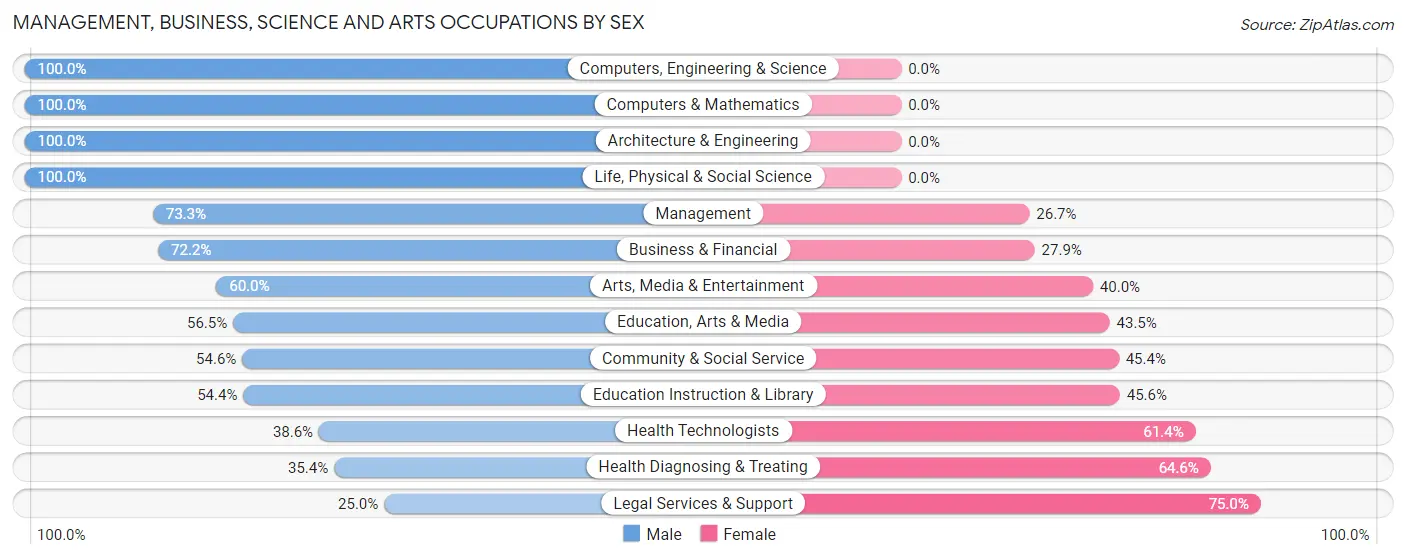
| Occupation | Male | Female |
| Management | 63 (73.3%) | 23 (26.7%) |
| Business & Financial | 57 (72.2%) | 22 (27.9%) |
| Computers, Engineering & Science | 66 (100.0%) | 0 (0.0%) |
| Computers & Mathematics | 33 (100.0%) | 0 (0.0%) |
| Architecture & Engineering | 19 (100.0%) | 0 (0.0%) |
| Life, Physical & Social Science | 14 (100.0%) | 0 (0.0%) |
| Community & Social Service | 189 (54.6%) | 157 (45.4%) |
| Education, Arts & Media | 26 (56.5%) | 20 (43.5%) |
| Legal Services & Support | 3 (25.0%) | 9 (75.0%) |
| Education Instruction & Library | 124 (54.4%) | 104 (45.6%) |
| Arts, Media & Entertainment | 36 (60.0%) | 24 (40.0%) |
| Health Diagnosing & Treating | 28 (35.4%) | 51 (64.6%) |
| Health Technologists | 22 (38.6%) | 35 (61.4%) |
| Total (Category) | 403 (61.4%) | 253 (38.6%) |
| Total (Overall) | 843 (44.4%) | 1,055 (55.6%) |
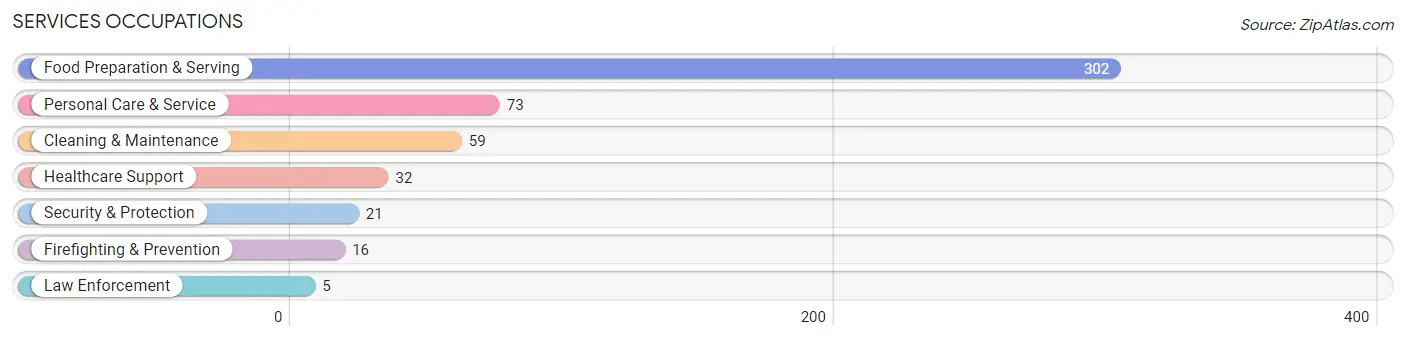
Services Occupations
The most common Services occupations in Cedarville are Food Preparation & Serving (302 | 15.9%), Personal Care & Service (73 | 3.8%), Cleaning & Maintenance (59 | 3.1%), Healthcare Support (32 | 1.7%), and Security & Protection (21 | 1.1%).
Services Occupations by Sex
Within the Services occupations in Cedarville, the most male-oriented occupations are Cleaning & Maintenance (76.3%), Healthcare Support (65.6%), and Firefighting & Prevention (62.5%), while the most female-oriented occupations are Food Preparation & Serving (75.5%), Personal Care & Service (67.1%), and Law Enforcement (40.0%).
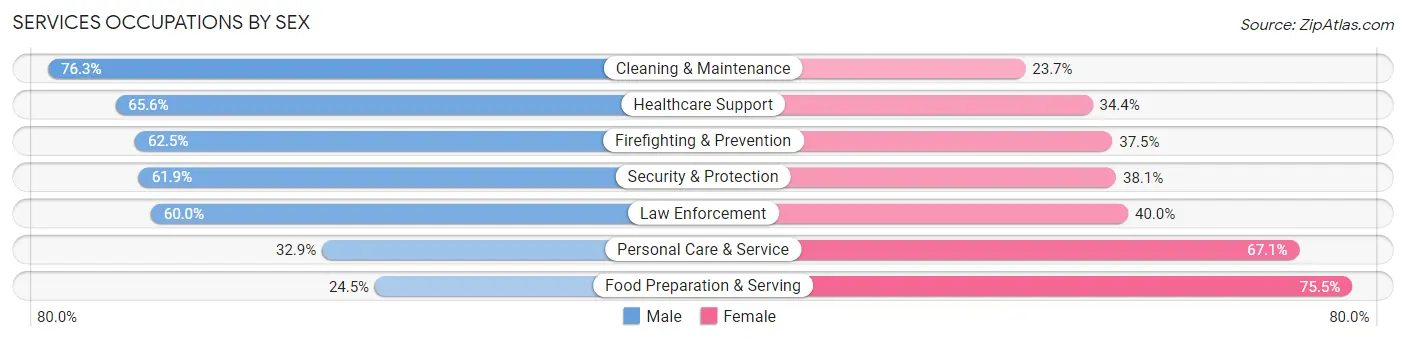
| Occupation | Male | Female |
| Healthcare Support | 21 (65.6%) | 11 (34.4%) |
| Security & Protection | 13 (61.9%) | 8 (38.1%) |
| Firefighting & Prevention | 10 (62.5%) | 6 (37.5%) |
| Law Enforcement | 3 (60.0%) | 2 (40.0%) |
| Food Preparation & Serving | 74 (24.5%) | 228 (75.5%) |
| Cleaning & Maintenance | 45 (76.3%) | 14 (23.7%) |
| Personal Care & Service | 24 (32.9%) | 49 (67.1%) |
| Total (Category) | 177 (36.3%) | 310 (63.7%) |
| Total (Overall) | 843 (44.4%) | 1,055 (55.6%) |
Sales and Office Occupations
The most common Sales and Office occupations in Cedarville are Office & Administration (363 | 19.1%), and Sales & Related (241 | 12.7%).

Sales and Office Occupations by Sex

| Occupation | Male | Female |
| Sales & Related | 84 (34.8%) | 157 (65.1%) |
| Office & Administration | 68 (18.7%) | 295 (81.3%) |
| Total (Category) | 152 (25.2%) | 452 (74.8%) |
| Total (Overall) | 843 (44.4%) | 1,055 (55.6%) |
Natural Resources, Construction and Maintenance Occupations
The most common Natural Resources, Construction and Maintenance occupations in Cedarville are Construction & Extraction (28 | 1.5%), and Installation, Maintenance & Repair (17 | 0.9%).
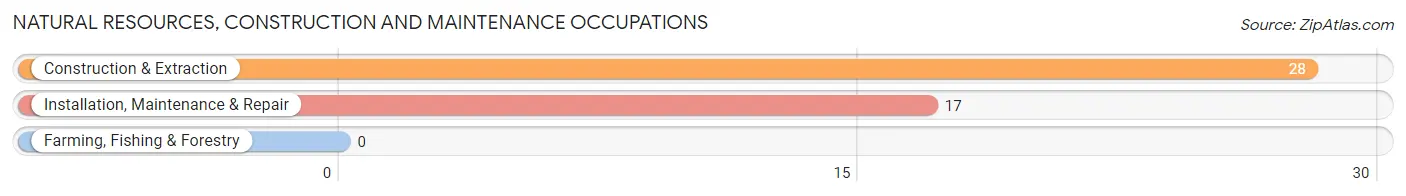
Natural Resources, Construction and Maintenance Occupations by Sex
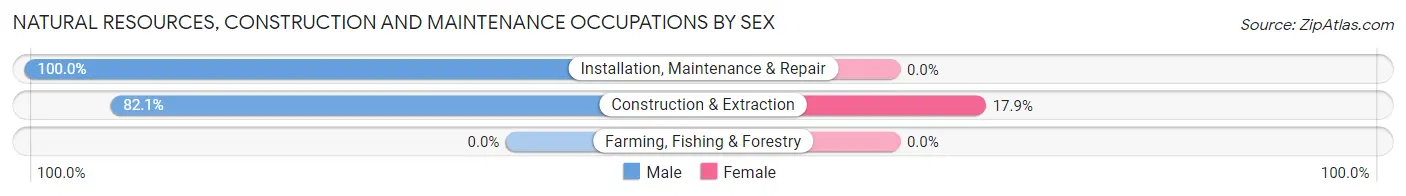
| Occupation | Male | Female |
| Farming, Fishing & Forestry | 0 (0.0%) | 0 (0.0%) |
| Construction & Extraction | 23 (82.1%) | 5 (17.9%) |
| Installation, Maintenance & Repair | 17 (100.0%) | 0 (0.0%) |
| Total (Category) | 40 (88.9%) | 5 (11.1%) |
| Total (Overall) | 843 (44.4%) | 1,055 (55.6%) |
Production, Transportation and Moving Occupations
The most common Production, Transportation and Moving occupations in Cedarville are Production (43 | 2.3%), Transportation (33 | 1.7%), and Material Moving (30 | 1.6%).
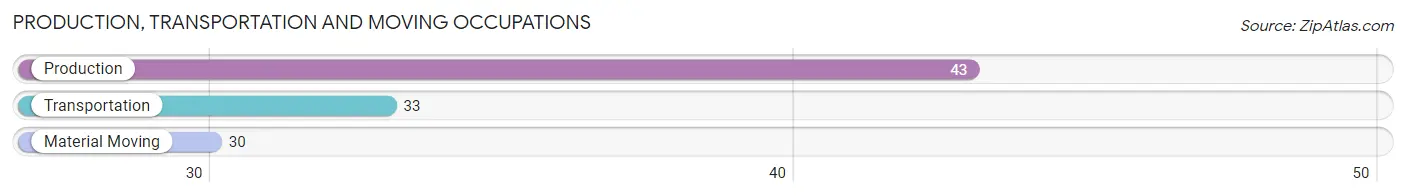
Production, Transportation and Moving Occupations by Sex

| Occupation | Male | Female |
| Production | 32 (74.4%) | 11 (25.6%) |
| Transportation | 30 (90.9%) | 3 (9.1%) |
| Material Moving | 9 (30.0%) | 21 (70.0%) |
| Total (Category) | 71 (67.0%) | 35 (33.0%) |
| Total (Overall) | 843 (44.4%) | 1,055 (55.6%) |
Employment Industries by Sex in Cedarville
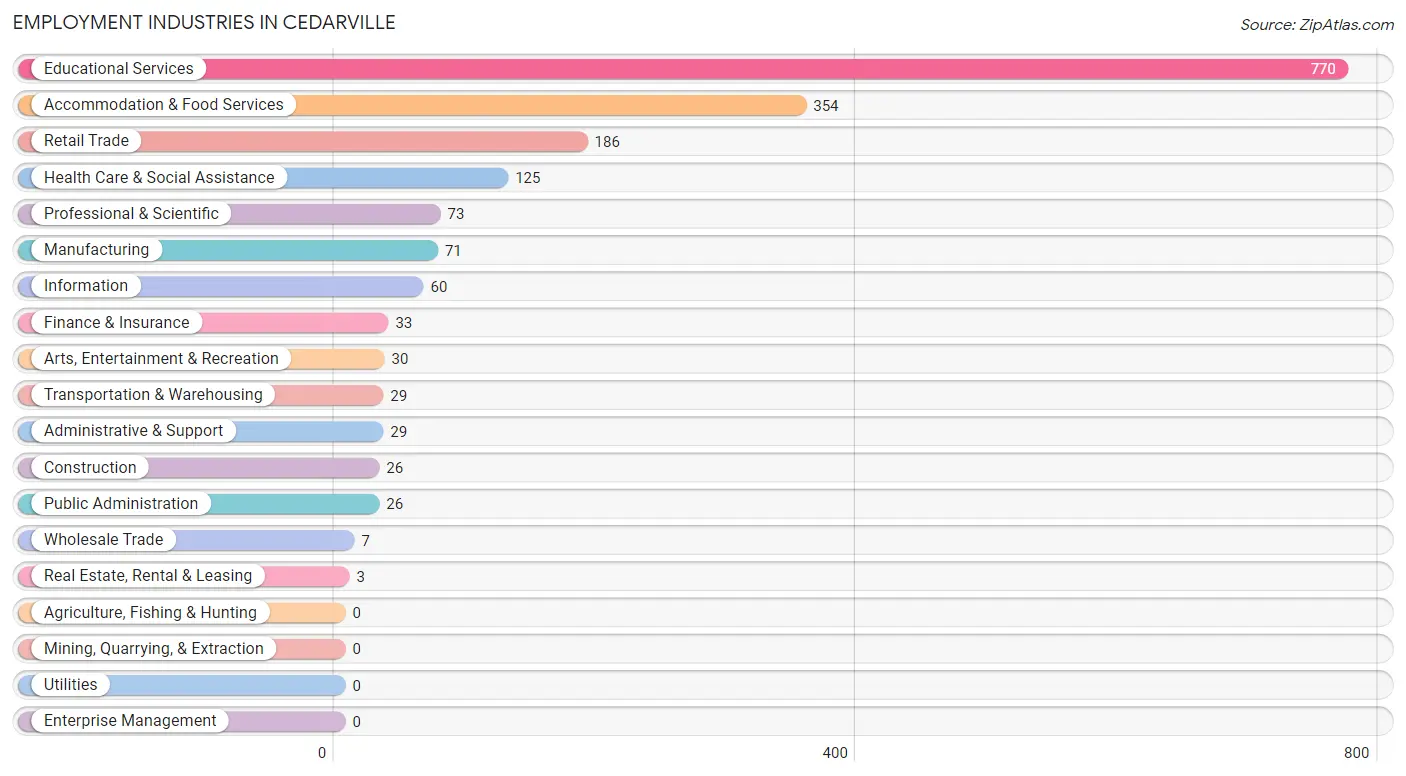
Employment Industries in Cedarville
The major employment industries in Cedarville include Educational Services (770 | 40.6%), Accommodation & Food Services (354 | 18.6%), Retail Trade (186 | 9.8%), Health Care & Social Assistance (125 | 6.6%), and Professional & Scientific (73 | 3.8%).
Employment Industries by Sex in Cedarville
The Cedarville industries that see more men than women are Construction (100.0%), Information (90.0%), and Manufacturing (78.9%), whereas the industries that tend to have a higher number of women are Real Estate, Rental & Leasing (100.0%), Transportation & Warehousing (69.0%), and Retail Trade (66.7%).
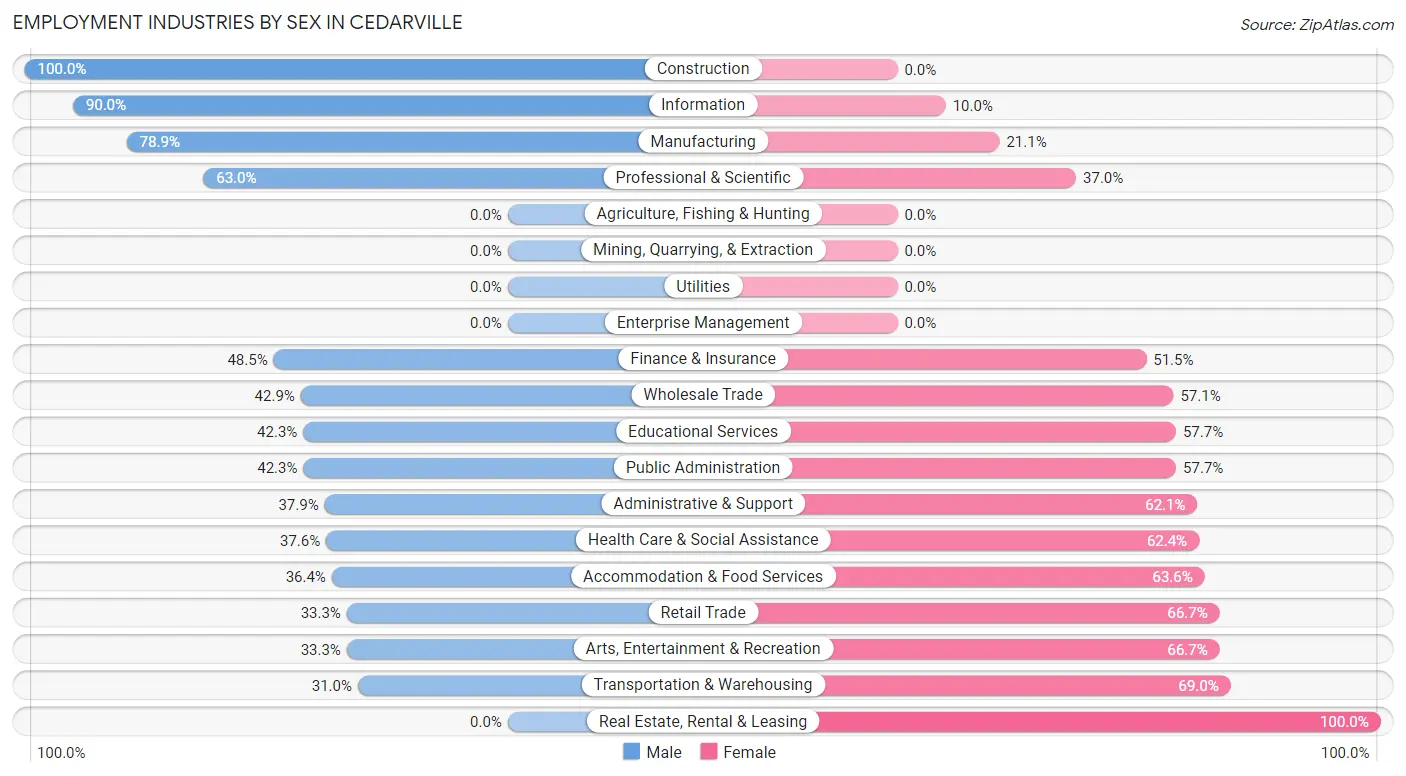
| Industry | Male | Female |
| Agriculture, Fishing & Hunting | 0 (0.0%) | 0 (0.0%) |
| Mining, Quarrying, & Extraction | 0 (0.0%) | 0 (0.0%) |
| Construction | 26 (100.0%) | 0 (0.0%) |
| Manufacturing | 56 (78.9%) | 15 (21.1%) |
| Wholesale Trade | 3 (42.9%) | 4 (57.1%) |
| Retail Trade | 62 (33.3%) | 124 (66.7%) |
| Transportation & Warehousing | 9 (31.0%) | 20 (69.0%) |
| Utilities | 0 (0.0%) | 0 (0.0%) |
| Information | 54 (90.0%) | 6 (10.0%) |
| Finance & Insurance | 16 (48.5%) | 17 (51.5%) |
| Real Estate, Rental & Leasing | 0 (0.0%) | 3 (100.0%) |
| Professional & Scientific | 46 (63.0%) | 27 (37.0%) |
| Enterprise Management | 0 (0.0%) | 0 (0.0%) |
| Administrative & Support | 11 (37.9%) | 18 (62.1%) |
| Educational Services | 326 (42.3%) | 444 (57.7%) |
| Health Care & Social Assistance | 47 (37.6%) | 78 (62.4%) |
| Arts, Entertainment & Recreation | 10 (33.3%) | 20 (66.7%) |
| Accommodation & Food Services | 129 (36.4%) | 225 (63.6%) |
| Public Administration | 11 (42.3%) | 15 (57.7%) |
| Total | 843 (44.4%) | 1,055 (55.6%) |
Education in Cedarville
School Enrollment in Cedarville
The most common levels of schooling among the 2,885 students in Cedarville are college / undergraduate (2,470 | 85.6%), graduate / professional (133 | 4.6%), and high school (99 | 3.4%).
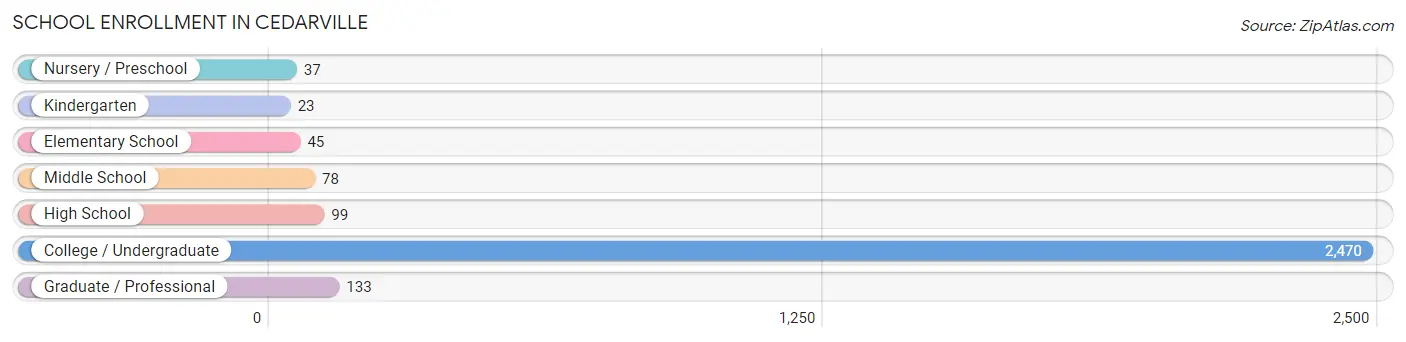
| School Level | # Students | % Students |
| Nursery / Preschool | 37 | 1.3% |
| Kindergarten | 23 | 0.8% |
| Elementary School | 45 | 1.6% |
| Middle School | 78 | 2.7% |
| High School | 99 | 3.4% |
| College / Undergraduate | 2,470 | 85.6% |
| Graduate / Professional | 133 | 4.6% |
| Total | 2,885 | 100.0% |
School Enrollment by Age by Funding Source in Cedarville
Out of a total of 2,885 students who are enrolled in schools in Cedarville, 1,659 (57.5%) attend a private institution, while the remaining 1,226 (42.5%) are enrolled in public schools. The age group of 20 to 24 year olds has the highest likelihood of being enrolled in private schools, with 682 (66.6% in the age bracket) enrolled. Conversely, the age group of 35 years and over has the lowest likelihood of being enrolled in a private school, with 49 (92.4% in the age bracket) attending a public institution.
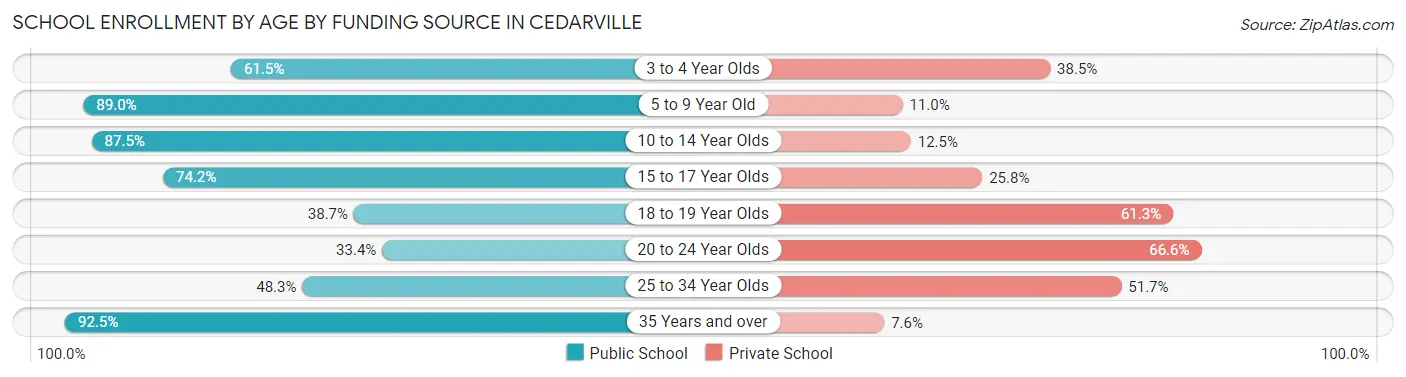
| Age Bracket | Public School | Private School |
| 3 to 4 Year Olds | 16 (61.5%) | 10 (38.5%) |
| 5 to 9 Year Old | 65 (89.0%) | 8 (11.0%) |
| 10 to 14 Year Olds | 91 (87.5%) | 13 (12.5%) |
| 15 to 17 Year Olds | 69 (74.2%) | 24 (25.8%) |
| 18 to 19 Year Olds | 551 (38.7%) | 874 (61.3%) |
| 20 to 24 Year Olds | 342 (33.4%) | 682 (66.6%) |
| 25 to 34 Year Olds | 42 (48.3%) | 45 (51.7%) |
| 35 Years and over | 49 (92.4%) | 4 (7.5%) |
| Total | 1,226 (42.5%) | 1,659 (57.5%) |
Educational Attainment by Field of Study in Cedarville
Education (106 | 26.1%), science & technology (71 | 17.5%), business (40 | 9.9%), communications (39 | 9.6%), and liberal arts & history (25 | 6.2%) are the most common fields of study among 406 individuals in Cedarville who have obtained a bachelor's degree or higher.
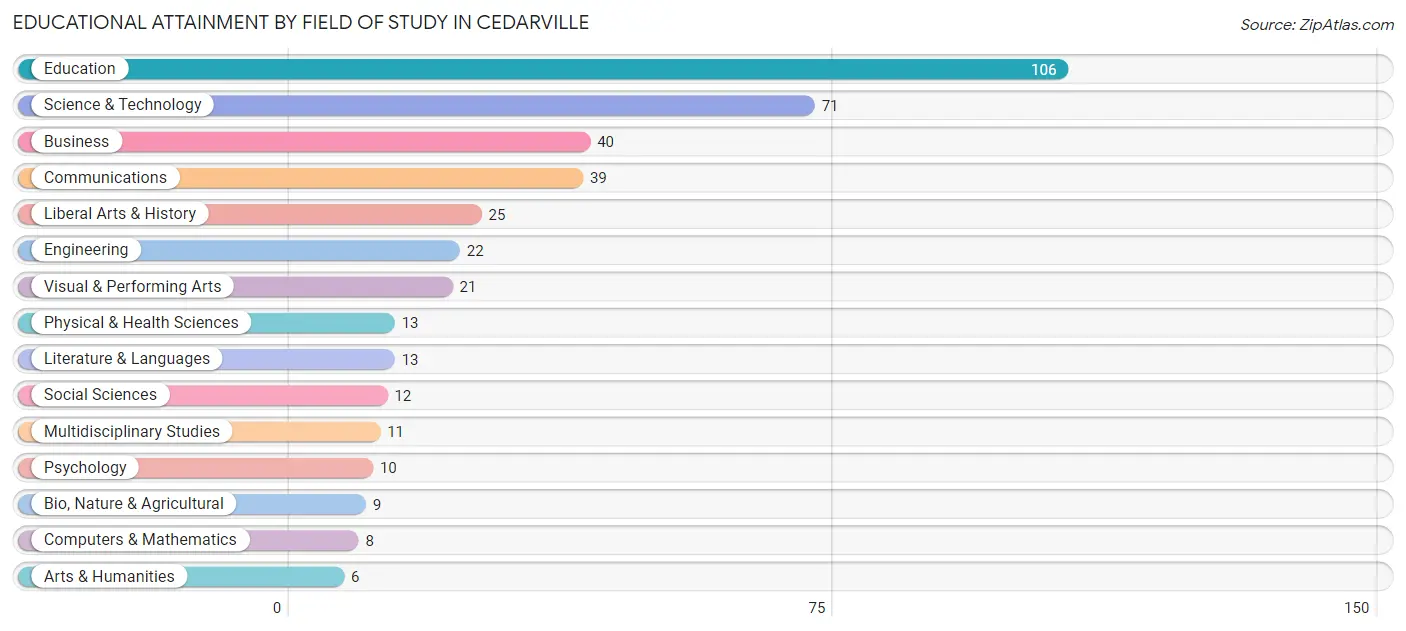
| Field of Study | # Graduates | % Graduates |
| Computers & Mathematics | 8 | 2.0% |
| Bio, Nature & Agricultural | 9 | 2.2% |
| Physical & Health Sciences | 13 | 3.2% |
| Psychology | 10 | 2.5% |
| Social Sciences | 12 | 3.0% |
| Engineering | 22 | 5.4% |
| Multidisciplinary Studies | 11 | 2.7% |
| Science & Technology | 71 | 17.5% |
| Business | 40 | 9.9% |
| Education | 106 | 26.1% |
| Literature & Languages | 13 | 3.2% |
| Liberal Arts & History | 25 | 6.2% |
| Visual & Performing Arts | 21 | 5.2% |
| Communications | 39 | 9.6% |
| Arts & Humanities | 6 | 1.5% |
| Total | 406 | 100.0% |
Transportation & Commute in Cedarville
Vehicle Availability by Sex in Cedarville
The most prevalent vehicle ownership categories in Cedarville are males with 2 vehicles (171, accounting for 44.1%) and females with 2 vehicles (177, making up 42.6%).
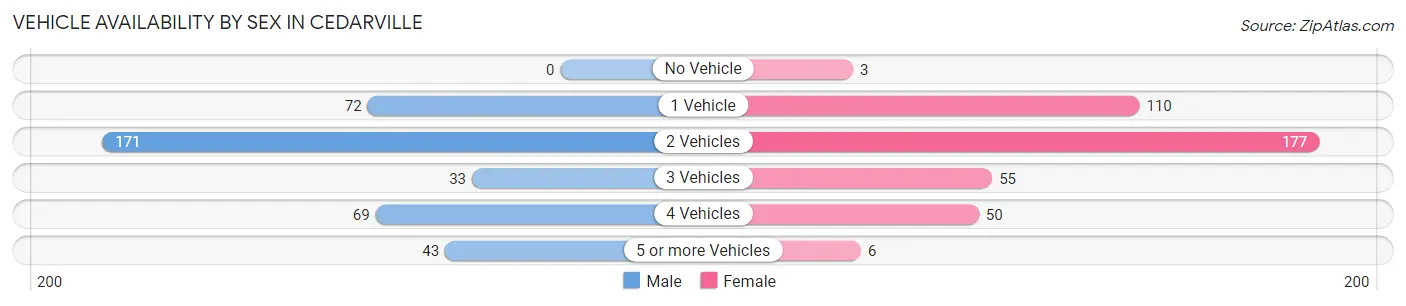
| Vehicles Available | Male | Female |
| No Vehicle | 0 (0.0%) | 3 (0.7%) |
| 1 Vehicle | 72 (18.6%) | 110 (27.4%) |
| 2 Vehicles | 171 (44.1%) | 177 (44.1%) |
| 3 Vehicles | 33 (8.5%) | 55 (13.7%) |
| 4 Vehicles | 69 (17.8%) | 50 (12.5%) |
| 5 or more Vehicles | 43 (11.1%) | 6 (1.5%) |
| Total | 388 (100.0%) | 401 (100.0%) |
Commute Time in Cedarville
The most frequently occuring commute durations in Cedarville are 5 to 9 minutes (733 commuters, 44.1%), 10 to 14 minutes (246 commuters, 14.8%), and less than 5 minutes (184 commuters, 11.1%).
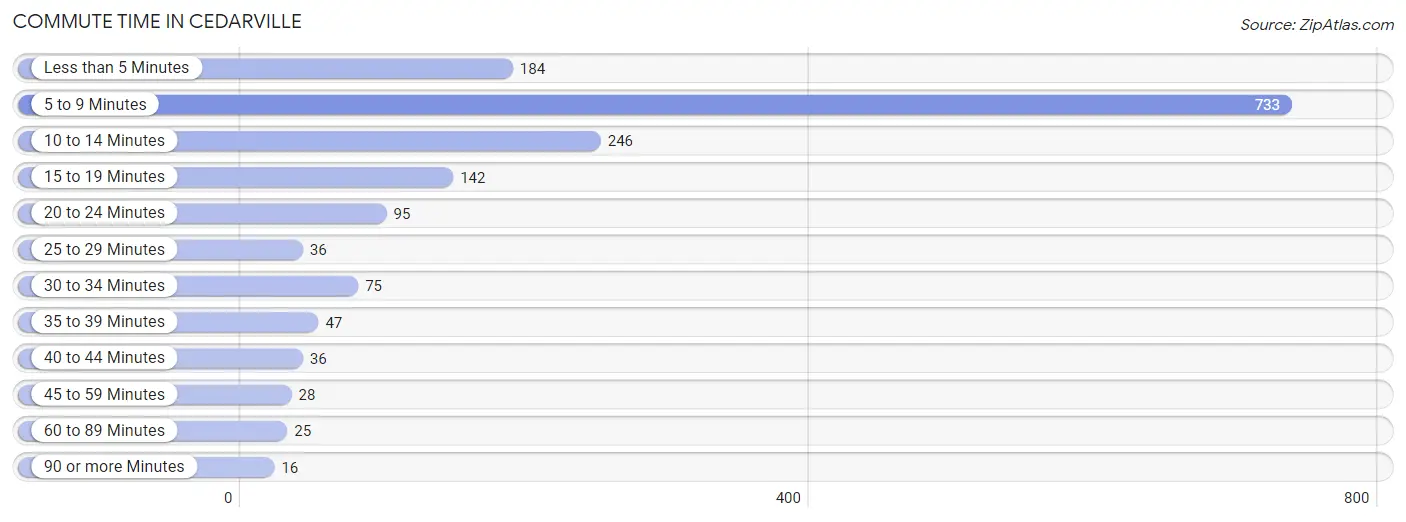
| Commute Time | # Commuters | % Commuters |
| Less than 5 Minutes | 184 | 11.1% |
| 5 to 9 Minutes | 733 | 44.1% |
| 10 to 14 Minutes | 246 | 14.8% |
| 15 to 19 Minutes | 142 | 8.5% |
| 20 to 24 Minutes | 95 | 5.7% |
| 25 to 29 Minutes | 36 | 2.2% |
| 30 to 34 Minutes | 75 | 4.5% |
| 35 to 39 Minutes | 47 | 2.8% |
| 40 to 44 Minutes | 36 | 2.2% |
| 45 to 59 Minutes | 28 | 1.7% |
| 60 to 89 Minutes | 25 | 1.5% |
| 90 or more Minutes | 16 | 1.0% |
Commute Time by Sex in Cedarville
The most common commute times in Cedarville are 5 to 9 minutes (276 commuters, 40.2%) for males and 5 to 9 minutes (457 commuters, 46.8%) for females.
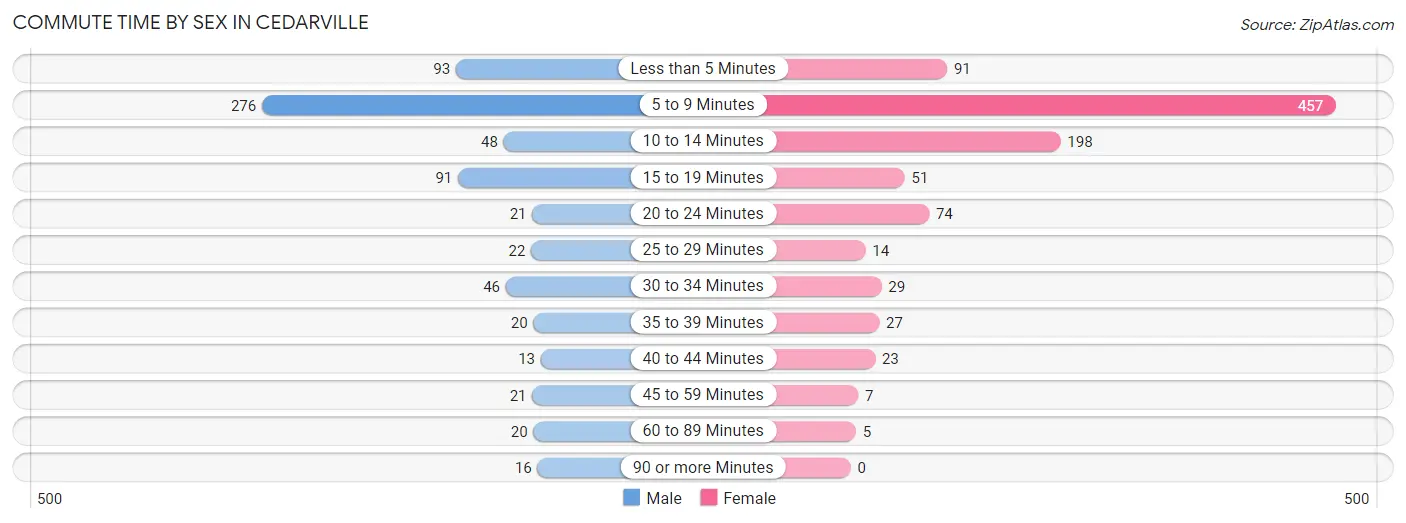
| Commute Time | Male | Female |
| Less than 5 Minutes | 93 (13.5%) | 91 (9.3%) |
| 5 to 9 Minutes | 276 (40.2%) | 457 (46.8%) |
| 10 to 14 Minutes | 48 (7.0%) | 198 (20.3%) |
| 15 to 19 Minutes | 91 (13.3%) | 51 (5.2%) |
| 20 to 24 Minutes | 21 (3.1%) | 74 (7.6%) |
| 25 to 29 Minutes | 22 (3.2%) | 14 (1.4%) |
| 30 to 34 Minutes | 46 (6.7%) | 29 (3.0%) |
| 35 to 39 Minutes | 20 (2.9%) | 27 (2.8%) |
| 40 to 44 Minutes | 13 (1.9%) | 23 (2.4%) |
| 45 to 59 Minutes | 21 (3.1%) | 7 (0.7%) |
| 60 to 89 Minutes | 20 (2.9%) | 5 (0.5%) |
| 90 or more Minutes | 16 (2.3%) | 0 (0.0%) |
Time of Departure to Work by Sex in Cedarville
The most frequent times of departure to work in Cedarville are 4:00 PM to 11:59 PM (139, 20.2%) for males and 4:00 PM to 11:59 PM (228, 23.4%) for females.
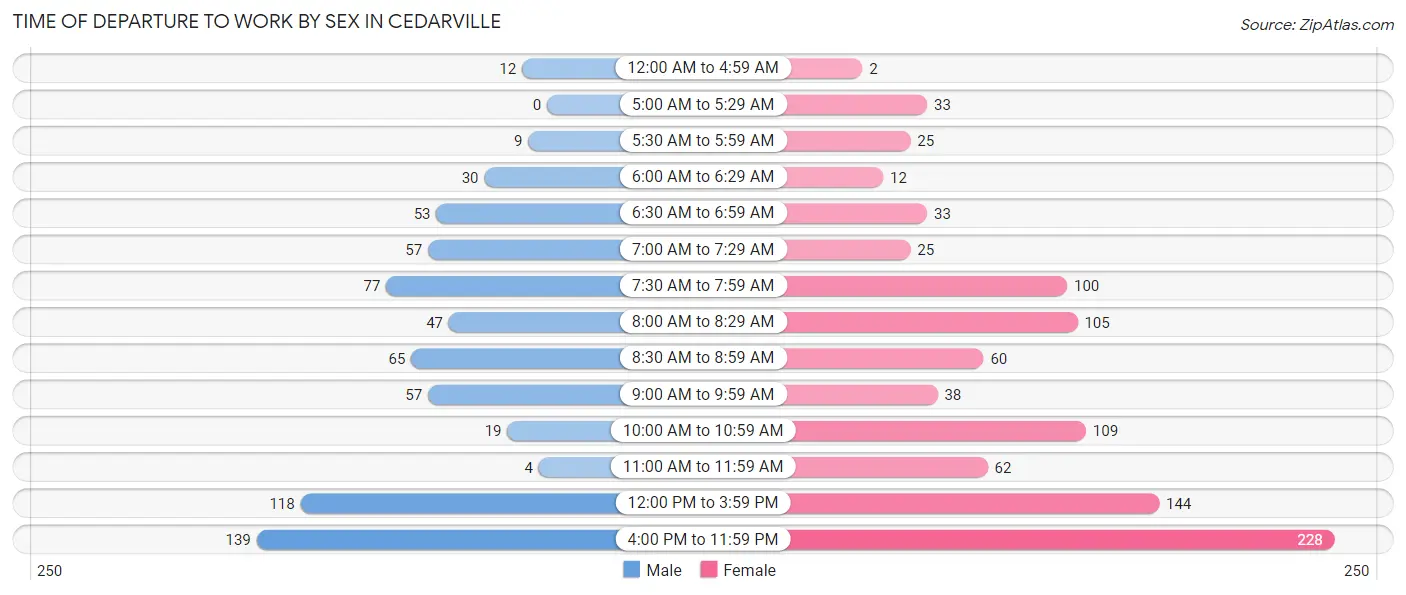
| Time of Departure | Male | Female |
| 12:00 AM to 4:59 AM | 12 (1.8%) | 2 (0.2%) |
| 5:00 AM to 5:29 AM | 0 (0.0%) | 33 (3.4%) |
| 5:30 AM to 5:59 AM | 9 (1.3%) | 25 (2.6%) |
| 6:00 AM to 6:29 AM | 30 (4.4%) | 12 (1.2%) |
| 6:30 AM to 6:59 AM | 53 (7.7%) | 33 (3.4%) |
| 7:00 AM to 7:29 AM | 57 (8.3%) | 25 (2.6%) |
| 7:30 AM to 7:59 AM | 77 (11.2%) | 100 (10.2%) |
| 8:00 AM to 8:29 AM | 47 (6.8%) | 105 (10.8%) |
| 8:30 AM to 8:59 AM | 65 (9.5%) | 60 (6.1%) |
| 9:00 AM to 9:59 AM | 57 (8.3%) | 38 (3.9%) |
| 10:00 AM to 10:59 AM | 19 (2.8%) | 109 (11.2%) |
| 11:00 AM to 11:59 AM | 4 (0.6%) | 62 (6.4%) |
| 12:00 PM to 3:59 PM | 118 (17.2%) | 144 (14.7%) |
| 4:00 PM to 11:59 PM | 139 (20.2%) | 228 (23.4%) |
| Total | 687 (100.0%) | 976 (100.0%) |
Housing Occupancy in Cedarville
Occupancy by Ownership in Cedarville
Of the total 627 dwellings in Cedarville, owner-occupied units account for 332 (52.9%), while renter-occupied units make up 295 (47.0%).
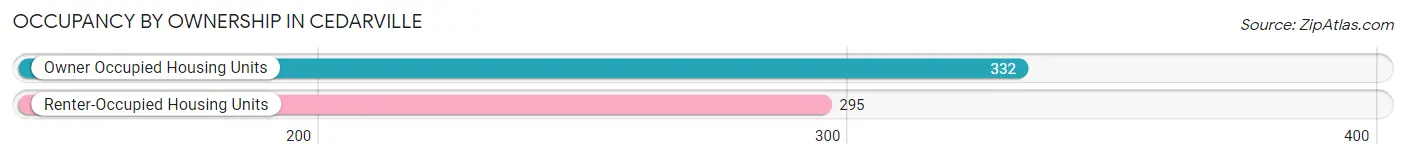
| Occupancy | # Housing Units | % Housing Units |
| Owner Occupied Housing Units | 332 | 52.9% |
| Renter-Occupied Housing Units | 295 | 47.0% |
| Total Occupied Housing Units | 627 | 100.0% |
Occupancy by Household Size in Cedarville
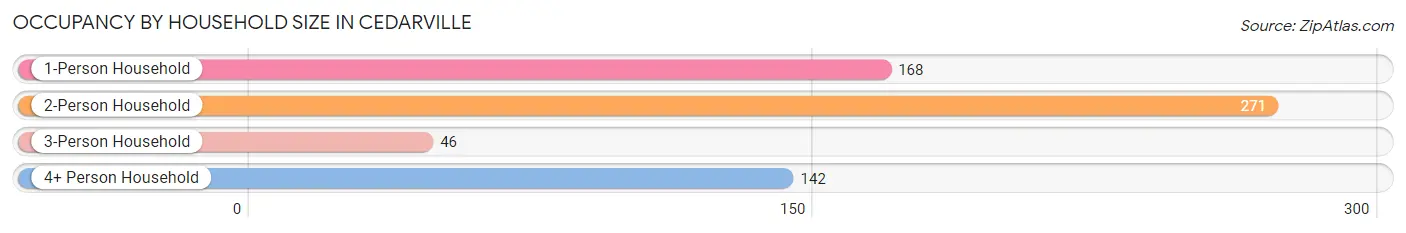
| Household Size | # Housing Units | % Housing Units |
| 1-Person Household | 168 | 26.8% |
| 2-Person Household | 271 | 43.2% |
| 3-Person Household | 46 | 7.3% |
| 4+ Person Household | 142 | 22.7% |
| Total Housing Units | 627 | 100.0% |
Occupancy by Ownership by Household Size in Cedarville
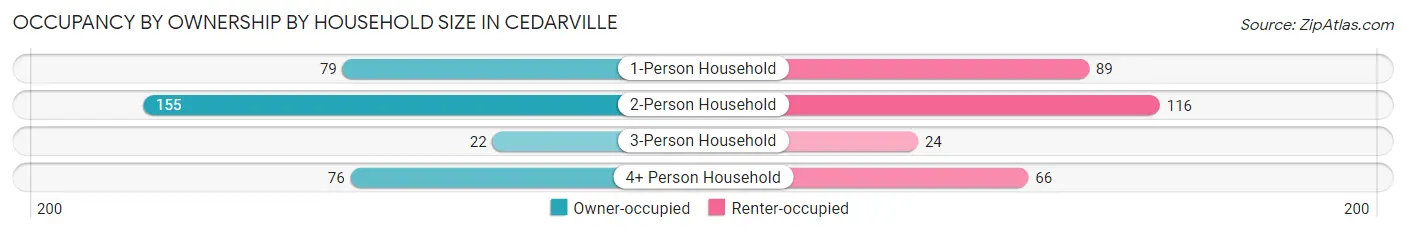
| Household Size | Owner-occupied | Renter-occupied |
| 1-Person Household | 79 (47.0%) | 89 (53.0%) |
| 2-Person Household | 155 (57.2%) | 116 (42.8%) |
| 3-Person Household | 22 (47.8%) | 24 (52.2%) |
| 4+ Person Household | 76 (53.5%) | 66 (46.5%) |
| Total Housing Units | 332 (52.9%) | 295 (47.0%) |
Occupancy by Educational Attainment in Cedarville
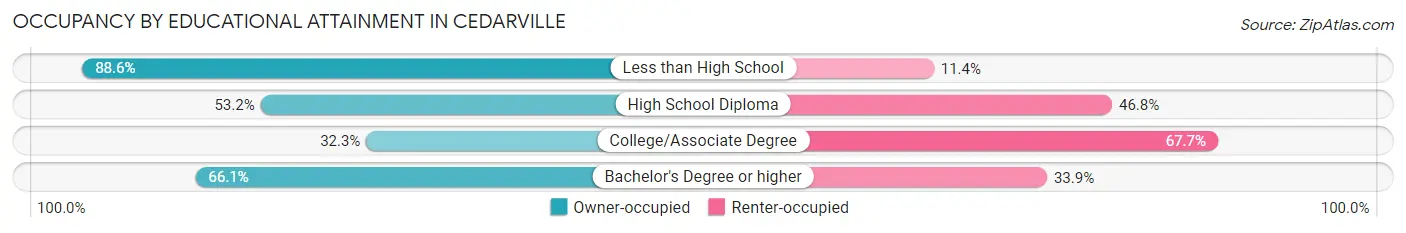
| Household Size | Owner-occupied | Renter-occupied |
| Less than High School | 31 (88.6%) | 4 (11.4%) |
| High School Diploma | 66 (53.2%) | 58 (46.8%) |
| College/Associate Degree | 71 (32.3%) | 149 (67.7%) |
| Bachelor's Degree or higher | 164 (66.1%) | 84 (33.9%) |
Occupancy by Age of Householder in Cedarville
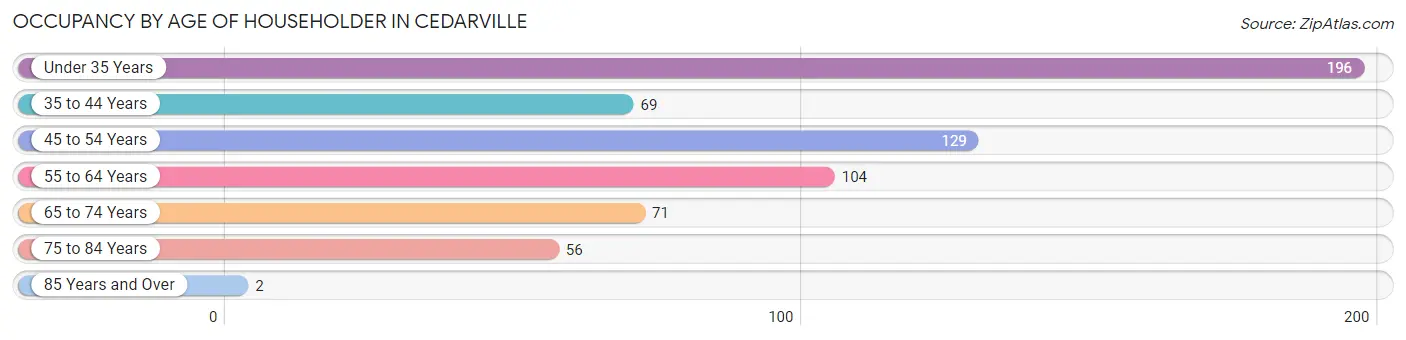
| Age Bracket | # Households | % Households |
| Under 35 Years | 196 | 31.3% |
| 35 to 44 Years | 69 | 11.0% |
| 45 to 54 Years | 129 | 20.6% |
| 55 to 64 Years | 104 | 16.6% |
| 65 to 74 Years | 71 | 11.3% |
| 75 to 84 Years | 56 | 8.9% |
| 85 Years and Over | 2 | 0.3% |
| Total | 627 | 100.0% |
Housing Finances in Cedarville
Median Income by Occupancy in Cedarville
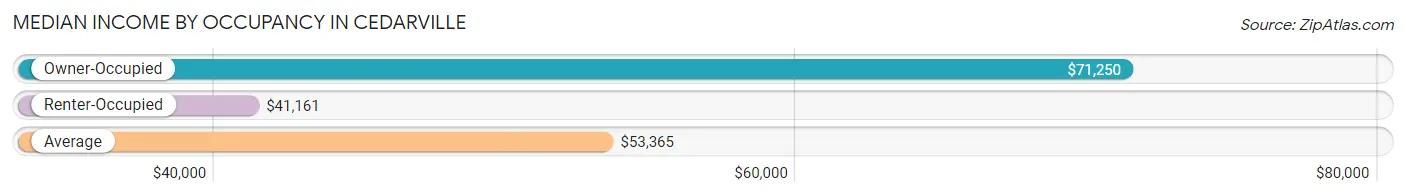
| Occupancy Type | # Households | Median Income |
| Owner-Occupied | 332 (52.9%) | $71,250 |
| Renter-Occupied | 295 (47.0%) | $41,161 |
| Average | 627 (100.0%) | $53,365 |
Occupancy by Householder Income Bracket in Cedarville
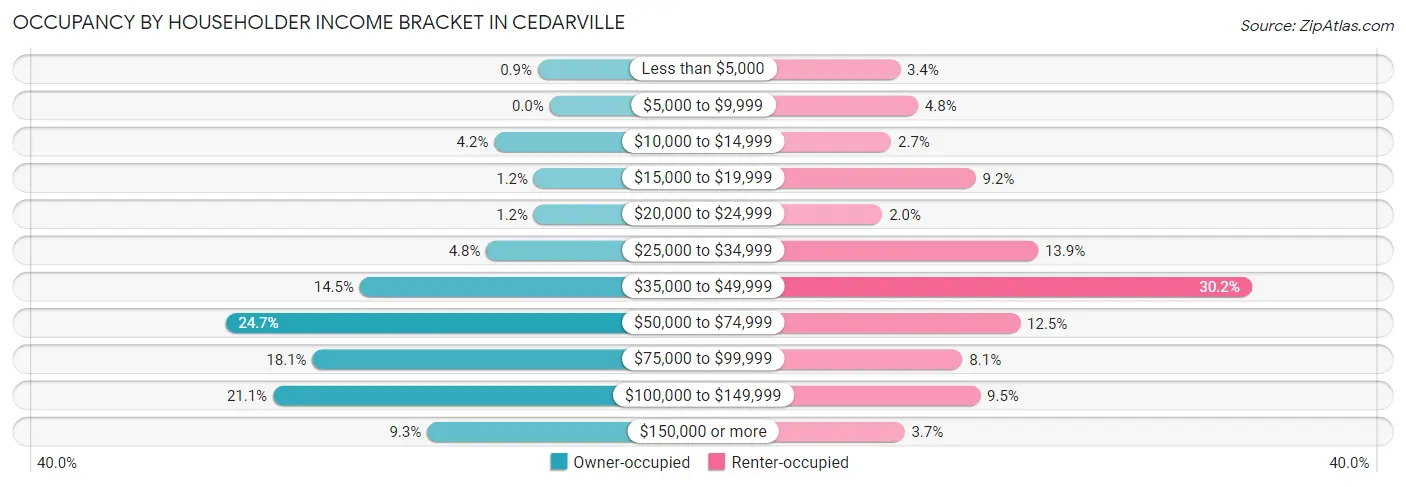
| Income Bracket | Owner-occupied | Renter-occupied |
| Less than $5,000 | 3 (0.9%) | 10 (3.4%) |
| $5,000 to $9,999 | 0 (0.0%) | 14 (4.8%) |
| $10,000 to $14,999 | 14 (4.2%) | 8 (2.7%) |
| $15,000 to $19,999 | 4 (1.2%) | 27 (9.1%) |
| $20,000 to $24,999 | 4 (1.2%) | 6 (2.0%) |
| $25,000 to $34,999 | 16 (4.8%) | 41 (13.9%) |
| $35,000 to $49,999 | 48 (14.5%) | 89 (30.2%) |
| $50,000 to $74,999 | 82 (24.7%) | 37 (12.5%) |
| $75,000 to $99,999 | 60 (18.1%) | 24 (8.1%) |
| $100,000 to $149,999 | 70 (21.1%) | 28 (9.5%) |
| $150,000 or more | 31 (9.3%) | 11 (3.7%) |
| Total | 332 (100.0%) | 295 (100.0%) |
Monthly Housing Cost Tiers in Cedarville
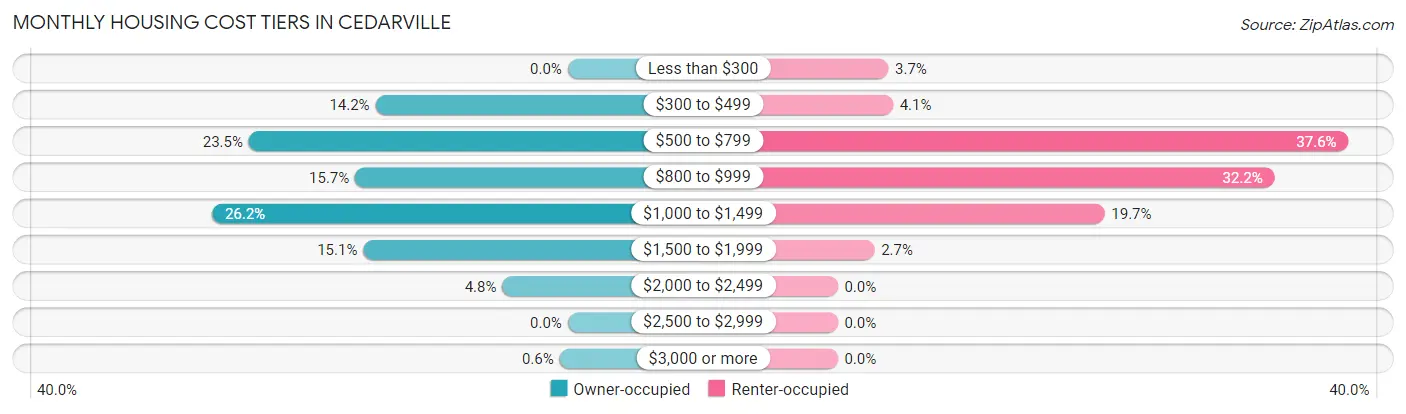
| Monthly Cost | Owner-occupied | Renter-occupied |
| Less than $300 | 0 (0.0%) | 11 (3.7%) |
| $300 to $499 | 47 (14.2%) | 12 (4.1%) |
| $500 to $799 | 78 (23.5%) | 111 (37.6%) |
| $800 to $999 | 52 (15.7%) | 95 (32.2%) |
| $1,000 to $1,499 | 87 (26.2%) | 58 (19.7%) |
| $1,500 to $1,999 | 50 (15.1%) | 8 (2.7%) |
| $2,000 to $2,499 | 16 (4.8%) | 0 (0.0%) |
| $2,500 to $2,999 | 0 (0.0%) | 0 (0.0%) |
| $3,000 or more | 2 (0.6%) | 0 (0.0%) |
| Total | 332 (100.0%) | 295 (100.0%) |
Physical Housing Characteristics in Cedarville
Housing Structures in Cedarville
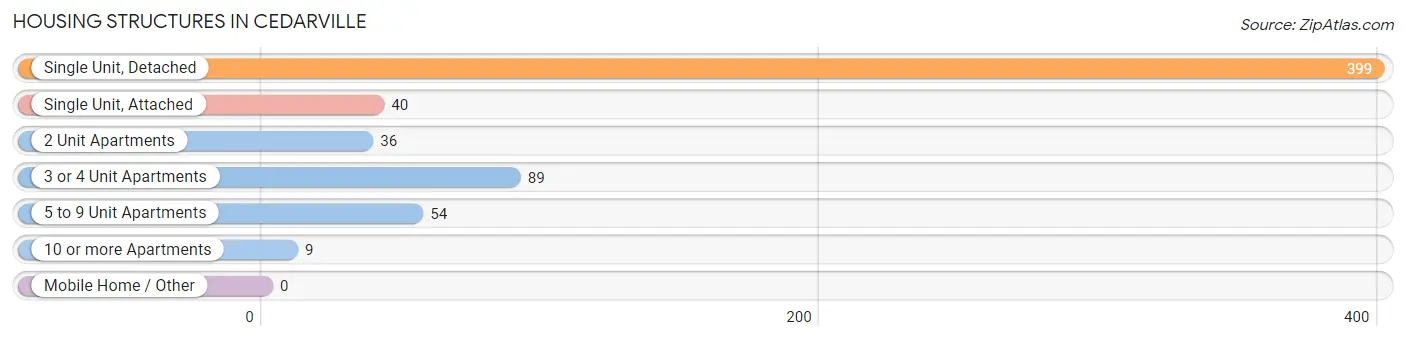
| Structure Type | # Housing Units | % Housing Units |
| Single Unit, Detached | 399 | 63.6% |
| Single Unit, Attached | 40 | 6.4% |
| 2 Unit Apartments | 36 | 5.7% |
| 3 or 4 Unit Apartments | 89 | 14.2% |
| 5 to 9 Unit Apartments | 54 | 8.6% |
| 10 or more Apartments | 9 | 1.4% |
| Mobile Home / Other | 0 | 0.0% |
| Total | 627 | 100.0% |
Housing Structures by Occupancy in Cedarville
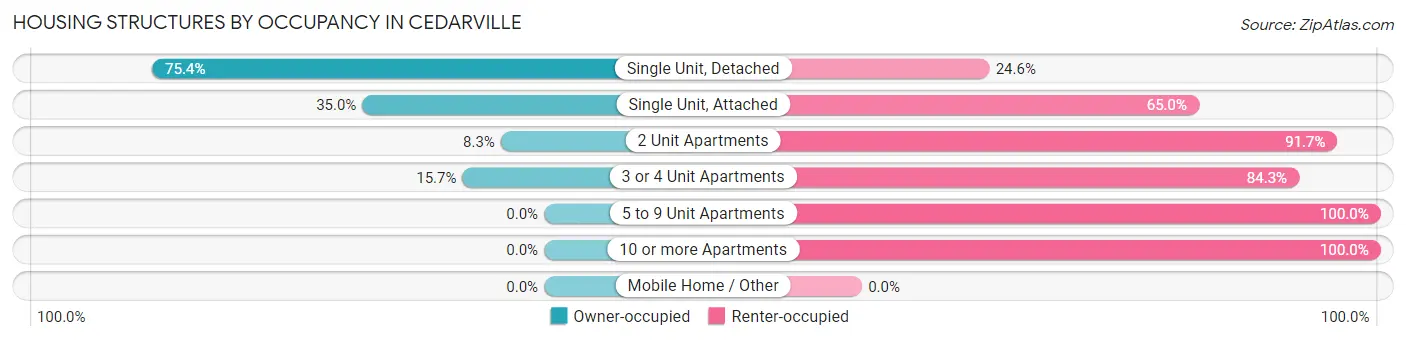
| Structure Type | Owner-occupied | Renter-occupied |
| Single Unit, Detached | 301 (75.4%) | 98 (24.6%) |
| Single Unit, Attached | 14 (35.0%) | 26 (65.0%) |
| 2 Unit Apartments | 3 (8.3%) | 33 (91.7%) |
| 3 or 4 Unit Apartments | 14 (15.7%) | 75 (84.3%) |
| 5 to 9 Unit Apartments | 0 (0.0%) | 54 (100.0%) |
| 10 or more Apartments | 0 (0.0%) | 9 (100.0%) |
| Mobile Home / Other | 0 (0.0%) | 0 (0.0%) |
| Total | 332 (52.9%) | 295 (47.0%) |
Housing Structures by Number of Rooms in Cedarville
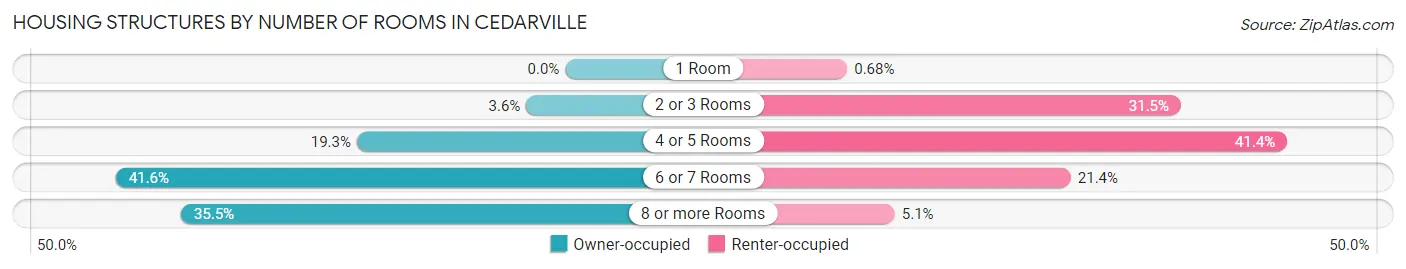
| Number of Rooms | Owner-occupied | Renter-occupied |
| 1 Room | 0 (0.0%) | 2 (0.7%) |
| 2 or 3 Rooms | 12 (3.6%) | 93 (31.5%) |
| 4 or 5 Rooms | 64 (19.3%) | 122 (41.4%) |
| 6 or 7 Rooms | 138 (41.6%) | 63 (21.4%) |
| 8 or more Rooms | 118 (35.5%) | 15 (5.1%) |
| Total | 332 (100.0%) | 295 (100.0%) |
Housing Structure by Heating Type in Cedarville
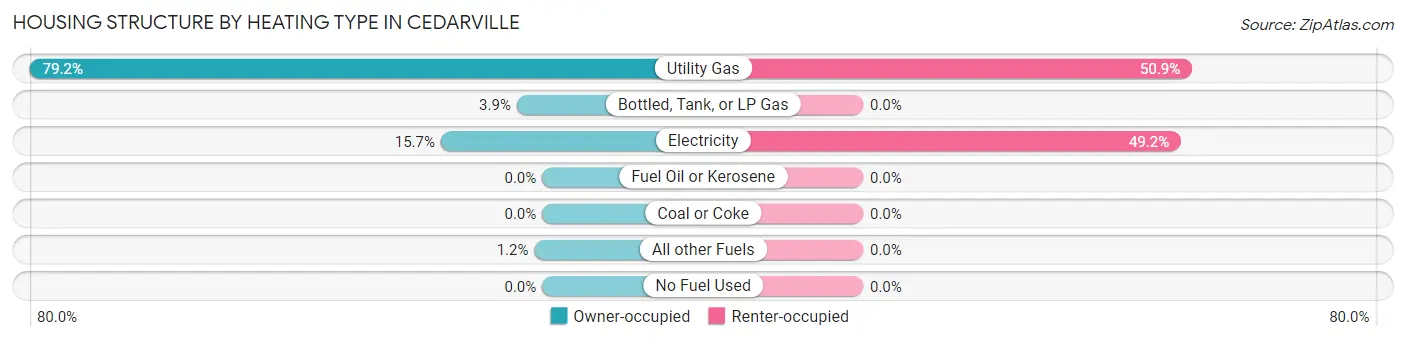
| Heating Type | Owner-occupied | Renter-occupied |
| Utility Gas | 263 (79.2%) | 150 (50.8%) |
| Bottled, Tank, or LP Gas | 13 (3.9%) | 0 (0.0%) |
| Electricity | 52 (15.7%) | 145 (49.1%) |
| Fuel Oil or Kerosene | 0 (0.0%) | 0 (0.0%) |
| Coal or Coke | 0 (0.0%) | 0 (0.0%) |
| All other Fuels | 4 (1.2%) | 0 (0.0%) |
| No Fuel Used | 0 (0.0%) | 0 (0.0%) |
| Total | 332 (100.0%) | 295 (100.0%) |
Household Vehicle Usage in Cedarville
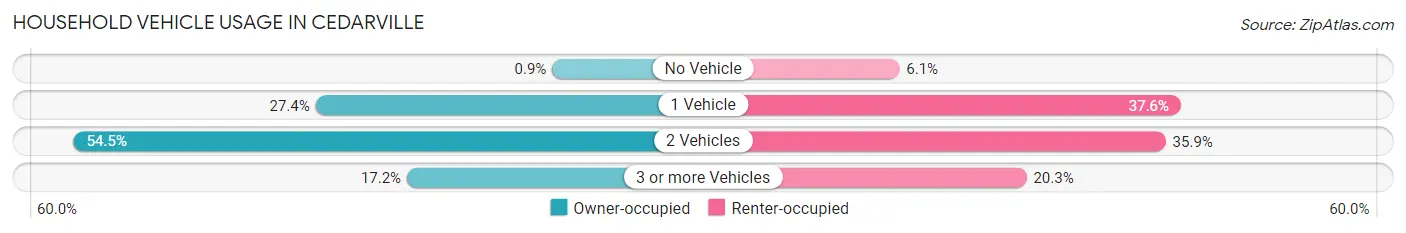
| Vehicles per Household | Owner-occupied | Renter-occupied |
| No Vehicle | 3 (0.9%) | 18 (6.1%) |
| 1 Vehicle | 91 (27.4%) | 111 (37.6%) |
| 2 Vehicles | 181 (54.5%) | 106 (35.9%) |
| 3 or more Vehicles | 57 (17.2%) | 60 (20.3%) |
| Total | 332 (100.0%) | 295 (100.0%) |
Real Estate & Mortgages in Cedarville
Real Estate and Mortgage Overview in Cedarville
| Characteristic | Without Mortgage | With Mortgage |
| Housing Units | 102 | 230 |
| Median Property Value | $178,300 | $185,700 |
| Median Household Income | $57,500 | $28 |
| Monthly Housing Costs | $515 | $2 |
| Real Estate Taxes | $2,339 | $5 |
Property Value by Mortgage Status in Cedarville
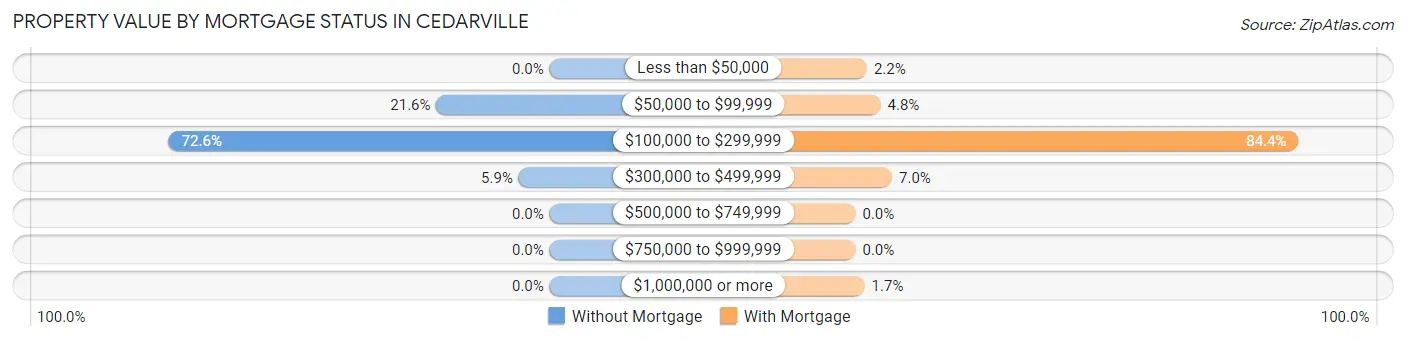
| Property Value | Without Mortgage | With Mortgage |
| Less than $50,000 | 0 (0.0%) | 5 (2.2%) |
| $50,000 to $99,999 | 22 (21.6%) | 11 (4.8%) |
| $100,000 to $299,999 | 74 (72.6%) | 194 (84.4%) |
| $300,000 to $499,999 | 6 (5.9%) | 16 (7.0%) |
| $500,000 to $749,999 | 0 (0.0%) | 0 (0.0%) |
| $750,000 to $999,999 | 0 (0.0%) | 0 (0.0%) |
| $1,000,000 or more | 0 (0.0%) | 4 (1.7%) |
| Total | 102 (100.0%) | 230 (100.0%) |
Household Income by Mortgage Status in Cedarville
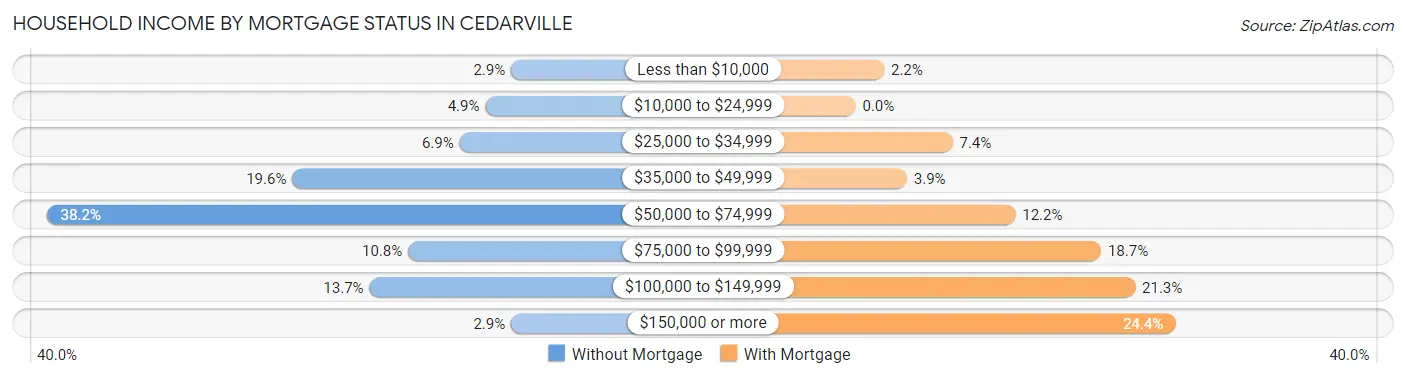
| Household Income | Without Mortgage | With Mortgage |
| Less than $10,000 | 3 (2.9%) | 5 (2.2%) |
| $10,000 to $24,999 | 5 (4.9%) | 0 (0.0%) |
| $25,000 to $34,999 | 7 (6.9%) | 17 (7.4%) |
| $35,000 to $49,999 | 20 (19.6%) | 9 (3.9%) |
| $50,000 to $74,999 | 39 (38.2%) | 28 (12.2%) |
| $75,000 to $99,999 | 11 (10.8%) | 43 (18.7%) |
| $100,000 to $149,999 | 14 (13.7%) | 49 (21.3%) |
| $150,000 or more | 3 (2.9%) | 56 (24.3%) |
| Total | 102 (100.0%) | 230 (100.0%) |
Property Value to Household Income Ratio in Cedarville
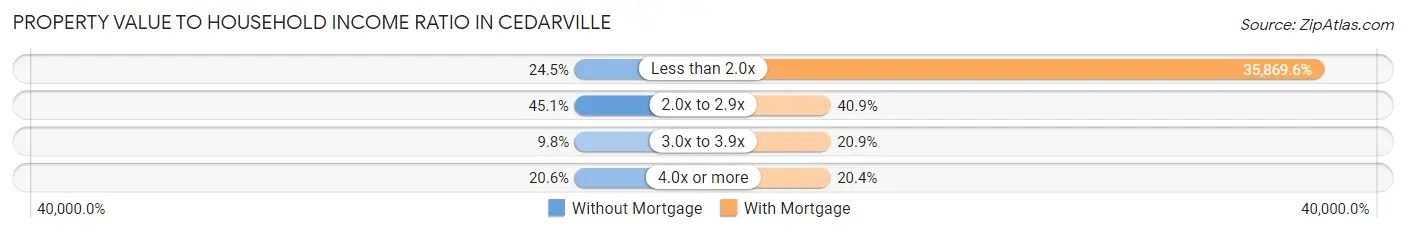
| Value-to-Income Ratio | Without Mortgage | With Mortgage |
| Less than 2.0x | 25 (24.5%) | 82,500 (35,869.6%) |
| 2.0x to 2.9x | 46 (45.1%) | 94 (40.9%) |
| 3.0x to 3.9x | 10 (9.8%) | 48 (20.9%) |
| 4.0x or more | 21 (20.6%) | 47 (20.4%) |
| Total | 102 (100.0%) | 230 (100.0%) |
Real Estate Taxes by Mortgage Status in Cedarville

| Property Taxes | Without Mortgage | With Mortgage |
| Less than $800 | 3 (2.9%) | 0 (0.0%) |
| $800 to $1,499 | 15 (14.7%) | 23 (10.0%) |
| $800 to $1,499 | 84 (82.4%) | 28 (12.2%) |
| Total | 102 (100.0%) | 230 (100.0%) |
Health & Disability in Cedarville
Health Insurance Coverage by Age in Cedarville
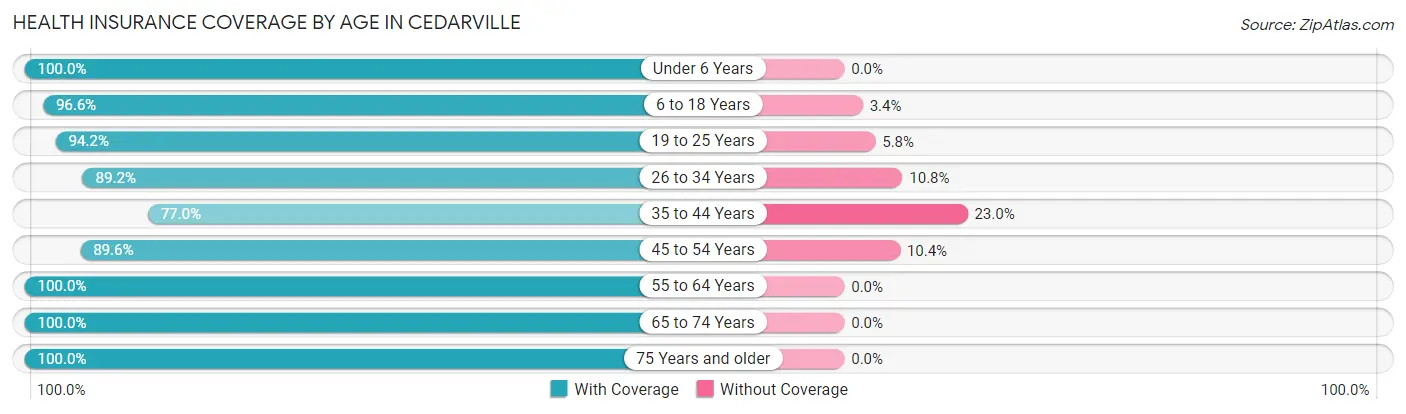
| Age Bracket | With Coverage | Without Coverage |
| Under 6 Years | 120 (100.0%) | 0 (0.0%) |
| 6 to 18 Years | 873 (96.6%) | 31 (3.4%) |
| 19 to 25 Years | 1,873 (94.2%) | 115 (5.8%) |
| 26 to 34 Years | 140 (89.2%) | 17 (10.8%) |
| 35 to 44 Years | 114 (77.0%) | 34 (23.0%) |
| 45 to 54 Years | 190 (89.6%) | 22 (10.4%) |
| 55 to 64 Years | 178 (100.0%) | 0 (0.0%) |
| 65 to 74 Years | 116 (100.0%) | 0 (0.0%) |
| 75 Years and older | 78 (100.0%) | 0 (0.0%) |
| Total | 3,682 (94.4%) | 219 (5.6%) |
Health Insurance Coverage by Citizenship Status in Cedarville

| Citizenship Status | With Coverage | Without Coverage |
| Native Born | 120 (100.0%) | 0 (0.0%) |
| Foreign Born, Citizen | 873 (96.6%) | 31 (3.4%) |
| Foreign Born, not a Citizen | 1,873 (94.2%) | 115 (5.8%) |
Health Insurance Coverage by Household Income in Cedarville
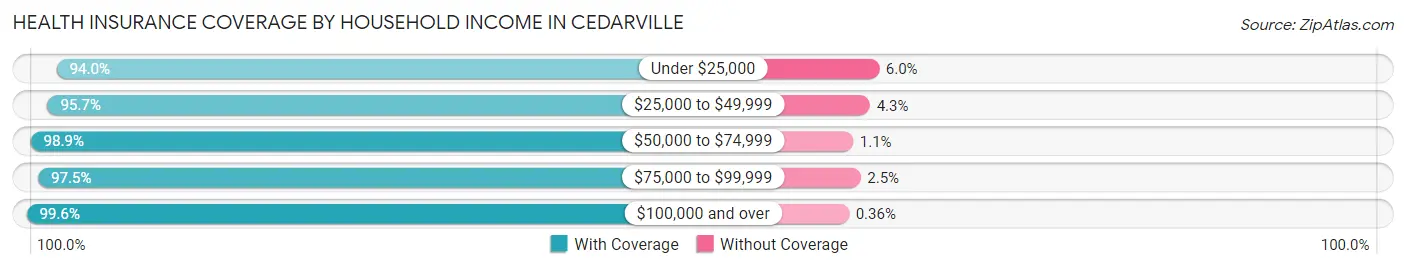
| Household Income | With Coverage | Without Coverage |
| Under $25,000 | 172 (94.0%) | 11 (6.0%) |
| $25,000 to $49,999 | 357 (95.7%) | 16 (4.3%) |
| $50,000 to $74,999 | 263 (98.9%) | 3 (1.1%) |
| $75,000 to $99,999 | 230 (97.5%) | 6 (2.5%) |
| $100,000 and over | 554 (99.6%) | 2 (0.4%) |
Public vs Private Health Insurance Coverage by Age in Cedarville
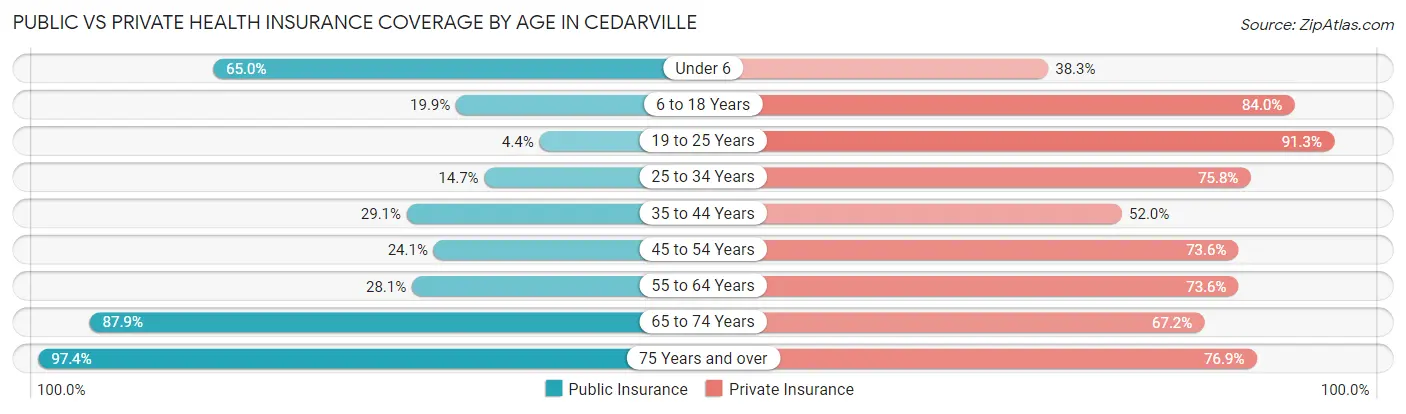
| Age Bracket | Public Insurance | Private Insurance |
| Under 6 | 78 (65.0%) | 46 (38.3%) |
| 6 to 18 Years | 180 (19.9%) | 759 (84.0%) |
| 19 to 25 Years | 88 (4.4%) | 1,815 (91.3%) |
| 25 to 34 Years | 23 (14.6%) | 119 (75.8%) |
| 35 to 44 Years | 43 (29.0%) | 77 (52.0%) |
| 45 to 54 Years | 51 (24.1%) | 156 (73.6%) |
| 55 to 64 Years | 50 (28.1%) | 131 (73.6%) |
| 65 to 74 Years | 102 (87.9%) | 78 (67.2%) |
| 75 Years and over | 76 (97.4%) | 60 (76.9%) |
| Total | 691 (17.7%) | 3,241 (83.1%) |
Disability Status by Sex by Age in Cedarville
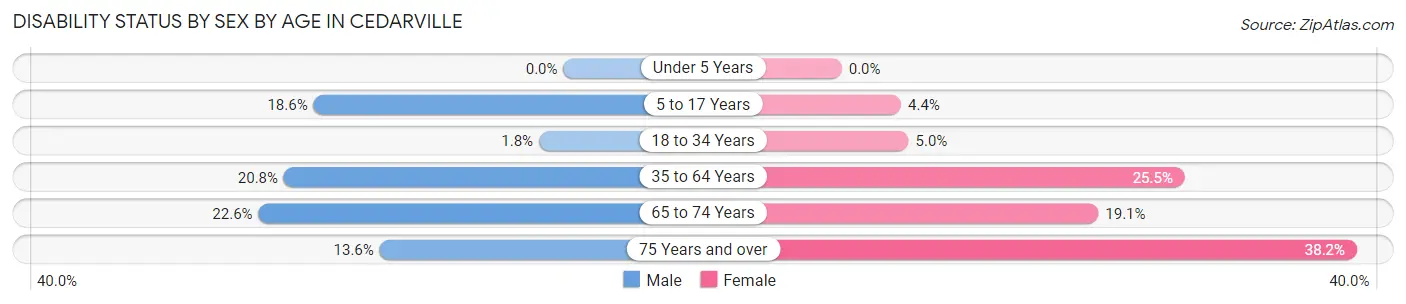
| Age Bracket | Male | Female |
| Under 5 Years | 0 (0.0%) | 0 (0.0%) |
| 5 to 17 Years | 23 (18.5%) | 7 (4.4%) |
| 18 to 34 Years | 25 (1.8%) | 70 (5.0%) |
| 35 to 64 Years | 44 (20.7%) | 83 (25.5%) |
| 65 to 74 Years | 12 (22.6%) | 12 (19.1%) |
| 75 Years and over | 6 (13.6%) | 13 (38.2%) |
Disability Class by Sex by Age in Cedarville
Disability Class: Hearing Difficulty
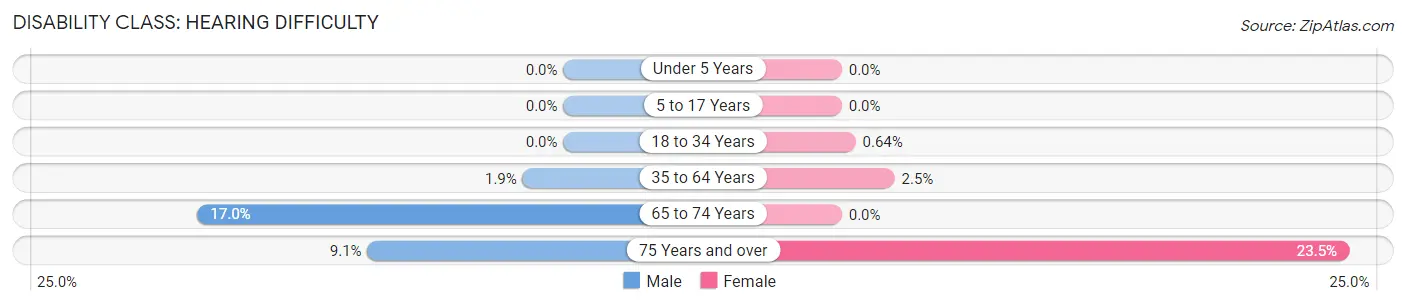
| Age Bracket | Male | Female |
| Under 5 Years | 0 (0.0%) | 0 (0.0%) |
| 5 to 17 Years | 0 (0.0%) | 0 (0.0%) |
| 18 to 34 Years | 0 (0.0%) | 9 (0.6%) |
| 35 to 64 Years | 4 (1.9%) | 8 (2.5%) |
| 65 to 74 Years | 9 (17.0%) | 0 (0.0%) |
| 75 Years and over | 4 (9.1%) | 8 (23.5%) |
Disability Class: Vision Difficulty
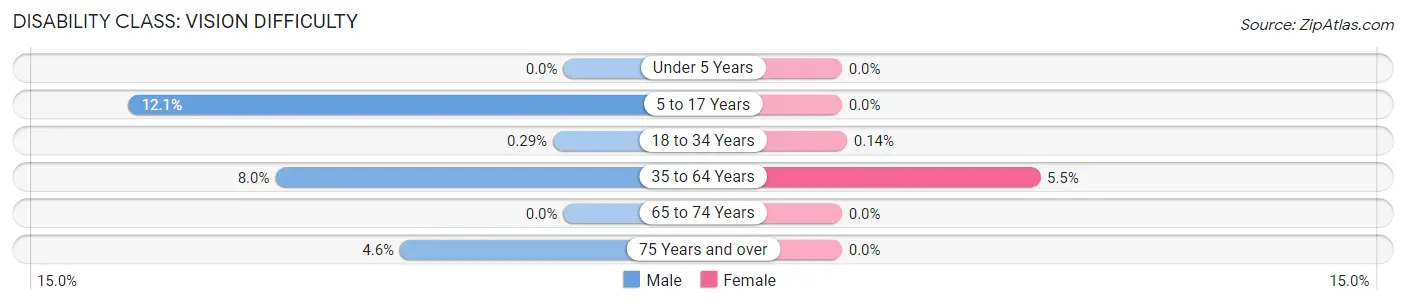
| Age Bracket | Male | Female |
| Under 5 Years | 0 (0.0%) | 0 (0.0%) |
| 5 to 17 Years | 15 (12.1%) | 0 (0.0%) |
| 18 to 34 Years | 4 (0.3%) | 2 (0.1%) |
| 35 to 64 Years | 17 (8.0%) | 18 (5.5%) |
| 65 to 74 Years | 0 (0.0%) | 0 (0.0%) |
| 75 Years and over | 2 (4.5%) | 0 (0.0%) |
Disability Class: Cognitive Difficulty
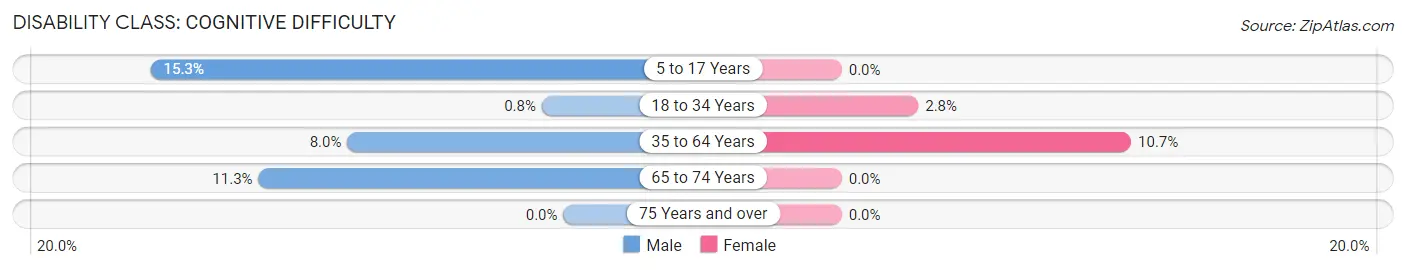
| Age Bracket | Male | Female |
| 5 to 17 Years | 19 (15.3%) | 0 (0.0%) |
| 18 to 34 Years | 11 (0.8%) | 40 (2.8%) |
| 35 to 64 Years | 17 (8.0%) | 35 (10.7%) |
| 65 to 74 Years | 6 (11.3%) | 0 (0.0%) |
| 75 Years and over | 0 (0.0%) | 0 (0.0%) |
Disability Class: Ambulatory Difficulty
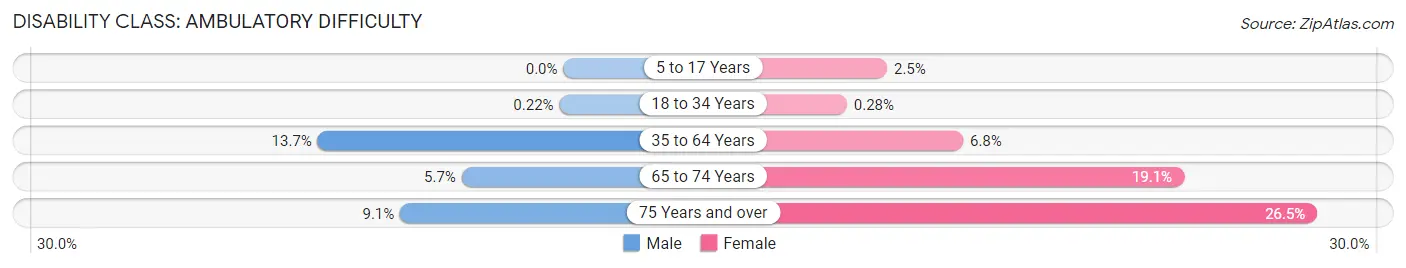
| Age Bracket | Male | Female |
| 5 to 17 Years | 0 (0.0%) | 4 (2.5%) |
| 18 to 34 Years | 3 (0.2%) | 4 (0.3%) |
| 35 to 64 Years | 29 (13.7%) | 22 (6.8%) |
| 65 to 74 Years | 3 (5.7%) | 12 (19.1%) |
| 75 Years and over | 4 (9.1%) | 9 (26.5%) |
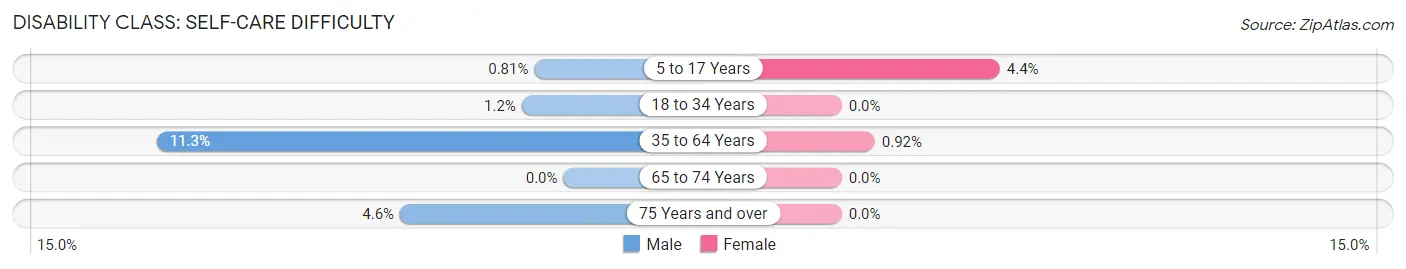
Disability Class: Self-Care Difficulty
| Age Bracket | Male | Female |
| 5 to 17 Years | 1 (0.8%) | 7 (4.4%) |
| 18 to 34 Years | 16 (1.2%) | 0 (0.0%) |
| 35 to 64 Years | 24 (11.3%) | 3 (0.9%) |
| 65 to 74 Years | 0 (0.0%) | 0 (0.0%) |
| 75 Years and over | 2 (4.5%) | 0 (0.0%) |
Technology Access in Cedarville
Computing Device Access in Cedarville
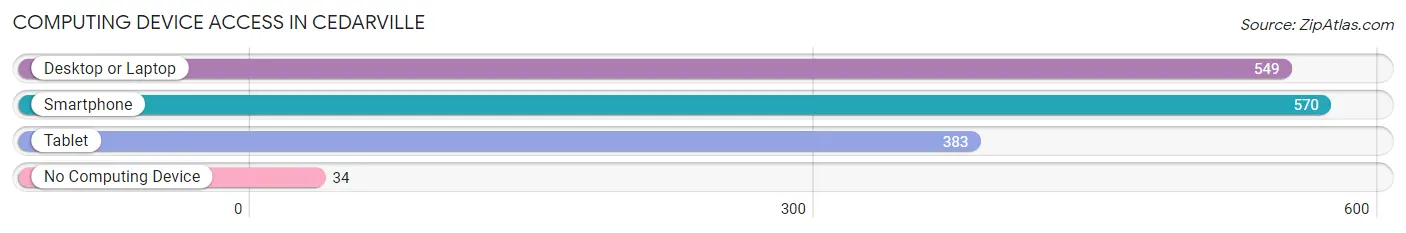
| Device Type | # Households | % Households |
| Desktop or Laptop | 549 | 87.6% |
| Smartphone | 570 | 90.9% |
| Tablet | 383 | 61.1% |
| No Computing Device | 34 | 5.4% |
| Total | 627 | 100.0% |
Internet Access in Cedarville
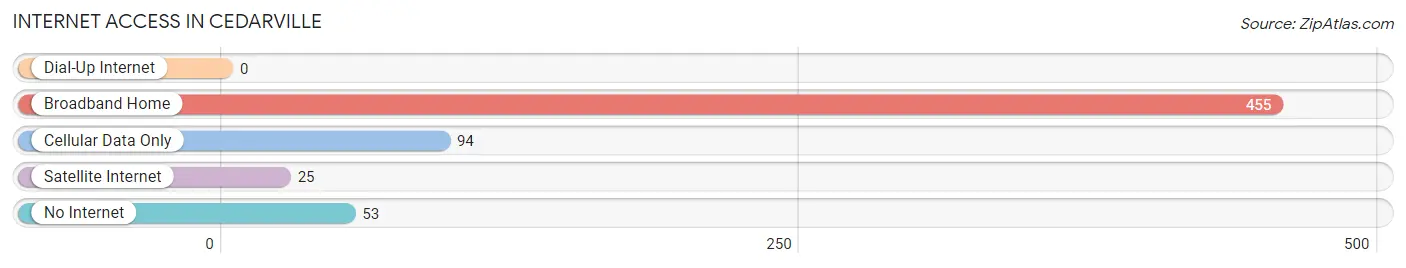
| Internet Type | # Households | % Households |
| Dial-Up Internet | 0 | 0.0% |
| Broadband Home | 455 | 72.6% |
| Cellular Data Only | 94 | 15.0% |
| Satellite Internet | 25 | 4.0% |
| No Internet | 53 | 8.5% |
| Total | 627 | 100.0% |
Cedarville Summary
Cedarville, Ohio is a small village located in Greene County, Ohio. It is situated in the southwestern part of the state, approximately 20 miles east of Dayton and 40 miles west of Columbus. The village has a population of approximately 3,000 people and is part of the Dayton Metropolitan Statistical Area.
History
Cedarville was founded in 1810 by a group of settlers from New England. The village was named after the abundance of cedar trees in the area. The first settlers were primarily farmers and the village grew slowly over the years. In 1845, the village was incorporated and the first post office was established.
In the late 19th century, Cedarville became a popular tourist destination due to its proximity to the Little Miami River. The village was also home to several resorts and hotels, which attracted visitors from all over the country.
In the early 20th century, Cedarville experienced a period of growth and development. The village was home to several factories, including a paper mill, a furniture factory, and a canning factory. The village also had a railroad station, which connected it to the larger cities in the region.
Geography
Cedarville is located in southwestern Ohio, approximately 20 miles east of Dayton and 40 miles west of Columbus. The village is situated in Greene County, which is part of the Dayton Metropolitan Statistical Area.
The village is situated on the Little Miami River, which is a tributary of the Ohio River. The village is surrounded by rolling hills and farmland. The climate in Cedarville is humid continental, with hot summers and cold winters.
Economy
Cedarville’s economy is primarily based on agriculture and tourism. The village is home to several farms, which produce a variety of crops, including corn, soybeans, and wheat. The village is also home to several tourist attractions, including the Little Miami River, which is popular for fishing and canoeing.
The village is also home to several small businesses, including restaurants, shops, and a grocery store. The village is also home to several manufacturing companies, including a paper mill, a furniture factory, and a canning factory.
Demographics
As of the 2010 census, Cedarville had a population of 3,000 people. The racial makeup of the village was 95.3% White, 1.7% African American, 0.3% Native American, 0.7% Asian, and 1.7% from other races. The median household income was $45,000 and the median family income was $50,000.
Conclusion
Cedarville is a small village located in southwestern Ohio. The village was founded in 1810 and has a population of approximately 3,000 people. The village’s economy is primarily based on agriculture and tourism. The village is home to several farms, tourist attractions, and small businesses. The racial makeup of the village is predominantly White, with a small percentage of African American, Native American, and Asian residents.
Common Questions
What is Per Capita Income in Cedarville?
Per Capita income in Cedarville is $14,544.
What is the Median Family Income in Cedarville?
Median Family Income in Cedarville is $63,889.
What is the Median Household income in Cedarville?
Median Household Income in Cedarville is $53,365.
What is Income or Wage Gap in Cedarville?
Income or Wage Gap in Cedarville is 8.3%.
Women in Cedarville earn 91.7 cents for every dollar earned by a man.
What is Inequality or Gini Index in Cedarville?
Inequality or Gini Index in Cedarville is 0.38.
What is the Total Population of Cedarville?
Total Population of Cedarville is 3,915.
What is the Total Male Population of Cedarville?
Total Male Population of Cedarville is 1,855.
What is the Total Female Population of Cedarville?
Total Female Population of Cedarville is 2,060.
What is the Ratio of Males per 100 Females in Cedarville?
There are 90.05 Males per 100 Females in Cedarville.
What is the Ratio of Females per 100 Males in Cedarville?
There are 111.05 Females per 100 Males in Cedarville.
What is the Median Population Age in Cedarville?
Median Population Age in Cedarville is 20.3 Years.
What is the Average Family Size in Cedarville
Average Family Size in Cedarville is 2.9 People.
What is the Average Household Size in Cedarville
Average Household Size in Cedarville is 2.6 People.
How Large is the Labor Force in Cedarville?
There are 2,101 People in the Labor Forcein in Cedarville.
What is the Percentage of People in the Labor Force in Cedarville?
58.1% of People are in the Labor Force in Cedarville.
What is the Unemployment Rate in Cedarville?
Unemployment Rate in Cedarville is 9.1%.