Ripley, OH Map & Demographics
Ripley Map
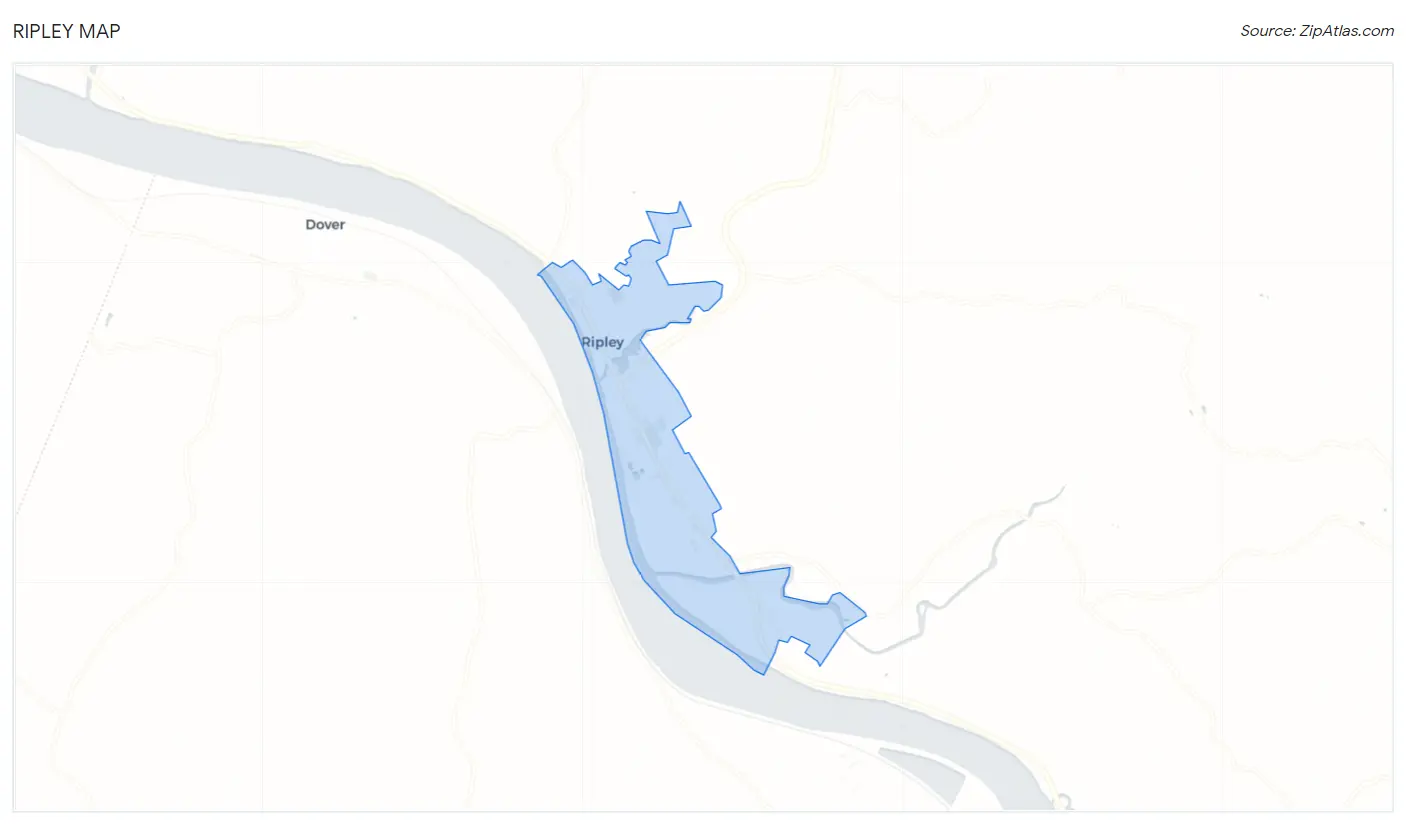
Ripley Overview
$26,045
PER CAPITA INCOME
$44,375
AVG FAMILY INCOME
$42,900
AVG HOUSEHOLD INCOME
40.0%
WAGE / INCOME GAP [ % ]
60.0¢/ $1
WAGE / INCOME GAP [ $ ]
0.49
INEQUALITY / GINI INDEX
1,609
TOTAL POPULATION
795
MALE POPULATION
814
FEMALE POPULATION
97.67
MALES / 100 FEMALES
102.39
FEMALES / 100 MALES
37.7
MEDIAN AGE
2.8
AVG FAMILY SIZE
2.3
AVG HOUSEHOLD SIZE
725
LABOR FORCE [ PEOPLE ]
59.0%
PERCENT IN LABOR FORCE
11.7%
UNEMPLOYMENT RATE
Ripley Zip Codes
Ripley Area Codes
Income in Ripley
Income Overview in Ripley
Per Capita Income in Ripley is $26,045, while median incomes of families and households are $44,375 and $42,900 respectively.
| Characteristic | Number | Measure |
| Per Capita Income | 1,609 | $26,045 |
| Median Family Income | 431 | $44,375 |
| Mean Family Income | 431 | $69,264 |
| Median Household Income | 698 | $42,900 |
| Mean Household Income | 698 | $58,367 |
| Income Deficit | 431 | $0 |
| Wage / Income Gap (%) | 1,609 | 40.03% |
| Wage / Income Gap ($) | 1,609 | 59.97¢ per $1 |
| Gini / Inequality Index | 1,609 | 0.49 |
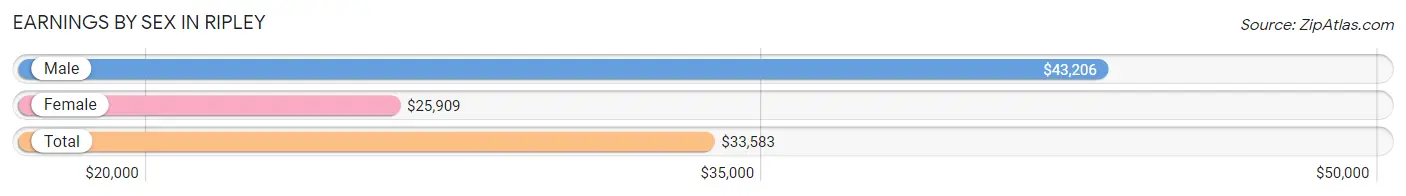
Earnings by Sex in Ripley
Average Earnings in Ripley are $33,583, $43,206 for men and $25,909 for women, a difference of 40.0%.
| Sex | Number | Average Earnings |
| Male | 349 (48.0%) | $43,206 |
| Female | 378 (52.0%) | $25,909 |
| Total | 727 (100.0%) | $33,583 |
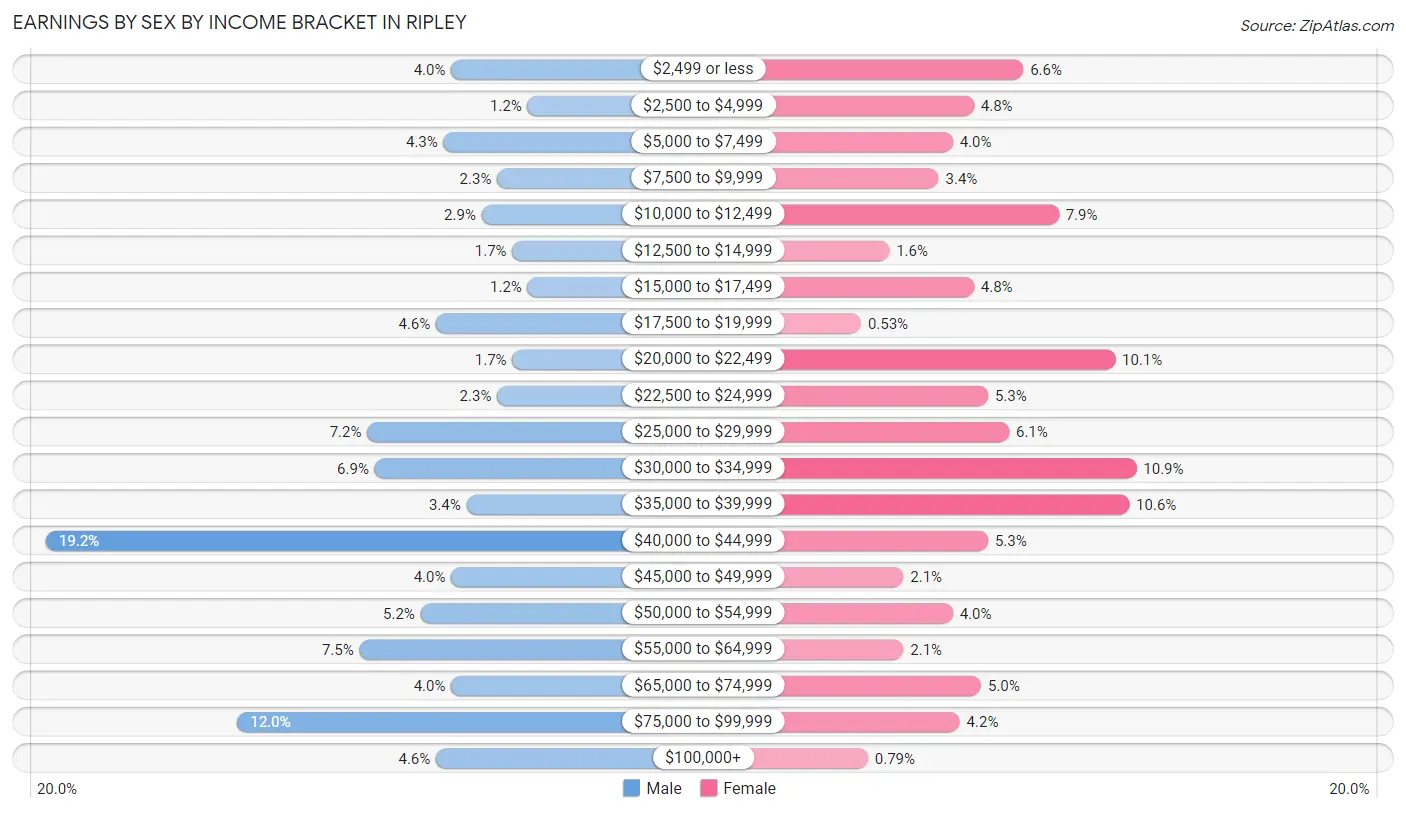
Earnings by Sex by Income Bracket in Ripley
The most common earnings brackets in Ripley are $40,000 to $44,999 for men (67 | 19.2%) and $30,000 to $34,999 for women (41 | 10.8%).
| Income | Male | Female |
| $2,499 or less | 14 (4.0%) | 25 (6.6%) |
| $2,500 to $4,999 | 4 (1.1%) | 18 (4.8%) |
| $5,000 to $7,499 | 15 (4.3%) | 15 (4.0%) |
| $7,500 to $9,999 | 8 (2.3%) | 13 (3.4%) |
| $10,000 to $12,499 | 10 (2.9%) | 30 (7.9%) |
| $12,500 to $14,999 | 6 (1.7%) | 6 (1.6%) |
| $15,000 to $17,499 | 4 (1.1%) | 18 (4.8%) |
| $17,500 to $19,999 | 16 (4.6%) | 2 (0.5%) |
| $20,000 to $22,499 | 6 (1.7%) | 38 (10.1%) |
| $22,500 to $24,999 | 8 (2.3%) | 20 (5.3%) |
| $25,000 to $29,999 | 25 (7.2%) | 23 (6.1%) |
| $30,000 to $34,999 | 24 (6.9%) | 41 (10.8%) |
| $35,000 to $39,999 | 12 (3.4%) | 40 (10.6%) |
| $40,000 to $44,999 | 67 (19.2%) | 20 (5.3%) |
| $45,000 to $49,999 | 14 (4.0%) | 8 (2.1%) |
| $50,000 to $54,999 | 18 (5.2%) | 15 (4.0%) |
| $55,000 to $64,999 | 26 (7.4%) | 8 (2.1%) |
| $65,000 to $74,999 | 14 (4.0%) | 19 (5.0%) |
| $75,000 to $99,999 | 42 (12.0%) | 16 (4.2%) |
| $100,000+ | 16 (4.6%) | 3 (0.8%) |
| Total | 349 (100.0%) | 378 (100.0%) |
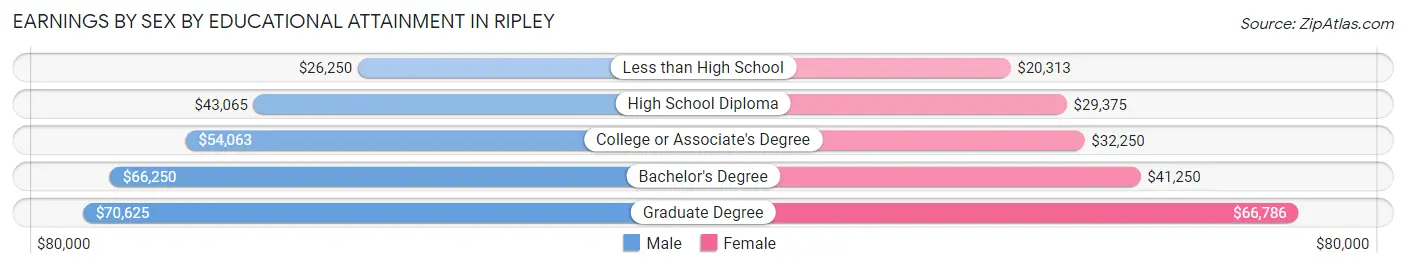
Earnings by Sex by Educational Attainment in Ripley
Average earnings in Ripley are $44,073 for men and $30,167 for women, a difference of 31.6%. Men with an educational attainment of graduate degree enjoy the highest average annual earnings of $70,625, while those with less than high school education earn the least with $26,250. Women with an educational attainment of graduate degree earn the most with the average annual earnings of $66,786, while those with less than high school education have the smallest earnings of $20,313.
| Educational Attainment | Male Income | Female Income |
| Less than High School | $26,250 | $20,313 |
| High School Diploma | $43,065 | $29,375 |
| College or Associate's Degree | $54,063 | $32,250 |
| Bachelor's Degree | $66,250 | $41,250 |
| Graduate Degree | $70,625 | $66,786 |
| Total | $44,073 | $30,167 |
Family Income in Ripley
Family Income Brackets in Ripley
According to the Ripley family income data, there are 98 families falling into the $35,000 to $49,999 income range, which is the most common income bracket and makes up 22.7% of all families. Conversely, the $150,000 to $199,999 income bracket is the least frequent group with only 13 families (3.0%) belonging to this category.
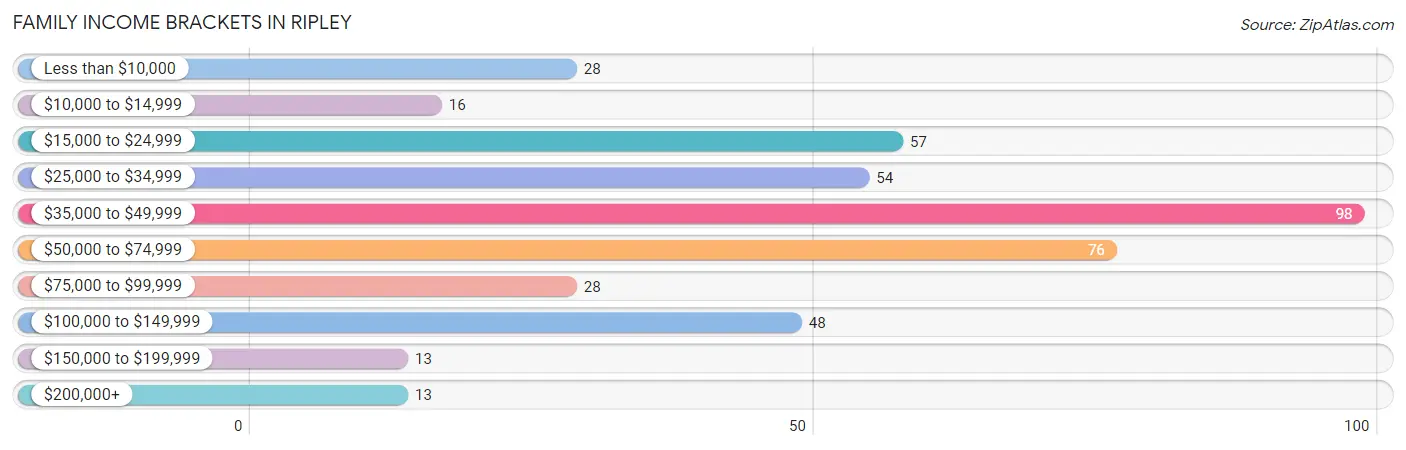
| Income Bracket | # Families | % Families |
| Less than $10,000 | 28 | 6.5% |
| $10,000 to $14,999 | 16 | 3.7% |
| $15,000 to $24,999 | 57 | 13.2% |
| $25,000 to $34,999 | 54 | 12.5% |
| $35,000 to $49,999 | 98 | 22.7% |
| $50,000 to $74,999 | 76 | 17.6% |
| $75,000 to $99,999 | 28 | 6.5% |
| $100,000 to $149,999 | 48 | 11.1% |
| $150,000 to $199,999 | 13 | 3.0% |
| $200,000+ | 13 | 3.0% |
Family Income by Famaliy Size in Ripley
4-person families (49 | 11.4%) account for the highest median family income in Ripley with $68,854 per family, while 2-person families (236 | 54.8%) have the highest median income of $21,598 per family member.
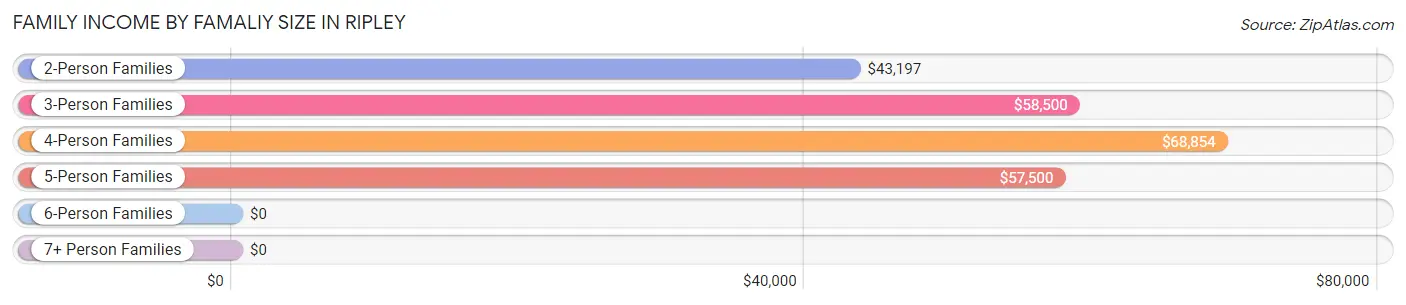
| Income Bracket | # Families | Median Income |
| 2-Person Families | 236 (54.8%) | $43,197 |
| 3-Person Families | 102 (23.7%) | $58,500 |
| 4-Person Families | 49 (11.4%) | $68,854 |
| 5-Person Families | 20 (4.6%) | $57,500 |
| 6-Person Families | 24 (5.6%) | $0 |
| 7+ Person Families | 0 (0.0%) | $0 |
| Total | 431 (100.0%) | $44,375 |
Family Income by Number of Earners in Ripley
The median family income in Ripley is $44,375, with families comprising 3+ earners (25) having the highest median family income of $106,607, while families with no earners (115) have the lowest median family income of $24,097, accounting for 5.8% and 26.7% of families, respectively.
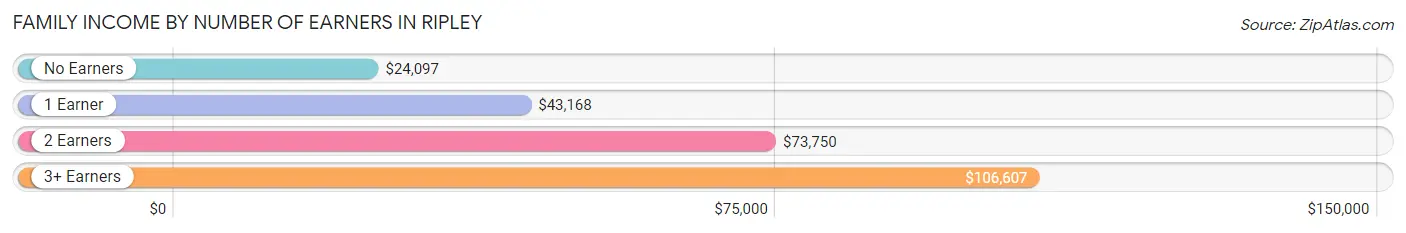
| Number of Earners | # Families | Median Income |
| No Earners | 115 (26.7%) | $24,097 |
| 1 Earner | 165 (38.3%) | $43,168 |
| 2 Earners | 126 (29.2%) | $73,750 |
| 3+ Earners | 25 (5.8%) | $106,607 |
| Total | 431 (100.0%) | $44,375 |
Household Income in Ripley
Household Income Brackets in Ripley
With 144 households falling in the category, the $35,000 to $49,999 income range is the most frequent in Ripley, accounting for 20.6% of all households. In contrast, only 13 households (1.9%) fall into the $200,000+ income bracket, making it the least populous group.
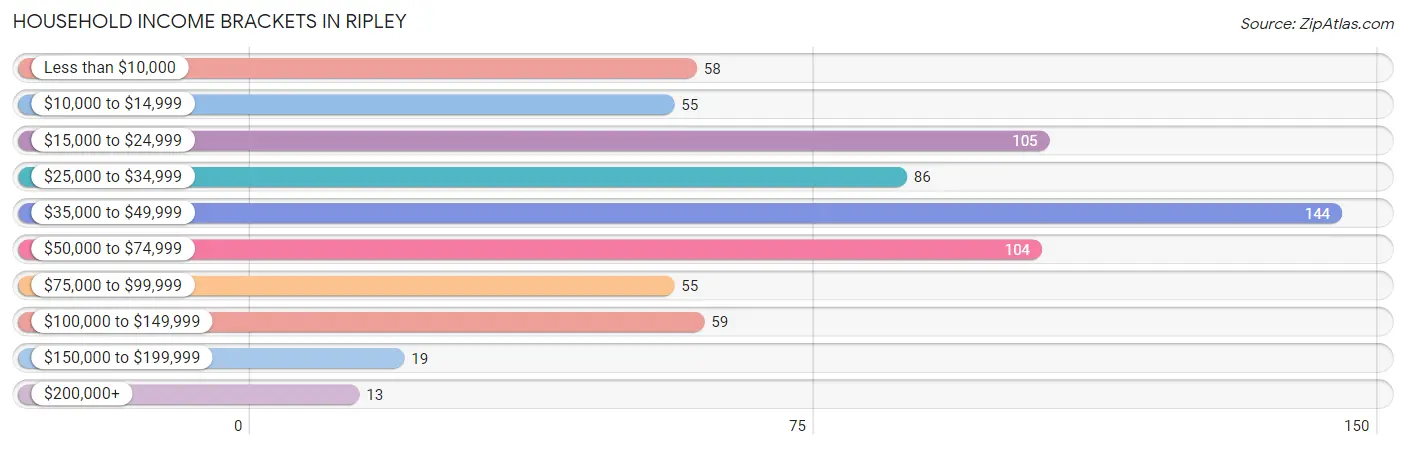
| Income Bracket | # Households | % Households |
| Less than $10,000 | 58 | 8.3% |
| $10,000 to $14,999 | 55 | 7.9% |
| $15,000 to $24,999 | 105 | 15.0% |
| $25,000 to $34,999 | 86 | 12.3% |
| $35,000 to $49,999 | 144 | 20.6% |
| $50,000 to $74,999 | 104 | 14.9% |
| $75,000 to $99,999 | 55 | 7.9% |
| $100,000 to $149,999 | 59 | 8.5% |
| $150,000 to $199,999 | 19 | 2.7% |
| $200,000+ | 13 | 1.9% |
Household Income by Householder Age in Ripley
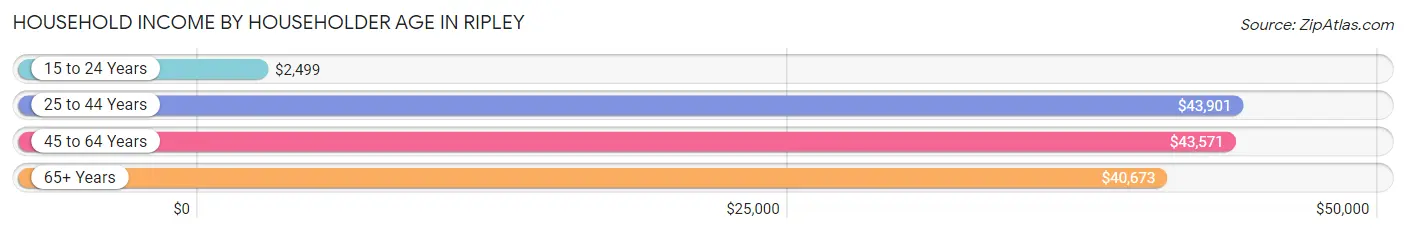
The median household income in Ripley is $42,900, with the highest median household income of $43,901 found in the 25 to 44 years age bracket for the primary householder. A total of 219 households (31.4%) fall into this category. Meanwhile, the 15 to 24 years age bracket for the primary householder has the lowest median household income of $2,499, with 40 households (5.7%) in this group.
| Income Bracket | # Households | Median Income |
| 15 to 24 Years | 40 (5.7%) | $2,499 |
| 25 to 44 Years | 219 (31.4%) | $43,901 |
| 45 to 64 Years | 272 (39.0%) | $43,571 |
| 65+ Years | 167 (23.9%) | $40,673 |
| Total | 698 (100.0%) | $42,900 |
Poverty in Ripley
Income Below Poverty by Sex and Age in Ripley
With 24.6% poverty level for males and 26.2% for females among the residents of Ripley, 16 and 17 year old males and under 5 year old females are the most vulnerable to poverty, with 16 males (80.0%) and 38 females (55.9%) in their respective age groups living below the poverty level.
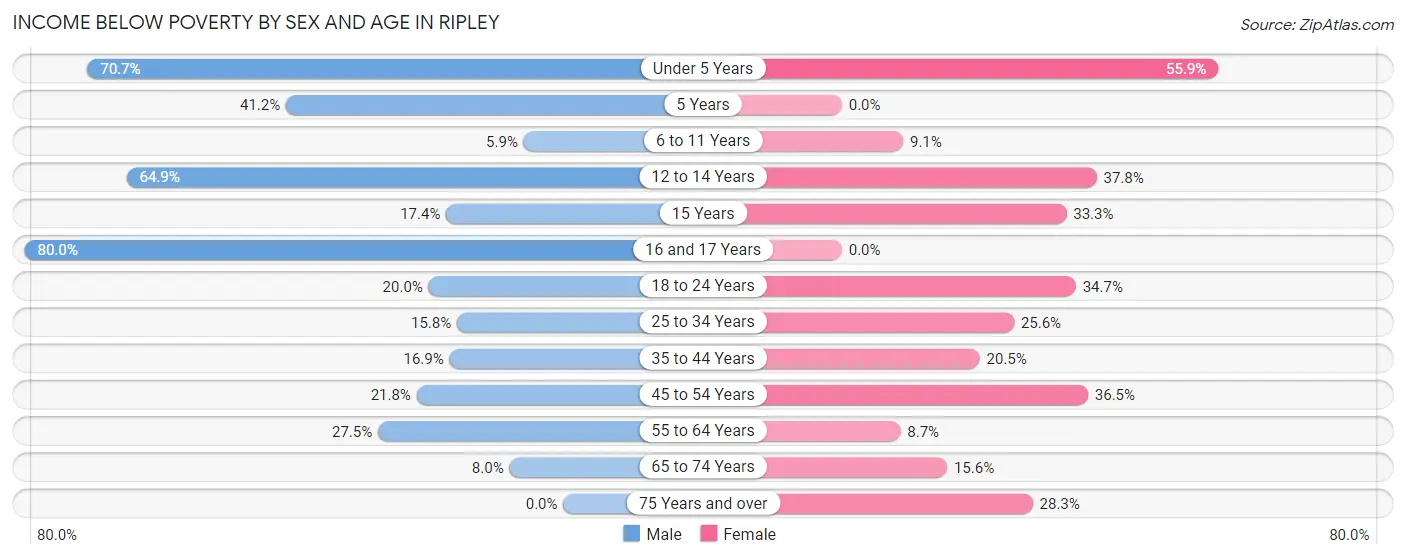
| Age Bracket | Male | Female |
| Under 5 Years | 41 (70.7%) | 38 (55.9%) |
| 5 Years | 7 (41.2%) | 0 (0.0%) |
| 6 to 11 Years | 4 (5.9%) | 4 (9.1%) |
| 12 to 14 Years | 24 (64.9%) | 14 (37.8%) |
| 15 Years | 4 (17.4%) | 5 (33.3%) |
| 16 and 17 Years | 16 (80.0%) | 0 (0.0%) |
| 18 to 24 Years | 11 (20.0%) | 33 (34.7%) |
| 25 to 34 Years | 18 (15.8%) | 23 (25.6%) |
| 35 to 44 Years | 12 (16.9%) | 18 (20.4%) |
| 45 to 54 Years | 22 (21.8%) | 38 (36.5%) |
| 55 to 64 Years | 30 (27.5%) | 8 (8.7%) |
| 65 to 74 Years | 6 (8.0%) | 15 (15.6%) |
| 75 Years and over | 0 (0.0%) | 17 (28.3%) |
| Total | 195 (24.6%) | 213 (26.2%) |
Income Above Poverty by Sex and Age in Ripley
According to the poverty statistics in Ripley, males aged 75 years and over and females aged 5 years are the age groups that are most secure financially, with 100.0% of males and 100.0% of females in these age groups living above the poverty line.
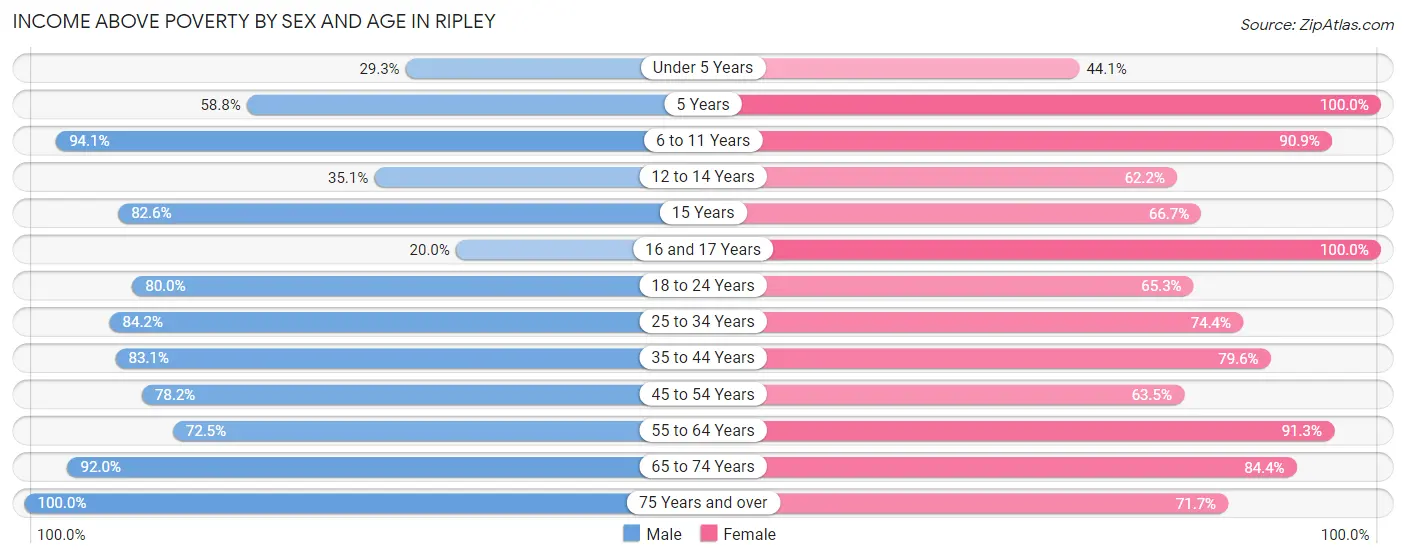
| Age Bracket | Male | Female |
| Under 5 Years | 17 (29.3%) | 30 (44.1%) |
| 5 Years | 10 (58.8%) | 11 (100.0%) |
| 6 to 11 Years | 64 (94.1%) | 40 (90.9%) |
| 12 to 14 Years | 13 (35.1%) | 23 (62.2%) |
| 15 Years | 19 (82.6%) | 10 (66.7%) |
| 16 and 17 Years | 4 (20.0%) | 14 (100.0%) |
| 18 to 24 Years | 44 (80.0%) | 62 (65.3%) |
| 25 to 34 Years | 96 (84.2%) | 67 (74.4%) |
| 35 to 44 Years | 59 (83.1%) | 70 (79.5%) |
| 45 to 54 Years | 79 (78.2%) | 66 (63.5%) |
| 55 to 64 Years | 79 (72.5%) | 84 (91.3%) |
| 65 to 74 Years | 69 (92.0%) | 81 (84.4%) |
| 75 Years and over | 44 (100.0%) | 43 (71.7%) |
| Total | 597 (75.4%) | 601 (73.8%) |
Income Below Poverty Among Married-Couple Families in Ripley
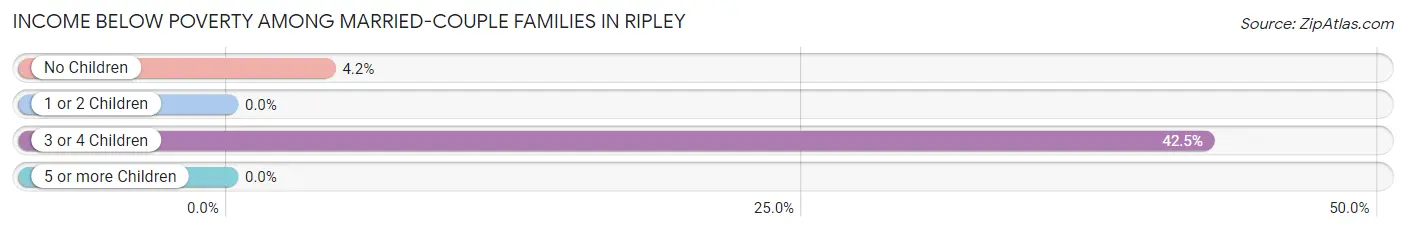
The poverty statistics for married-couple families in Ripley show that 11.0% or 22 of the total 200 families live below the poverty line. Families with 3 or 4 children have the highest poverty rate of 42.5%, comprising of 17 families. On the other hand, families with 1 or 2 children have the lowest poverty rate of 0.0%, which includes 0 families.
| Children | Above Poverty | Below Poverty |
| No Children | 113 (95.8%) | 5 (4.2%) |
| 1 or 2 Children | 42 (100.0%) | 0 (0.0%) |
| 3 or 4 Children | 23 (57.5%) | 17 (42.5%) |
| 5 or more Children | 0 (0.0%) | 0 (0.0%) |
| Total | 178 (89.0%) | 22 (11.0%) |
Income Below Poverty Among Single-Parent Households in Ripley
According to the poverty data in Ripley, 11.3% or 11 single-father households and 38.8% or 52 single-mother households are living below the poverty line. Among single-father households, those with 1 or 2 children have the highest poverty rate, with 11 households (15.9%) experiencing poverty. Likewise, among single-mother households, those with 1 or 2 children have the highest poverty rate, with 49 households (47.1%) falling below the poverty line.
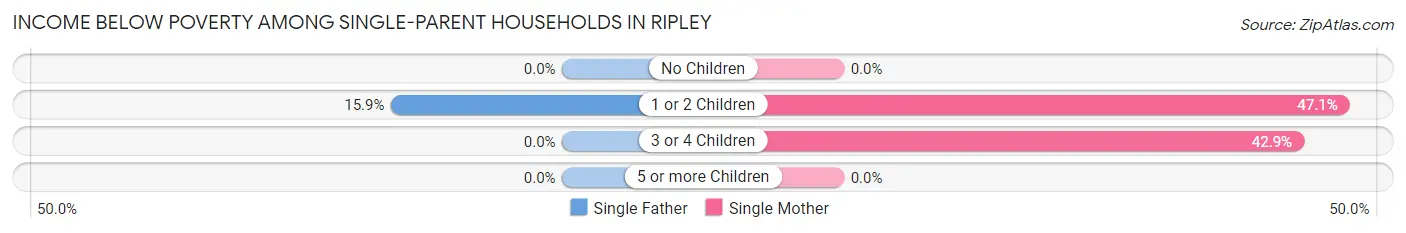
| Children | Single Father | Single Mother |
| No Children | 0 (0.0%) | 0 (0.0%) |
| 1 or 2 Children | 11 (15.9%) | 49 (47.1%) |
| 3 or 4 Children | 0 (0.0%) | 3 (42.9%) |
| 5 or more Children | 0 (0.0%) | 0 (0.0%) |
| Total | 11 (11.3%) | 52 (38.8%) |
Income Below Poverty Among Married-Couple vs Single-Parent Households in Ripley
The poverty data for Ripley shows that 22 of the married-couple family households (11.0%) and 63 of the single-parent households (27.3%) are living below the poverty level. Within the married-couple family households, those with 3 or 4 children have the highest poverty rate, with 17 households (42.5%) falling below the poverty line. Among the single-parent households, those with 1 or 2 children have the highest poverty rate, with 60 household (34.7%) living below poverty.
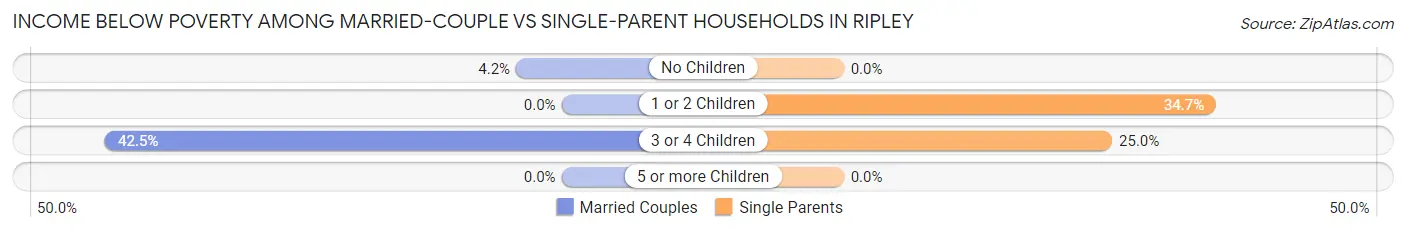
| Children | Married-Couple Families | Single-Parent Households |
| No Children | 5 (4.2%) | 0 (0.0%) |
| 1 or 2 Children | 0 (0.0%) | 60 (34.7%) |
| 3 or 4 Children | 17 (42.5%) | 3 (25.0%) |
| 5 or more Children | 0 (0.0%) | 0 (0.0%) |
| Total | 22 (11.0%) | 63 (27.3%) |
Race in Ripley
The most populous races in Ripley are White / Caucasian (1,359 | 84.5%), Two or more Races (200 | 12.4%), and Black / African American (42 | 2.6%).
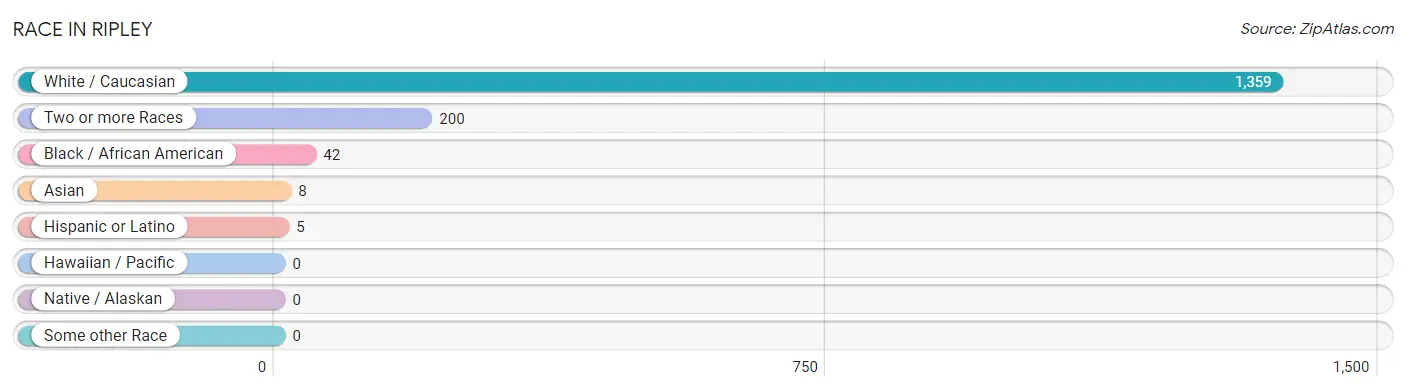
| Race | # Population | % Population |
| Asian | 8 | 0.5% |
| Black / African American | 42 | 2.6% |
| Hawaiian / Pacific | 0 | 0.0% |
| Hispanic or Latino | 5 | 0.3% |
| Native / Alaskan | 0 | 0.0% |
| White / Caucasian | 1,359 | 84.5% |
| Two or more Races | 200 | 12.4% |
| Some other Race | 0 | 0.0% |
| Total | 1,609 | 100.0% |
Ancestry in Ripley
The most populous ancestries reported in Ripley are German (348 | 21.6%), English (146 | 9.1%), Irish (133 | 8.3%), American (122 | 7.6%), and Arab (88 | 5.5%), together accounting for 52.0% of all Ripley residents.
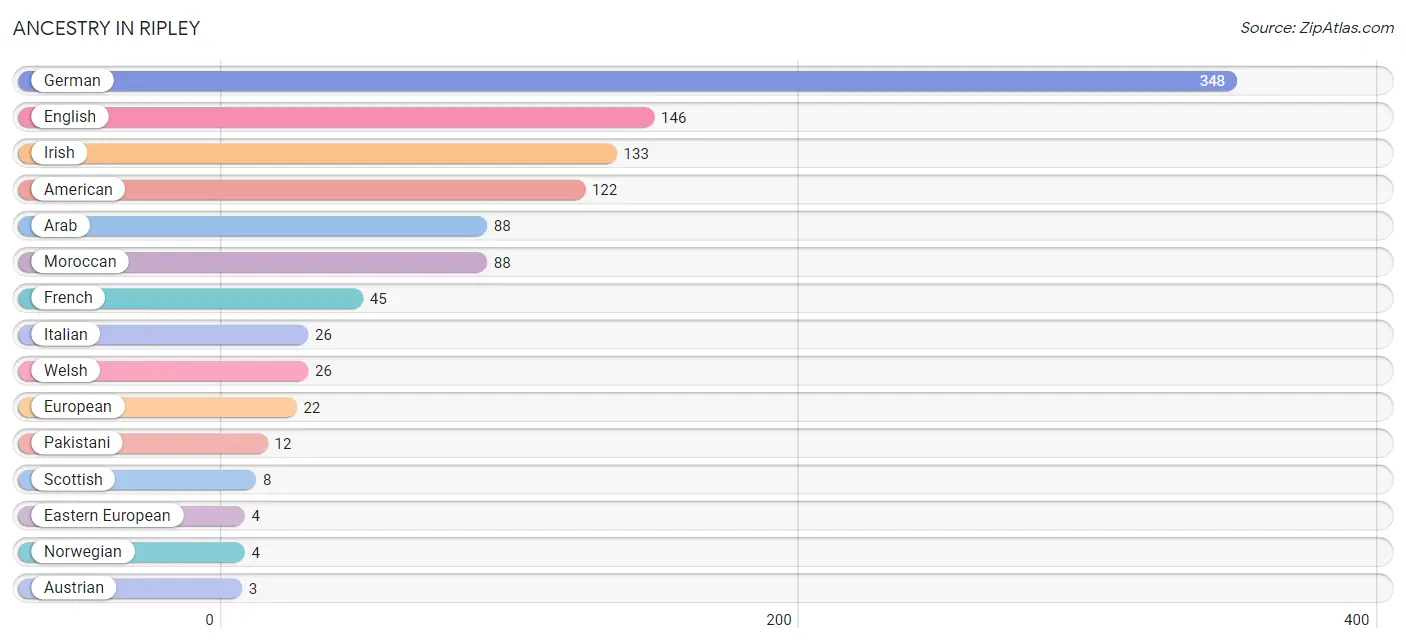
| Ancestry | # Population | % Population |
| African | 2 | 0.1% |
| American | 122 | 7.6% |
| Arab | 88 | 5.5% |
| Austrian | 3 | 0.2% |
| British | 2 | 0.1% |
| Burmese | 3 | 0.2% |
| Cherokee | 3 | 0.2% |
| Cuban | 3 | 0.2% |
| Dutch | 3 | 0.2% |
| Eastern European | 4 | 0.3% |
| English | 146 | 9.1% |
| European | 22 | 1.4% |
| French | 45 | 2.8% |
| German | 348 | 21.6% |
| Greek | 2 | 0.1% |
| Irish | 133 | 8.3% |
| Italian | 26 | 1.6% |
| Moroccan | 88 | 5.5% |
| Norwegian | 4 | 0.3% |
| Pakistani | 12 | 0.7% |
| Scottish | 8 | 0.5% |
| Subsaharan African | 2 | 0.1% |
| Welsh | 26 | 1.6% | View All 23 Rows |
Immigrants in Ripley
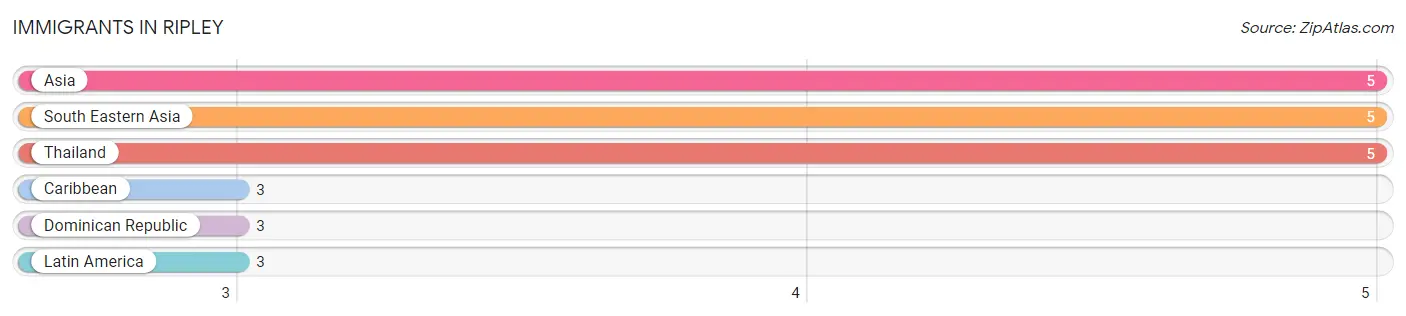
The most numerous immigrant groups reported in Ripley came from Asia (5 | 0.3%), South Eastern Asia (5 | 0.3%), Thailand (5 | 0.3%), Caribbean (3 | 0.2%), and Dominican Republic (3 | 0.2%), together accounting for 1.3% of all Ripley residents.
| Immigration Origin | # Population | % Population |
| Asia | 5 | 0.3% |
| Caribbean | 3 | 0.2% |
| Dominican Republic | 3 | 0.2% |
| Latin America | 3 | 0.2% |
| South Eastern Asia | 5 | 0.3% |
| Thailand | 5 | 0.3% | View All 6 Rows |
Sex and Age in Ripley
Sex and Age in Ripley
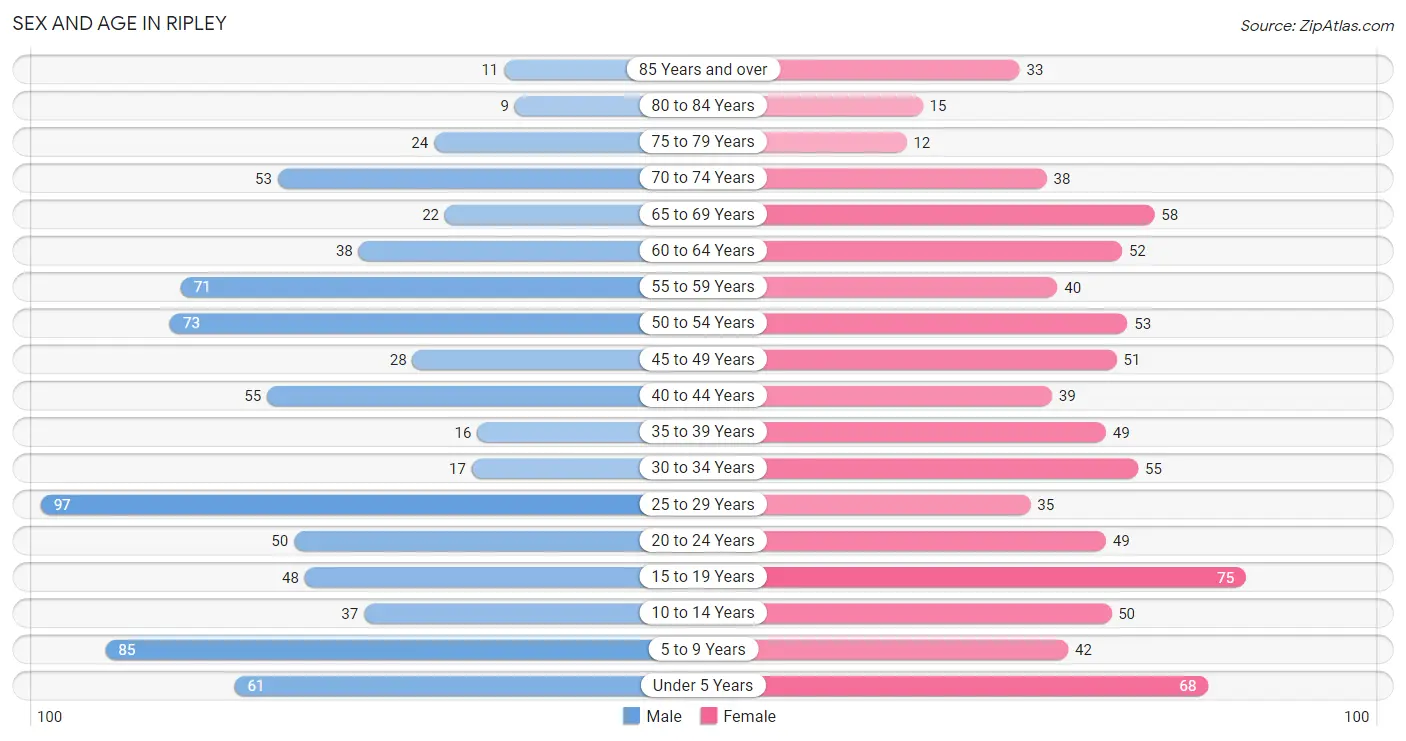
The most populous age groups in Ripley are 25 to 29 Years (97 | 12.2%) for men and 15 to 19 Years (75 | 9.2%) for women.
| Age Bracket | Male | Female |
| Under 5 Years | 61 (7.7%) | 68 (8.4%) |
| 5 to 9 Years | 85 (10.7%) | 42 (5.2%) |
| 10 to 14 Years | 37 (4.6%) | 50 (6.1%) |
| 15 to 19 Years | 48 (6.0%) | 75 (9.2%) |
| 20 to 24 Years | 50 (6.3%) | 49 (6.0%) |
| 25 to 29 Years | 97 (12.2%) | 35 (4.3%) |
| 30 to 34 Years | 17 (2.1%) | 55 (6.8%) |
| 35 to 39 Years | 16 (2.0%) | 49 (6.0%) |
| 40 to 44 Years | 55 (6.9%) | 39 (4.8%) |
| 45 to 49 Years | 28 (3.5%) | 51 (6.3%) |
| 50 to 54 Years | 73 (9.2%) | 53 (6.5%) |
| 55 to 59 Years | 71 (8.9%) | 40 (4.9%) |
| 60 to 64 Years | 38 (4.8%) | 52 (6.4%) |
| 65 to 69 Years | 22 (2.8%) | 58 (7.1%) |
| 70 to 74 Years | 53 (6.7%) | 38 (4.7%) |
| 75 to 79 Years | 24 (3.0%) | 12 (1.5%) |
| 80 to 84 Years | 9 (1.1%) | 15 (1.8%) |
| 85 Years and over | 11 (1.4%) | 33 (4.1%) |
| Total | 795 (100.0%) | 814 (100.0%) |
Families and Households in Ripley
Median Family Size in Ripley
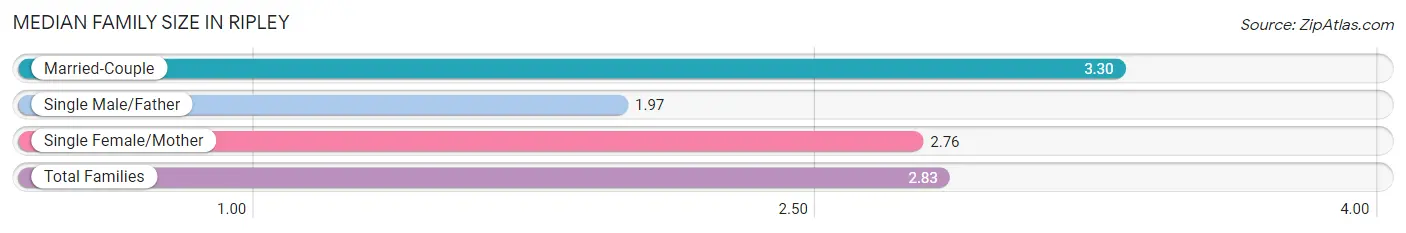
The median family size in Ripley is 2.83 persons per family, with married-couple families (200 | 46.4%) accounting for the largest median family size of 3.3 persons per family. On the other hand, single male/father families (97 | 22.5%) represent the smallest median family size with 1.97 persons per family.
| Family Type | # Families | Family Size |
| Married-Couple | 200 (46.4%) | 3.30 |
| Single Male/Father | 97 (22.5%) | 1.97 |
| Single Female/Mother | 134 (31.1%) | 2.76 |
| Total Families | 431 (100.0%) | 2.83 |
Median Household Size in Ripley
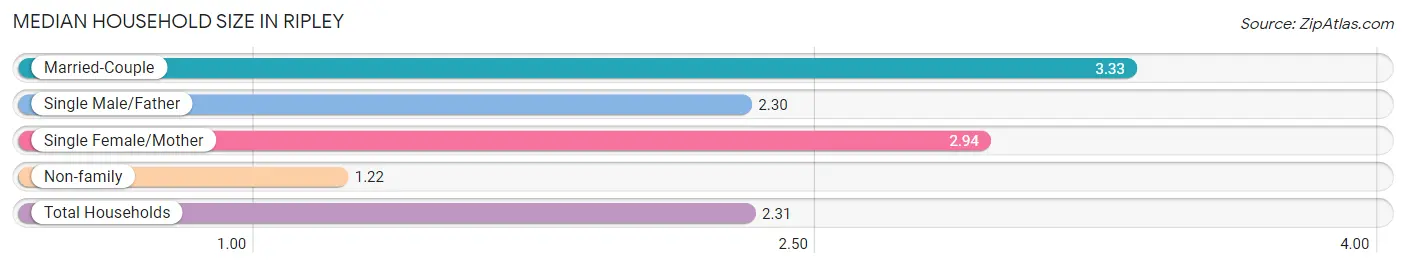
The median household size in Ripley is 2.31 persons per household, with married-couple households (200 | 28.6%) accounting for the largest median household size of 3.33 persons per household. non-family households (267 | 38.3%) represent the smallest median household size with 1.22 persons per household.
| Household Type | # Households | Household Size |
| Married-Couple | 200 (28.6%) | 3.33 |
| Single Male/Father | 97 (13.9%) | 2.30 |
| Single Female/Mother | 134 (19.2%) | 2.94 |
| Non-family | 267 (38.3%) | 1.22 |
| Total Households | 698 (100.0%) | 2.31 |
Household Size by Marriage Status in Ripley
Out of a total of 698 households in Ripley, 431 (61.8%) are family households, while 267 (38.3%) are nonfamily households. The most numerous type of family households are 2-person households, comprising 217, and the most common type of nonfamily households are 1-person households, comprising 214.
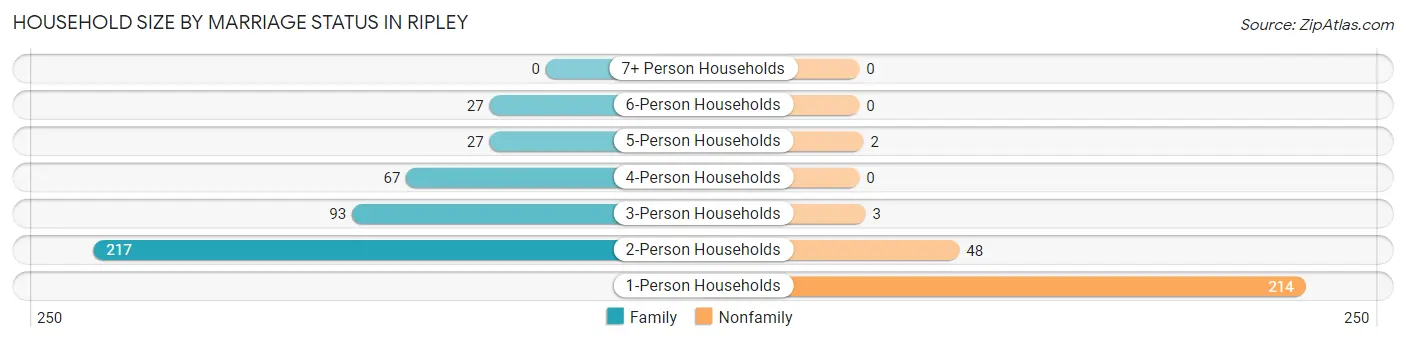
| Household Size | Family Households | Nonfamily Households |
| 1-Person Households | - | 214 (30.7%) |
| 2-Person Households | 217 (31.1%) | 48 (6.9%) |
| 3-Person Households | 93 (13.3%) | 3 (0.4%) |
| 4-Person Households | 67 (9.6%) | 0 (0.0%) |
| 5-Person Households | 27 (3.9%) | 2 (0.3%) |
| 6-Person Households | 27 (3.9%) | 0 (0.0%) |
| 7+ Person Households | 0 (0.0%) | 0 (0.0%) |
| Total | 431 (61.8%) | 267 (38.3%) |
Female Fertility in Ripley
Fertility by Age in Ripley
Average fertility rate in Ripley is 59.0 births per 1,000 women. Women in the age bracket of 20 to 34 years have the highest fertility rate with 151.0 births per 1,000 women. Women in the age bracket of 20 to 34 years acount for 100.0% of all women with births.
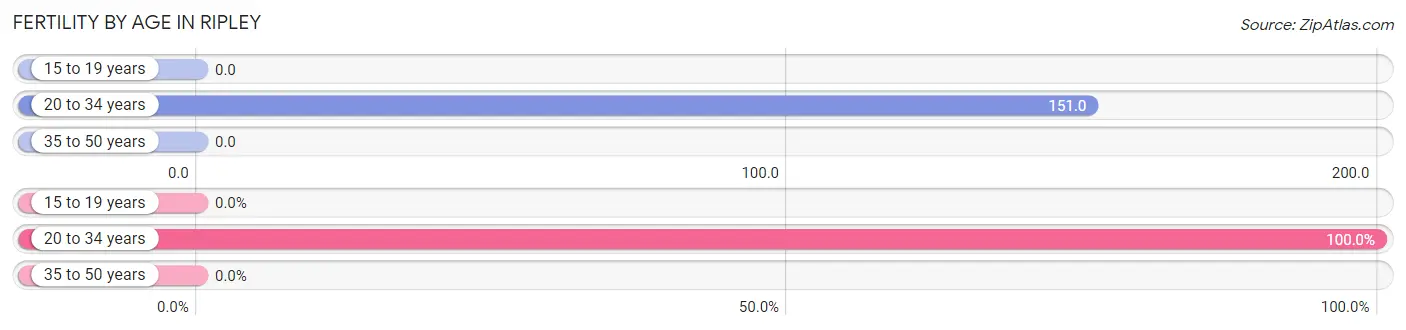
| Age Bracket | Women with Births | Births / 1,000 Women |
| 15 to 19 years | 0 (0.0%) | 0.0 |
| 20 to 34 years | 21 (100.0%) | 151.0 |
| 35 to 50 years | 0 (0.0%) | 0.0 |
| Total | 21 (100.0%) | 59.0 |
Fertility by Age by Marriage Status in Ripley
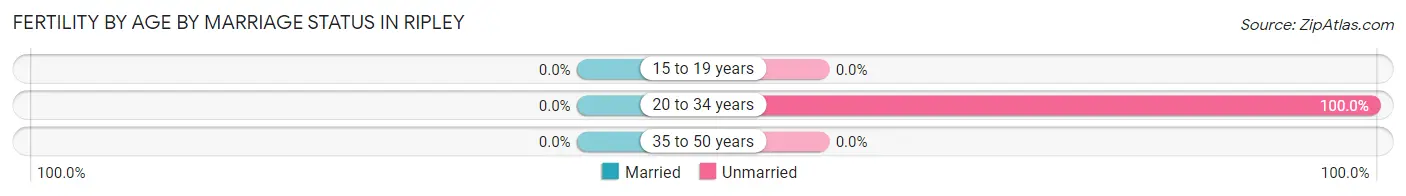
| Age Bracket | Married | Unmarried |
| 15 to 19 years | 0 (0.0%) | 0 (0.0%) |
| 20 to 34 years | 0 (0.0%) | 21 (100.0%) |
| 35 to 50 years | 0 (0.0%) | 0 (0.0%) |
| Total | 0 (0.0%) | 21 (100.0%) |
Fertility by Education in Ripley
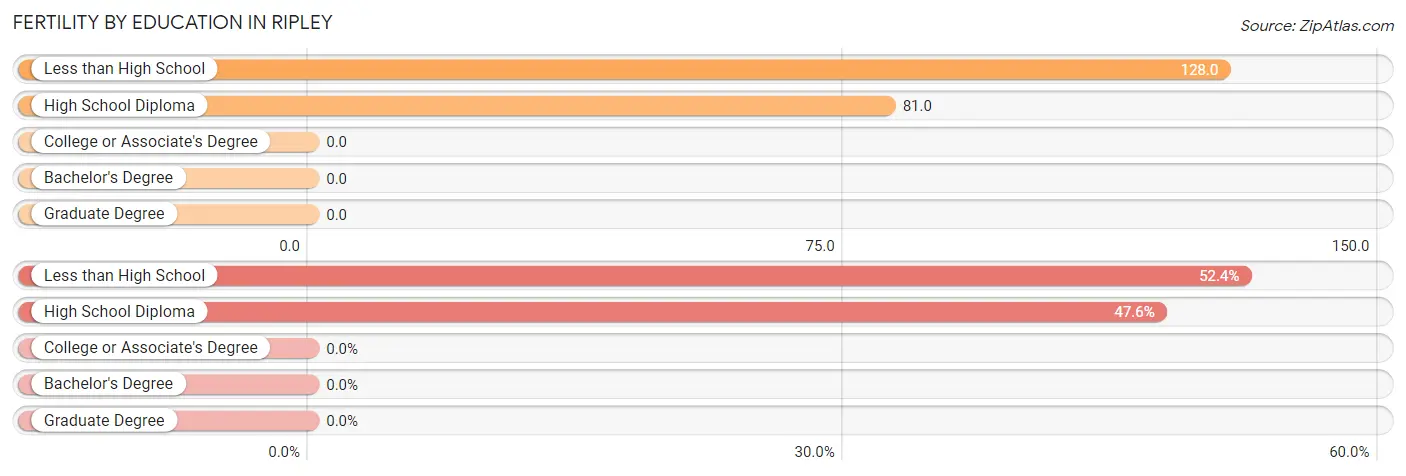
| Educational Attainment | Women with Births | Births / 1,000 Women |
| Less than High School | 11 (52.4%) | 128.0 |
| High School Diploma | 10 (47.6%) | 81.0 |
| College or Associate's Degree | 0 (0.0%) | 0.0 |
| Bachelor's Degree | 0 (0.0%) | 0.0 |
| Graduate Degree | 0 (0.0%) | 0.0 |
| Total | 21 (100.0%) | 59.0 |
Fertility by Education by Marriage Status in Ripley
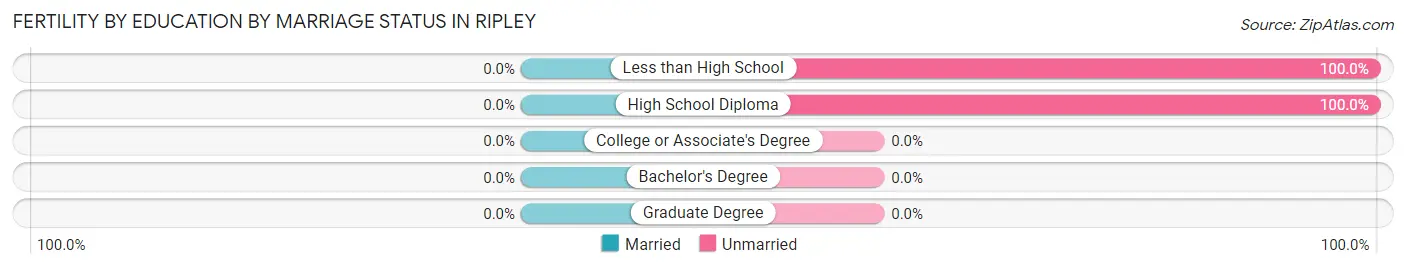
| Educational Attainment | Married | Unmarried |
| Less than High School | 0 (0.0%) | 11 (100.0%) |
| High School Diploma | 0 (0.0%) | 10 (100.0%) |
| College or Associate's Degree | 0 (0.0%) | 0 (0.0%) |
| Bachelor's Degree | 0 (0.0%) | 0 (0.0%) |
| Graduate Degree | 0 (0.0%) | 0 (0.0%) |
| Total | 0 (0.0%) | 21 (100.0%) |
Employment Characteristics in Ripley
Employment by Class of Employer in Ripley
Among the 630 employed individuals in Ripley, private company employees (444 | 70.5%), local government employees (60 | 9.5%), and not-for-profit organizations (38 | 6.0%) make up the most common classes of employment.
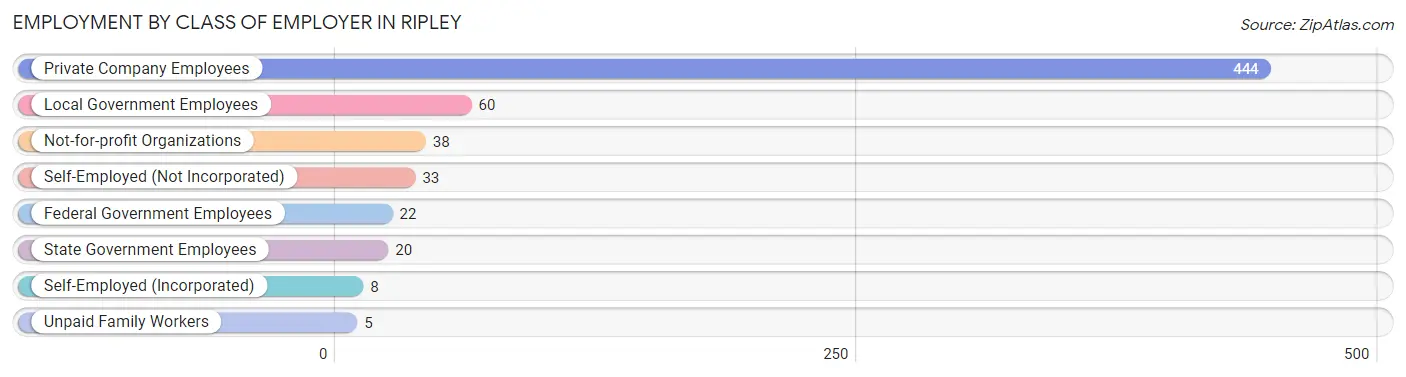
| Employer Class | # Employees | % Employees |
| Private Company Employees | 444 | 70.5% |
| Self-Employed (Incorporated) | 8 | 1.3% |
| Self-Employed (Not Incorporated) | 33 | 5.2% |
| Not-for-profit Organizations | 38 | 6.0% |
| Local Government Employees | 60 | 9.5% |
| State Government Employees | 20 | 3.2% |
| Federal Government Employees | 22 | 3.5% |
| Unpaid Family Workers | 5 | 0.8% |
| Total | 630 | 100.0% |
Employment Status by Age in Ripley
According to the labor force statistics for Ripley, out of the total population over 16 years of age (1,228), 59.0% or 725 individuals are in the labor force, with 11.7% or 85 of them unemployed. The age group with the highest labor force participation rate is 20 to 24 years, with 96.0% or 95 individuals in the labor force. Within the labor force, the 20 to 24 years age range has the highest percentage of unemployed individuals, with 36.8% or 35 of them being unemployed.
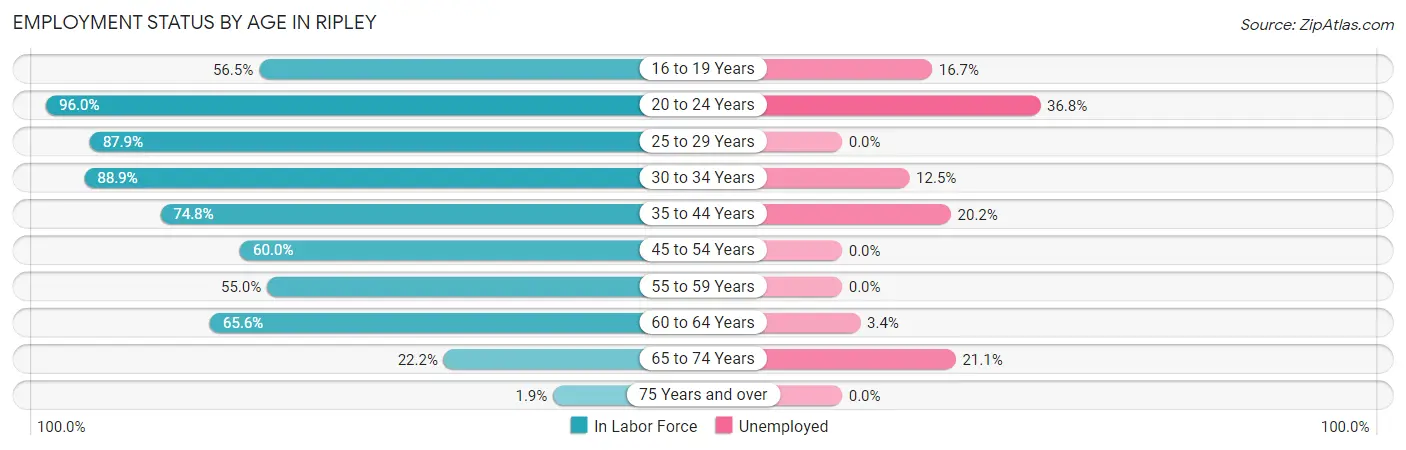
| Age Bracket | In Labor Force | Unemployed |
| 16 to 19 Years | 48 (56.5%) | 8 (16.7%) |
| 20 to 24 Years | 95 (96.0%) | 35 (36.8%) |
| 25 to 29 Years | 116 (87.9%) | 0 (0.0%) |
| 30 to 34 Years | 64 (88.9%) | 8 (12.5%) |
| 35 to 44 Years | 119 (74.8%) | 24 (20.2%) |
| 45 to 54 Years | 123 (60.0%) | 0 (0.0%) |
| 55 to 59 Years | 61 (55.0%) | 0 (0.0%) |
| 60 to 64 Years | 59 (65.6%) | 2 (3.4%) |
| 65 to 74 Years | 38 (22.2%) | 8 (21.1%) |
| 75 Years and over | 2 (1.9%) | 0 (0.0%) |
| Total | 725 (59.0%) | 85 (11.7%) |
Employment Status by Educational Attainment in Ripley
According to labor force statistics for Ripley, 70.5% of individuals (542) out of the total population between 25 and 64 years of age (769) are in the labor force, with 6.3% or 34 of them being unemployed. The group with the highest labor force participation rate are those with the educational attainment of bachelor's degree or higher, with 80.3% or 61 individuals in the labor force. Within the labor force, individuals with less than high school education have the highest percentage of unemployment, with 49.2% or 31 of them being unemployed.

| Educational Attainment | In Labor Force | Unemployed |
| Less than High School | 63 (50.0%) | 62 (49.2%) |
| High School Diploma | 285 (73.6%) | 3 (0.7%) |
| College / Associate Degree | 133 (73.9%) | 0 (0.0%) |
| Bachelor's Degree or higher | 61 (80.3%) | 1 (1.6%) |
| Total | 542 (70.5%) | 48 (6.3%) |
Employment Occupations by Sex in Ripley
Management, Business, Science and Arts Occupations
The most common Management, Business, Science and Arts occupations in Ripley are Community & Social Service (44 | 6.9%), Management (40 | 6.2%), Health Diagnosing & Treating (32 | 5.0%), Education Instruction & Library (26 | 4.1%), and Business & Financial (13 | 2.0%).
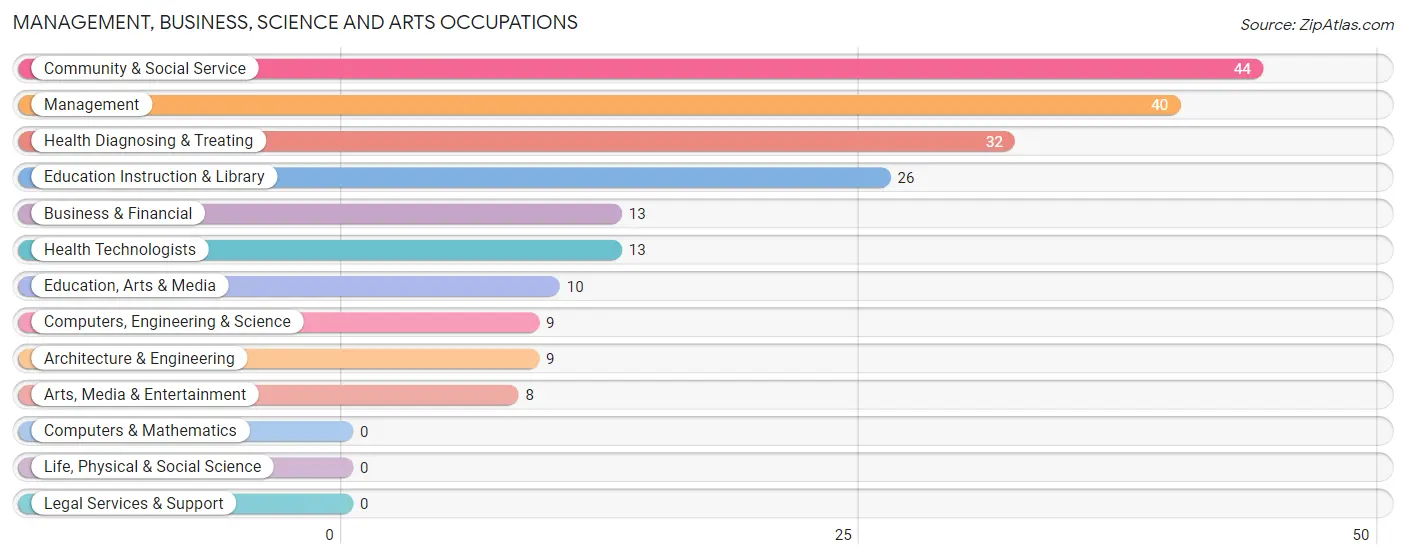
Management, Business, Science and Arts Occupations by Sex
Within the Management, Business, Science and Arts occupations in Ripley, the most male-oriented occupations are Computers, Engineering & Science (100.0%), Architecture & Engineering (100.0%), and Management (65.0%), while the most female-oriented occupations are Education, Arts & Media (100.0%), Health Diagnosing & Treating (100.0%), and Health Technologists (100.0%).
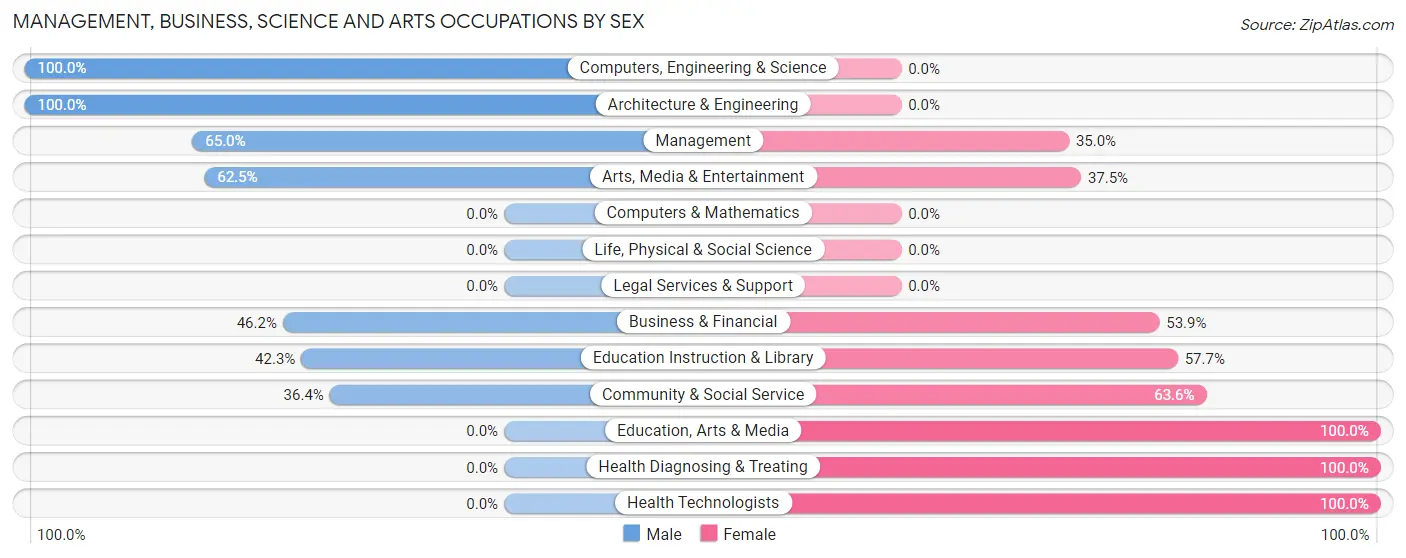
| Occupation | Male | Female |
| Management | 26 (65.0%) | 14 (35.0%) |
| Business & Financial | 6 (46.2%) | 7 (53.8%) |
| Computers, Engineering & Science | 9 (100.0%) | 0 (0.0%) |
| Computers & Mathematics | 0 (0.0%) | 0 (0.0%) |
| Architecture & Engineering | 9 (100.0%) | 0 (0.0%) |
| Life, Physical & Social Science | 0 (0.0%) | 0 (0.0%) |
| Community & Social Service | 16 (36.4%) | 28 (63.6%) |
| Education, Arts & Media | 0 (0.0%) | 10 (100.0%) |
| Legal Services & Support | 0 (0.0%) | 0 (0.0%) |
| Education Instruction & Library | 11 (42.3%) | 15 (57.7%) |
| Arts, Media & Entertainment | 5 (62.5%) | 3 (37.5%) |
| Health Diagnosing & Treating | 0 (0.0%) | 32 (100.0%) |
| Health Technologists | 0 (0.0%) | 13 (100.0%) |
| Total (Category) | 57 (41.3%) | 81 (58.7%) |
| Total (Overall) | 324 (50.6%) | 316 (49.4%) |
Services Occupations
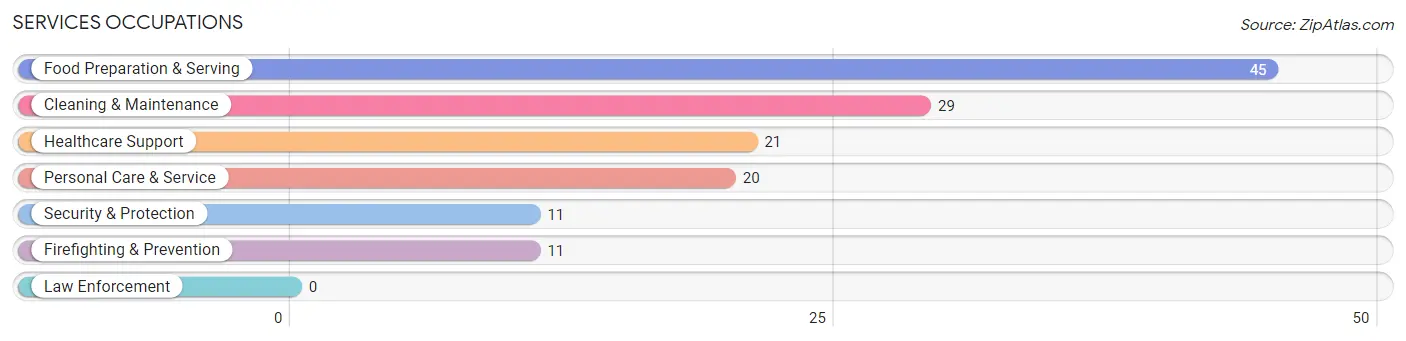
The most common Services occupations in Ripley are Food Preparation & Serving (45 | 7.0%), Cleaning & Maintenance (29 | 4.5%), Healthcare Support (21 | 3.3%), Personal Care & Service (20 | 3.1%), and Security & Protection (11 | 1.7%).
Services Occupations by Sex
Within the Services occupations in Ripley, the most male-oriented occupations are Security & Protection (90.9%), Firefighting & Prevention (90.9%), and Cleaning & Maintenance (62.1%), while the most female-oriented occupations are Healthcare Support (100.0%), Personal Care & Service (100.0%), and Food Preparation & Serving (93.3%).
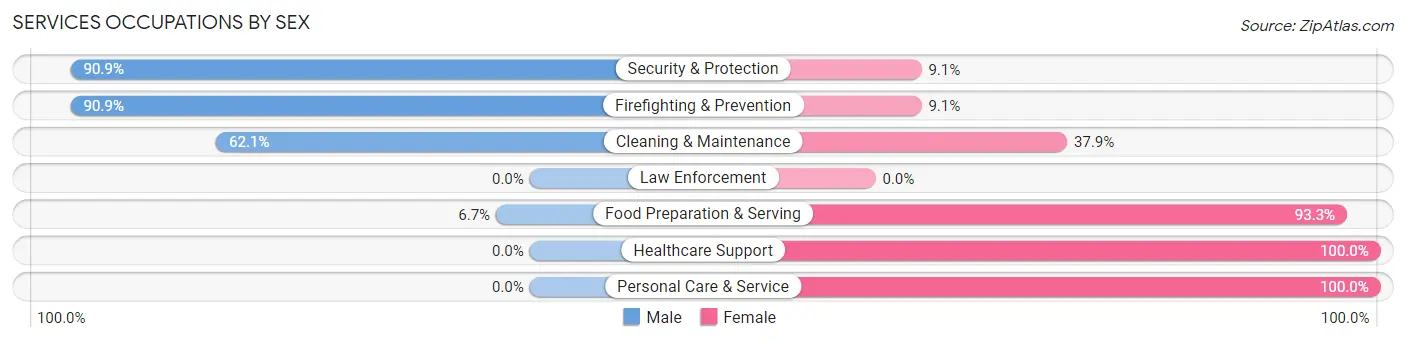
| Occupation | Male | Female |
| Healthcare Support | 0 (0.0%) | 21 (100.0%) |
| Security & Protection | 10 (90.9%) | 1 (9.1%) |
| Firefighting & Prevention | 10 (90.9%) | 1 (9.1%) |
| Law Enforcement | 0 (0.0%) | 0 (0.0%) |
| Food Preparation & Serving | 3 (6.7%) | 42 (93.3%) |
| Cleaning & Maintenance | 18 (62.1%) | 11 (37.9%) |
| Personal Care & Service | 0 (0.0%) | 20 (100.0%) |
| Total (Category) | 31 (24.6%) | 95 (75.4%) |
| Total (Overall) | 324 (50.6%) | 316 (49.4%) |
Sales and Office Occupations
The most common Sales and Office occupations in Ripley are Sales & Related (95 | 14.8%), and Office & Administration (66 | 10.3%).
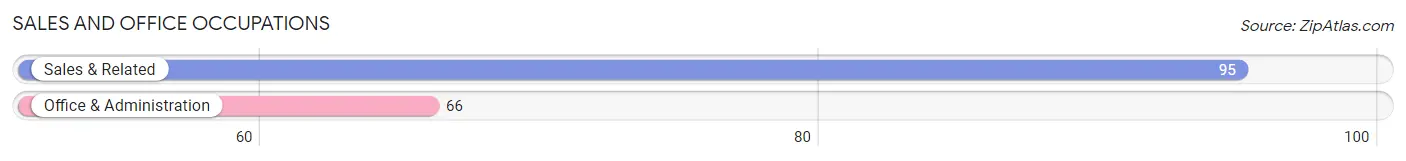
Sales and Office Occupations by Sex
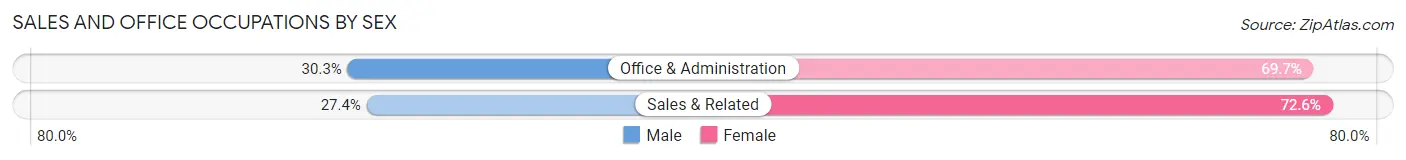
| Occupation | Male | Female |
| Sales & Related | 26 (27.4%) | 69 (72.6%) |
| Office & Administration | 20 (30.3%) | 46 (69.7%) |
| Total (Category) | 46 (28.6%) | 115 (71.4%) |
| Total (Overall) | 324 (50.6%) | 316 (49.4%) |
Natural Resources, Construction and Maintenance Occupations
The most common Natural Resources, Construction and Maintenance occupations in Ripley are Construction & Extraction (45 | 7.0%), and Installation, Maintenance & Repair (8 | 1.3%).
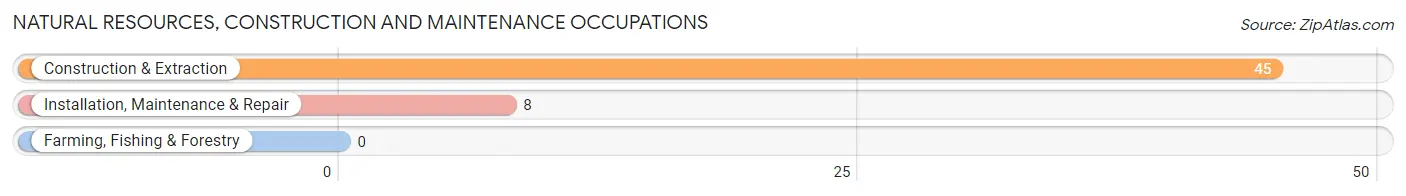
Natural Resources, Construction and Maintenance Occupations by Sex
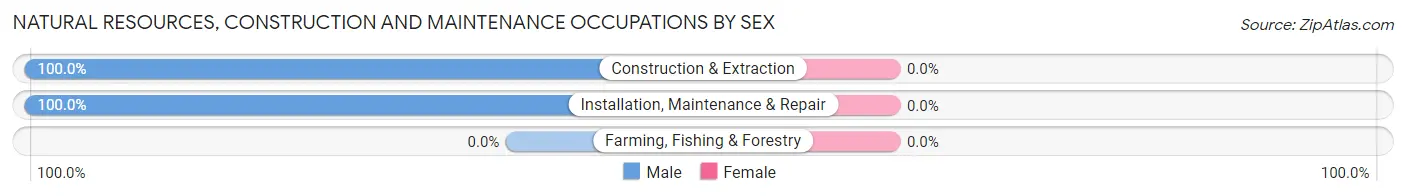
| Occupation | Male | Female |
| Farming, Fishing & Forestry | 0 (0.0%) | 0 (0.0%) |
| Construction & Extraction | 45 (100.0%) | 0 (0.0%) |
| Installation, Maintenance & Repair | 8 (100.0%) | 0 (0.0%) |
| Total (Category) | 53 (100.0%) | 0 (0.0%) |
| Total (Overall) | 324 (50.6%) | 316 (49.4%) |
Production, Transportation and Moving Occupations
The most common Production, Transportation and Moving occupations in Ripley are Material Moving (71 | 11.1%), Production (48 | 7.5%), and Transportation (43 | 6.7%).
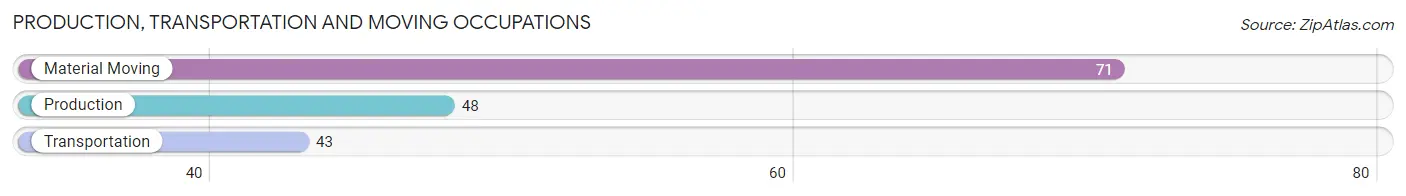
Production, Transportation and Moving Occupations by Sex
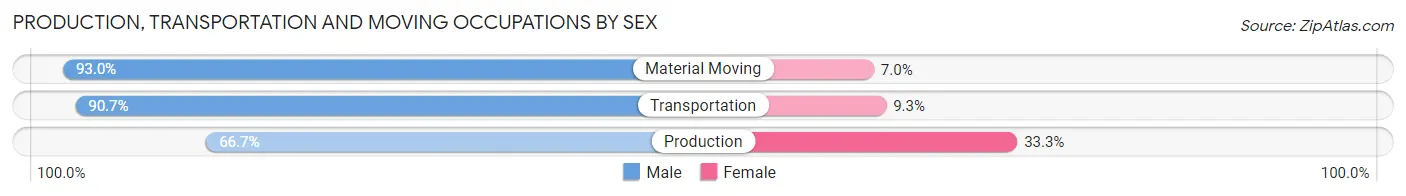
| Occupation | Male | Female |
| Production | 32 (66.7%) | 16 (33.3%) |
| Transportation | 39 (90.7%) | 4 (9.3%) |
| Material Moving | 66 (93.0%) | 5 (7.0%) |
| Total (Category) | 137 (84.6%) | 25 (15.4%) |
| Total (Overall) | 324 (50.6%) | 316 (49.4%) |
Employment Industries by Sex in Ripley
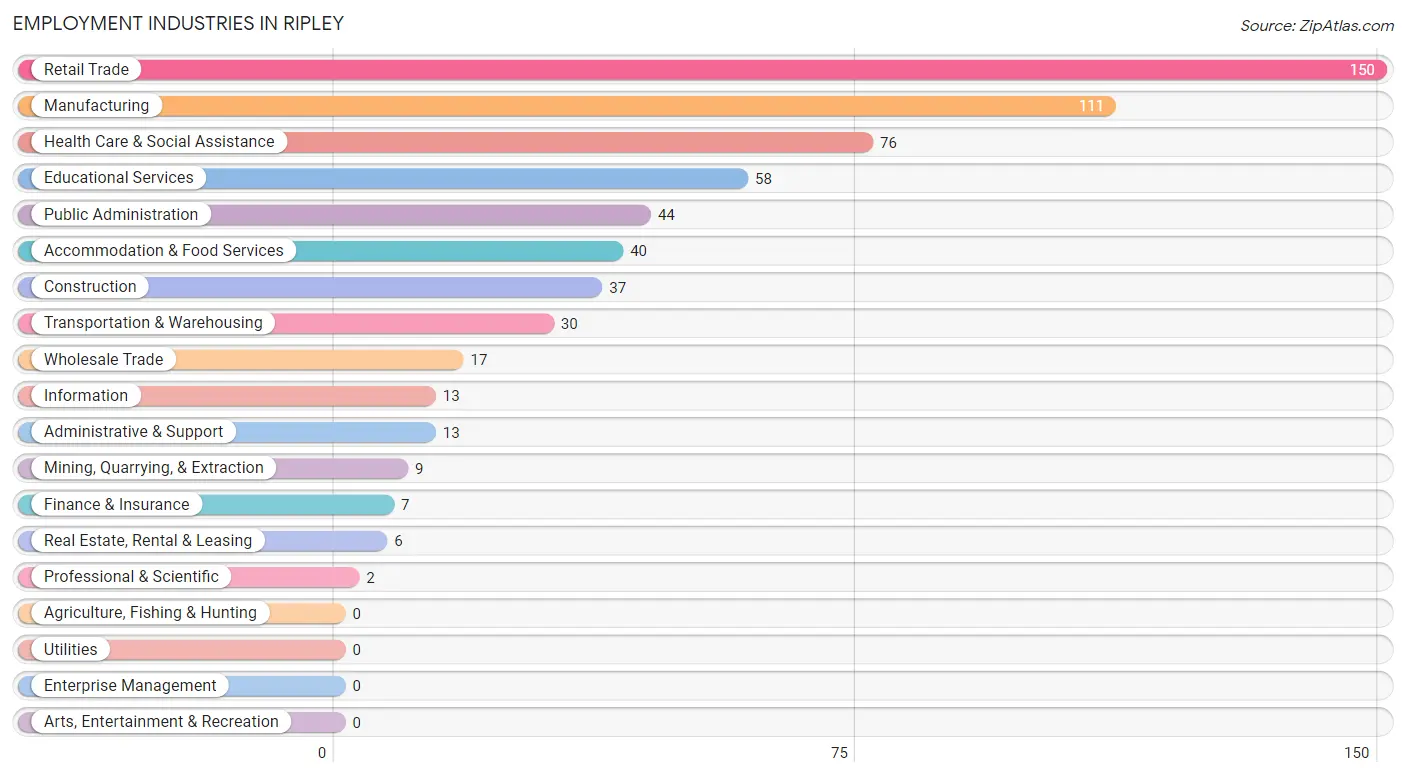
Employment Industries in Ripley
The major employment industries in Ripley include Retail Trade (150 | 23.4%), Manufacturing (111 | 17.3%), Health Care & Social Assistance (76 | 11.9%), Educational Services (58 | 9.1%), and Public Administration (44 | 6.9%).
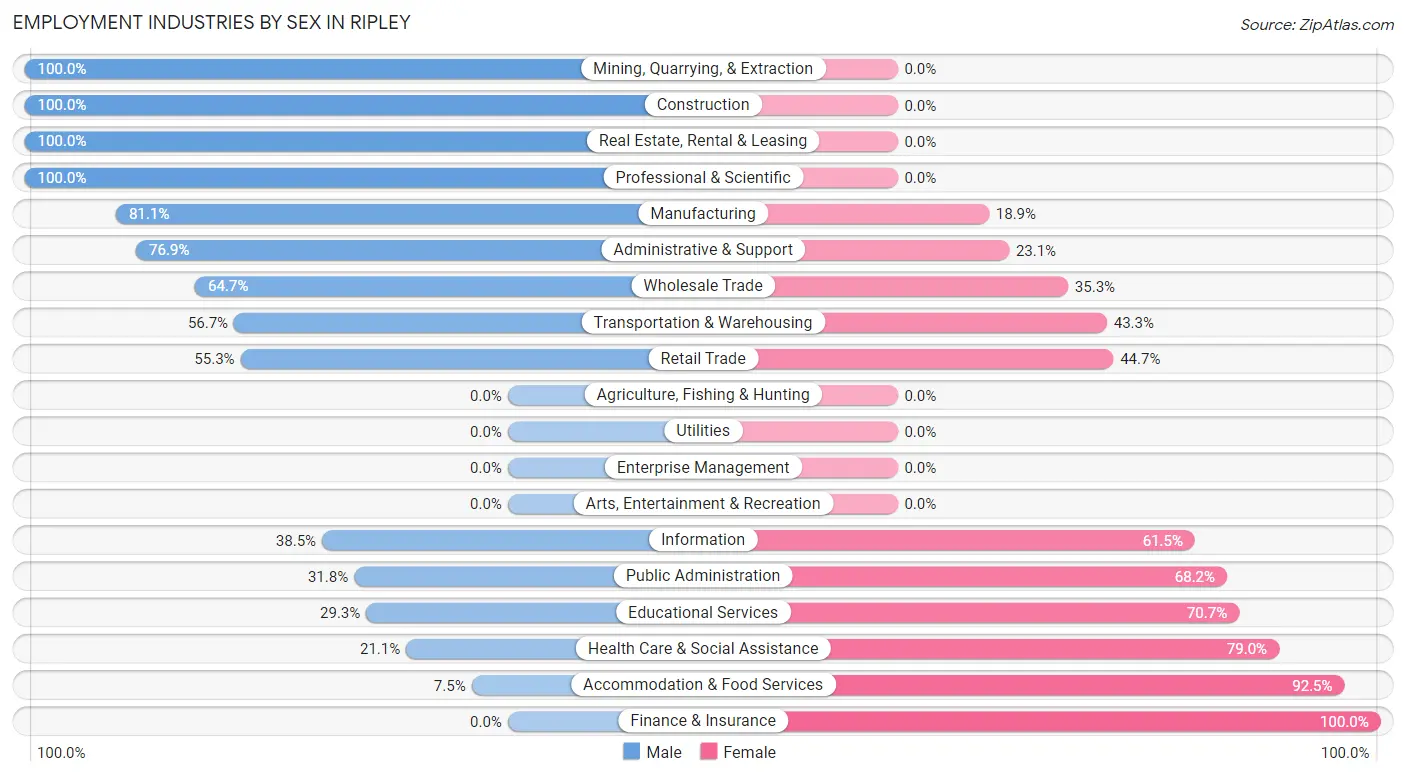
Employment Industries by Sex in Ripley
The Ripley industries that see more men than women are Mining, Quarrying, & Extraction (100.0%), Construction (100.0%), and Real Estate, Rental & Leasing (100.0%), whereas the industries that tend to have a higher number of women are Finance & Insurance (100.0%), Accommodation & Food Services (92.5%), and Health Care & Social Assistance (78.9%).
| Industry | Male | Female |
| Agriculture, Fishing & Hunting | 0 (0.0%) | 0 (0.0%) |
| Mining, Quarrying, & Extraction | 9 (100.0%) | 0 (0.0%) |
| Construction | 37 (100.0%) | 0 (0.0%) |
| Manufacturing | 90 (81.1%) | 21 (18.9%) |
| Wholesale Trade | 11 (64.7%) | 6 (35.3%) |
| Retail Trade | 83 (55.3%) | 67 (44.7%) |
| Transportation & Warehousing | 17 (56.7%) | 13 (43.3%) |
| Utilities | 0 (0.0%) | 0 (0.0%) |
| Information | 5 (38.5%) | 8 (61.5%) |
| Finance & Insurance | 0 (0.0%) | 7 (100.0%) |
| Real Estate, Rental & Leasing | 6 (100.0%) | 0 (0.0%) |
| Professional & Scientific | 2 (100.0%) | 0 (0.0%) |
| Enterprise Management | 0 (0.0%) | 0 (0.0%) |
| Administrative & Support | 10 (76.9%) | 3 (23.1%) |
| Educational Services | 17 (29.3%) | 41 (70.7%) |
| Health Care & Social Assistance | 16 (21.0%) | 60 (78.9%) |
| Arts, Entertainment & Recreation | 0 (0.0%) | 0 (0.0%) |
| Accommodation & Food Services | 3 (7.5%) | 37 (92.5%) |
| Public Administration | 14 (31.8%) | 30 (68.2%) |
| Total | 324 (50.6%) | 316 (49.4%) |
Education in Ripley
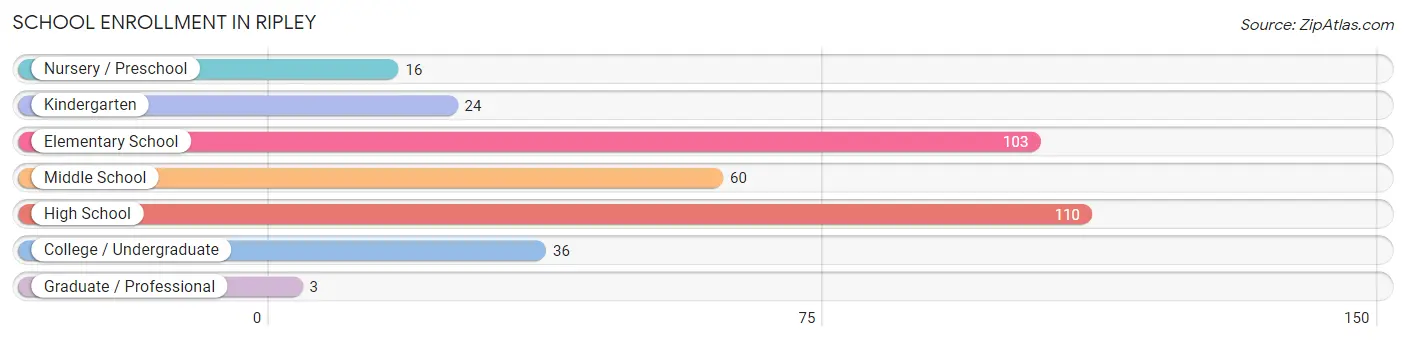
School Enrollment in Ripley
The most common levels of schooling among the 352 students in Ripley are high school (110 | 31.2%), elementary school (103 | 29.3%), and middle school (60 | 17.1%).
| School Level | # Students | % Students |
| Nursery / Preschool | 16 | 4.5% |
| Kindergarten | 24 | 6.8% |
| Elementary School | 103 | 29.3% |
| Middle School | 60 | 17.1% |
| High School | 110 | 31.2% |
| College / Undergraduate | 36 | 10.2% |
| Graduate / Professional | 3 | 0.9% |
| Total | 352 | 100.0% |
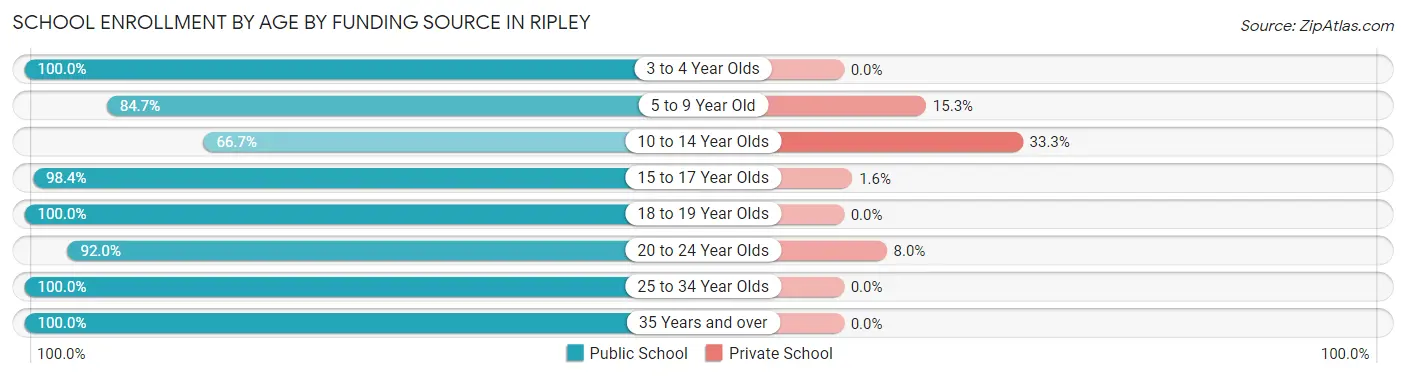
School Enrollment by Age by Funding Source in Ripley
Out of a total of 352 students who are enrolled in schools in Ripley, 51 (14.5%) attend a private institution, while the remaining 301 (85.5%) are enrolled in public schools. The age group of 10 to 14 year olds has the highest likelihood of being enrolled in private schools, with 29 (33.3% in the age bracket) enrolled. Conversely, the age group of 3 to 4 year olds has the lowest likelihood of being enrolled in a private school, with 10 (100.0% in the age bracket) attending a public institution.
| Age Bracket | Public School | Private School |
| 3 to 4 Year Olds | 10 (100.0%) | 0 (0.0%) |
| 5 to 9 Year Old | 105 (84.7%) | 19 (15.3%) |
| 10 to 14 Year Olds | 58 (66.7%) | 29 (33.3%) |
| 15 to 17 Year Olds | 62 (98.4%) | 1 (1.6%) |
| 18 to 19 Year Olds | 24 (100.0%) | 0 (0.0%) |
| 20 to 24 Year Olds | 23 (92.0%) | 2 (8.0%) |
| 25 to 34 Year Olds | 10 (100.0%) | 0 (0.0%) |
| 35 Years and over | 9 (100.0%) | 0 (0.0%) |
| Total | 301 (85.5%) | 51 (14.5%) |
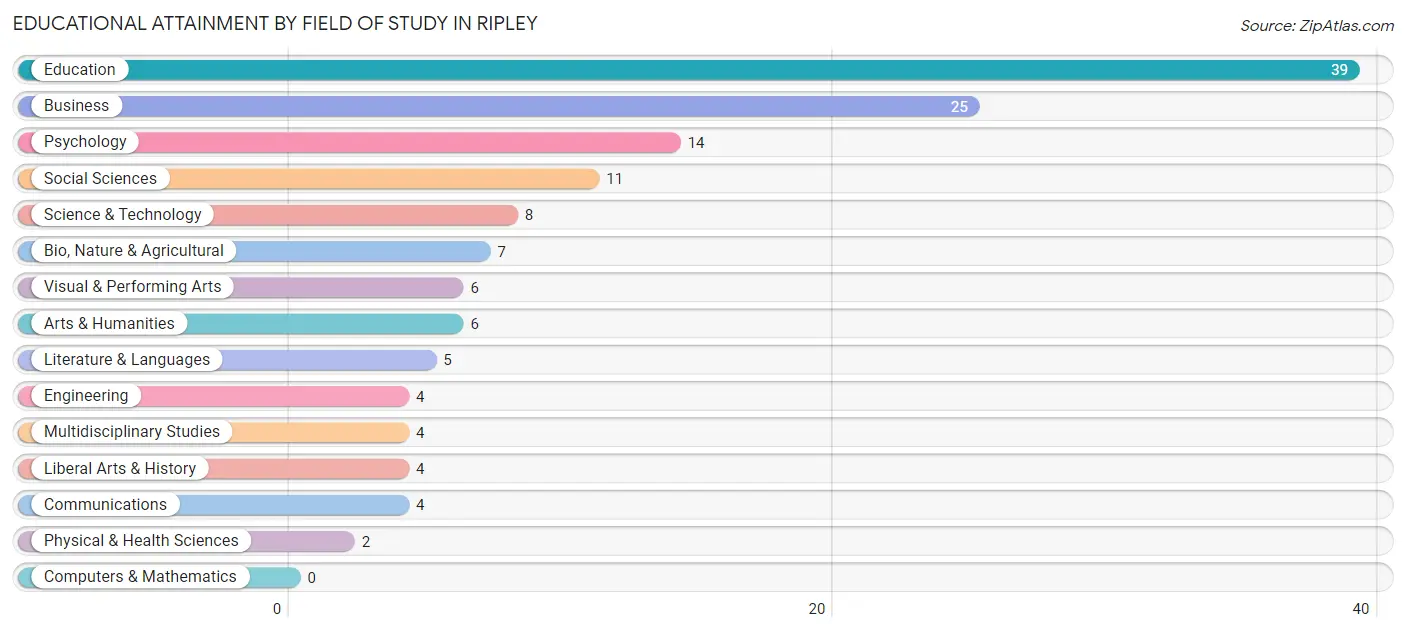
Educational Attainment by Field of Study in Ripley
Education (39 | 28.1%), business (25 | 18.0%), psychology (14 | 10.1%), social sciences (11 | 7.9%), and science & technology (8 | 5.8%) are the most common fields of study among 139 individuals in Ripley who have obtained a bachelor's degree or higher.
| Field of Study | # Graduates | % Graduates |
| Computers & Mathematics | 0 | 0.0% |
| Bio, Nature & Agricultural | 7 | 5.0% |
| Physical & Health Sciences | 2 | 1.4% |
| Psychology | 14 | 10.1% |
| Social Sciences | 11 | 7.9% |
| Engineering | 4 | 2.9% |
| Multidisciplinary Studies | 4 | 2.9% |
| Science & Technology | 8 | 5.8% |
| Business | 25 | 18.0% |
| Education | 39 | 28.1% |
| Literature & Languages | 5 | 3.6% |
| Liberal Arts & History | 4 | 2.9% |
| Visual & Performing Arts | 6 | 4.3% |
| Communications | 4 | 2.9% |
| Arts & Humanities | 6 | 4.3% |
| Total | 139 | 100.0% |
Transportation & Commute in Ripley
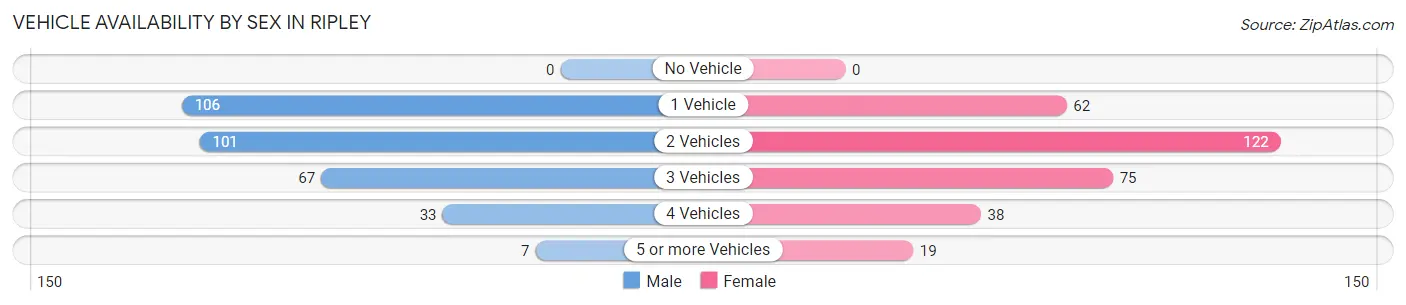
Vehicle Availability by Sex in Ripley
The most prevalent vehicle ownership categories in Ripley are males with 1 vehicle (106, accounting for 33.8%) and females with 1 vehicle (62, making up 33.5%).
| Vehicles Available | Male | Female |
| No Vehicle | 0 (0.0%) | 0 (0.0%) |
| 1 Vehicle | 106 (33.8%) | 62 (19.6%) |
| 2 Vehicles | 101 (32.2%) | 122 (38.6%) |
| 3 Vehicles | 67 (21.3%) | 75 (23.7%) |
| 4 Vehicles | 33 (10.5%) | 38 (12.0%) |
| 5 or more Vehicles | 7 (2.2%) | 19 (6.0%) |
| Total | 314 (100.0%) | 316 (100.0%) |
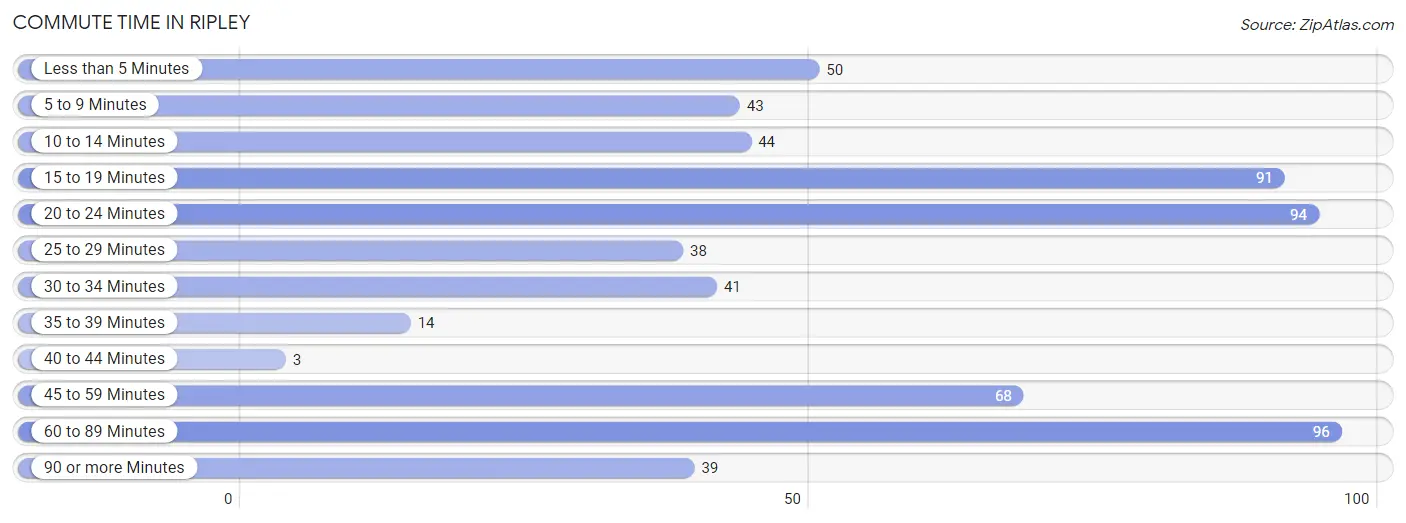
Commute Time in Ripley
The most frequently occuring commute durations in Ripley are 60 to 89 minutes (96 commuters, 15.5%), 20 to 24 minutes (94 commuters, 15.1%), and 15 to 19 minutes (91 commuters, 14.6%).
| Commute Time | # Commuters | % Commuters |
| Less than 5 Minutes | 50 | 8.1% |
| 5 to 9 Minutes | 43 | 6.9% |
| 10 to 14 Minutes | 44 | 7.1% |
| 15 to 19 Minutes | 91 | 14.6% |
| 20 to 24 Minutes | 94 | 15.1% |
| 25 to 29 Minutes | 38 | 6.1% |
| 30 to 34 Minutes | 41 | 6.6% |
| 35 to 39 Minutes | 14 | 2.2% |
| 40 to 44 Minutes | 3 | 0.5% |
| 45 to 59 Minutes | 68 | 11.0% |
| 60 to 89 Minutes | 96 | 15.5% |
| 90 or more Minutes | 39 | 6.3% |
Commute Time by Sex in Ripley
The most common commute times in Ripley are 15 to 19 minutes (80 commuters, 25.7%) for males and 20 to 24 minutes (84 commuters, 27.1%) for females.
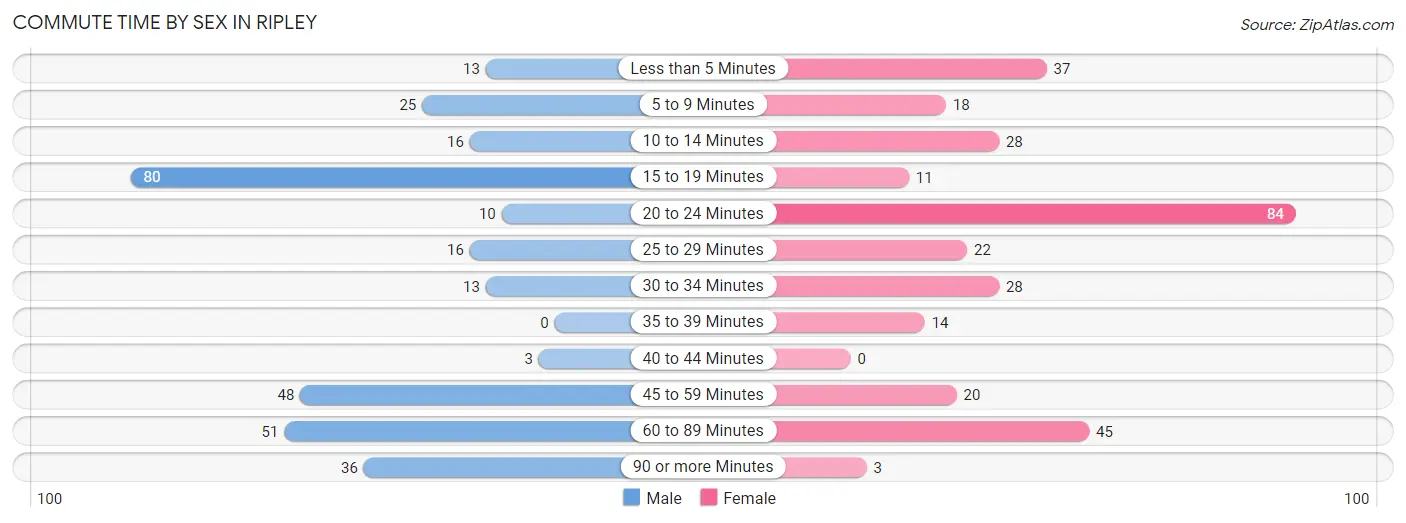
| Commute Time | Male | Female |
| Less than 5 Minutes | 13 (4.2%) | 37 (11.9%) |
| 5 to 9 Minutes | 25 (8.0%) | 18 (5.8%) |
| 10 to 14 Minutes | 16 (5.1%) | 28 (9.0%) |
| 15 to 19 Minutes | 80 (25.7%) | 11 (3.5%) |
| 20 to 24 Minutes | 10 (3.2%) | 84 (27.1%) |
| 25 to 29 Minutes | 16 (5.1%) | 22 (7.1%) |
| 30 to 34 Minutes | 13 (4.2%) | 28 (9.0%) |
| 35 to 39 Minutes | 0 (0.0%) | 14 (4.5%) |
| 40 to 44 Minutes | 3 (1.0%) | 0 (0.0%) |
| 45 to 59 Minutes | 48 (15.4%) | 20 (6.5%) |
| 60 to 89 Minutes | 51 (16.4%) | 45 (14.5%) |
| 90 or more Minutes | 36 (11.6%) | 3 (1.0%) |
Time of Departure to Work by Sex in Ripley
The most frequent times of departure to work in Ripley are 4:00 PM to 11:59 PM (69, 22.2%) for males and 12:00 PM to 3:59 PM (51, 16.5%) for females.
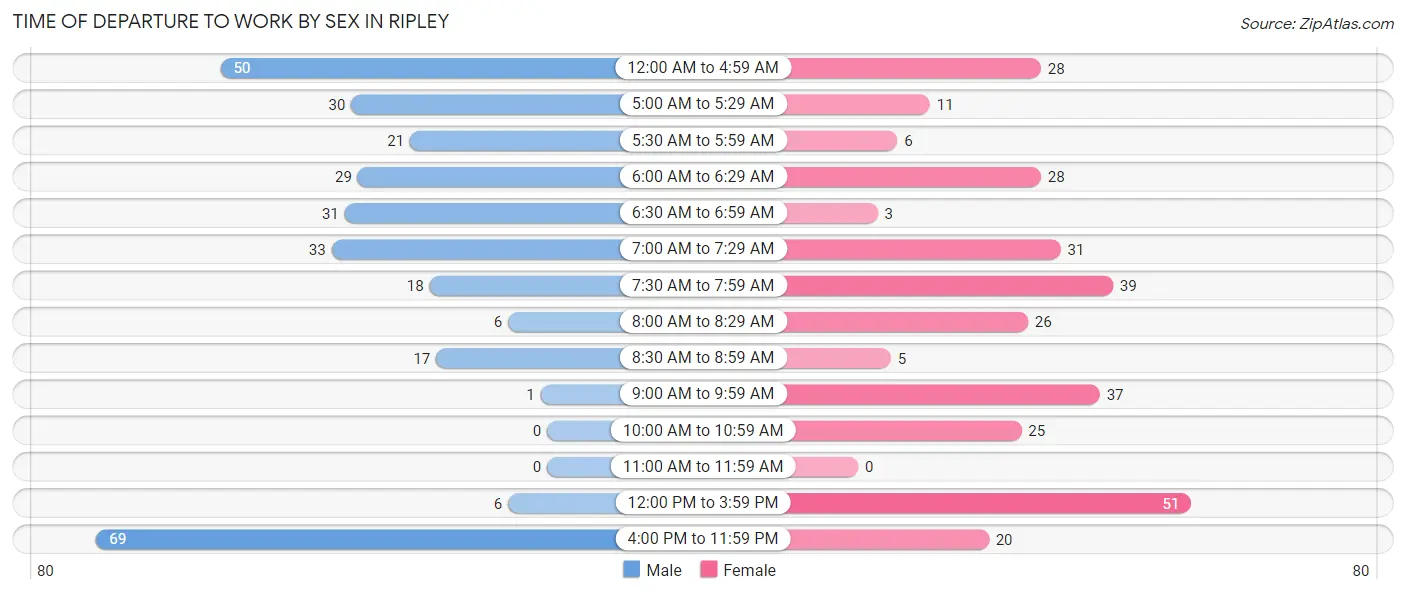
| Time of Departure | Male | Female |
| 12:00 AM to 4:59 AM | 50 (16.1%) | 28 (9.0%) |
| 5:00 AM to 5:29 AM | 30 (9.7%) | 11 (3.5%) |
| 5:30 AM to 5:59 AM | 21 (6.8%) | 6 (1.9%) |
| 6:00 AM to 6:29 AM | 29 (9.3%) | 28 (9.0%) |
| 6:30 AM to 6:59 AM | 31 (10.0%) | 3 (1.0%) |
| 7:00 AM to 7:29 AM | 33 (10.6%) | 31 (10.0%) |
| 7:30 AM to 7:59 AM | 18 (5.8%) | 39 (12.6%) |
| 8:00 AM to 8:29 AM | 6 (1.9%) | 26 (8.4%) |
| 8:30 AM to 8:59 AM | 17 (5.5%) | 5 (1.6%) |
| 9:00 AM to 9:59 AM | 1 (0.3%) | 37 (11.9%) |
| 10:00 AM to 10:59 AM | 0 (0.0%) | 25 (8.1%) |
| 11:00 AM to 11:59 AM | 0 (0.0%) | 0 (0.0%) |
| 12:00 PM to 3:59 PM | 6 (1.9%) | 51 (16.5%) |
| 4:00 PM to 11:59 PM | 69 (22.2%) | 20 (6.5%) |
| Total | 311 (100.0%) | 310 (100.0%) |
Housing Occupancy in Ripley
Occupancy by Ownership in Ripley
Of the total 698 dwellings in Ripley, owner-occupied units account for 366 (52.4%), while renter-occupied units make up 332 (47.6%).
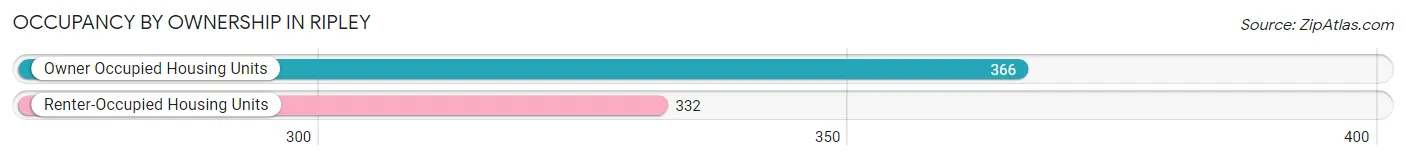
| Occupancy | # Housing Units | % Housing Units |
| Owner Occupied Housing Units | 366 | 52.4% |
| Renter-Occupied Housing Units | 332 | 47.6% |
| Total Occupied Housing Units | 698 | 100.0% |
Occupancy by Household Size in Ripley
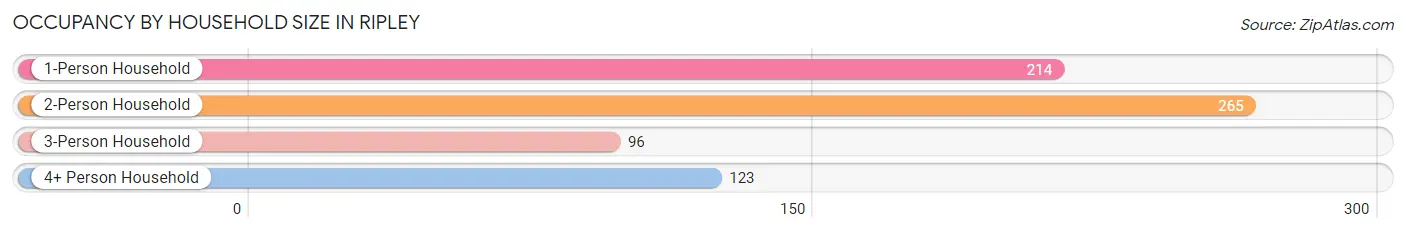
| Household Size | # Housing Units | % Housing Units |
| 1-Person Household | 214 | 30.7% |
| 2-Person Household | 265 | 38.0% |
| 3-Person Household | 96 | 13.8% |
| 4+ Person Household | 123 | 17.6% |
| Total Housing Units | 698 | 100.0% |
Occupancy by Ownership by Household Size in Ripley
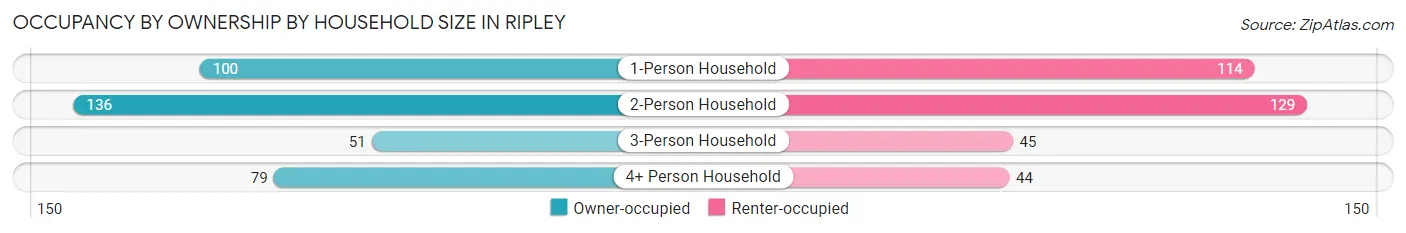
| Household Size | Owner-occupied | Renter-occupied |
| 1-Person Household | 100 (46.7%) | 114 (53.3%) |
| 2-Person Household | 136 (51.3%) | 129 (48.7%) |
| 3-Person Household | 51 (53.1%) | 45 (46.9%) |
| 4+ Person Household | 79 (64.2%) | 44 (35.8%) |
| Total Housing Units | 366 (52.4%) | 332 (47.6%) |
Occupancy by Educational Attainment in Ripley
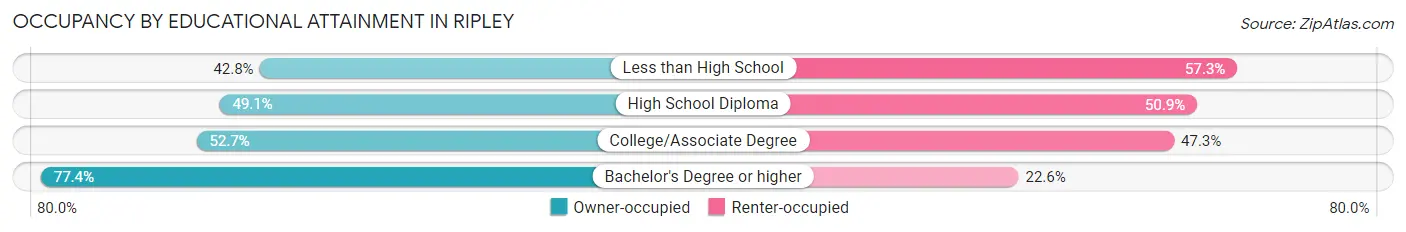
| Household Size | Owner-occupied | Renter-occupied |
| Less than High School | 56 (42.7%) | 75 (57.3%) |
| High School Diploma | 161 (49.1%) | 167 (50.9%) |
| College/Associate Degree | 77 (52.7%) | 69 (47.3%) |
| Bachelor's Degree or higher | 72 (77.4%) | 21 (22.6%) |
Occupancy by Age of Householder in Ripley
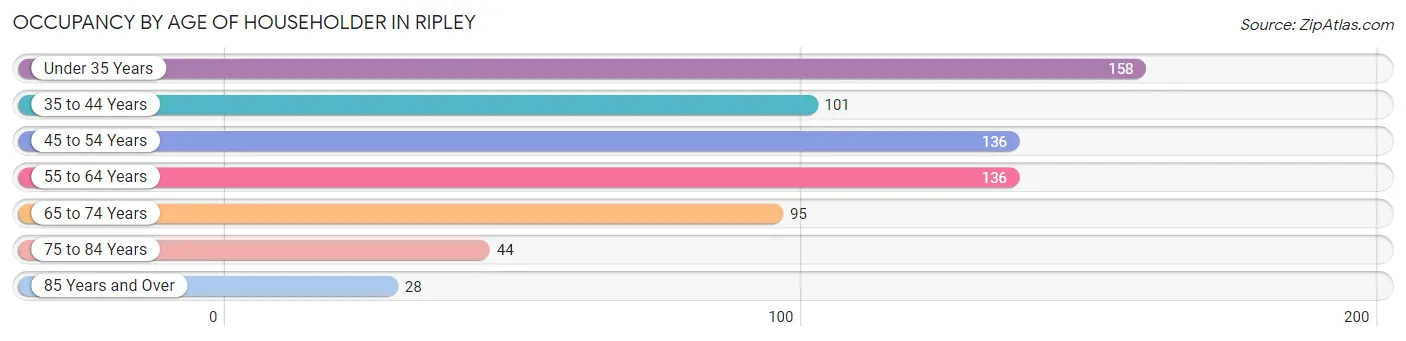
| Age Bracket | # Households | % Households |
| Under 35 Years | 158 | 22.6% |
| 35 to 44 Years | 101 | 14.5% |
| 45 to 54 Years | 136 | 19.5% |
| 55 to 64 Years | 136 | 19.5% |
| 65 to 74 Years | 95 | 13.6% |
| 75 to 84 Years | 44 | 6.3% |
| 85 Years and Over | 28 | 4.0% |
| Total | 698 | 100.0% |
Housing Finances in Ripley
Median Income by Occupancy in Ripley
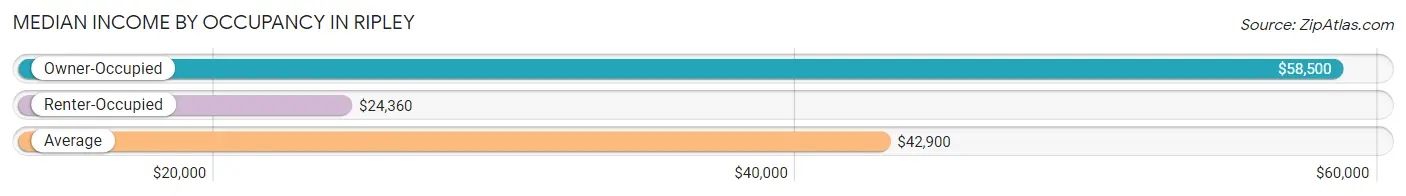
| Occupancy Type | # Households | Median Income |
| Owner-Occupied | 366 (52.4%) | $58,500 |
| Renter-Occupied | 332 (47.6%) | $24,360 |
| Average | 698 (100.0%) | $42,900 |
Occupancy by Householder Income Bracket in Ripley
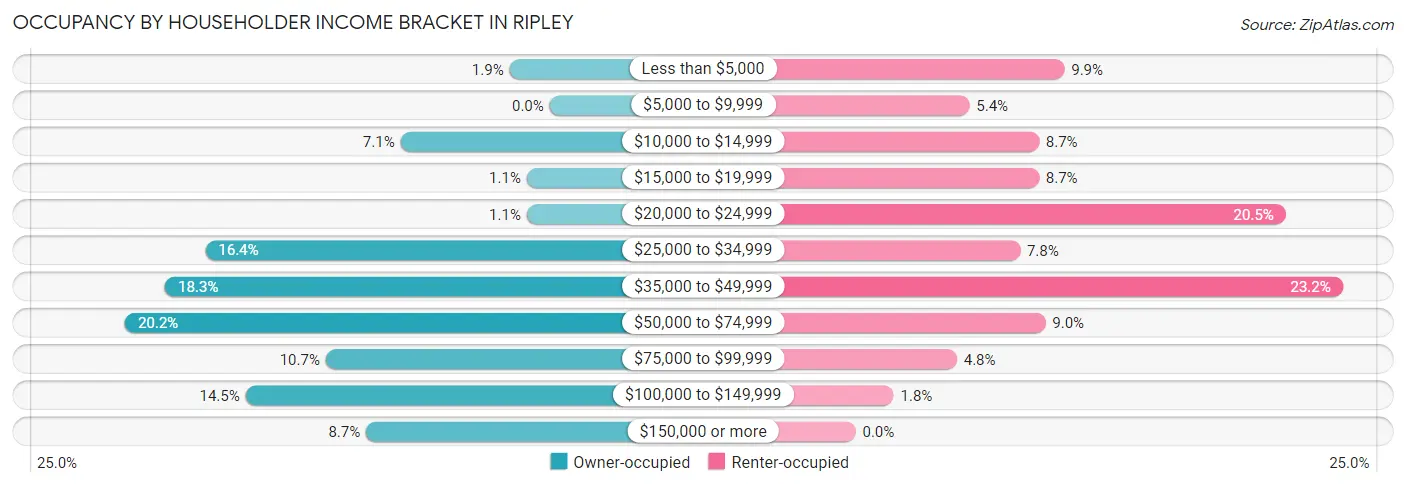
| Income Bracket | Owner-occupied | Renter-occupied |
| Less than $5,000 | 7 (1.9%) | 33 (9.9%) |
| $5,000 to $9,999 | 0 (0.0%) | 18 (5.4%) |
| $10,000 to $14,999 | 26 (7.1%) | 29 (8.7%) |
| $15,000 to $19,999 | 4 (1.1%) | 29 (8.7%) |
| $20,000 to $24,999 | 4 (1.1%) | 68 (20.5%) |
| $25,000 to $34,999 | 60 (16.4%) | 26 (7.8%) |
| $35,000 to $49,999 | 67 (18.3%) | 77 (23.2%) |
| $50,000 to $74,999 | 74 (20.2%) | 30 (9.0%) |
| $75,000 to $99,999 | 39 (10.7%) | 16 (4.8%) |
| $100,000 to $149,999 | 53 (14.5%) | 6 (1.8%) |
| $150,000 or more | 32 (8.7%) | 0 (0.0%) |
| Total | 366 (100.0%) | 332 (100.0%) |
Monthly Housing Cost Tiers in Ripley
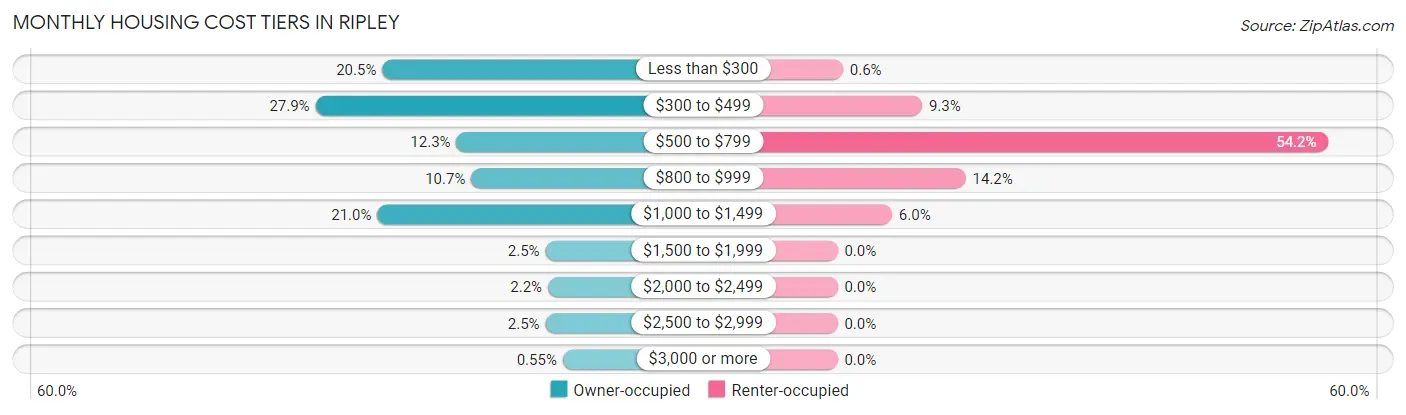
| Monthly Cost | Owner-occupied | Renter-occupied |
| Less than $300 | 75 (20.5%) | 2 (0.6%) |
| $300 to $499 | 102 (27.9%) | 31 (9.3%) |
| $500 to $799 | 45 (12.3%) | 180 (54.2%) |
| $800 to $999 | 39 (10.7%) | 47 (14.2%) |
| $1,000 to $1,499 | 77 (21.0%) | 20 (6.0%) |
| $1,500 to $1,999 | 9 (2.5%) | 0 (0.0%) |
| $2,000 to $2,499 | 8 (2.2%) | 0 (0.0%) |
| $2,500 to $2,999 | 9 (2.5%) | 0 (0.0%) |
| $3,000 or more | 2 (0.5%) | 0 (0.0%) |
| Total | 366 (100.0%) | 332 (100.0%) |
Physical Housing Characteristics in Ripley
Housing Structures in Ripley
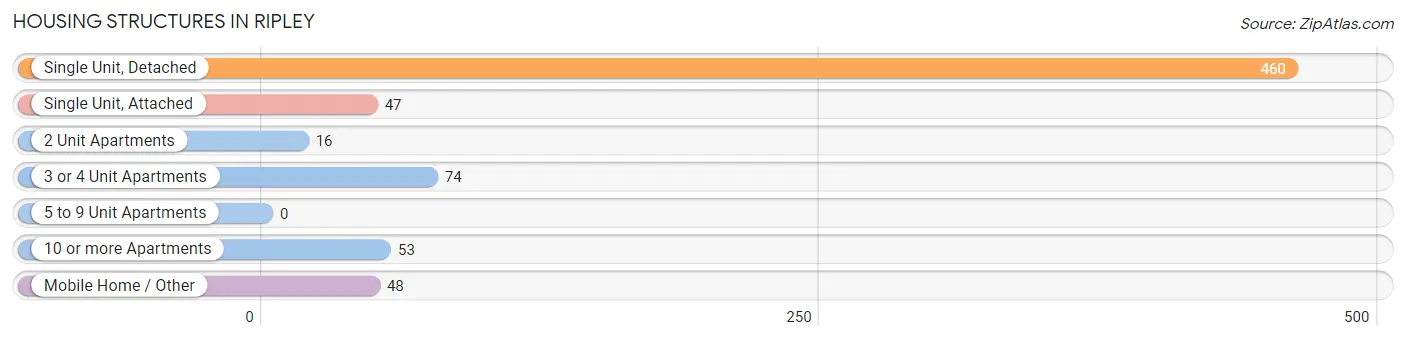
| Structure Type | # Housing Units | % Housing Units |
| Single Unit, Detached | 460 | 65.9% |
| Single Unit, Attached | 47 | 6.7% |
| 2 Unit Apartments | 16 | 2.3% |
| 3 or 4 Unit Apartments | 74 | 10.6% |
| 5 to 9 Unit Apartments | 0 | 0.0% |
| 10 or more Apartments | 53 | 7.6% |
| Mobile Home / Other | 48 | 6.9% |
| Total | 698 | 100.0% |
Housing Structures by Occupancy in Ripley
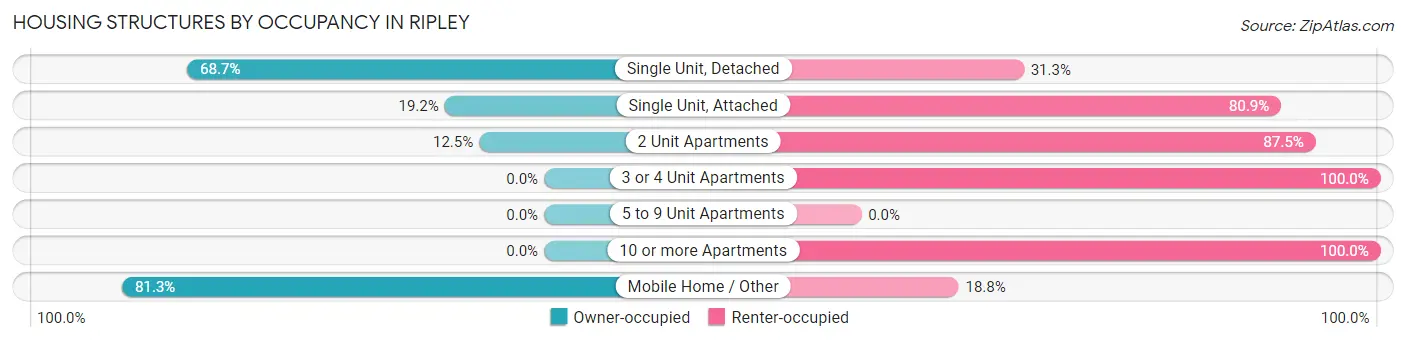
| Structure Type | Owner-occupied | Renter-occupied |
| Single Unit, Detached | 316 (68.7%) | 144 (31.3%) |
| Single Unit, Attached | 9 (19.2%) | 38 (80.8%) |
| 2 Unit Apartments | 2 (12.5%) | 14 (87.5%) |
| 3 or 4 Unit Apartments | 0 (0.0%) | 74 (100.0%) |
| 5 to 9 Unit Apartments | 0 (0.0%) | 0 (0.0%) |
| 10 or more Apartments | 0 (0.0%) | 53 (100.0%) |
| Mobile Home / Other | 39 (81.2%) | 9 (18.8%) |
| Total | 366 (52.4%) | 332 (47.6%) |
Housing Structures by Number of Rooms in Ripley
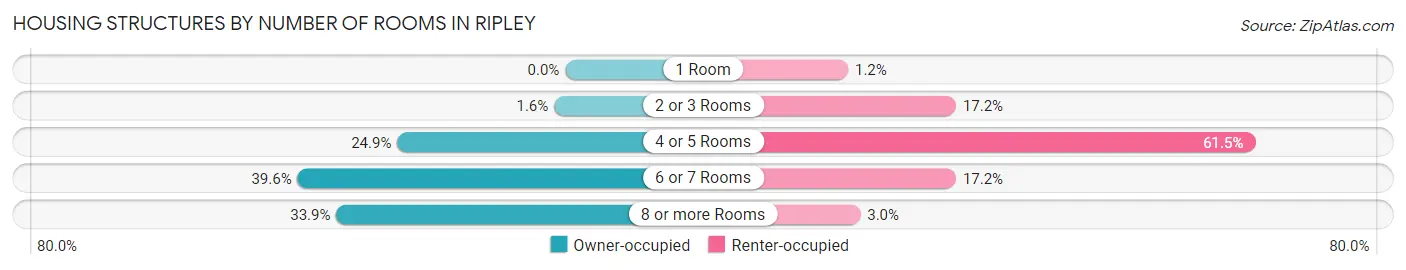
| Number of Rooms | Owner-occupied | Renter-occupied |
| 1 Room | 0 (0.0%) | 4 (1.2%) |
| 2 or 3 Rooms | 6 (1.6%) | 57 (17.2%) |
| 4 or 5 Rooms | 91 (24.9%) | 204 (61.5%) |
| 6 or 7 Rooms | 145 (39.6%) | 57 (17.2%) |
| 8 or more Rooms | 124 (33.9%) | 10 (3.0%) |
| Total | 366 (100.0%) | 332 (100.0%) |
Housing Structure by Heating Type in Ripley
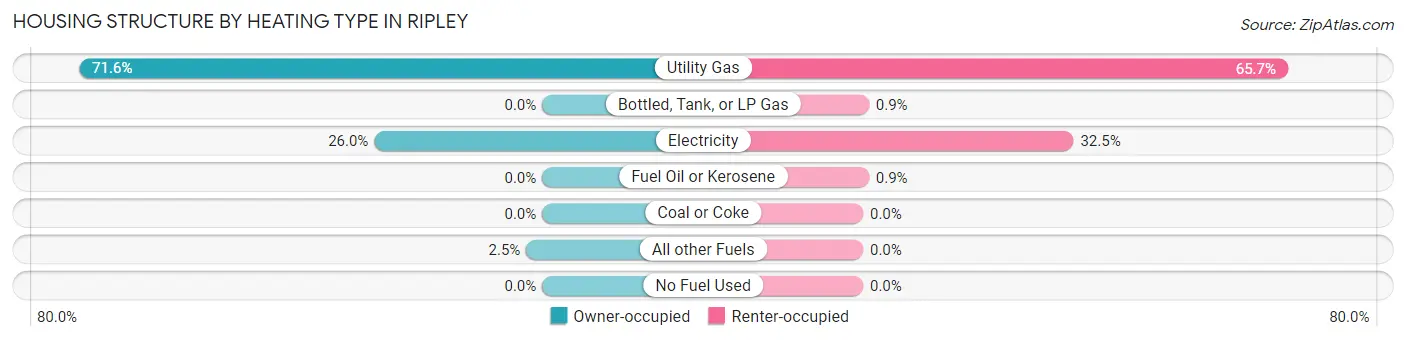
| Heating Type | Owner-occupied | Renter-occupied |
| Utility Gas | 262 (71.6%) | 218 (65.7%) |
| Bottled, Tank, or LP Gas | 0 (0.0%) | 3 (0.9%) |
| Electricity | 95 (26.0%) | 108 (32.5%) |
| Fuel Oil or Kerosene | 0 (0.0%) | 3 (0.9%) |
| Coal or Coke | 0 (0.0%) | 0 (0.0%) |
| All other Fuels | 9 (2.5%) | 0 (0.0%) |
| No Fuel Used | 0 (0.0%) | 0 (0.0%) |
| Total | 366 (100.0%) | 332 (100.0%) |
Household Vehicle Usage in Ripley
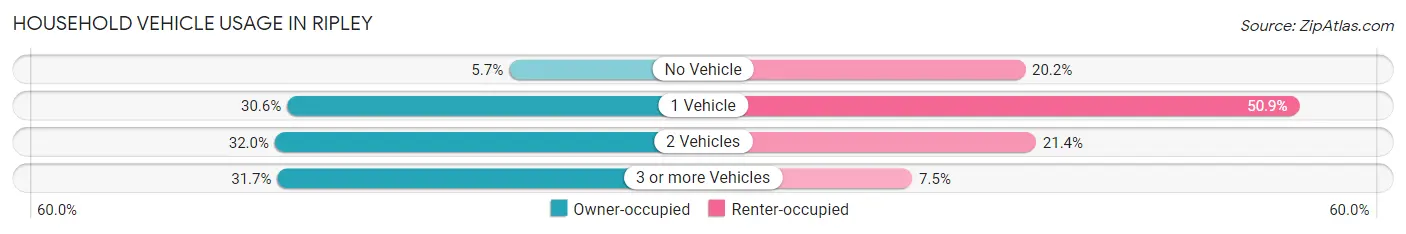
| Vehicles per Household | Owner-occupied | Renter-occupied |
| No Vehicle | 21 (5.7%) | 67 (20.2%) |
| 1 Vehicle | 112 (30.6%) | 169 (50.9%) |
| 2 Vehicles | 117 (32.0%) | 71 (21.4%) |
| 3 or more Vehicles | 116 (31.7%) | 25 (7.5%) |
| Total | 366 (100.0%) | 332 (100.0%) |
Real Estate & Mortgages in Ripley
Real Estate and Mortgage Overview in Ripley
| Characteristic | Without Mortgage | With Mortgage |
| Housing Units | 208 | 158 |
| Median Property Value | $78,600 | $123,800 |
| Median Household Income | $43,235 | $23 |
| Monthly Housing Costs | $356 | $2 |
| Real Estate Taxes | $676 | $9 |
Property Value by Mortgage Status in Ripley
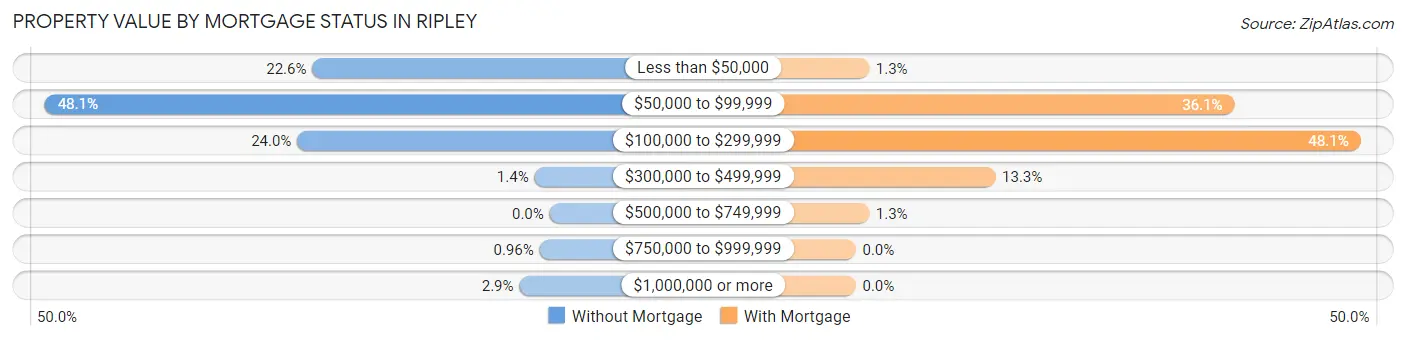
| Property Value | Without Mortgage | With Mortgage |
| Less than $50,000 | 47 (22.6%) | 2 (1.3%) |
| $50,000 to $99,999 | 100 (48.1%) | 57 (36.1%) |
| $100,000 to $299,999 | 50 (24.0%) | 76 (48.1%) |
| $300,000 to $499,999 | 3 (1.4%) | 21 (13.3%) |
| $500,000 to $749,999 | 0 (0.0%) | 2 (1.3%) |
| $750,000 to $999,999 | 2 (1.0%) | 0 (0.0%) |
| $1,000,000 or more | 6 (2.9%) | 0 (0.0%) |
| Total | 208 (100.0%) | 158 (100.0%) |
Household Income by Mortgage Status in Ripley
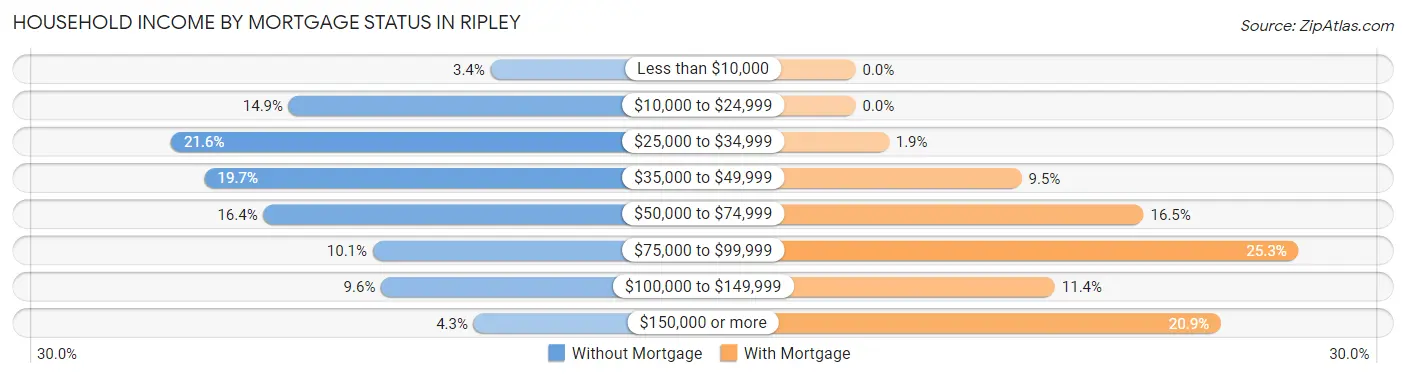
| Household Income | Without Mortgage | With Mortgage |
| Less than $10,000 | 7 (3.4%) | 0 (0.0%) |
| $10,000 to $24,999 | 31 (14.9%) | 0 (0.0%) |
| $25,000 to $34,999 | 45 (21.6%) | 3 (1.9%) |
| $35,000 to $49,999 | 41 (19.7%) | 15 (9.5%) |
| $50,000 to $74,999 | 34 (16.4%) | 26 (16.5%) |
| $75,000 to $99,999 | 21 (10.1%) | 40 (25.3%) |
| $100,000 to $149,999 | 20 (9.6%) | 18 (11.4%) |
| $150,000 or more | 9 (4.3%) | 33 (20.9%) |
| Total | 208 (100.0%) | 158 (100.0%) |
Property Value to Household Income Ratio in Ripley
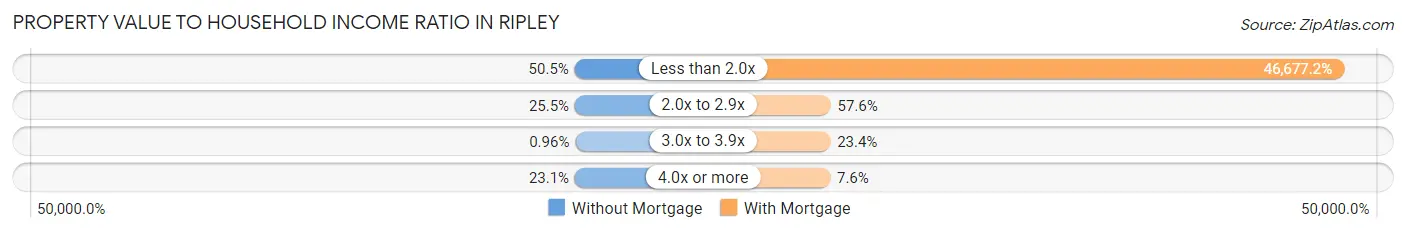
| Value-to-Income Ratio | Without Mortgage | With Mortgage |
| Less than 2.0x | 105 (50.5%) | 73,750 (46,677.2%) |
| 2.0x to 2.9x | 53 (25.5%) | 91 (57.6%) |
| 3.0x to 3.9x | 2 (1.0%) | 37 (23.4%) |
| 4.0x or more | 48 (23.1%) | 12 (7.6%) |
| Total | 208 (100.0%) | 158 (100.0%) |
Real Estate Taxes by Mortgage Status in Ripley
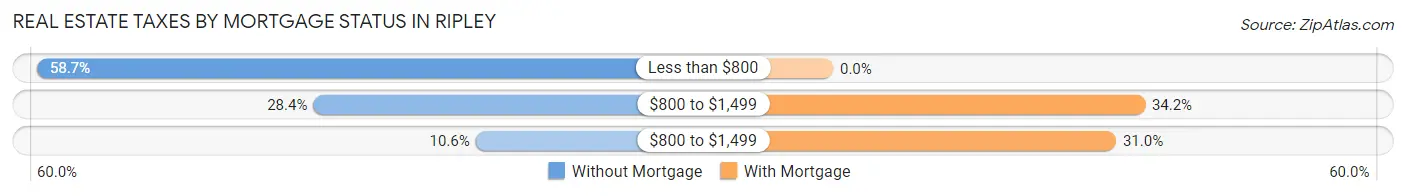
| Property Taxes | Without Mortgage | With Mortgage |
| Less than $800 | 122 (58.7%) | 0 (0.0%) |
| $800 to $1,499 | 59 (28.4%) | 54 (34.2%) |
| $800 to $1,499 | 22 (10.6%) | 49 (31.0%) |
| Total | 208 (100.0%) | 158 (100.0%) |
Health & Disability in Ripley
Health Insurance Coverage by Age in Ripley
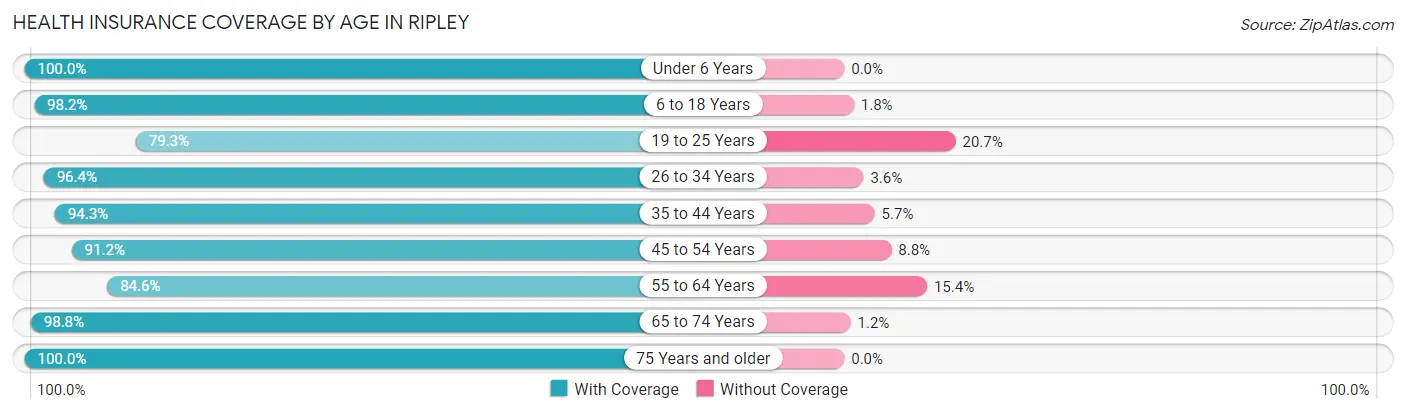
| Age Bracket | With Coverage | Without Coverage |
| Under 6 Years | 157 (100.0%) | 0 (0.0%) |
| 6 to 18 Years | 276 (98.2%) | 5 (1.8%) |
| 19 to 25 Years | 107 (79.3%) | 28 (20.7%) |
| 26 to 34 Years | 189 (96.4%) | 7 (3.6%) |
| 35 to 44 Years | 150 (94.3%) | 9 (5.7%) |
| 45 to 54 Years | 187 (91.2%) | 18 (8.8%) |
| 55 to 64 Years | 170 (84.6%) | 31 (15.4%) |
| 65 to 74 Years | 169 (98.8%) | 2 (1.2%) |
| 75 Years and older | 104 (100.0%) | 0 (0.0%) |
| Total | 1,509 (93.8%) | 100 (6.2%) |
Health Insurance Coverage by Citizenship Status in Ripley
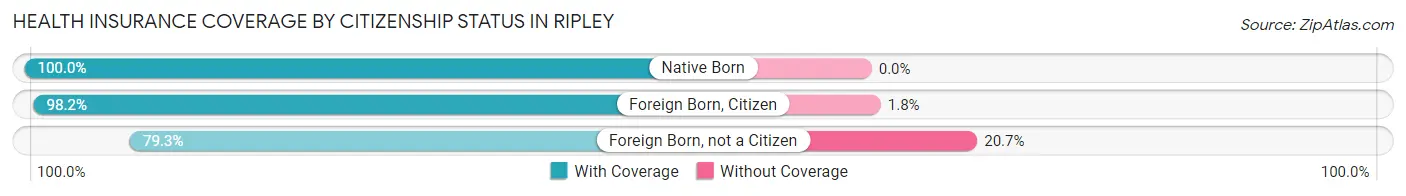
| Citizenship Status | With Coverage | Without Coverage |
| Native Born | 157 (100.0%) | 0 (0.0%) |
| Foreign Born, Citizen | 276 (98.2%) | 5 (1.8%) |
| Foreign Born, not a Citizen | 107 (79.3%) | 28 (20.7%) |
Health Insurance Coverage by Household Income in Ripley
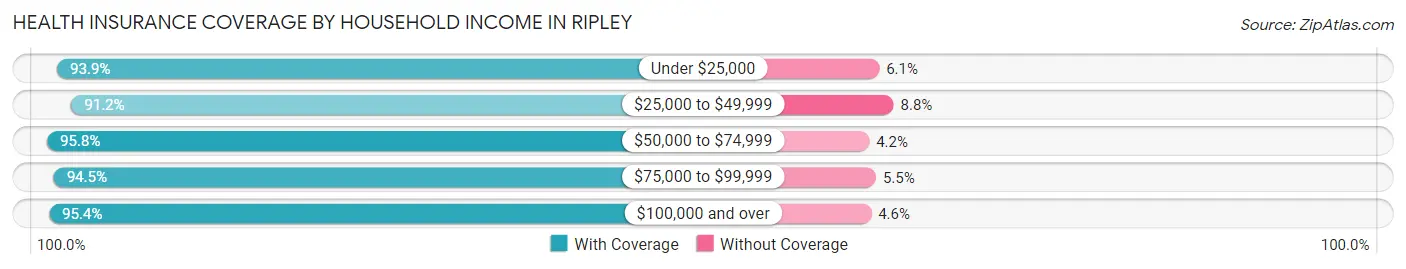
| Household Income | With Coverage | Without Coverage |
| Under $25,000 | 309 (93.9%) | 20 (6.1%) |
| $25,000 to $49,999 | 468 (91.2%) | 45 (8.8%) |
| $50,000 to $74,999 | 319 (95.8%) | 14 (4.2%) |
| $75,000 to $99,999 | 121 (94.5%) | 7 (5.5%) |
| $100,000 and over | 292 (95.4%) | 14 (4.6%) |
Public vs Private Health Insurance Coverage by Age in Ripley
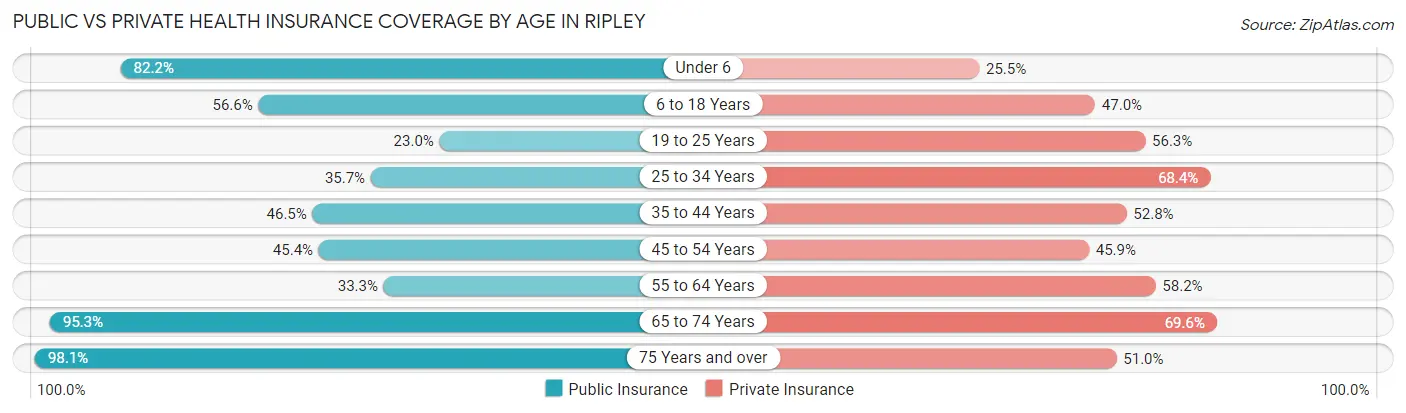
| Age Bracket | Public Insurance | Private Insurance |
| Under 6 | 129 (82.2%) | 40 (25.5%) |
| 6 to 18 Years | 159 (56.6%) | 132 (47.0%) |
| 19 to 25 Years | 31 (23.0%) | 76 (56.3%) |
| 25 to 34 Years | 70 (35.7%) | 134 (68.4%) |
| 35 to 44 Years | 74 (46.5%) | 84 (52.8%) |
| 45 to 54 Years | 93 (45.4%) | 94 (45.9%) |
| 55 to 64 Years | 67 (33.3%) | 117 (58.2%) |
| 65 to 74 Years | 163 (95.3%) | 119 (69.6%) |
| 75 Years and over | 102 (98.1%) | 53 (51.0%) |
| Total | 888 (55.2%) | 849 (52.8%) |
Disability Status by Sex by Age in Ripley
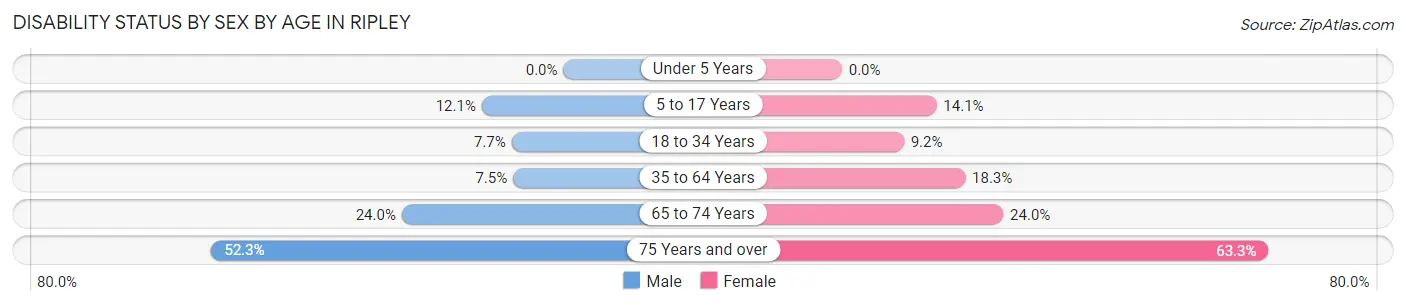
| Age Bracket | Male | Female |
| Under 5 Years | 0 (0.0%) | 0 (0.0%) |
| 5 to 17 Years | 20 (12.1%) | 17 (14.1%) |
| 18 to 34 Years | 13 (7.7%) | 17 (9.2%) |
| 35 to 64 Years | 21 (7.5%) | 52 (18.3%) |
| 65 to 74 Years | 18 (24.0%) | 23 (24.0%) |
| 75 Years and over | 23 (52.3%) | 38 (63.3%) |
Disability Class by Sex by Age in Ripley
Disability Class: Hearing Difficulty
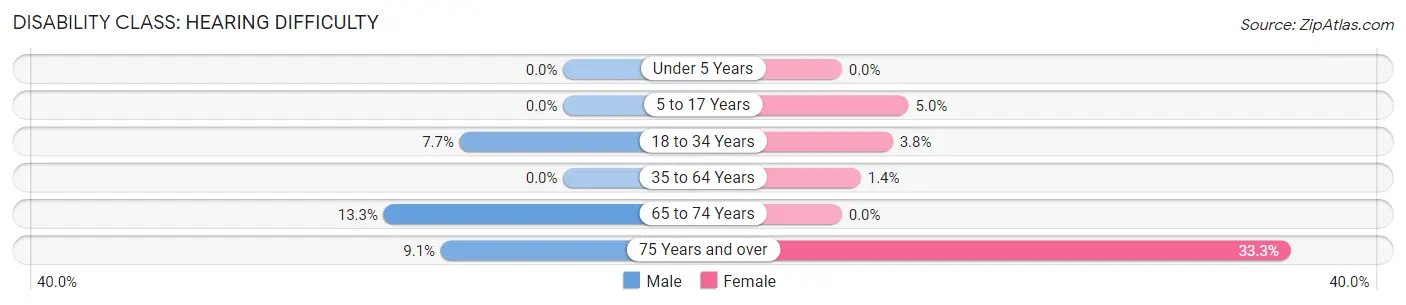
| Age Bracket | Male | Female |
| Under 5 Years | 0 (0.0%) | 0 (0.0%) |
| 5 to 17 Years | 0 (0.0%) | 6 (5.0%) |
| 18 to 34 Years | 13 (7.7%) | 7 (3.8%) |
| 35 to 64 Years | 0 (0.0%) | 4 (1.4%) |
| 65 to 74 Years | 10 (13.3%) | 0 (0.0%) |
| 75 Years and over | 4 (9.1%) | 20 (33.3%) |
Disability Class: Vision Difficulty
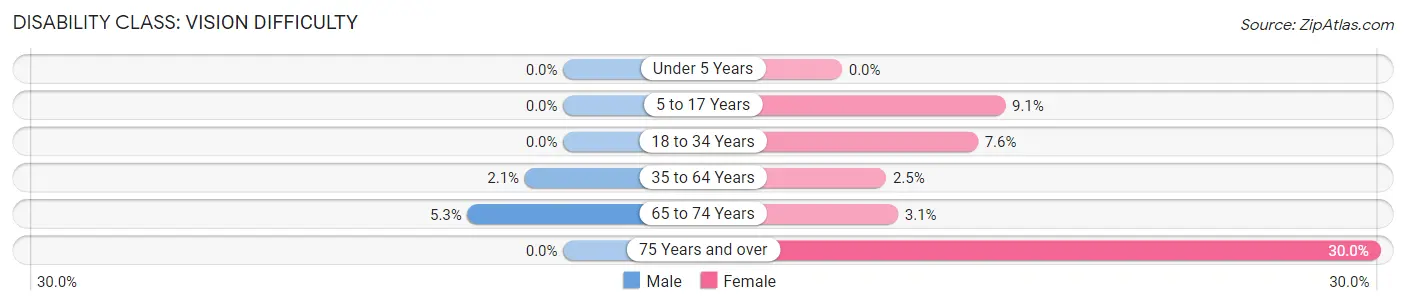
| Age Bracket | Male | Female |
| Under 5 Years | 0 (0.0%) | 0 (0.0%) |
| 5 to 17 Years | 0 (0.0%) | 11 (9.1%) |
| 18 to 34 Years | 0 (0.0%) | 14 (7.6%) |
| 35 to 64 Years | 6 (2.1%) | 7 (2.5%) |
| 65 to 74 Years | 4 (5.3%) | 3 (3.1%) |
| 75 Years and over | 0 (0.0%) | 18 (30.0%) |
Disability Class: Cognitive Difficulty
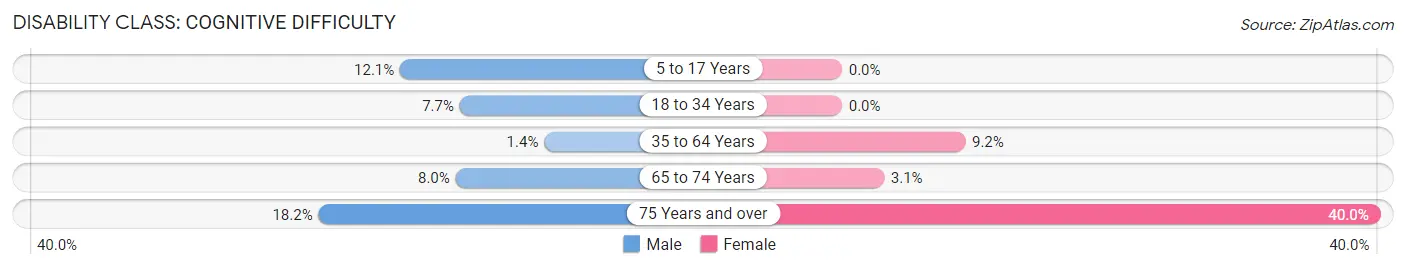
| Age Bracket | Male | Female |
| 5 to 17 Years | 20 (12.1%) | 0 (0.0%) |
| 18 to 34 Years | 13 (7.7%) | 0 (0.0%) |
| 35 to 64 Years | 4 (1.4%) | 26 (9.1%) |
| 65 to 74 Years | 6 (8.0%) | 3 (3.1%) |
| 75 Years and over | 8 (18.2%) | 24 (40.0%) |
Disability Class: Ambulatory Difficulty
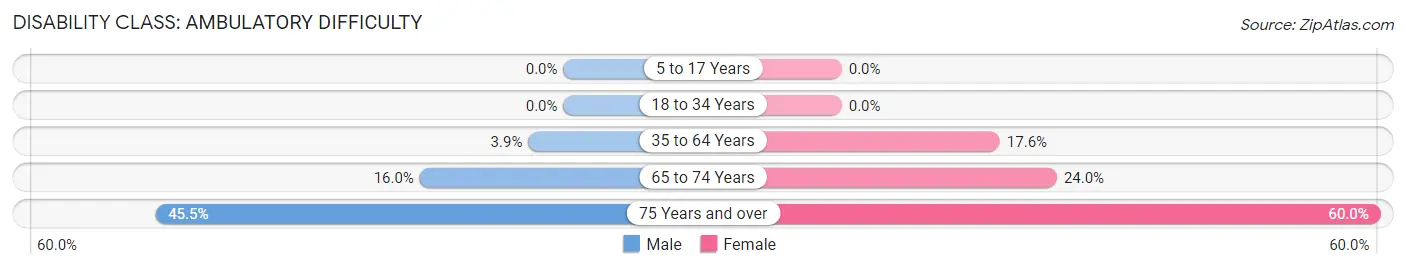
| Age Bracket | Male | Female |
| 5 to 17 Years | 0 (0.0%) | 0 (0.0%) |
| 18 to 34 Years | 0 (0.0%) | 0 (0.0%) |
| 35 to 64 Years | 11 (3.9%) | 50 (17.6%) |
| 65 to 74 Years | 12 (16.0%) | 23 (24.0%) |
| 75 Years and over | 20 (45.5%) | 36 (60.0%) |
Disability Class: Self-Care Difficulty
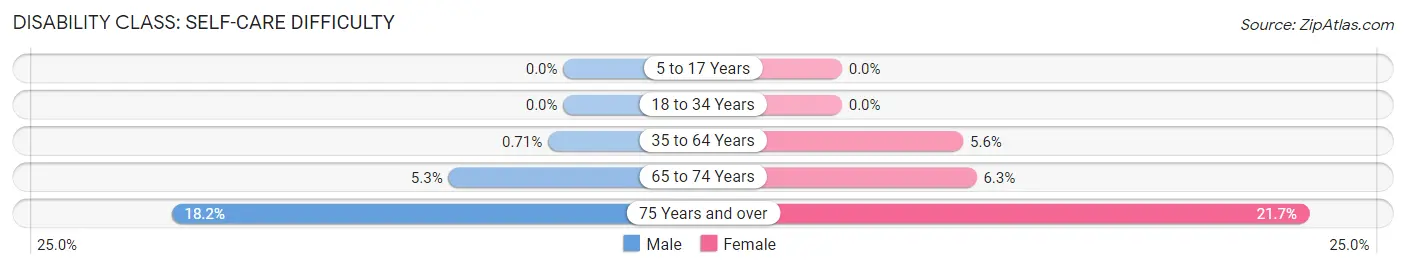
| Age Bracket | Male | Female |
| 5 to 17 Years | 0 (0.0%) | 0 (0.0%) |
| 18 to 34 Years | 0 (0.0%) | 0 (0.0%) |
| 35 to 64 Years | 2 (0.7%) | 16 (5.6%) |
| 65 to 74 Years | 4 (5.3%) | 6 (6.2%) |
| 75 Years and over | 8 (18.2%) | 13 (21.7%) |
Technology Access in Ripley
Computing Device Access in Ripley
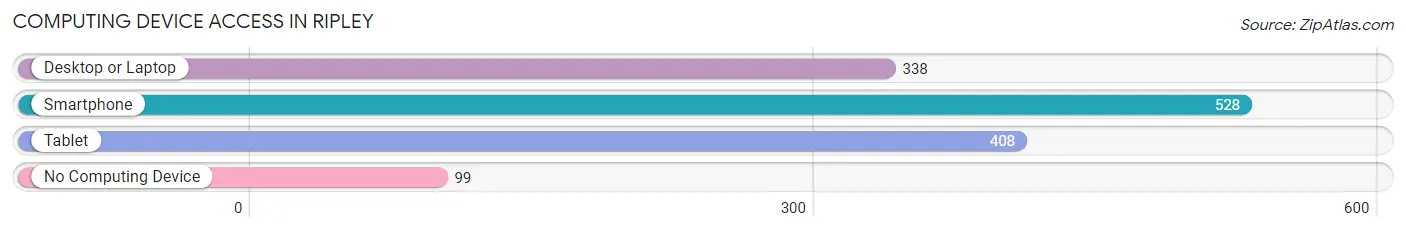
| Device Type | # Households | % Households |
| Desktop or Laptop | 338 | 48.4% |
| Smartphone | 528 | 75.6% |
| Tablet | 408 | 58.5% |
| No Computing Device | 99 | 14.2% |
| Total | 698 | 100.0% |
Internet Access in Ripley
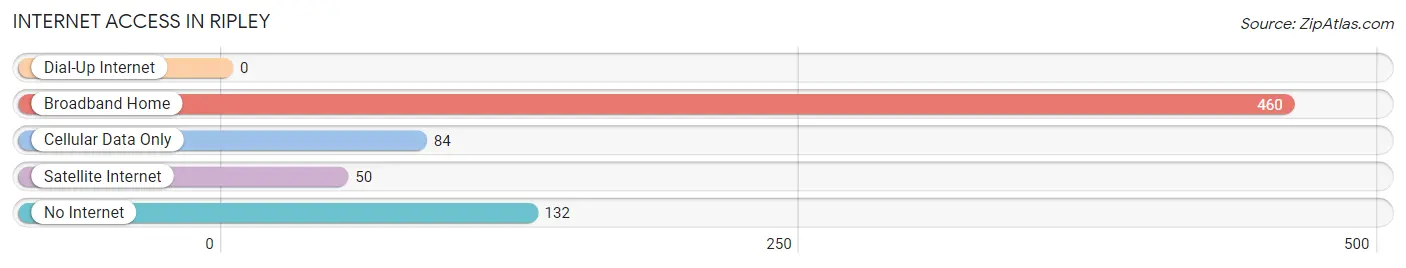
| Internet Type | # Households | % Households |
| Dial-Up Internet | 0 | 0.0% |
| Broadband Home | 460 | 65.9% |
| Cellular Data Only | 84 | 12.0% |
| Satellite Internet | 50 | 7.2% |
| No Internet | 132 | 18.9% |
| Total | 698 | 100.0% |
Ripley Summary
Ripley, Ohio is a small village located in Brown County, Ohio. It is situated on the Ohio River, approximately 40 miles east of Cincinnati. The village has a population of approximately 2,000 people and is part of the Cincinnati metropolitan area.
History
Ripley was founded in 1815 by William Ripley, a Revolutionary War veteran. The village was originally known as Ripleysburg, but the name was changed to Ripley in 1817. The village was incorporated in 1845.
Ripley was an important stop on the Underground Railroad, with many slaves escaping to freedom in Canada. The village was also a major port on the Ohio River, with steamboats and barges bringing goods and passengers to and from Cincinnati.
Geography
Ripley is located in Brown County, Ohio, on the Ohio River. The village is situated on the banks of the river, approximately 40 miles east of Cincinnati. The village is surrounded by rolling hills and farmland.
The climate in Ripley is humid continental, with hot summers and cold winters. The average annual temperature is around 50 degrees Fahrenheit.
Economy
Ripley’s economy is largely based on agriculture and tourism. The village is home to several small businesses, including restaurants, shops, and a winery. The village also has a small industrial park, which houses several manufacturing companies.
The village is also home to a number of historic sites, including the Ripley Historic District, the Ripley Museum, and the Ripley Opera House. These sites attract tourists from all over the region.
Demographics
As of the 2010 census, the population of Ripley was 2,000. The racial makeup of the village was 97.2% White, 0.7% African American, 0.3% Native American, 0.2% Asian, 0.1% Pacific Islander, and 1.5% from other races. Hispanic or Latino of any race were 1.2% of the population.
The median household income in Ripley was $37,500, and the median family income was $45,000. The per capita income was $19,000. About 11.2% of families and 14.2% of the population were below the poverty line, including 18.2% of those under age 18 and 8.2% of those age 65 or over.
Ripley is a small village with a rich history and a vibrant economy. The village is home to a number of historic sites, businesses, and attractions, making it a popular destination for tourists and locals alike. The village is also home to a diverse population, with a variety of racial and ethnic backgrounds.
Common Questions
What is Per Capita Income in Ripley?
Per Capita income in Ripley is $26,045.
What is the Median Family Income in Ripley?
Median Family Income in Ripley is $44,375.
What is the Median Household income in Ripley?
Median Household Income in Ripley is $42,900.
What is Income or Wage Gap in Ripley?
Income or Wage Gap in Ripley is 40.0%.
Women in Ripley earn 60.0 cents for every dollar earned by a man.
What is Inequality or Gini Index in Ripley?
Inequality or Gini Index in Ripley is 0.49.
What is the Total Population of Ripley?
Total Population of Ripley is 1,609.
What is the Total Male Population of Ripley?
Total Male Population of Ripley is 795.
What is the Total Female Population of Ripley?
Total Female Population of Ripley is 814.
What is the Ratio of Males per 100 Females in Ripley?
There are 97.67 Males per 100 Females in Ripley.
What is the Ratio of Females per 100 Males in Ripley?
There are 102.39 Females per 100 Males in Ripley.
What is the Median Population Age in Ripley?
Median Population Age in Ripley is 37.7 Years.
What is the Average Family Size in Ripley
Average Family Size in Ripley is 2.8 People.
What is the Average Household Size in Ripley
Average Household Size in Ripley is 2.3 People.
How Large is the Labor Force in Ripley?
There are 725 People in the Labor Forcein in Ripley.
What is the Percentage of People in the Labor Force in Ripley?
59.0% of People are in the Labor Force in Ripley.
What is the Unemployment Rate in Ripley?
Unemployment Rate in Ripley is 11.7%.