Penn Yan, NY Map & Demographics
Penn Yan Map
Penn Yan Overview
$31,658
PER CAPITA INCOME
$73,484
AVG FAMILY INCOME
$50,878
AVG HOUSEHOLD INCOME
9.0%
WAGE / INCOME GAP [ % ]
91.0¢/ $1
WAGE / INCOME GAP [ $ ]
0.45
INEQUALITY / GINI INDEX
5,134
TOTAL POPULATION
2,252
MALE POPULATION
2,882
FEMALE POPULATION
78.14
MALES / 100 FEMALES
127.98
FEMALES / 100 MALES
47.8
MEDIAN AGE
3.0
AVG FAMILY SIZE
2.2
AVG HOUSEHOLD SIZE
2,574
LABOR FORCE [ PEOPLE ]
58.2%
PERCENT IN LABOR FORCE
3.3%
UNEMPLOYMENT RATE
Penn Yan Zip Codes
Penn Yan Area Codes
Income in Penn Yan
Income Overview in Penn Yan
Per Capita Income in Penn Yan is $31,658, while median incomes of families and households are $73,484 and $50,878 respectively.
| Characteristic | Number | Measure |
| Per Capita Income | 5,134 | $31,658 |
| Median Family Income | 1,149 | $73,484 |
| Mean Family Income | 1,149 | $86,866 |
| Median Household Income | 2,236 | $50,878 |
| Mean Household Income | 2,236 | $67,355 |
| Income Deficit | 1,149 | $0 |
| Wage / Income Gap (%) | 5,134 | 9.02% |
| Wage / Income Gap ($) | 5,134 | 90.98¢ per $1 |
| Gini / Inequality Index | 5,134 | 0.45 |
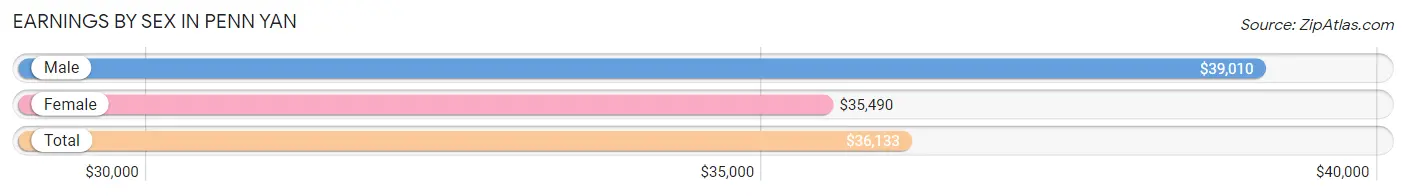
Earnings by Sex in Penn Yan
Average Earnings in Penn Yan are $36,133, $39,010 for men and $35,490 for women, a difference of 9.0%.
| Sex | Number | Average Earnings |
| Male | 1,199 (45.9%) | $39,010 |
| Female | 1,414 (54.1%) | $35,490 |
| Total | 2,613 (100.0%) | $36,133 |
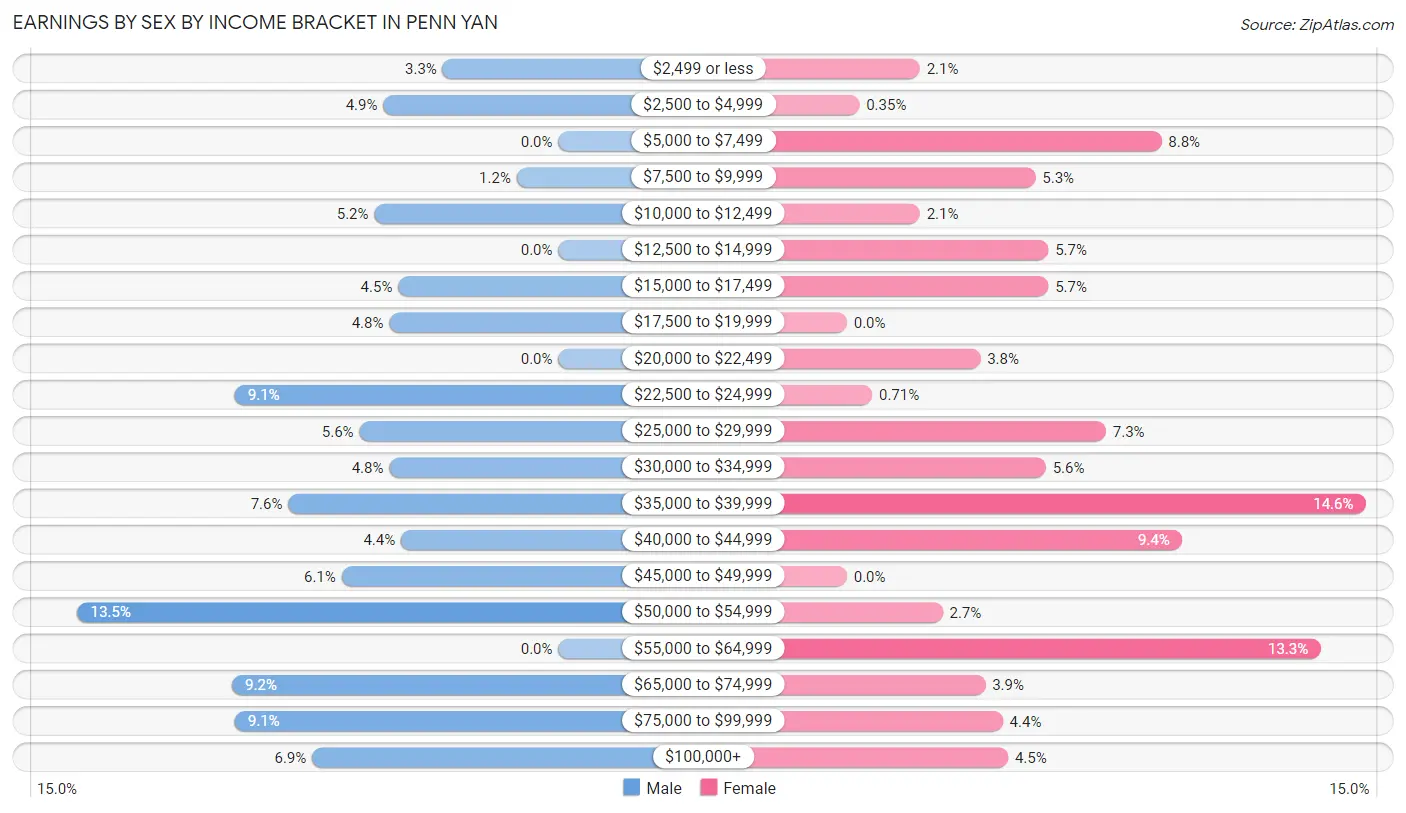
Earnings by Sex by Income Bracket in Penn Yan
The most common earnings brackets in Penn Yan are $50,000 to $54,999 for men (162 | 13.5%) and $35,000 to $39,999 for women (206 | 14.6%).
| Income | Male | Female |
| $2,499 or less | 39 (3.3%) | 29 (2.1%) |
| $2,500 to $4,999 | 59 (4.9%) | 5 (0.4%) |
| $5,000 to $7,499 | 0 (0.0%) | 125 (8.8%) |
| $7,500 to $9,999 | 14 (1.2%) | 75 (5.3%) |
| $10,000 to $12,499 | 62 (5.2%) | 29 (2.1%) |
| $12,500 to $14,999 | 0 (0.0%) | 80 (5.7%) |
| $15,000 to $17,499 | 54 (4.5%) | 80 (5.7%) |
| $17,500 to $19,999 | 57 (4.8%) | 0 (0.0%) |
| $20,000 to $22,499 | 0 (0.0%) | 53 (3.7%) |
| $22,500 to $24,999 | 109 (9.1%) | 10 (0.7%) |
| $25,000 to $29,999 | 67 (5.6%) | 103 (7.3%) |
| $30,000 to $34,999 | 57 (4.8%) | 79 (5.6%) |
| $35,000 to $39,999 | 91 (7.6%) | 206 (14.6%) |
| $40,000 to $44,999 | 53 (4.4%) | 133 (9.4%) |
| $45,000 to $49,999 | 73 (6.1%) | 0 (0.0%) |
| $50,000 to $54,999 | 162 (13.5%) | 38 (2.7%) |
| $55,000 to $64,999 | 0 (0.0%) | 188 (13.3%) |
| $65,000 to $74,999 | 110 (9.2%) | 55 (3.9%) |
| $75,000 to $99,999 | 109 (9.1%) | 62 (4.4%) |
| $100,000+ | 83 (6.9%) | 64 (4.5%) |
| Total | 1,199 (100.0%) | 1,414 (100.0%) |
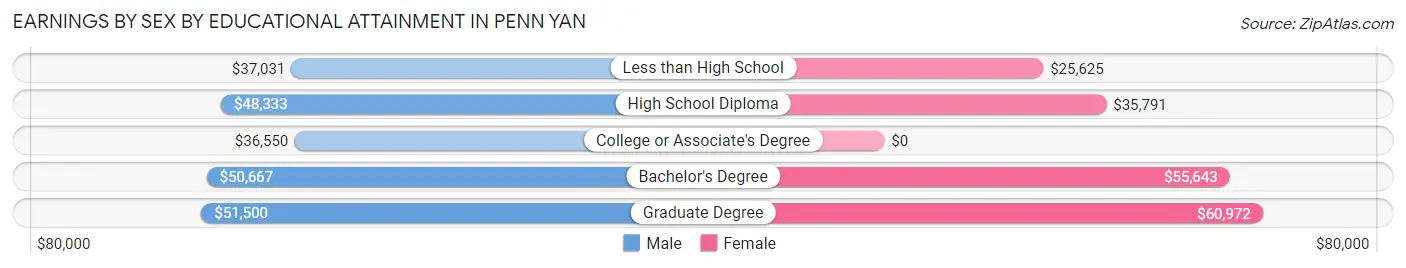
Earnings by Sex by Educational Attainment in Penn Yan
Average earnings in Penn Yan are $45,000 for men and $36,803 for women, a difference of 18.2%. Men with an educational attainment of graduate degree enjoy the highest average annual earnings of $51,500, while those with college or associate's degree education earn the least with $36,550. Women with an educational attainment of graduate degree earn the most with the average annual earnings of $60,972, while those with less than high school education have the smallest earnings of $25,625.
| Educational Attainment | Male Income | Female Income |
| Less than High School | $37,031 | $25,625 |
| High School Diploma | $48,333 | $35,791 |
| College or Associate's Degree | $36,550 | $0 |
| Bachelor's Degree | $50,667 | $55,643 |
| Graduate Degree | $51,500 | $60,972 |
| Total | $45,000 | $36,803 |
Family Income in Penn Yan
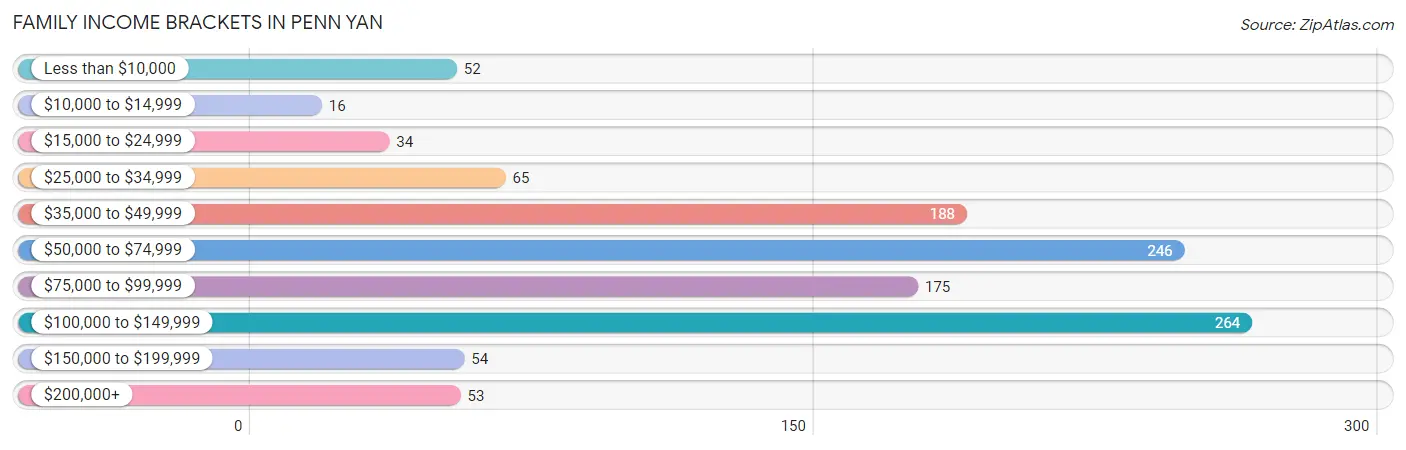
Family Income Brackets in Penn Yan
According to the Penn Yan family income data, there are 264 families falling into the $100,000 to $149,999 income range, which is the most common income bracket and makes up 23.0% of all families. Conversely, the $10,000 to $14,999 income bracket is the least frequent group with only 16 families (1.4%) belonging to this category.
| Income Bracket | # Families | % Families |
| Less than $10,000 | 52 | 4.5% |
| $10,000 to $14,999 | 16 | 1.4% |
| $15,000 to $24,999 | 34 | 3.0% |
| $25,000 to $34,999 | 65 | 5.7% |
| $35,000 to $49,999 | 188 | 16.4% |
| $50,000 to $74,999 | 246 | 21.4% |
| $75,000 to $99,999 | 175 | 15.2% |
| $100,000 to $149,999 | 264 | 23.0% |
| $150,000 to $199,999 | 54 | 4.7% |
| $200,000+ | 53 | 4.6% |
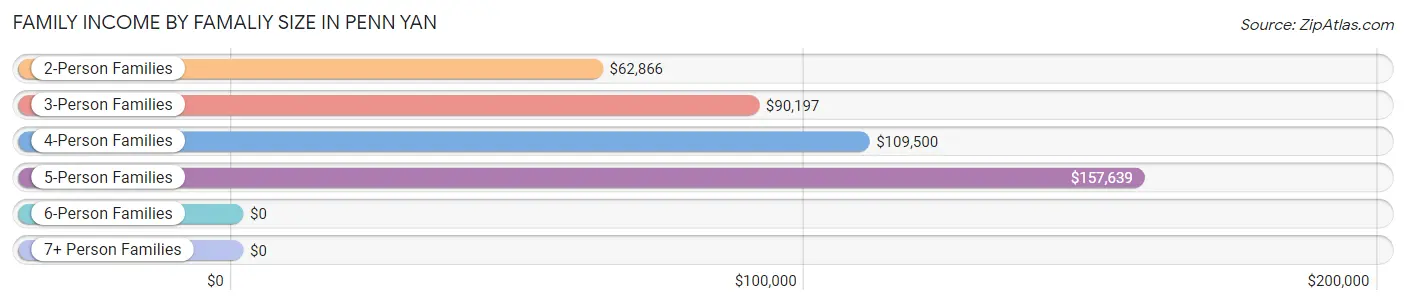
Family Income by Famaliy Size in Penn Yan
5-person families (68 | 5.9%) account for the highest median family income in Penn Yan with $157,639 per family, while 5-person families (68 | 5.9%) have the highest median income of $31,528 per family member.
| Income Bracket | # Families | Median Income |
| 2-Person Families | 676 (58.8%) | $62,866 |
| 3-Person Families | 191 (16.6%) | $90,197 |
| 4-Person Families | 198 (17.2%) | $109,500 |
| 5-Person Families | 68 (5.9%) | $157,639 |
| 6-Person Families | 16 (1.4%) | $0 |
| 7+ Person Families | 0 (0.0%) | $0 |
| Total | 1,149 (100.0%) | $73,484 |
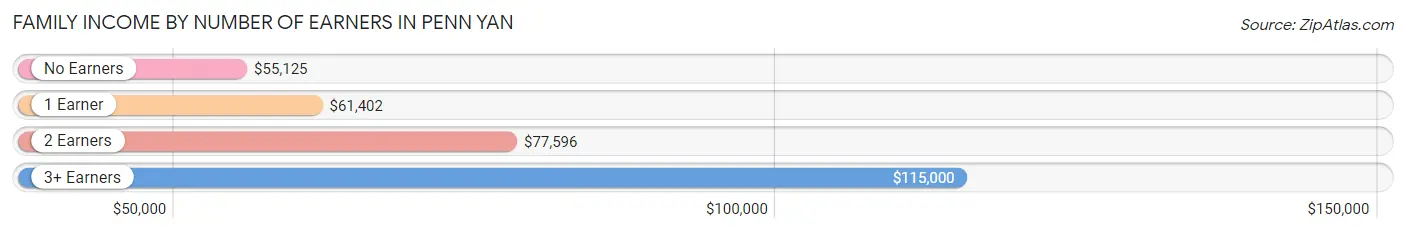
Family Income by Number of Earners in Penn Yan
The median family income in Penn Yan is $73,484, with families comprising 3+ earners (194) having the highest median family income of $115,000, while families with no earners (173) have the lowest median family income of $55,125, accounting for 16.9% and 15.1% of families, respectively.
| Number of Earners | # Families | Median Income |
| No Earners | 173 (15.1%) | $55,125 |
| 1 Earner | 459 (40.0%) | $61,402 |
| 2 Earners | 323 (28.1%) | $77,596 |
| 3+ Earners | 194 (16.9%) | $115,000 |
| Total | 1,149 (100.0%) | $73,484 |
Household Income in Penn Yan
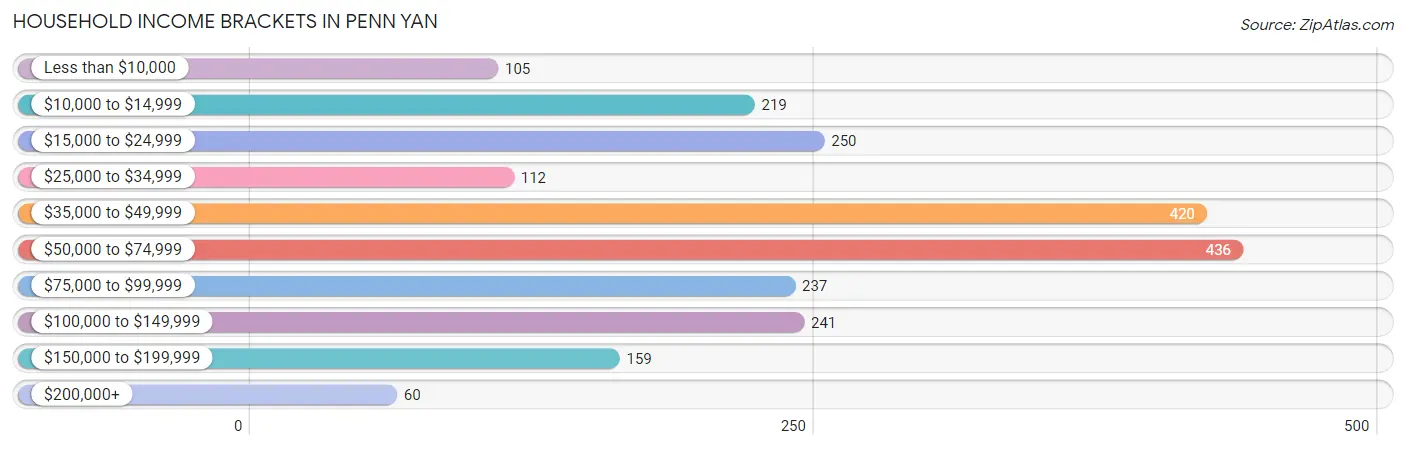
Household Income Brackets in Penn Yan
With 436 households falling in the category, the $50,000 to $74,999 income range is the most frequent in Penn Yan, accounting for 19.5% of all households. In contrast, only 60 households (2.7%) fall into the $200,000+ income bracket, making it the least populous group.
| Income Bracket | # Households | % Households |
| Less than $10,000 | 105 | 4.7% |
| $10,000 to $14,999 | 219 | 9.8% |
| $15,000 to $24,999 | 250 | 11.2% |
| $25,000 to $34,999 | 112 | 5.0% |
| $35,000 to $49,999 | 420 | 18.8% |
| $50,000 to $74,999 | 436 | 19.5% |
| $75,000 to $99,999 | 237 | 10.6% |
| $100,000 to $149,999 | 241 | 10.8% |
| $150,000 to $199,999 | 159 | 7.1% |
| $200,000+ | 60 | 2.7% |
Household Income by Householder Age in Penn Yan
The median household income in Penn Yan is $50,878, with the highest median household income of $68,073 found in the 15 to 24 years age bracket for the primary householder. A total of 91 households (4.1%) fall into this category. Meanwhile, the 65+ years age bracket for the primary householder has the lowest median household income of $26,477, with 825 households (36.9%) in this group.

| Income Bracket | # Households | Median Income |
| 15 to 24 Years | 91 (4.1%) | $68,073 |
| 25 to 44 Years | 480 (21.5%) | $66,786 |
| 45 to 64 Years | 840 (37.6%) | $64,268 |
| 65+ Years | 825 (36.9%) | $26,477 |
| Total | 2,236 (100.0%) | $50,878 |
Poverty in Penn Yan
Income Below Poverty by Sex and Age in Penn Yan
With 12.8% poverty level for males and 9.7% for females among the residents of Penn Yan, 65 to 74 year old males and 6 to 11 year old females are the most vulnerable to poverty, with 125 males (38.2%) and 93 females (45.2%) in their respective age groups living below the poverty level.
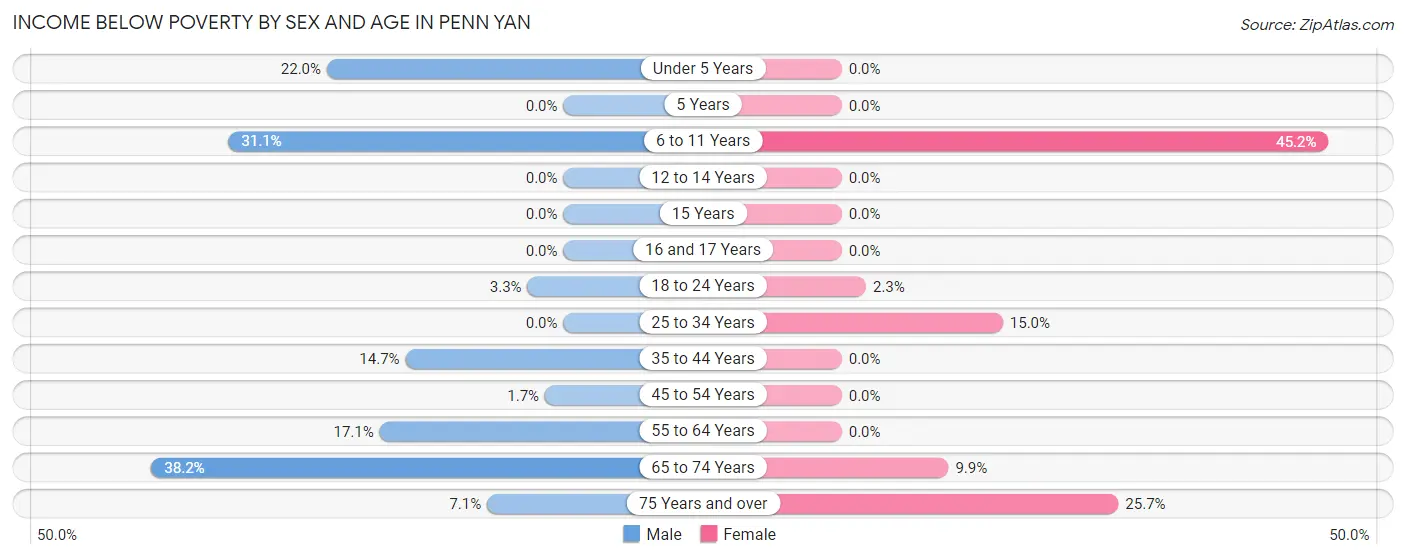
| Age Bracket | Male | Female |
| Under 5 Years | 36 (22.0%) | 0 (0.0%) |
| 5 Years | 0 (0.0%) | 0 (0.0%) |
| 6 to 11 Years | 23 (31.1%) | 93 (45.2%) |
| 12 to 14 Years | 0 (0.0%) | 0 (0.0%) |
| 15 Years | 0 (0.0%) | 0 (0.0%) |
| 16 and 17 Years | 0 (0.0%) | 0 (0.0%) |
| 18 to 24 Years | 5 (3.3%) | 6 (2.2%) |
| 25 to 34 Years | 0 (0.0%) | 58 (14.9%) |
| 35 to 44 Years | 28 (14.7%) | 0 (0.0%) |
| 45 to 54 Years | 6 (1.7%) | 0 (0.0%) |
| 55 to 64 Years | 36 (17.1%) | 0 (0.0%) |
| 65 to 74 Years | 125 (38.2%) | 30 (9.9%) |
| 75 Years and over | 16 (7.1%) | 77 (25.7%) |
| Total | 275 (12.8%) | 264 (9.7%) |
Income Above Poverty by Sex and Age in Penn Yan
According to the poverty statistics in Penn Yan, males aged 5 years and females aged under 5 years are the age groups that are most secure financially, with 100.0% of males and 100.0% of females in these age groups living above the poverty line.
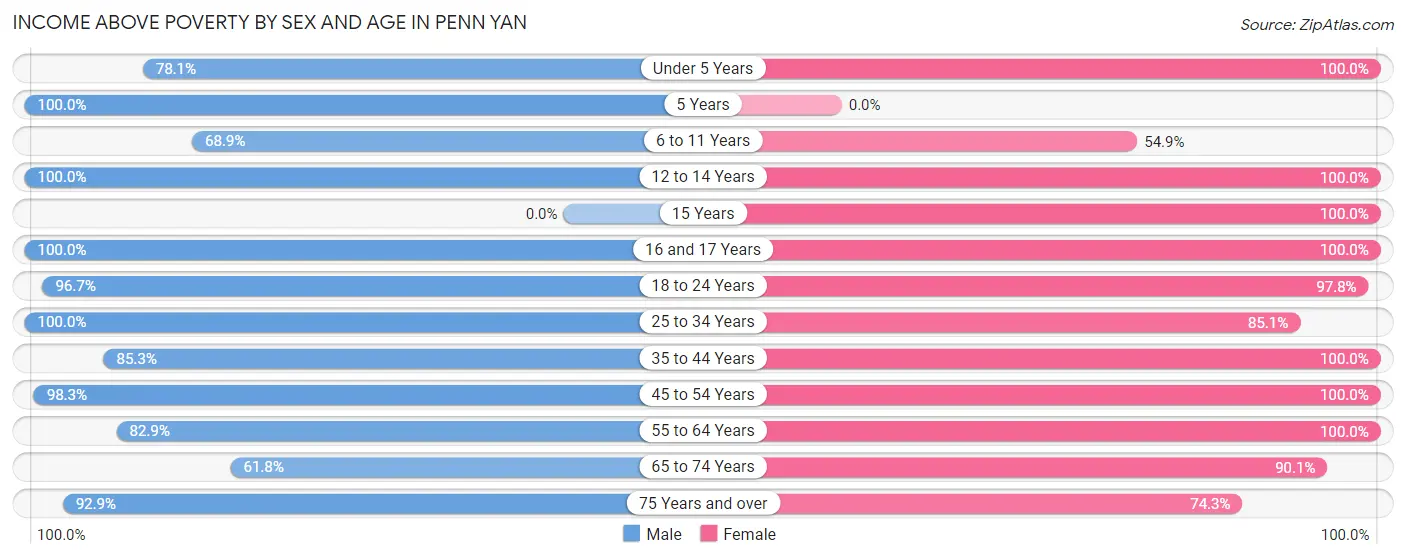
| Age Bracket | Male | Female |
| Under 5 Years | 128 (78.0%) | 111 (100.0%) |
| 5 Years | 13 (100.0%) | 0 (0.0%) |
| 6 to 11 Years | 51 (68.9%) | 113 (54.8%) |
| 12 to 14 Years | 44 (100.0%) | 51 (100.0%) |
| 15 Years | 0 (0.0%) | 48 (100.0%) |
| 16 and 17 Years | 69 (100.0%) | 32 (100.0%) |
| 18 to 24 Years | 145 (96.7%) | 261 (97.8%) |
| 25 to 34 Years | 321 (100.0%) | 330 (85.1%) |
| 35 to 44 Years | 163 (85.3%) | 199 (100.0%) |
| 45 to 54 Years | 345 (98.3%) | 498 (100.0%) |
| 55 to 64 Years | 175 (82.9%) | 326 (100.0%) |
| 65 to 74 Years | 202 (61.8%) | 273 (90.1%) |
| 75 Years and over | 210 (92.9%) | 223 (74.3%) |
| Total | 1,866 (87.2%) | 2,465 (90.3%) |
Income Below Poverty Among Married-Couple Families in Penn Yan
The poverty statistics for married-couple families in Penn Yan show that 2.1% or 16 of the total 776 families live below the poverty line. Families with no children have the highest poverty rate of 2.8%, comprising of 16 families. On the other hand, families with 1 or 2 children have the lowest poverty rate of 0.0%, which includes 0 families.
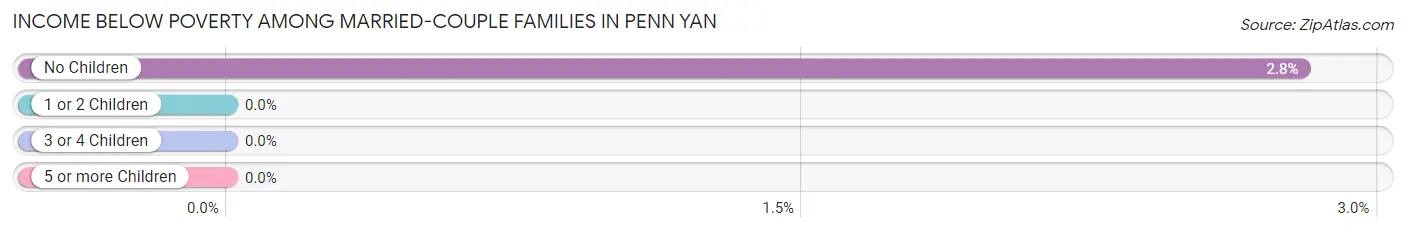
| Children | Above Poverty | Below Poverty |
| No Children | 556 (97.2%) | 16 (2.8%) |
| 1 or 2 Children | 187 (100.0%) | 0 (0.0%) |
| 3 or 4 Children | 17 (100.0%) | 0 (0.0%) |
| 5 or more Children | 0 (0.0%) | 0 (0.0%) |
| Total | 760 (97.9%) | 16 (2.1%) |
Income Below Poverty Among Single-Parent Households in Penn Yan
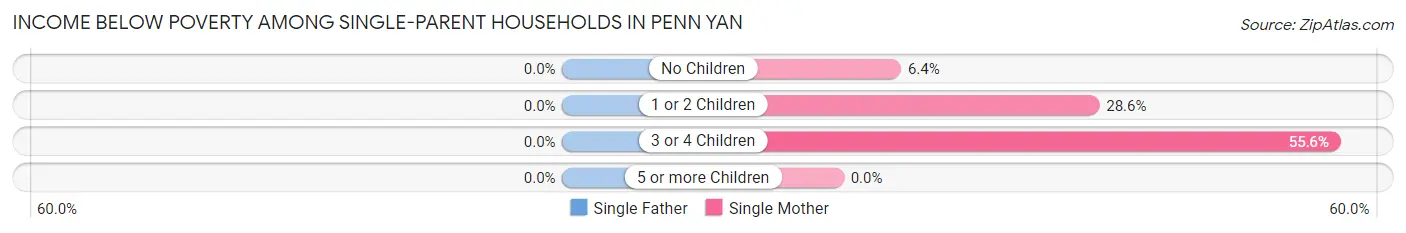
| Children | Single Father | Single Mother |
| No Children | 0 (0.0%) | 8 (6.4%) |
| 1 or 2 Children | 0 (0.0%) | 34 (28.6%) |
| 3 or 4 Children | 0 (0.0%) | 15 (55.6%) |
| 5 or more Children | 0 (0.0%) | 0 (0.0%) |
| Total | 0 (0.0%) | 57 (21.0%) |
Income Below Poverty Among Married-Couple vs Single-Parent Households in Penn Yan
The poverty data for Penn Yan shows that 16 of the married-couple family households (2.1%) and 57 of the single-parent households (15.3%) are living below the poverty level. Within the married-couple family households, those with no children have the highest poverty rate, with 16 households (2.8%) falling below the poverty line. Among the single-parent households, those with 3 or 4 children have the highest poverty rate, with 15 household (55.6%) living below poverty.
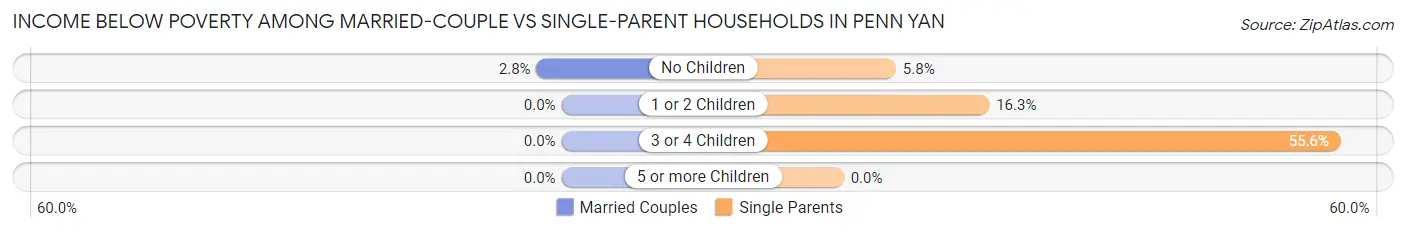
| Children | Married-Couple Families | Single-Parent Households |
| No Children | 16 (2.8%) | 8 (5.8%) |
| 1 or 2 Children | 0 (0.0%) | 34 (16.3%) |
| 3 or 4 Children | 0 (0.0%) | 15 (55.6%) |
| 5 or more Children | 0 (0.0%) | 0 (0.0%) |
| Total | 16 (2.1%) | 57 (15.3%) |
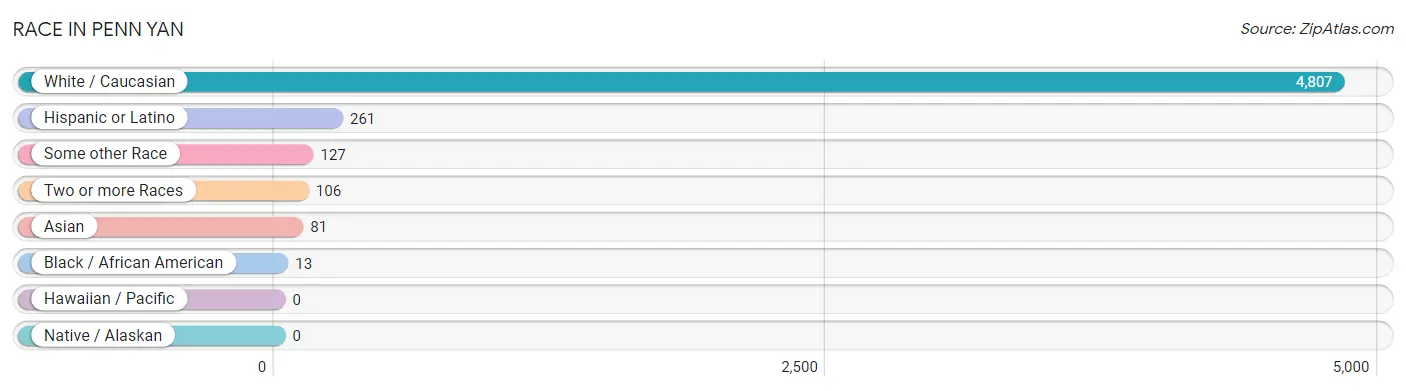
Race in Penn Yan
The most populous races in Penn Yan are White / Caucasian (4,807 | 93.6%), Hispanic or Latino (261 | 5.1%), and Some other Race (127 | 2.5%).
| Race | # Population | % Population |
| Asian | 81 | 1.6% |
| Black / African American | 13 | 0.3% |
| Hawaiian / Pacific | 0 | 0.0% |
| Hispanic or Latino | 261 | 5.1% |
| Native / Alaskan | 0 | 0.0% |
| White / Caucasian | 4,807 | 93.6% |
| Two or more Races | 106 | 2.1% |
| Some other Race | 127 | 2.5% |
| Total | 5,134 | 100.0% |
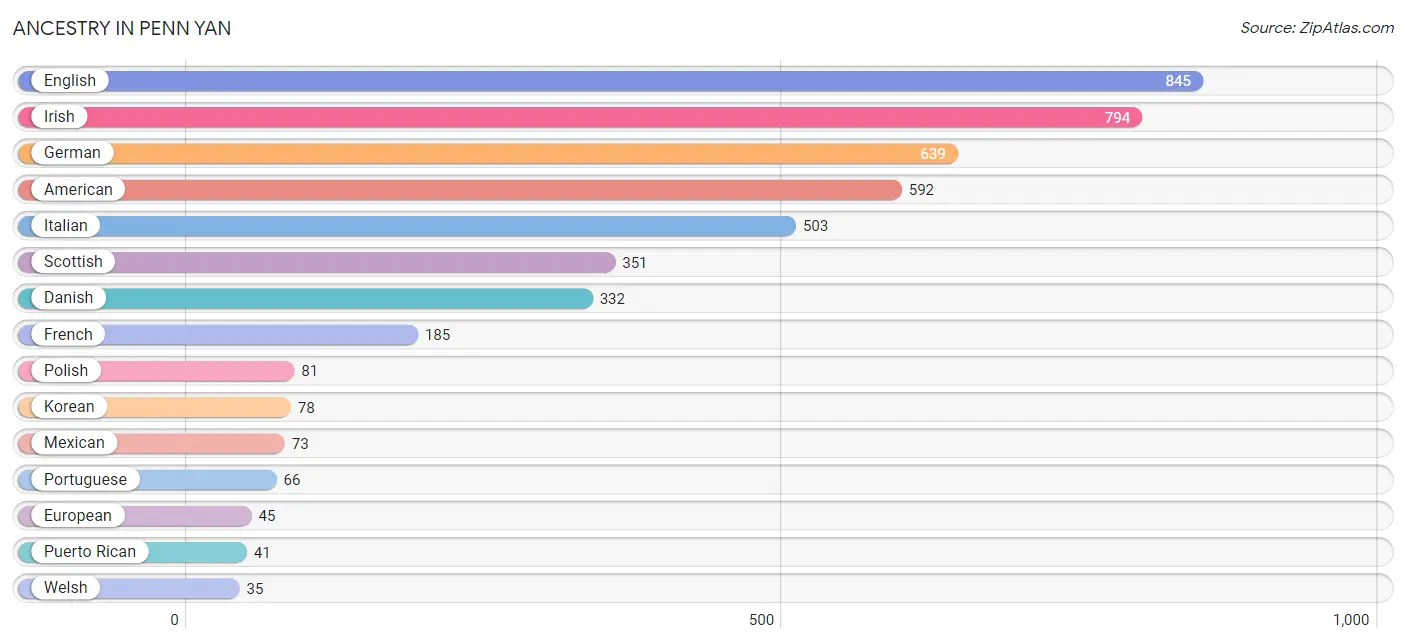
Ancestry in Penn Yan
The most populous ancestries reported in Penn Yan are English (845 | 16.5%), Irish (794 | 15.5%), German (639 | 12.4%), American (592 | 11.5%), and Italian (503 | 9.8%), together accounting for 65.7% of all Penn Yan residents.
| Ancestry | # Population | % Population |
| American | 592 | 11.5% |
| Arab | 6 | 0.1% |
| Austrian | 32 | 0.6% |
| British | 18 | 0.4% |
| Central American | 26 | 0.5% |
| Czech | 11 | 0.2% |
| Danish | 332 | 6.5% |
| Dominican | 16 | 0.3% |
| Dutch | 5 | 0.1% |
| Egyptian | 6 | 0.1% |
| English | 845 | 16.5% |
| European | 45 | 0.9% |
| French | 185 | 3.6% |
| French Canadian | 34 | 0.7% |
| German | 639 | 12.4% |
| Honduran | 26 | 0.5% |
| Hungarian | 8 | 0.2% |
| Indian (Asian) | 3 | 0.1% |
| Irish | 794 | 15.5% |
| Italian | 503 | 9.8% |
| Korean | 78 | 1.5% |
| Mexican | 73 | 1.4% |
| Norwegian | 8 | 0.2% |
| Pennsylvania German | 6 | 0.1% |
| Polish | 81 | 1.6% |
| Portuguese | 66 | 1.3% |
| Puerto Rican | 41 | 0.8% |
| Scottish | 351 | 6.8% |
| Swedish | 15 | 0.3% |
| Welsh | 35 | 0.7% | View All 30 Rows |
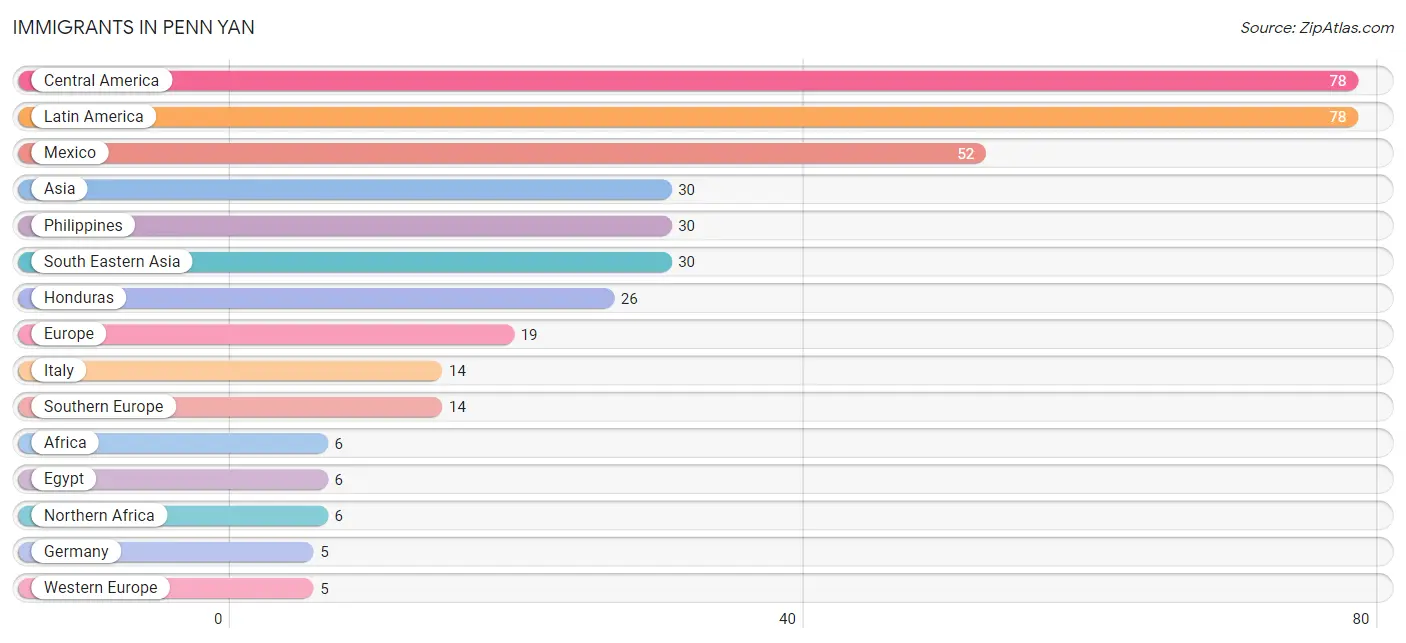
Immigrants in Penn Yan
The most numerous immigrant groups reported in Penn Yan came from Central America (78 | 1.5%), Latin America (78 | 1.5%), Mexico (52 | 1.0%), Asia (30 | 0.6%), and Philippines (30 | 0.6%), together accounting for 5.2% of all Penn Yan residents.
| Immigration Origin | # Population | % Population |
| Africa | 6 | 0.1% |
| Asia | 30 | 0.6% |
| Central America | 78 | 1.5% |
| Egypt | 6 | 0.1% |
| Europe | 19 | 0.4% |
| Germany | 5 | 0.1% |
| Honduras | 26 | 0.5% |
| Italy | 14 | 0.3% |
| Latin America | 78 | 1.5% |
| Mexico | 52 | 1.0% |
| Northern Africa | 6 | 0.1% |
| Philippines | 30 | 0.6% |
| South Eastern Asia | 30 | 0.6% |
| Southern Europe | 14 | 0.3% |
| Western Europe | 5 | 0.1% | View All 15 Rows |
Sex and Age in Penn Yan
Sex and Age in Penn Yan
The most populous age groups in Penn Yan are 65 to 69 Years (287 | 12.7%) for men and 50 to 54 Years (330 | 11.5%) for women.
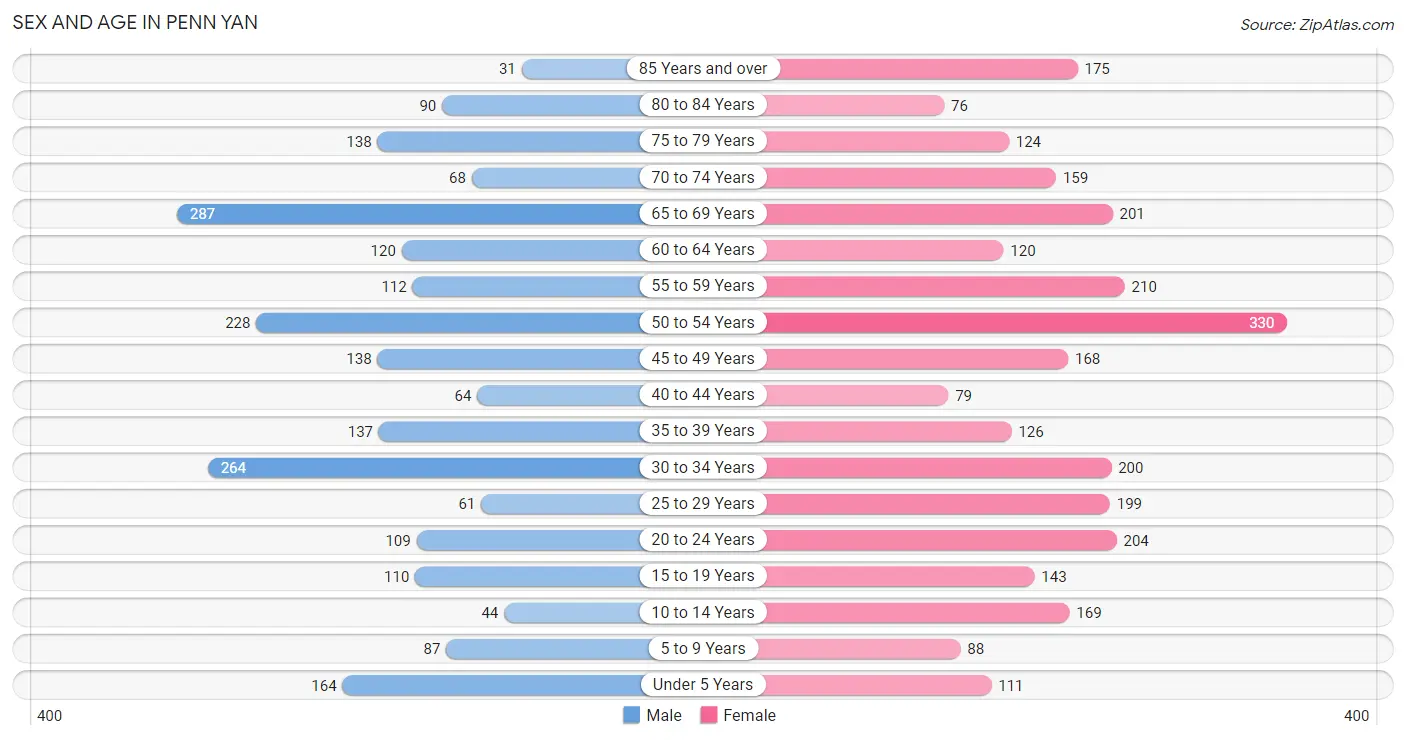
| Age Bracket | Male | Female |
| Under 5 Years | 164 (7.3%) | 111 (3.8%) |
| 5 to 9 Years | 87 (3.9%) | 88 (3.0%) |
| 10 to 14 Years | 44 (1.9%) | 169 (5.9%) |
| 15 to 19 Years | 110 (4.9%) | 143 (5.0%) |
| 20 to 24 Years | 109 (4.8%) | 204 (7.1%) |
| 25 to 29 Years | 61 (2.7%) | 199 (6.9%) |
| 30 to 34 Years | 264 (11.7%) | 200 (6.9%) |
| 35 to 39 Years | 137 (6.1%) | 126 (4.4%) |
| 40 to 44 Years | 64 (2.8%) | 79 (2.7%) |
| 45 to 49 Years | 138 (6.1%) | 168 (5.8%) |
| 50 to 54 Years | 228 (10.1%) | 330 (11.5%) |
| 55 to 59 Years | 112 (5.0%) | 210 (7.3%) |
| 60 to 64 Years | 120 (5.3%) | 120 (4.2%) |
| 65 to 69 Years | 287 (12.7%) | 201 (7.0%) |
| 70 to 74 Years | 68 (3.0%) | 159 (5.5%) |
| 75 to 79 Years | 138 (6.1%) | 124 (4.3%) |
| 80 to 84 Years | 90 (4.0%) | 76 (2.6%) |
| 85 Years and over | 31 (1.4%) | 175 (6.1%) |
| Total | 2,252 (100.0%) | 2,882 (100.0%) |
Families and Households in Penn Yan
Median Family Size in Penn Yan
The median family size in Penn Yan is 3.03 persons per family, with single male/father families (102 | 8.9%) accounting for the largest median family size of 3.98 persons per family. On the other hand, married-couple families (776 | 67.5%) represent the smallest median family size with 2.76 persons per family.
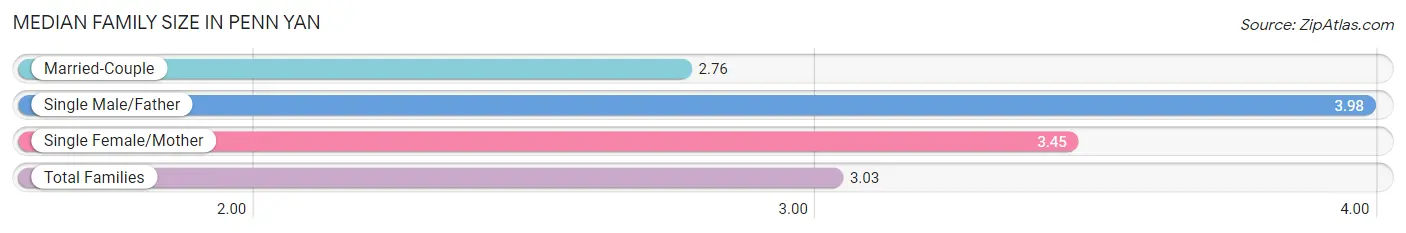
| Family Type | # Families | Family Size |
| Married-Couple | 776 (67.5%) | 2.76 |
| Single Male/Father | 102 (8.9%) | 3.98 |
| Single Female/Mother | 271 (23.6%) | 3.45 |
| Total Families | 1,149 (100.0%) | 3.03 |
Median Household Size in Penn Yan
The median household size in Penn Yan is 2.16 persons per household, with single male/father households (102 | 4.6%) accounting for the largest median household size of 5.08 persons per household. non-family households (1,087 | 48.6%) represent the smallest median household size with 1.10 persons per household.
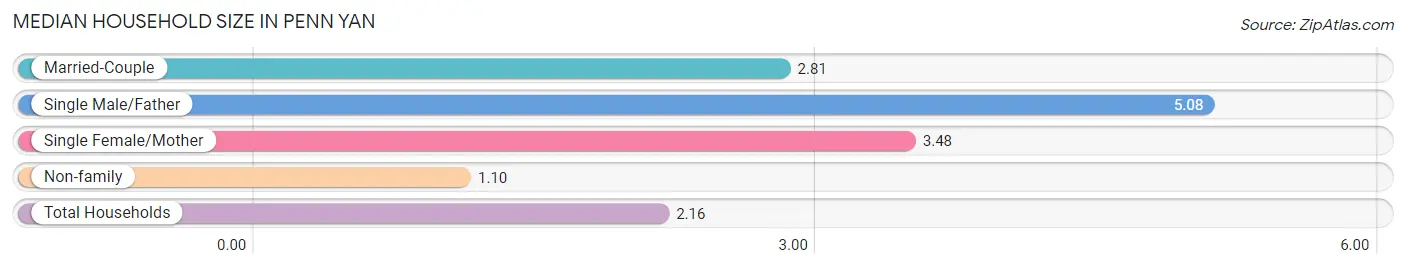
| Household Type | # Households | Household Size |
| Married-Couple | 776 (34.7%) | 2.81 |
| Single Male/Father | 102 (4.6%) | 5.08 |
| Single Female/Mother | 271 (12.1%) | 3.48 |
| Non-family | 1,087 (48.6%) | 1.10 |
| Total Households | 2,236 (100.0%) | 2.16 |
Household Size by Marriage Status in Penn Yan
Out of a total of 2,236 households in Penn Yan, 1,149 (51.4%) are family households, while 1,087 (48.6%) are nonfamily households. The most numerous type of family households are 2-person households, comprising 644, and the most common type of nonfamily households are 1-person households, comprising 964.
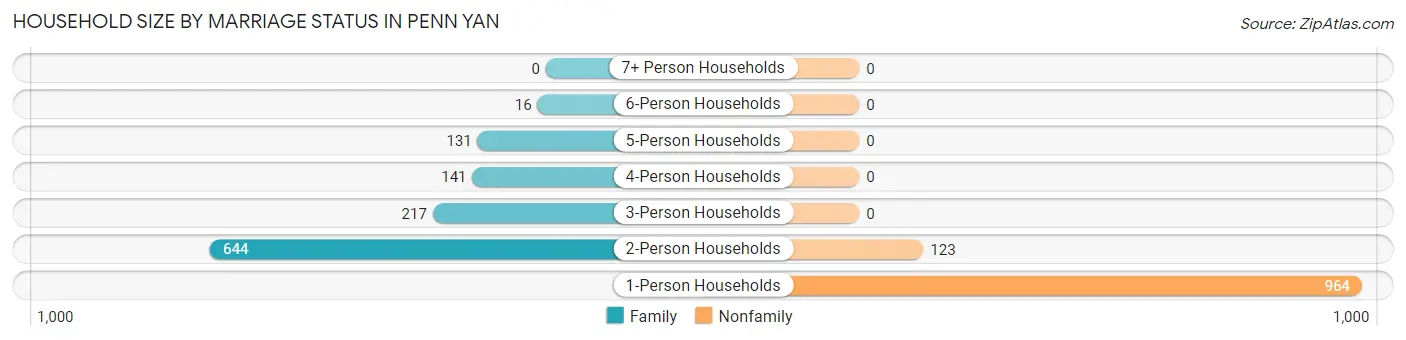
| Household Size | Family Households | Nonfamily Households |
| 1-Person Households | - | 964 (43.1%) |
| 2-Person Households | 644 (28.8%) | 123 (5.5%) |
| 3-Person Households | 217 (9.7%) | 0 (0.0%) |
| 4-Person Households | 141 (6.3%) | 0 (0.0%) |
| 5-Person Households | 131 (5.9%) | 0 (0.0%) |
| 6-Person Households | 16 (0.7%) | 0 (0.0%) |
| 7+ Person Households | 0 (0.0%) | 0 (0.0%) |
| Total | 1,149 (51.4%) | 1,087 (48.6%) |
Female Fertility in Penn Yan
Fertility by Age in Penn Yan
Average fertility rate in Penn Yan is 30.0 births per 1,000 women. Women in the age bracket of 20 to 34 years have the highest fertility rate with 40.0 births per 1,000 women. Women in the age bracket of 20 to 34 years acount for 70.6% of all women with births.
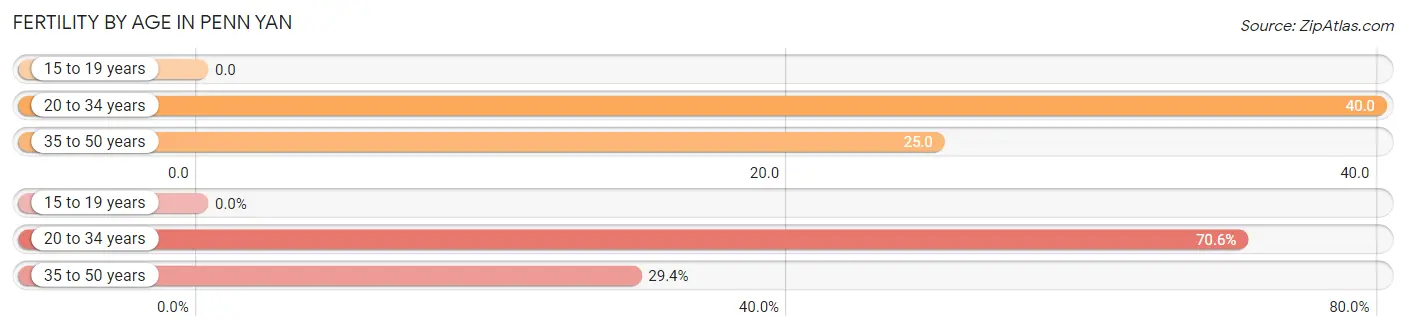
| Age Bracket | Women with Births | Births / 1,000 Women |
| 15 to 19 years | 0 (0.0%) | 0.0 |
| 20 to 34 years | 24 (70.6%) | 40.0 |
| 35 to 50 years | 10 (29.4%) | 25.0 |
| Total | 34 (100.0%) | 30.0 |
Fertility by Age by Marriage Status in Penn Yan
82.4% of women with births (34) in Penn Yan are married. The highest percentage of unmarried women with births falls into 20 to 34 years age bracket with 25.0% of them unmarried at the time of birth, while the lowest percentage of unmarried women with births belong to 35 to 50 years age bracket with 0.0% of them unmarried.
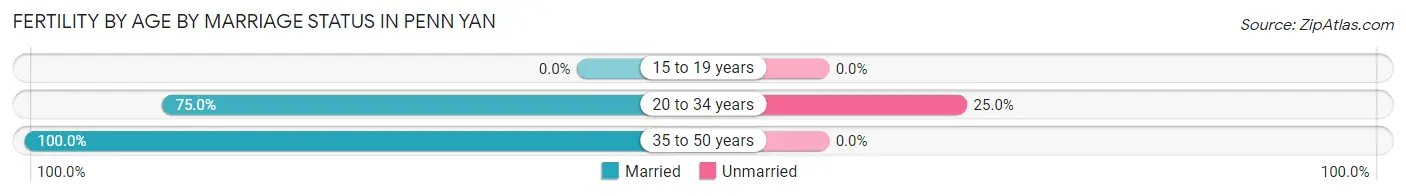
| Age Bracket | Married | Unmarried |
| 15 to 19 years | 0 (0.0%) | 0 (0.0%) |
| 20 to 34 years | 18 (75.0%) | 6 (25.0%) |
| 35 to 50 years | 10 (100.0%) | 0 (0.0%) |
| Total | 28 (82.4%) | 6 (17.6%) |
Fertility by Education in Penn Yan
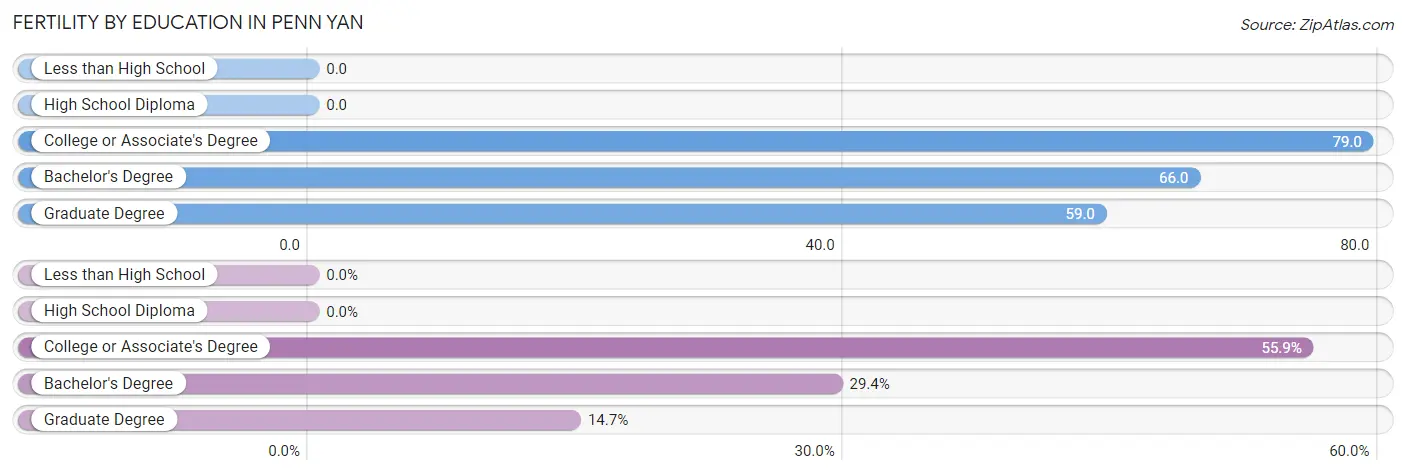
| Educational Attainment | Women with Births | Births / 1,000 Women |
| Less than High School | 0 (0.0%) | 0.0 |
| High School Diploma | 0 (0.0%) | 0.0 |
| College or Associate's Degree | 19 (55.9%) | 79.0 |
| Bachelor's Degree | 10 (29.4%) | 66.0 |
| Graduate Degree | 5 (14.7%) | 59.0 |
| Total | 34 (100.0%) | 30.0 |
Fertility by Education by Marriage Status in Penn Yan
17.6% of women with births in Penn Yan are unmarried. Women with the educational attainment of bachelor's degree are most likely to be married with 100.0% of them married at childbirth, while women with the educational attainment of college or associate's degree are least likely to be married with 31.6% of them unmarried at childbirth.
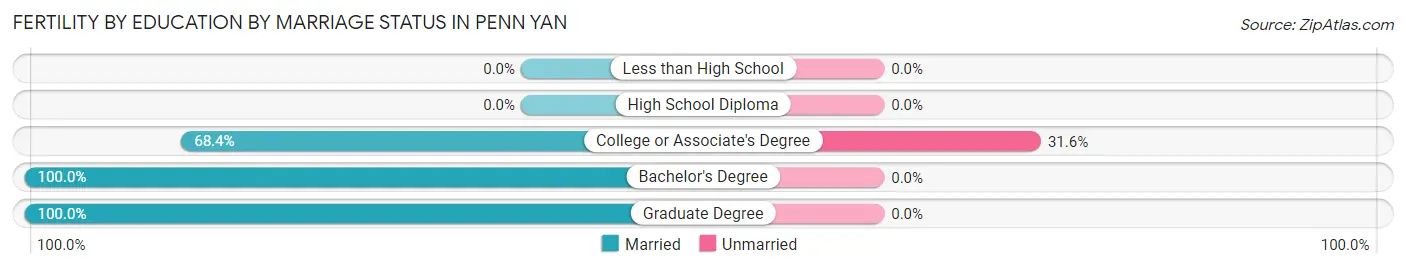
| Educational Attainment | Married | Unmarried |
| Less than High School | 0 (0.0%) | 0 (0.0%) |
| High School Diploma | 0 (0.0%) | 0 (0.0%) |
| College or Associate's Degree | 13 (68.4%) | 6 (31.6%) |
| Bachelor's Degree | 10 (100.0%) | 0 (0.0%) |
| Graduate Degree | 5 (100.0%) | 0 (0.0%) |
| Total | 28 (82.4%) | 6 (17.6%) |
Employment Characteristics in Penn Yan
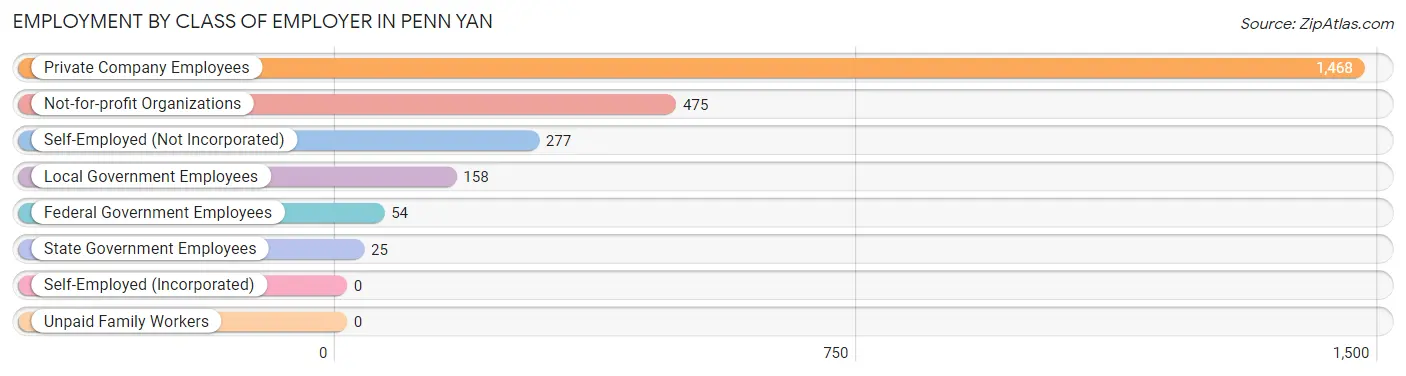
Employment by Class of Employer in Penn Yan
Among the 2,457 employed individuals in Penn Yan, private company employees (1,468 | 59.8%), not-for-profit organizations (475 | 19.3%), and self-employed (not incorporated) (277 | 11.3%) make up the most common classes of employment.
| Employer Class | # Employees | % Employees |
| Private Company Employees | 1,468 | 59.8% |
| Self-Employed (Incorporated) | 0 | 0.0% |
| Self-Employed (Not Incorporated) | 277 | 11.3% |
| Not-for-profit Organizations | 475 | 19.3% |
| Local Government Employees | 158 | 6.4% |
| State Government Employees | 25 | 1.0% |
| Federal Government Employees | 54 | 2.2% |
| Unpaid Family Workers | 0 | 0.0% |
| Total | 2,457 | 100.0% |
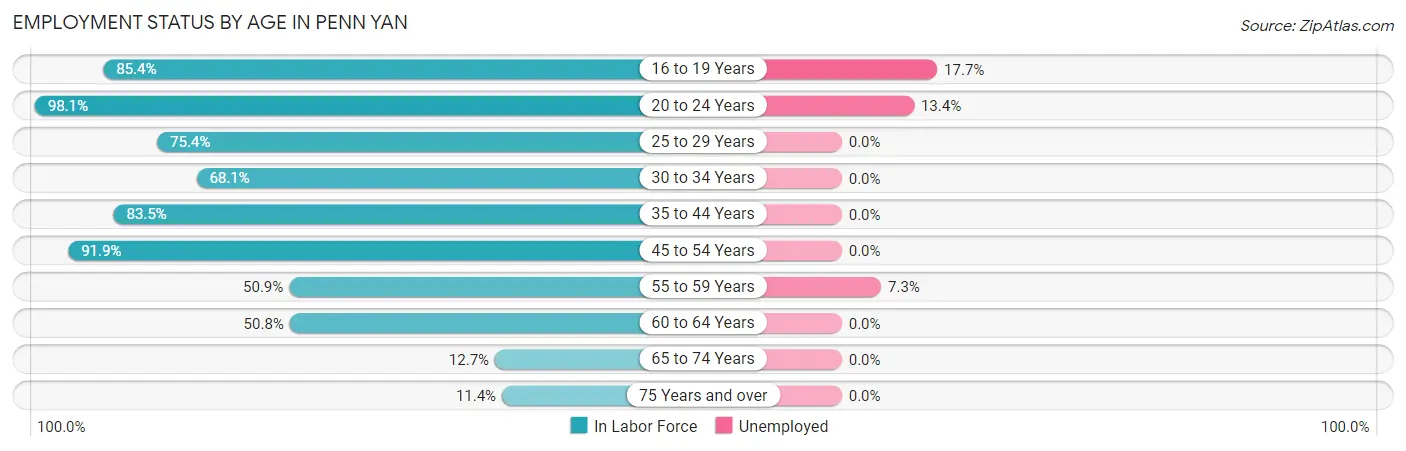
Employment Status by Age in Penn Yan
According to the labor force statistics for Penn Yan, out of the total population over 16 years of age (4,423), 58.2% or 2,574 individuals are in the labor force, with 3.3% or 85 of them unemployed. The age group with the highest labor force participation rate is 20 to 24 years, with 98.1% or 307 individuals in the labor force. Within the labor force, the 16 to 19 years age range has the highest percentage of unemployed individuals, with 17.7% or 31 of them being unemployed.
| Age Bracket | In Labor Force | Unemployed |
| 16 to 19 Years | 175 (85.4%) | 31 (17.7%) |
| 20 to 24 Years | 307 (98.1%) | 41 (13.4%) |
| 25 to 29 Years | 196 (75.4%) | 0 (0.0%) |
| 30 to 34 Years | 316 (68.1%) | 0 (0.0%) |
| 35 to 44 Years | 339 (83.5%) | 0 (0.0%) |
| 45 to 54 Years | 794 (91.9%) | 0 (0.0%) |
| 55 to 59 Years | 164 (50.9%) | 12 (7.3%) |
| 60 to 64 Years | 122 (50.8%) | 0 (0.0%) |
| 65 to 74 Years | 91 (12.7%) | 0 (0.0%) |
| 75 Years and over | 72 (11.4%) | 0 (0.0%) |
| Total | 2,574 (58.2%) | 85 (3.3%) |
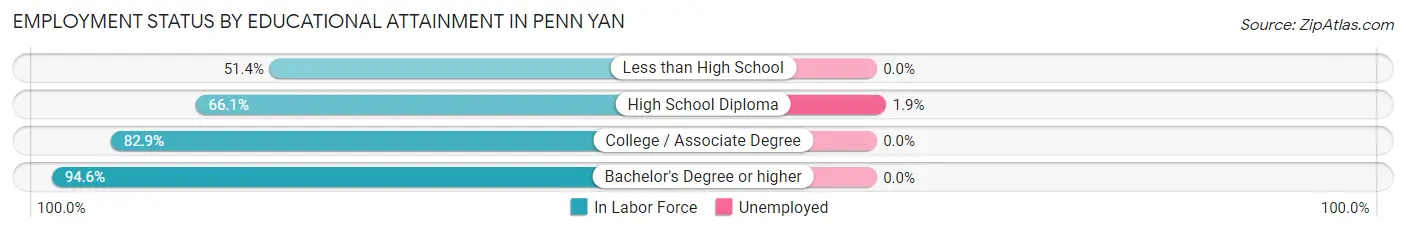
Employment Status by Educational Attainment in Penn Yan
According to labor force statistics for Penn Yan, 75.5% of individuals (1,930) out of the total population between 25 and 64 years of age (2,556) are in the labor force, with 0.6% or 12 of them being unemployed. The group with the highest labor force participation rate are those with the educational attainment of bachelor's degree or higher, with 94.6% or 629 individuals in the labor force. Within the labor force, individuals with high school diploma education have the highest percentage of unemployment, with 1.9% or 12 of them being unemployed.
| Educational Attainment | In Labor Force | Unemployed |
| Less than High School | 169 (51.4%) | 0 (0.0%) |
| High School Diploma | 635 (66.1%) | 18 (1.9%) |
| College / Associate Degree | 498 (82.9%) | 0 (0.0%) |
| Bachelor's Degree or higher | 629 (94.6%) | 0 (0.0%) |
| Total | 1,930 (75.5%) | 15 (0.6%) |
Employment Occupations by Sex in Penn Yan
Management, Business, Science and Arts Occupations
The most common Management, Business, Science and Arts occupations in Penn Yan are Community & Social Service (336 | 13.5%), Education Instruction & Library (201 | 8.1%), Management (144 | 5.8%), Health Diagnosing & Treating (125 | 5.0%), and Education, Arts & Media (88 | 3.5%).
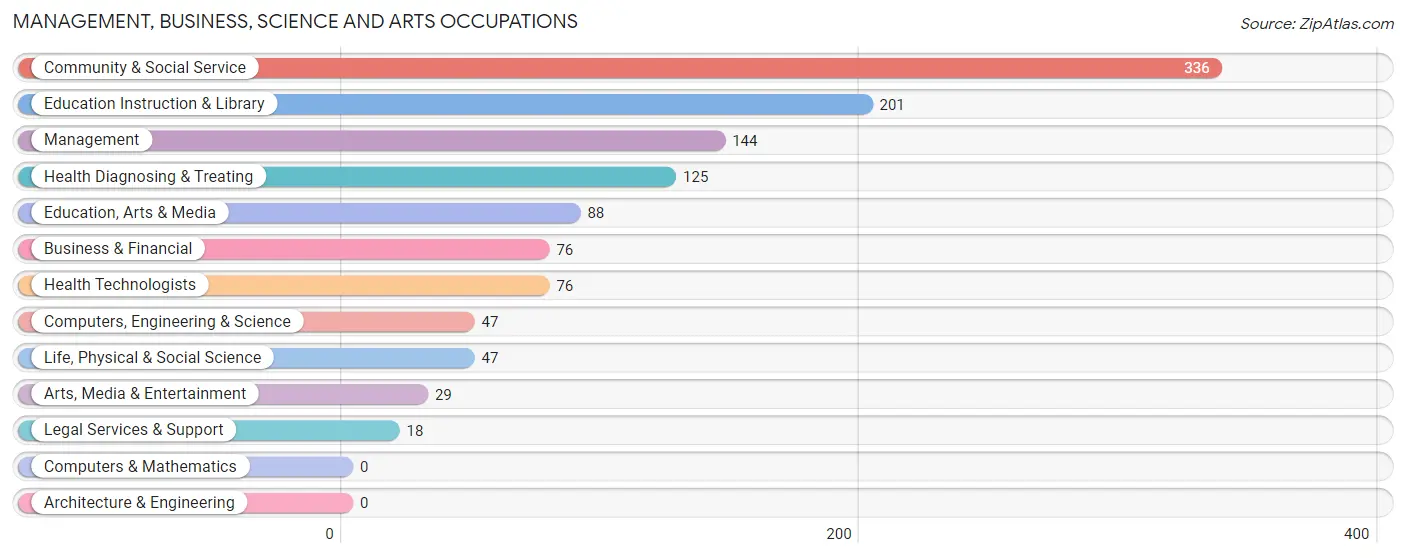
Management, Business, Science and Arts Occupations by Sex
Within the Management, Business, Science and Arts occupations in Penn Yan, the most male-oriented occupations are Computers, Engineering & Science (100.0%), Life, Physical & Social Science (100.0%), and Legal Services & Support (100.0%), while the most female-oriented occupations are Health Technologists (100.0%), Business & Financial (96.1%), and Education Instruction & Library (92.0%).
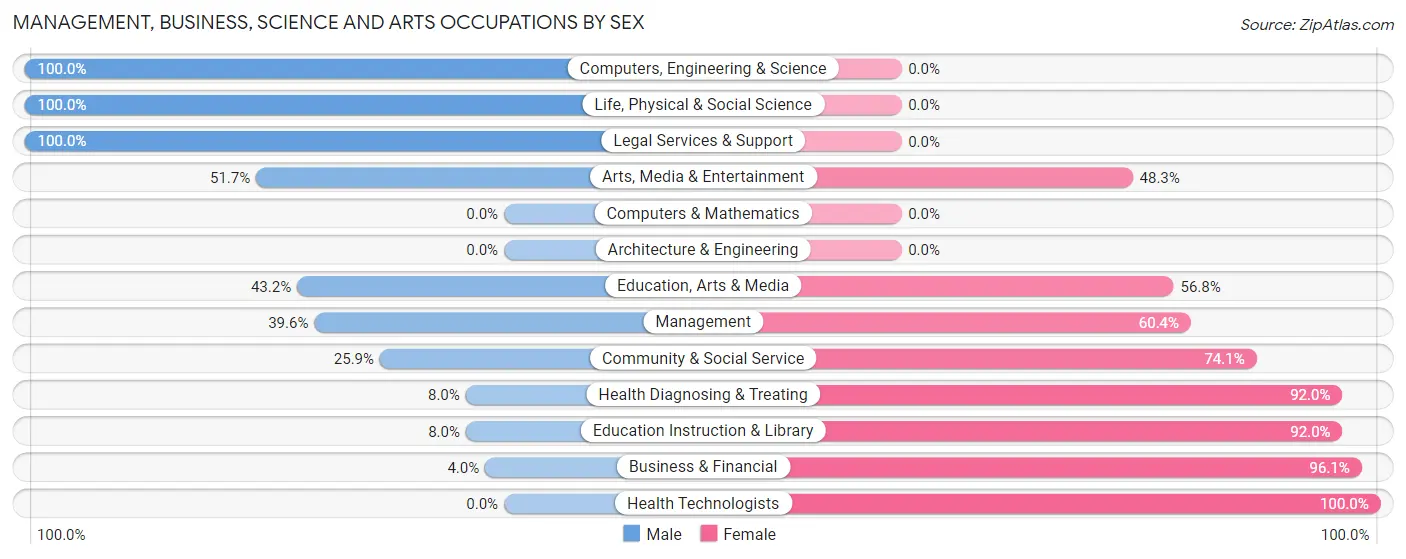
| Occupation | Male | Female |
| Management | 57 (39.6%) | 87 (60.4%) |
| Business & Financial | 3 (4.0%) | 73 (96.1%) |
| Computers, Engineering & Science | 47 (100.0%) | 0 (0.0%) |
| Computers & Mathematics | 0 (0.0%) | 0 (0.0%) |
| Architecture & Engineering | 0 (0.0%) | 0 (0.0%) |
| Life, Physical & Social Science | 47 (100.0%) | 0 (0.0%) |
| Community & Social Service | 87 (25.9%) | 249 (74.1%) |
| Education, Arts & Media | 38 (43.2%) | 50 (56.8%) |
| Legal Services & Support | 18 (100.0%) | 0 (0.0%) |
| Education Instruction & Library | 16 (8.0%) | 185 (92.0%) |
| Arts, Media & Entertainment | 15 (51.7%) | 14 (48.3%) |
| Health Diagnosing & Treating | 10 (8.0%) | 115 (92.0%) |
| Health Technologists | 0 (0.0%) | 76 (100.0%) |
| Total (Category) | 204 (28.0%) | 524 (72.0%) |
| Total (Overall) | 1,145 (46.0%) | 1,347 (54.0%) |
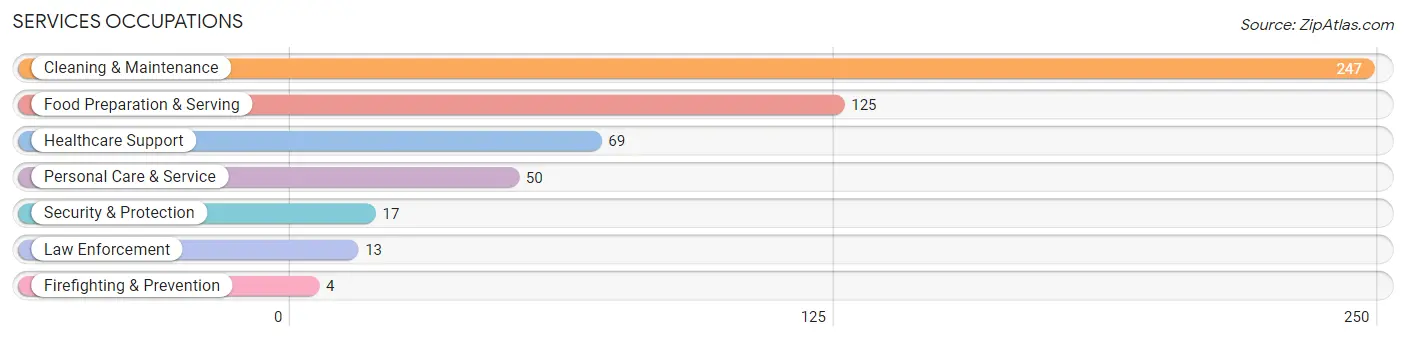
Services Occupations
The most common Services occupations in Penn Yan are Cleaning & Maintenance (247 | 9.9%), Food Preparation & Serving (125 | 5.0%), Healthcare Support (69 | 2.8%), Personal Care & Service (50 | 2.0%), and Security & Protection (17 | 0.7%).
Services Occupations by Sex
Within the Services occupations in Penn Yan, the most male-oriented occupations are Firefighting & Prevention (100.0%), Food Preparation & Serving (73.6%), and Cleaning & Maintenance (33.6%), while the most female-oriented occupations are Healthcare Support (100.0%), Law Enforcement (100.0%), and Personal Care & Service (82.0%).
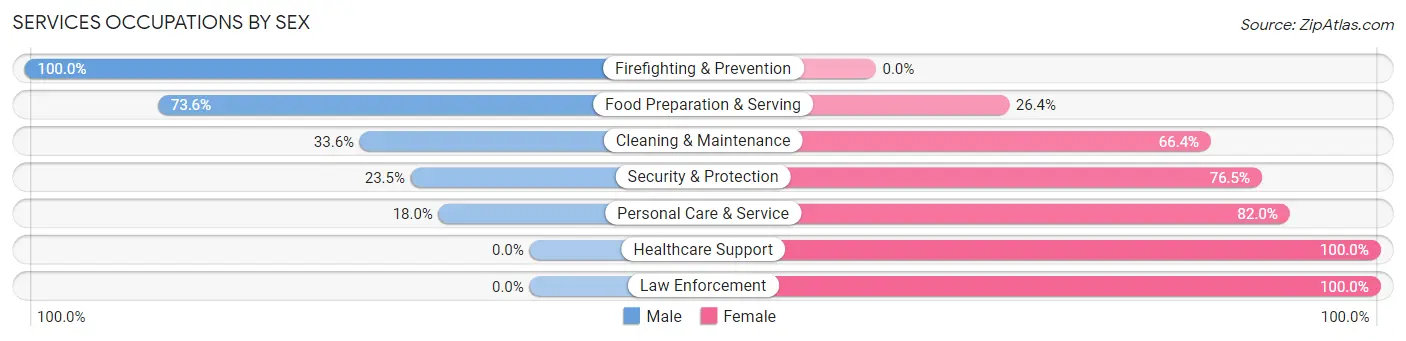
| Occupation | Male | Female |
| Healthcare Support | 0 (0.0%) | 69 (100.0%) |
| Security & Protection | 4 (23.5%) | 13 (76.5%) |
| Firefighting & Prevention | 4 (100.0%) | 0 (0.0%) |
| Law Enforcement | 0 (0.0%) | 13 (100.0%) |
| Food Preparation & Serving | 92 (73.6%) | 33 (26.4%) |
| Cleaning & Maintenance | 83 (33.6%) | 164 (66.4%) |
| Personal Care & Service | 9 (18.0%) | 41 (82.0%) |
| Total (Category) | 188 (37.0%) | 320 (63.0%) |
| Total (Overall) | 1,145 (46.0%) | 1,347 (54.0%) |
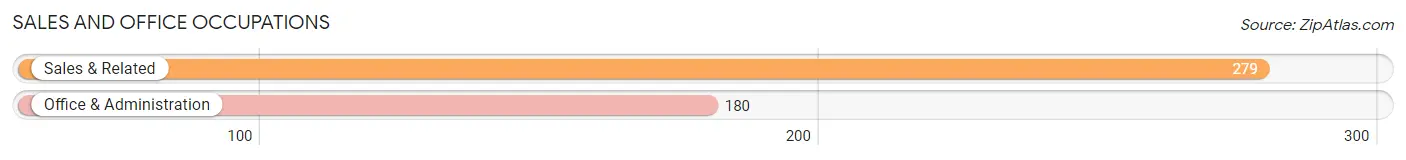
Sales and Office Occupations
The most common Sales and Office occupations in Penn Yan are Sales & Related (279 | 11.2%), and Office & Administration (180 | 7.2%).
Sales and Office Occupations by Sex

| Occupation | Male | Female |
| Sales & Related | 50 (17.9%) | 229 (82.1%) |
| Office & Administration | 12 (6.7%) | 168 (93.3%) |
| Total (Category) | 62 (13.5%) | 397 (86.5%) |
| Total (Overall) | 1,145 (46.0%) | 1,347 (54.0%) |
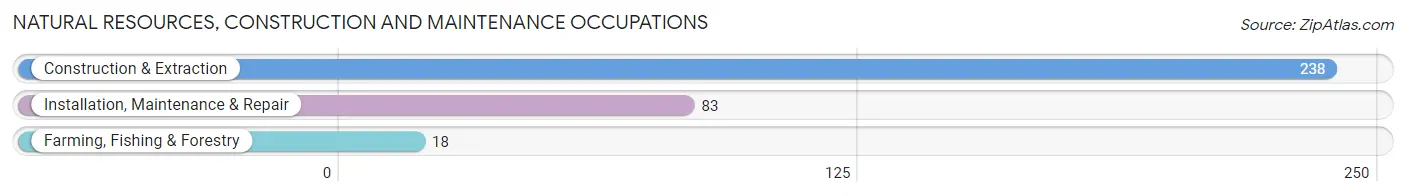
Natural Resources, Construction and Maintenance Occupations
The most common Natural Resources, Construction and Maintenance occupations in Penn Yan are Construction & Extraction (238 | 9.6%), Installation, Maintenance & Repair (83 | 3.3%), and Farming, Fishing & Forestry (18 | 0.7%).
Natural Resources, Construction and Maintenance Occupations by Sex
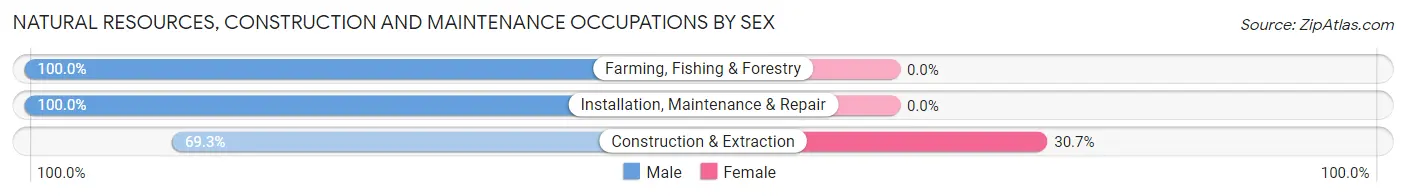
| Occupation | Male | Female |
| Farming, Fishing & Forestry | 18 (100.0%) | 0 (0.0%) |
| Construction & Extraction | 165 (69.3%) | 73 (30.7%) |
| Installation, Maintenance & Repair | 83 (100.0%) | 0 (0.0%) |
| Total (Category) | 266 (78.5%) | 73 (21.5%) |
| Total (Overall) | 1,145 (46.0%) | 1,347 (54.0%) |
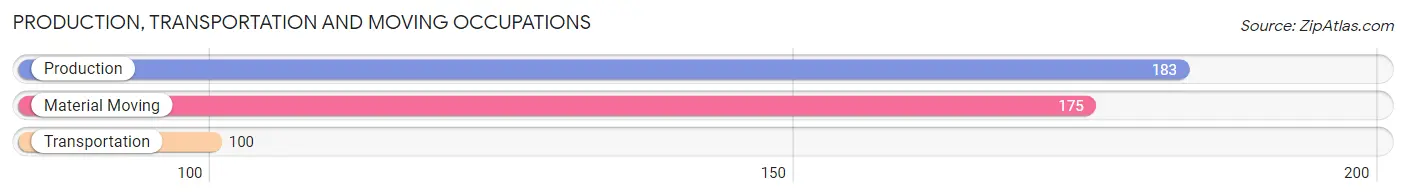
Production, Transportation and Moving Occupations
The most common Production, Transportation and Moving occupations in Penn Yan are Production (183 | 7.3%), Material Moving (175 | 7.0%), and Transportation (100 | 4.0%).
Production, Transportation and Moving Occupations by Sex
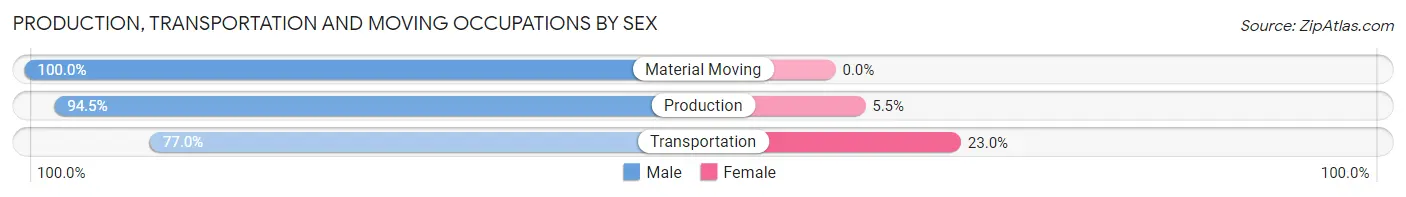
| Occupation | Male | Female |
| Production | 173 (94.5%) | 10 (5.5%) |
| Transportation | 77 (77.0%) | 23 (23.0%) |
| Material Moving | 175 (100.0%) | 0 (0.0%) |
| Total (Category) | 425 (92.8%) | 33 (7.2%) |
| Total (Overall) | 1,145 (46.0%) | 1,347 (54.0%) |
Employment Industries by Sex in Penn Yan
Employment Industries in Penn Yan
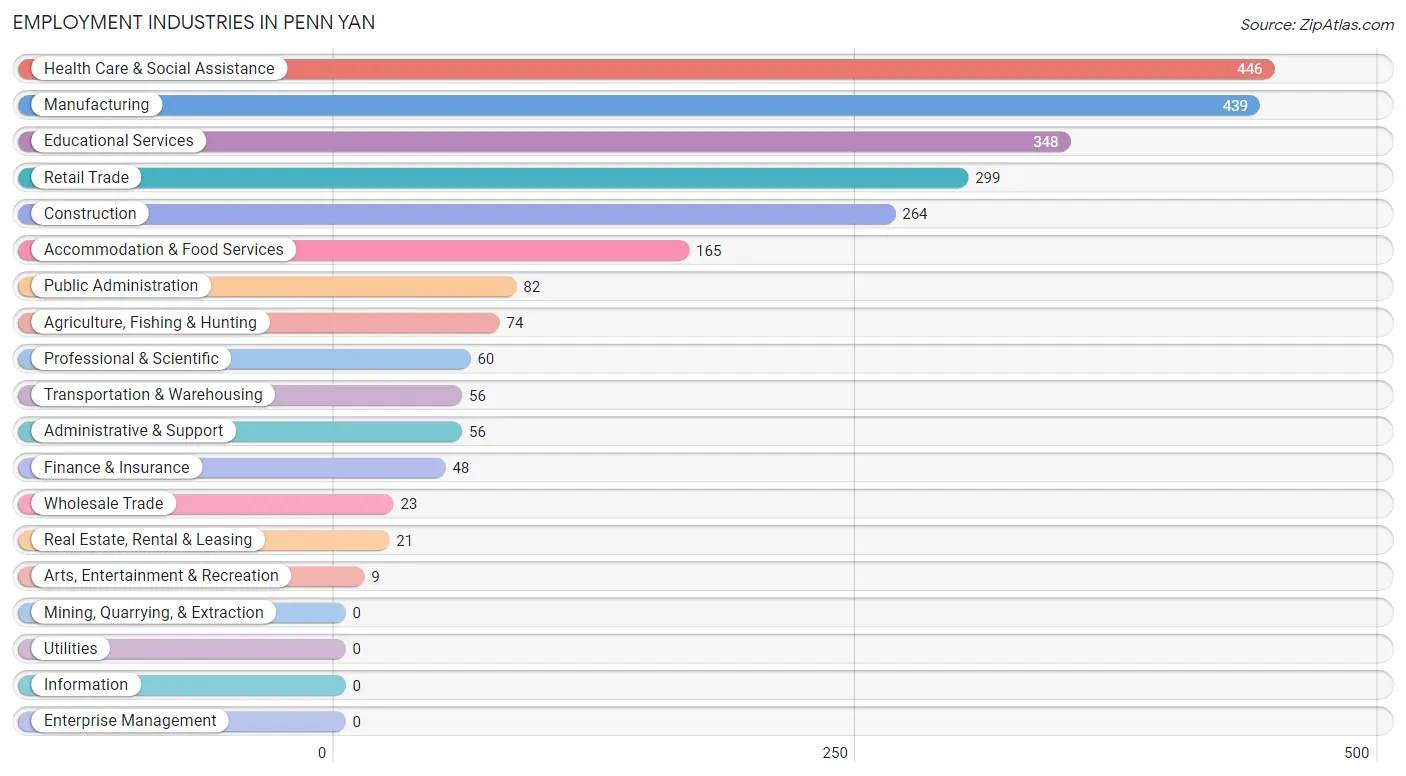
The major employment industries in Penn Yan include Health Care & Social Assistance (446 | 17.9%), Manufacturing (439 | 17.6%), Educational Services (348 | 14.0%), Retail Trade (299 | 12.0%), and Construction (264 | 10.6%).
Employment Industries by Sex in Penn Yan
The Penn Yan industries that see more men than women are Wholesale Trade (100.0%), Real Estate, Rental & Leasing (100.0%), and Manufacturing (86.3%), whereas the industries that tend to have a higher number of women are Finance & Insurance (100.0%), Health Care & Social Assistance (86.1%), and Educational Services (79.3%).
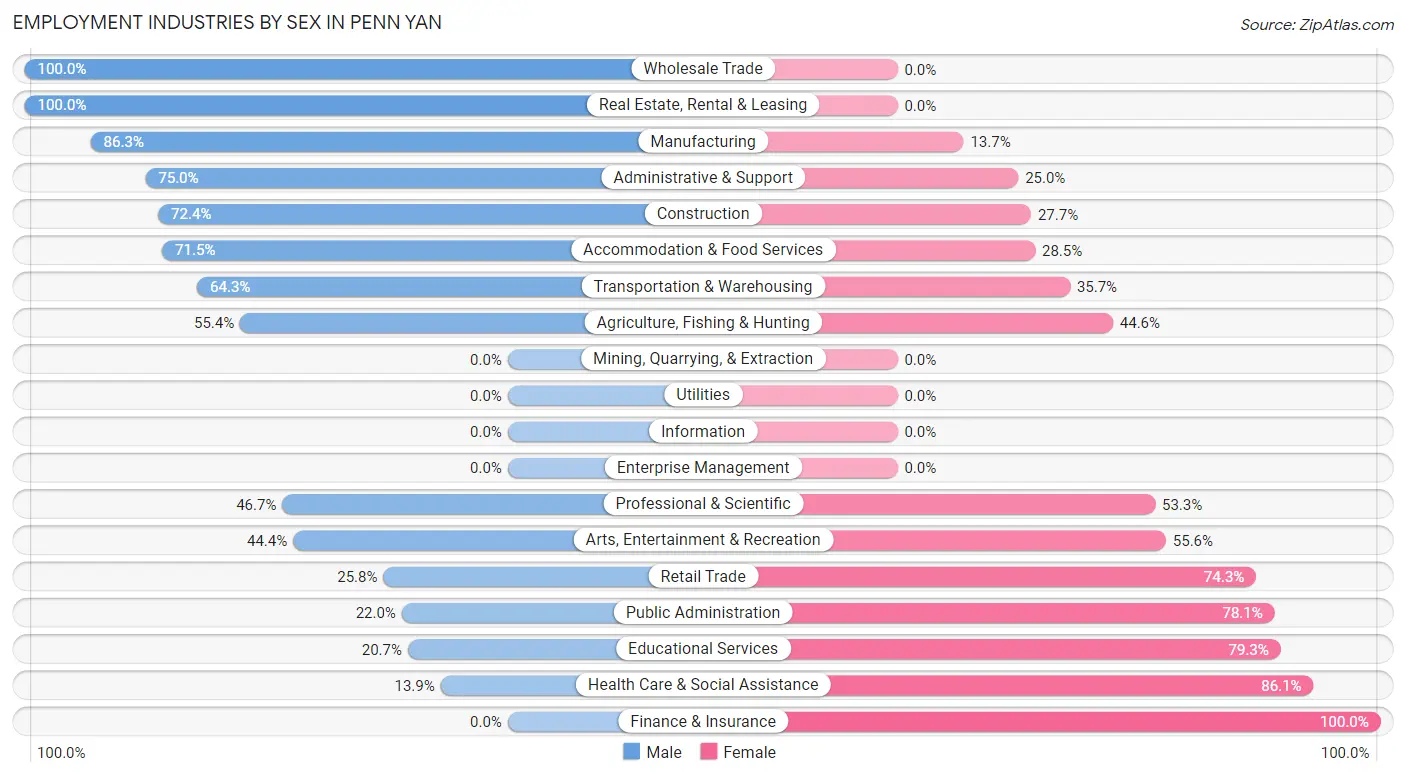
| Industry | Male | Female |
| Agriculture, Fishing & Hunting | 41 (55.4%) | 33 (44.6%) |
| Mining, Quarrying, & Extraction | 0 (0.0%) | 0 (0.0%) |
| Construction | 191 (72.4%) | 73 (27.7%) |
| Manufacturing | 379 (86.3%) | 60 (13.7%) |
| Wholesale Trade | 23 (100.0%) | 0 (0.0%) |
| Retail Trade | 77 (25.8%) | 222 (74.3%) |
| Transportation & Warehousing | 36 (64.3%) | 20 (35.7%) |
| Utilities | 0 (0.0%) | 0 (0.0%) |
| Information | 0 (0.0%) | 0 (0.0%) |
| Finance & Insurance | 0 (0.0%) | 48 (100.0%) |
| Real Estate, Rental & Leasing | 21 (100.0%) | 0 (0.0%) |
| Professional & Scientific | 28 (46.7%) | 32 (53.3%) |
| Enterprise Management | 0 (0.0%) | 0 (0.0%) |
| Administrative & Support | 42 (75.0%) | 14 (25.0%) |
| Educational Services | 72 (20.7%) | 276 (79.3%) |
| Health Care & Social Assistance | 62 (13.9%) | 384 (86.1%) |
| Arts, Entertainment & Recreation | 4 (44.4%) | 5 (55.6%) |
| Accommodation & Food Services | 118 (71.5%) | 47 (28.5%) |
| Public Administration | 18 (22.0%) | 64 (78.0%) |
| Total | 1,145 (46.0%) | 1,347 (54.0%) |
Education in Penn Yan
School Enrollment in Penn Yan
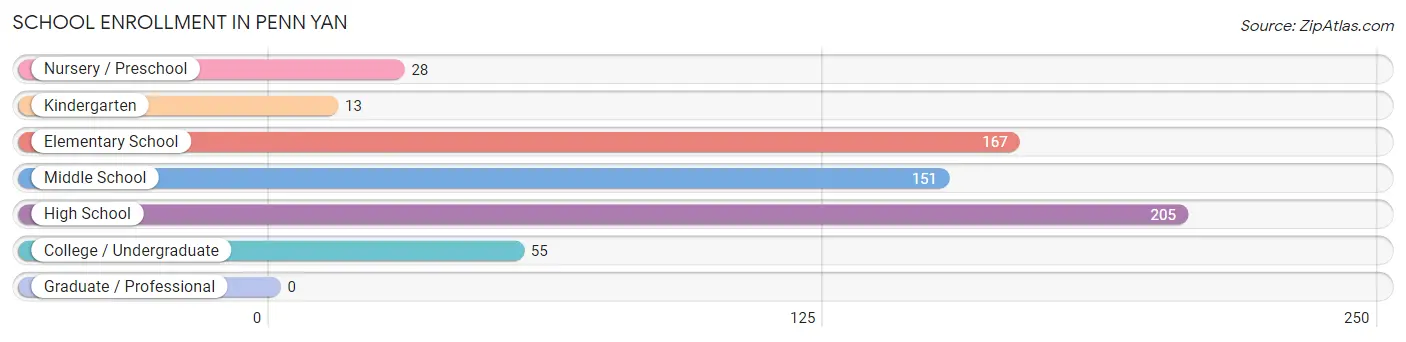
The most common levels of schooling among the 619 students in Penn Yan are high school (205 | 33.1%), elementary school (167 | 27.0%), and middle school (151 | 24.4%).
| School Level | # Students | % Students |
| Nursery / Preschool | 28 | 4.5% |
| Kindergarten | 13 | 2.1% |
| Elementary School | 167 | 27.0% |
| Middle School | 151 | 24.4% |
| High School | 205 | 33.1% |
| College / Undergraduate | 55 | 8.9% |
| Graduate / Professional | 0 | 0.0% |
| Total | 619 | 100.0% |
School Enrollment by Age by Funding Source in Penn Yan
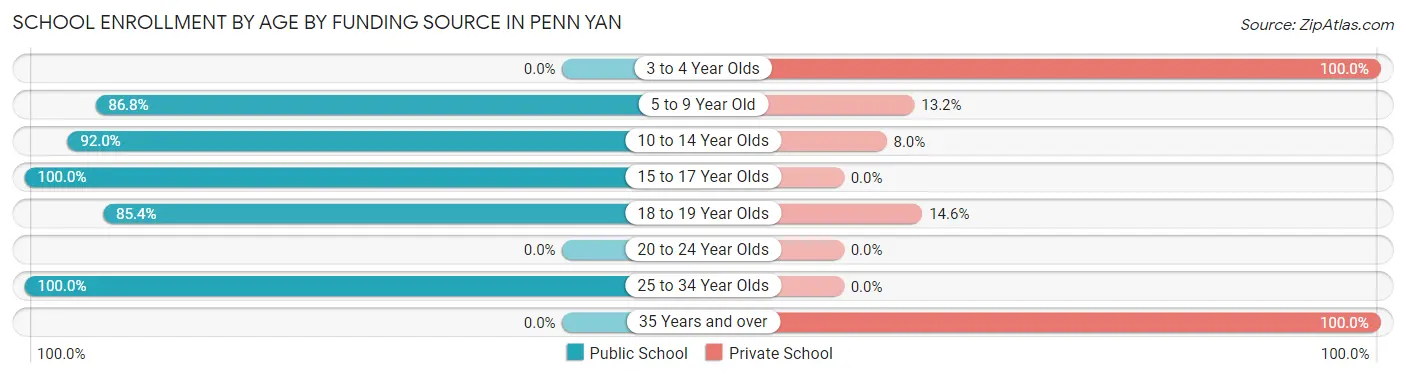
Out of a total of 619 students who are enrolled in schools in Penn Yan, 84 (13.6%) attend a private institution, while the remaining 535 (86.4%) are enrolled in public schools. The age group of 3 to 4 year olds has the highest likelihood of being enrolled in private schools, with 28 (100.0% in the age bracket) enrolled. Conversely, the age group of 15 to 17 year olds has the lowest likelihood of being enrolled in a private school, with 149 (100.0% in the age bracket) attending a public institution.
| Age Bracket | Public School | Private School |
| 3 to 4 Year Olds | 0 (0.0%) | 28 (100.0%) |
| 5 to 9 Year Old | 145 (86.8%) | 22 (13.2%) |
| 10 to 14 Year Olds | 196 (92.0%) | 17 (8.0%) |
| 15 to 17 Year Olds | 149 (100.0%) | 0 (0.0%) |
| 18 to 19 Year Olds | 35 (85.4%) | 6 (14.6%) |
| 20 to 24 Year Olds | 0 (0.0%) | 0 (0.0%) |
| 25 to 34 Year Olds | 10 (100.0%) | 0 (0.0%) |
| 35 Years and over | 0 (0.0%) | 11 (100.0%) |
| Total | 535 (86.4%) | 84 (13.6%) |
Educational Attainment by Field of Study in Penn Yan
Business (171 | 15.7%), education (169 | 15.5%), science & technology (160 | 14.7%), arts & humanities (129 | 11.8%), and bio, nature & agricultural (107 | 9.8%) are the most common fields of study among 1,091 individuals in Penn Yan who have obtained a bachelor's degree or higher.
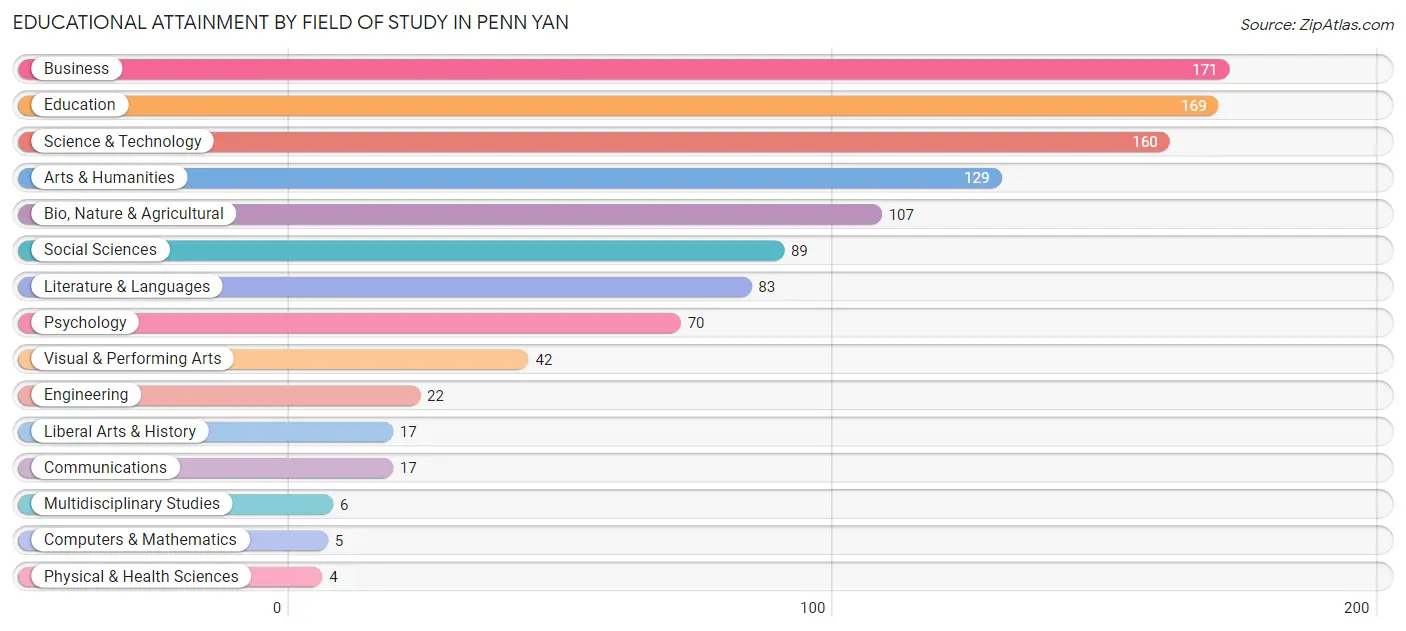
| Field of Study | # Graduates | % Graduates |
| Computers & Mathematics | 5 | 0.5% |
| Bio, Nature & Agricultural | 107 | 9.8% |
| Physical & Health Sciences | 4 | 0.4% |
| Psychology | 70 | 6.4% |
| Social Sciences | 89 | 8.2% |
| Engineering | 22 | 2.0% |
| Multidisciplinary Studies | 6 | 0.5% |
| Science & Technology | 160 | 14.7% |
| Business | 171 | 15.7% |
| Education | 169 | 15.5% |
| Literature & Languages | 83 | 7.6% |
| Liberal Arts & History | 17 | 1.6% |
| Visual & Performing Arts | 42 | 3.8% |
| Communications | 17 | 1.6% |
| Arts & Humanities | 129 | 11.8% |
| Total | 1,091 | 100.0% |
Transportation & Commute in Penn Yan
Vehicle Availability by Sex in Penn Yan
The most prevalent vehicle ownership categories in Penn Yan are males with 2 vehicles (437, accounting for 38.2%) and females with 2 vehicles (497, making up 33.3%).
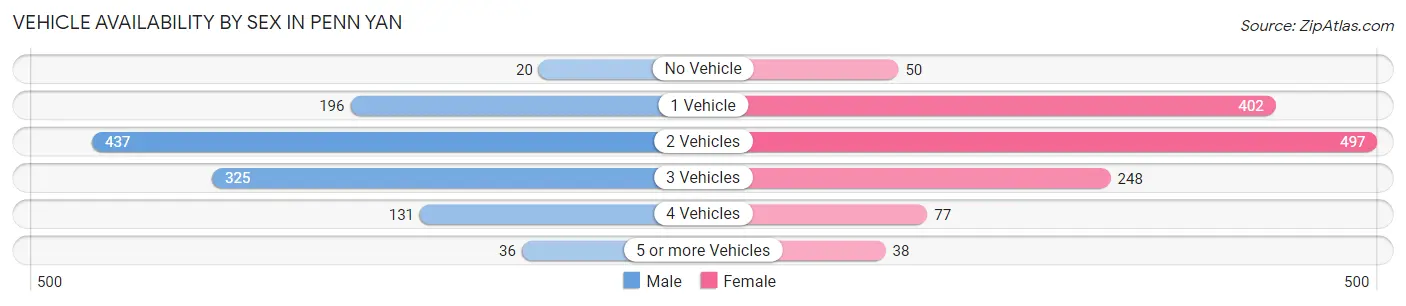
| Vehicles Available | Male | Female |
| No Vehicle | 20 (1.8%) | 50 (3.8%) |
| 1 Vehicle | 196 (17.1%) | 402 (30.6%) |
| 2 Vehicles | 437 (38.2%) | 497 (37.9%) |
| 3 Vehicles | 325 (28.4%) | 248 (18.9%) |
| 4 Vehicles | 131 (11.4%) | 77 (5.9%) |
| 5 or more Vehicles | 36 (3.1%) | 38 (2.9%) |
| Total | 1,145 (100.0%) | 1,312 (100.0%) |
Commute Time in Penn Yan
The most frequently occuring commute durations in Penn Yan are 5 to 9 minutes (740 commuters, 32.0%), less than 5 minutes (251 commuters, 10.9%), and 20 to 24 minutes (239 commuters, 10.3%).
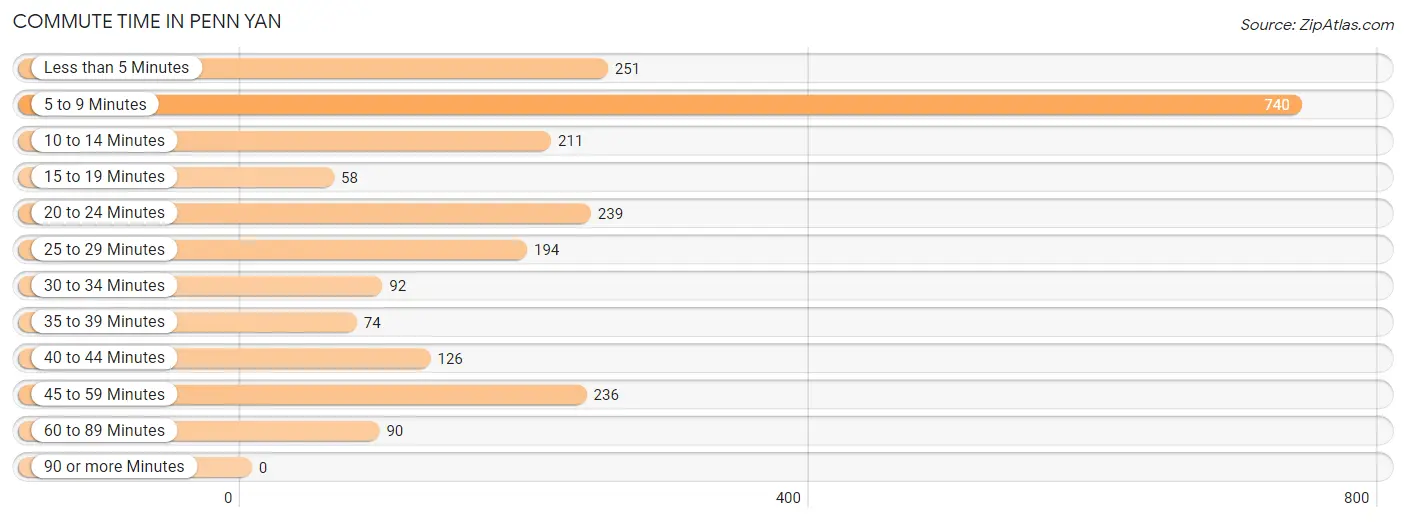
| Commute Time | # Commuters | % Commuters |
| Less than 5 Minutes | 251 | 10.9% |
| 5 to 9 Minutes | 740 | 32.0% |
| 10 to 14 Minutes | 211 | 9.1% |
| 15 to 19 Minutes | 58 | 2.5% |
| 20 to 24 Minutes | 239 | 10.3% |
| 25 to 29 Minutes | 194 | 8.4% |
| 30 to 34 Minutes | 92 | 4.0% |
| 35 to 39 Minutes | 74 | 3.2% |
| 40 to 44 Minutes | 126 | 5.4% |
| 45 to 59 Minutes | 236 | 10.2% |
| 60 to 89 Minutes | 90 | 3.9% |
| 90 or more Minutes | 0 | 0.0% |
Commute Time by Sex in Penn Yan
The most common commute times in Penn Yan are 5 to 9 minutes (247 commuters, 22.3%) for males and 5 to 9 minutes (493 commuters, 41.0%) for females.
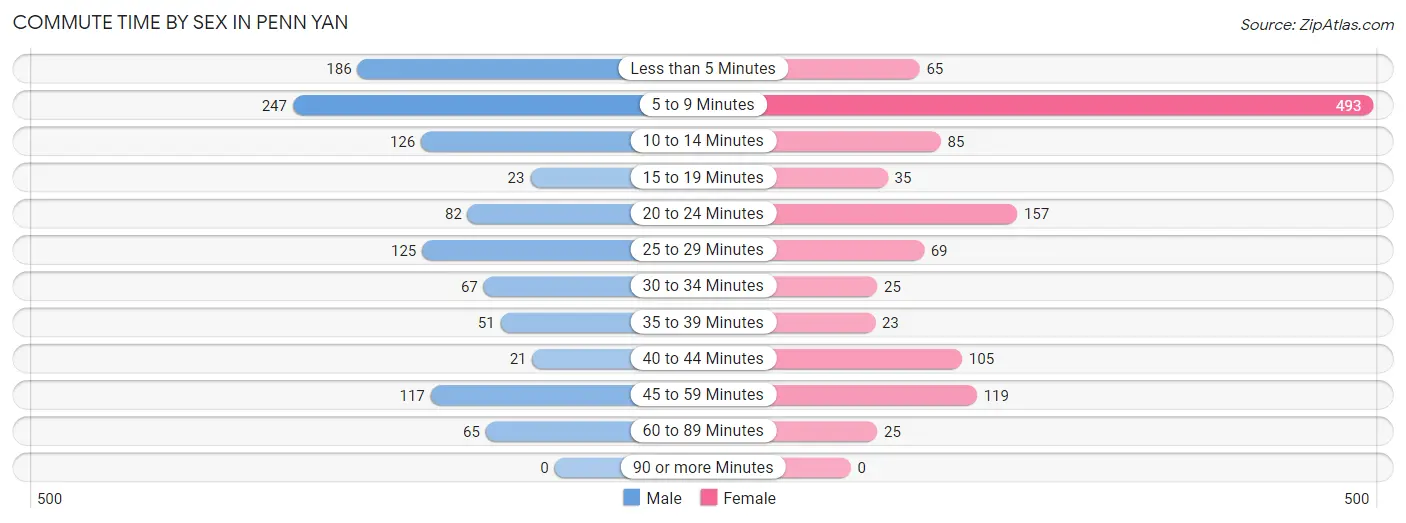
| Commute Time | Male | Female |
| Less than 5 Minutes | 186 (16.8%) | 65 (5.4%) |
| 5 to 9 Minutes | 247 (22.3%) | 493 (41.0%) |
| 10 to 14 Minutes | 126 (11.4%) | 85 (7.1%) |
| 15 to 19 Minutes | 23 (2.1%) | 35 (2.9%) |
| 20 to 24 Minutes | 82 (7.4%) | 157 (13.1%) |
| 25 to 29 Minutes | 125 (11.3%) | 69 (5.8%) |
| 30 to 34 Minutes | 67 (6.0%) | 25 (2.1%) |
| 35 to 39 Minutes | 51 (4.6%) | 23 (1.9%) |
| 40 to 44 Minutes | 21 (1.9%) | 105 (8.7%) |
| 45 to 59 Minutes | 117 (10.5%) | 119 (9.9%) |
| 60 to 89 Minutes | 65 (5.9%) | 25 (2.1%) |
| 90 or more Minutes | 0 (0.0%) | 0 (0.0%) |
Time of Departure to Work by Sex in Penn Yan
The most frequent times of departure to work in Penn Yan are 7:00 AM to 7:29 AM (221, 19.9%) for males and 7:00 AM to 7:29 AM (383, 31.9%) for females.
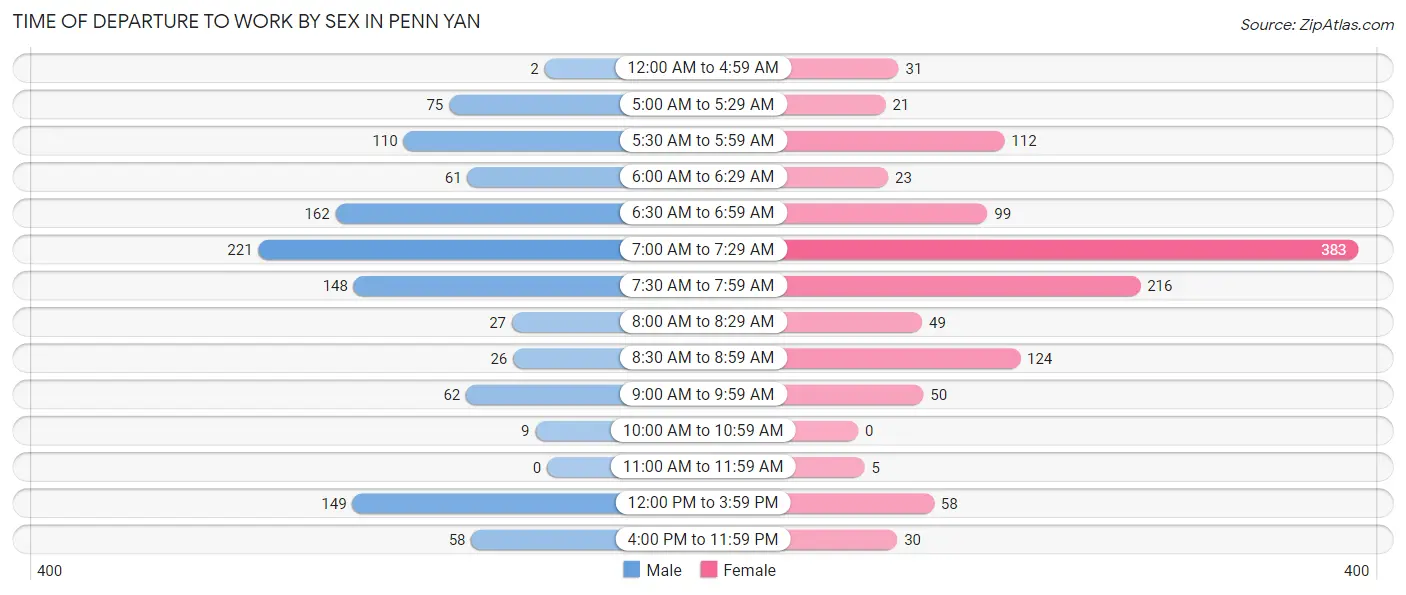
| Time of Departure | Male | Female |
| 12:00 AM to 4:59 AM | 2 (0.2%) | 31 (2.6%) |
| 5:00 AM to 5:29 AM | 75 (6.8%) | 21 (1.8%) |
| 5:30 AM to 5:59 AM | 110 (9.9%) | 112 (9.3%) |
| 6:00 AM to 6:29 AM | 61 (5.5%) | 23 (1.9%) |
| 6:30 AM to 6:59 AM | 162 (14.6%) | 99 (8.2%) |
| 7:00 AM to 7:29 AM | 221 (19.9%) | 383 (31.9%) |
| 7:30 AM to 7:59 AM | 148 (13.3%) | 216 (18.0%) |
| 8:00 AM to 8:29 AM | 27 (2.4%) | 49 (4.1%) |
| 8:30 AM to 8:59 AM | 26 (2.3%) | 124 (10.3%) |
| 9:00 AM to 9:59 AM | 62 (5.6%) | 50 (4.2%) |
| 10:00 AM to 10:59 AM | 9 (0.8%) | 0 (0.0%) |
| 11:00 AM to 11:59 AM | 0 (0.0%) | 5 (0.4%) |
| 12:00 PM to 3:59 PM | 149 (13.4%) | 58 (4.8%) |
| 4:00 PM to 11:59 PM | 58 (5.2%) | 30 (2.5%) |
| Total | 1,110 (100.0%) | 1,201 (100.0%) |
Housing Occupancy in Penn Yan
Occupancy by Ownership in Penn Yan
Of the total 2,236 dwellings in Penn Yan, owner-occupied units account for 1,324 (59.2%), while renter-occupied units make up 912 (40.8%).
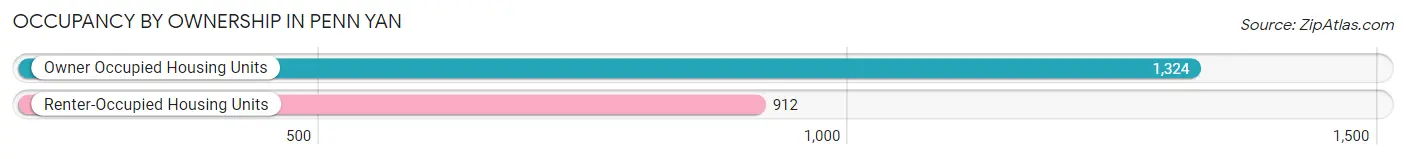
| Occupancy | # Housing Units | % Housing Units |
| Owner Occupied Housing Units | 1,324 | 59.2% |
| Renter-Occupied Housing Units | 912 | 40.8% |
| Total Occupied Housing Units | 2,236 | 100.0% |
Occupancy by Household Size in Penn Yan
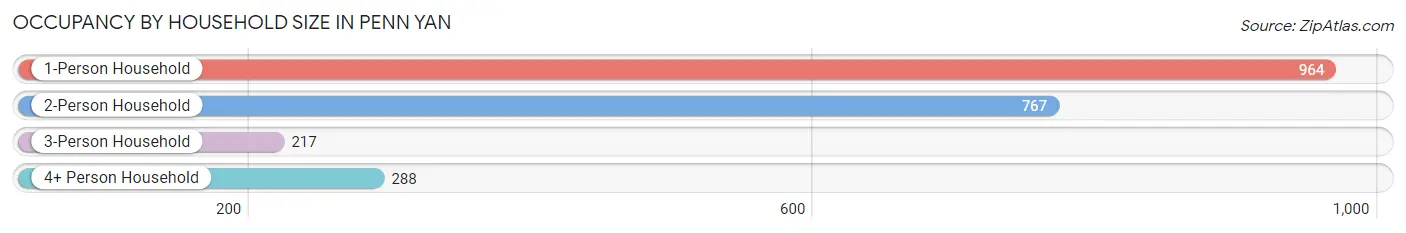
| Household Size | # Housing Units | % Housing Units |
| 1-Person Household | 964 | 43.1% |
| 2-Person Household | 767 | 34.3% |
| 3-Person Household | 217 | 9.7% |
| 4+ Person Household | 288 | 12.9% |
| Total Housing Units | 2,236 | 100.0% |
Occupancy by Ownership by Household Size in Penn Yan
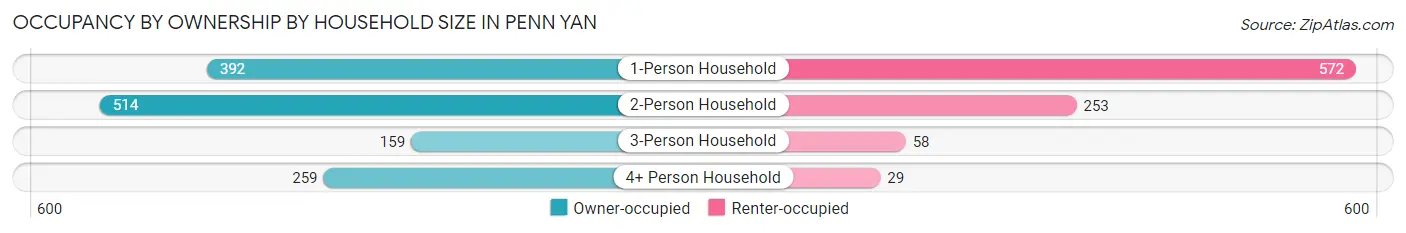
| Household Size | Owner-occupied | Renter-occupied |
| 1-Person Household | 392 (40.7%) | 572 (59.3%) |
| 2-Person Household | 514 (67.0%) | 253 (33.0%) |
| 3-Person Household | 159 (73.3%) | 58 (26.7%) |
| 4+ Person Household | 259 (89.9%) | 29 (10.1%) |
| Total Housing Units | 1,324 (59.2%) | 912 (40.8%) |
Occupancy by Educational Attainment in Penn Yan
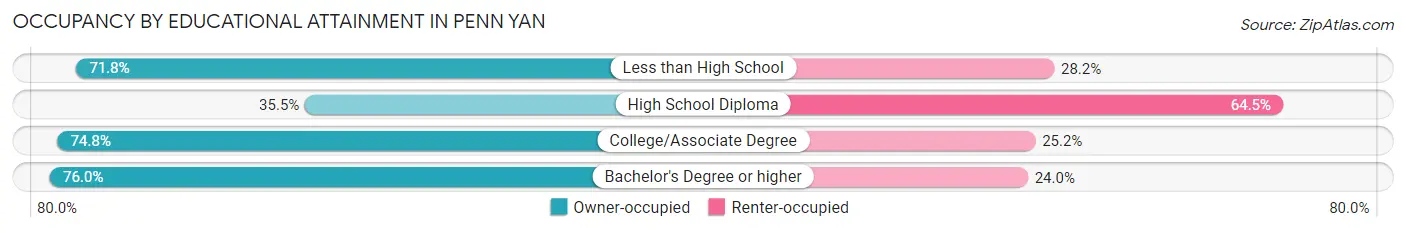
| Household Size | Owner-occupied | Renter-occupied |
| Less than High School | 112 (71.8%) | 44 (28.2%) |
| High School Diploma | 317 (35.5%) | 576 (64.5%) |
| College/Associate Degree | 418 (74.8%) | 141 (25.2%) |
| Bachelor's Degree or higher | 477 (76.0%) | 151 (24.0%) |
Occupancy by Age of Householder in Penn Yan
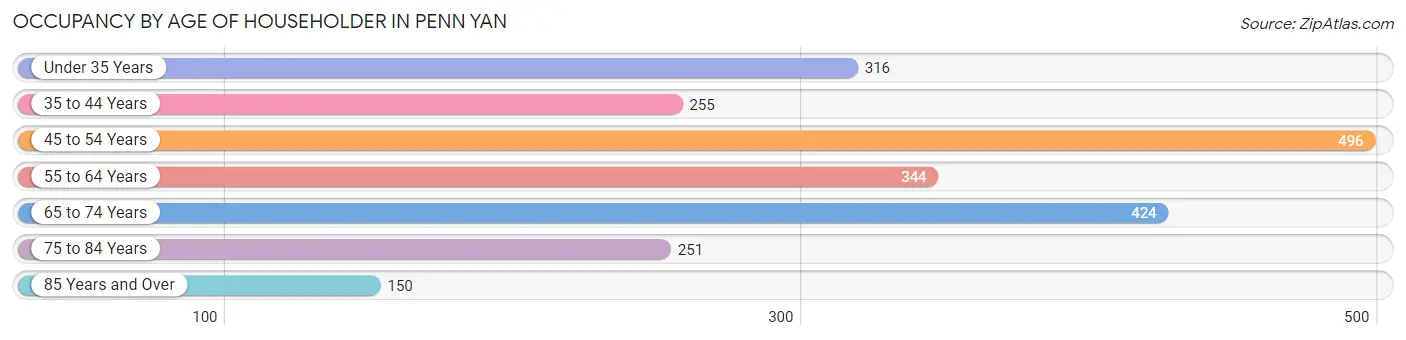
| Age Bracket | # Households | % Households |
| Under 35 Years | 316 | 14.1% |
| 35 to 44 Years | 255 | 11.4% |
| 45 to 54 Years | 496 | 22.2% |
| 55 to 64 Years | 344 | 15.4% |
| 65 to 74 Years | 424 | 19.0% |
| 75 to 84 Years | 251 | 11.2% |
| 85 Years and Over | 150 | 6.7% |
| Total | 2,236 | 100.0% |
Housing Finances in Penn Yan
Median Income by Occupancy in Penn Yan
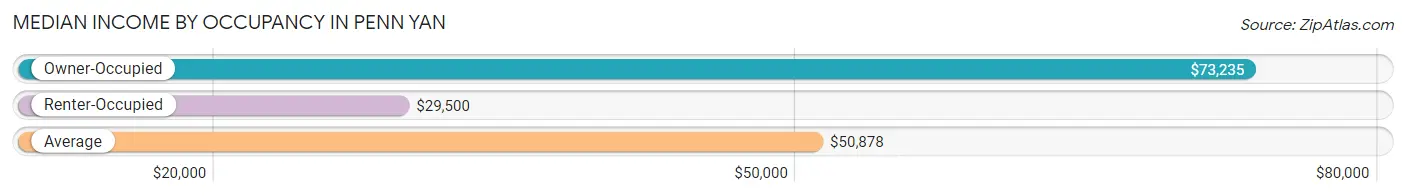
| Occupancy Type | # Households | Median Income |
| Owner-Occupied | 1,324 (59.2%) | $73,235 |
| Renter-Occupied | 912 (40.8%) | $29,500 |
| Average | 2,236 (100.0%) | $50,878 |
Occupancy by Householder Income Bracket in Penn Yan
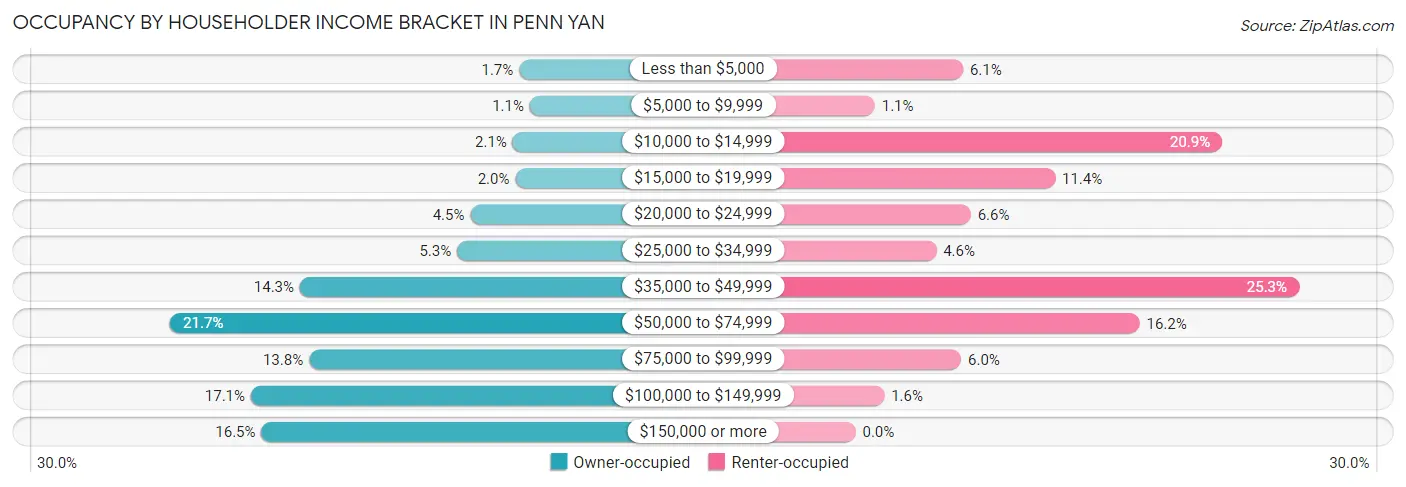
| Income Bracket | Owner-occupied | Renter-occupied |
| Less than $5,000 | 23 (1.7%) | 56 (6.1%) |
| $5,000 to $9,999 | 15 (1.1%) | 10 (1.1%) |
| $10,000 to $14,999 | 28 (2.1%) | 191 (20.9%) |
| $15,000 to $19,999 | 26 (2.0%) | 104 (11.4%) |
| $20,000 to $24,999 | 60 (4.5%) | 60 (6.6%) |
| $25,000 to $34,999 | 70 (5.3%) | 42 (4.6%) |
| $35,000 to $49,999 | 189 (14.3%) | 231 (25.3%) |
| $50,000 to $74,999 | 287 (21.7%) | 148 (16.2%) |
| $75,000 to $99,999 | 182 (13.8%) | 55 (6.0%) |
| $100,000 to $149,999 | 226 (17.1%) | 15 (1.6%) |
| $150,000 or more | 218 (16.5%) | 0 (0.0%) |
| Total | 1,324 (100.0%) | 912 (100.0%) |
Monthly Housing Cost Tiers in Penn Yan
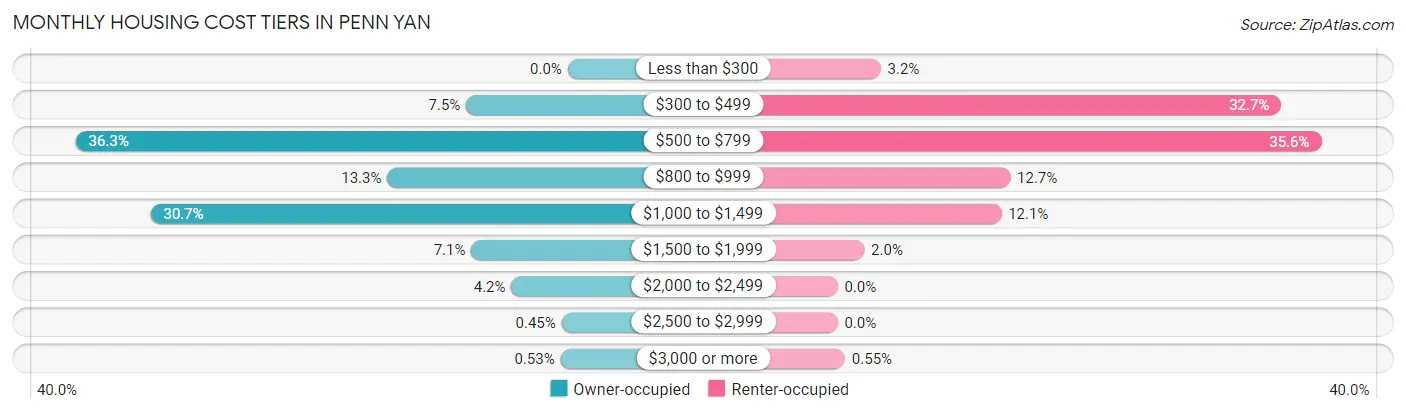
| Monthly Cost | Owner-occupied | Renter-occupied |
| Less than $300 | 0 (0.0%) | 29 (3.2%) |
| $300 to $499 | 99 (7.5%) | 298 (32.7%) |
| $500 to $799 | 480 (36.2%) | 325 (35.6%) |
| $800 to $999 | 176 (13.3%) | 116 (12.7%) |
| $1,000 to $1,499 | 407 (30.7%) | 110 (12.1%) |
| $1,500 to $1,999 | 94 (7.1%) | 18 (2.0%) |
| $2,000 to $2,499 | 55 (4.2%) | 0 (0.0%) |
| $2,500 to $2,999 | 6 (0.4%) | 0 (0.0%) |
| $3,000 or more | 7 (0.5%) | 5 (0.5%) |
| Total | 1,324 (100.0%) | 912 (100.0%) |
Physical Housing Characteristics in Penn Yan
Housing Structures in Penn Yan
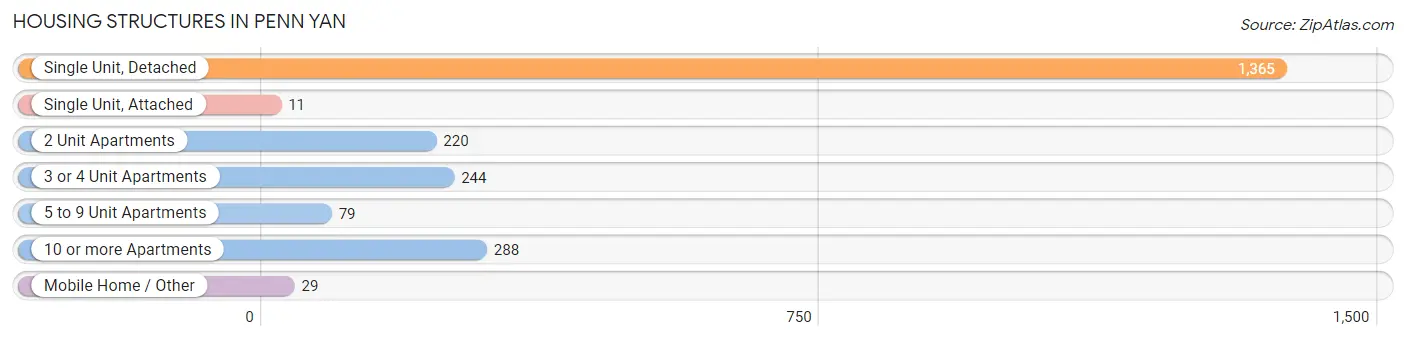
| Structure Type | # Housing Units | % Housing Units |
| Single Unit, Detached | 1,365 | 61.1% |
| Single Unit, Attached | 11 | 0.5% |
| 2 Unit Apartments | 220 | 9.8% |
| 3 or 4 Unit Apartments | 244 | 10.9% |
| 5 to 9 Unit Apartments | 79 | 3.5% |
| 10 or more Apartments | 288 | 12.9% |
| Mobile Home / Other | 29 | 1.3% |
| Total | 2,236 | 100.0% |
Housing Structures by Occupancy in Penn Yan
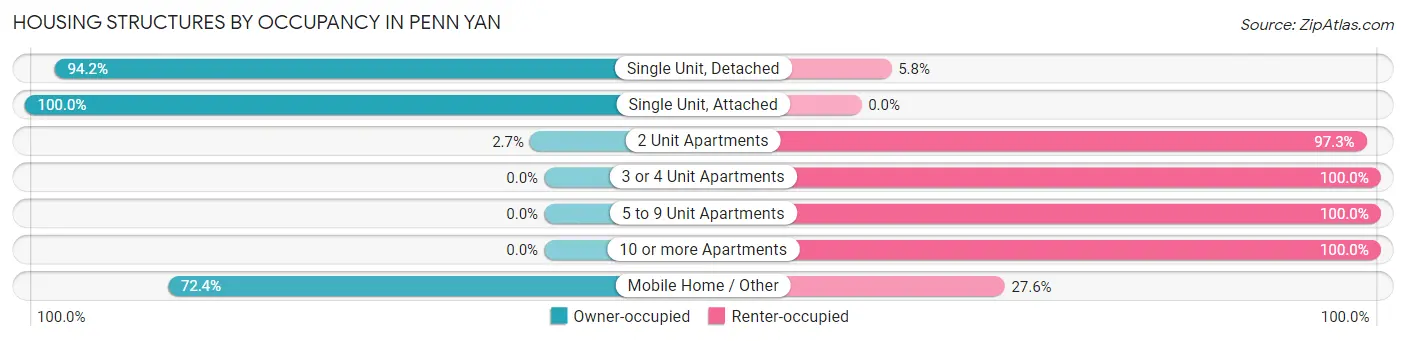
| Structure Type | Owner-occupied | Renter-occupied |
| Single Unit, Detached | 1,286 (94.2%) | 79 (5.8%) |
| Single Unit, Attached | 11 (100.0%) | 0 (0.0%) |
| 2 Unit Apartments | 6 (2.7%) | 214 (97.3%) |
| 3 or 4 Unit Apartments | 0 (0.0%) | 244 (100.0%) |
| 5 to 9 Unit Apartments | 0 (0.0%) | 79 (100.0%) |
| 10 or more Apartments | 0 (0.0%) | 288 (100.0%) |
| Mobile Home / Other | 21 (72.4%) | 8 (27.6%) |
| Total | 1,324 (59.2%) | 912 (40.8%) |
Housing Structures by Number of Rooms in Penn Yan
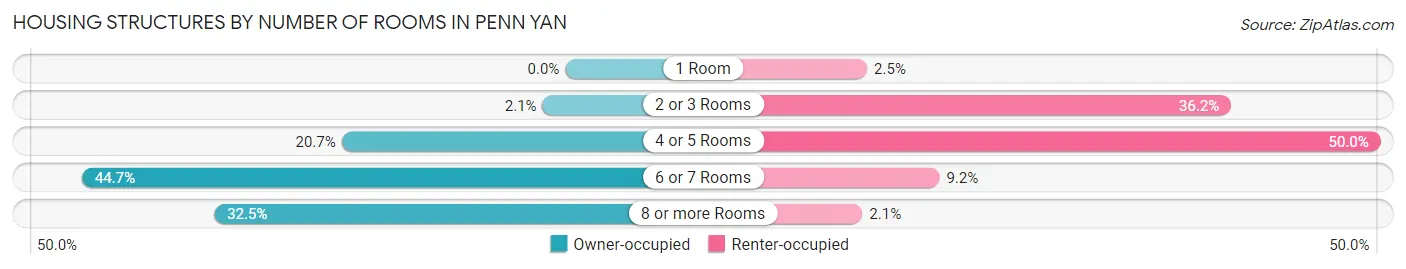
| Number of Rooms | Owner-occupied | Renter-occupied |
| 1 Room | 0 (0.0%) | 23 (2.5%) |
| 2 or 3 Rooms | 28 (2.1%) | 330 (36.2%) |
| 4 or 5 Rooms | 274 (20.7%) | 456 (50.0%) |
| 6 or 7 Rooms | 592 (44.7%) | 84 (9.2%) |
| 8 or more Rooms | 430 (32.5%) | 19 (2.1%) |
| Total | 1,324 (100.0%) | 912 (100.0%) |
Housing Structure by Heating Type in Penn Yan
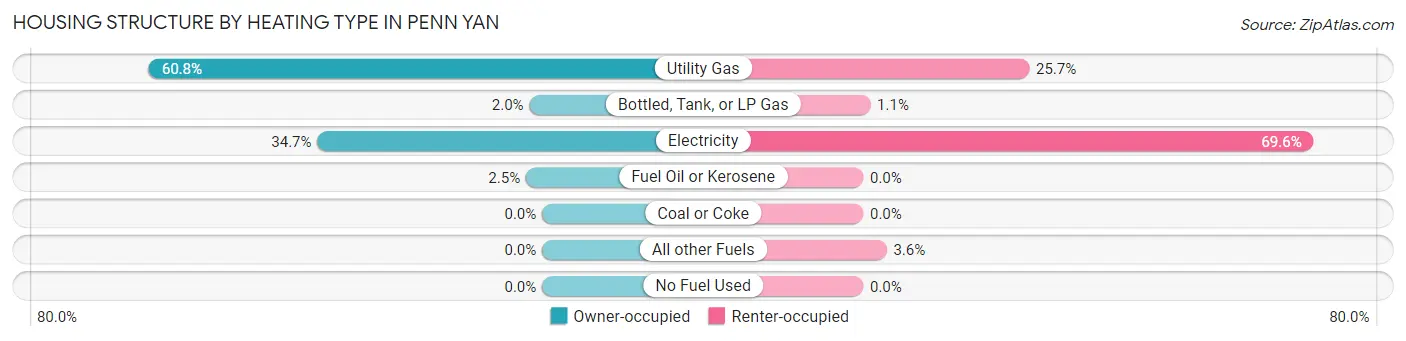
| Heating Type | Owner-occupied | Renter-occupied |
| Utility Gas | 805 (60.8%) | 234 (25.7%) |
| Bottled, Tank, or LP Gas | 26 (2.0%) | 10 (1.1%) |
| Electricity | 460 (34.7%) | 635 (69.6%) |
| Fuel Oil or Kerosene | 33 (2.5%) | 0 (0.0%) |
| Coal or Coke | 0 (0.0%) | 0 (0.0%) |
| All other Fuels | 0 (0.0%) | 33 (3.6%) |
| No Fuel Used | 0 (0.0%) | 0 (0.0%) |
| Total | 1,324 (100.0%) | 912 (100.0%) |
Household Vehicle Usage in Penn Yan
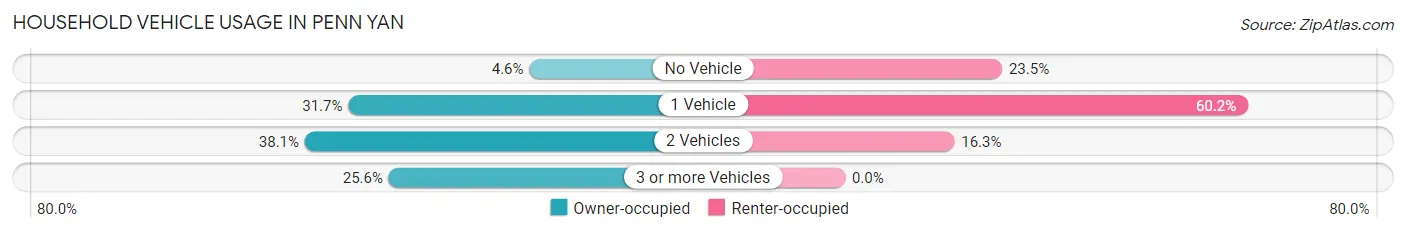
| Vehicles per Household | Owner-occupied | Renter-occupied |
| No Vehicle | 61 (4.6%) | 214 (23.5%) |
| 1 Vehicle | 419 (31.7%) | 549 (60.2%) |
| 2 Vehicles | 505 (38.1%) | 149 (16.3%) |
| 3 or more Vehicles | 339 (25.6%) | 0 (0.0%) |
| Total | 1,324 (100.0%) | 912 (100.0%) |
Real Estate & Mortgages in Penn Yan
Real Estate and Mortgage Overview in Penn Yan
| Characteristic | Without Mortgage | With Mortgage |
| Housing Units | 586 | 738 |
| Median Property Value | $150,000 | $128,500 |
| Median Household Income | $70,000 | $130 |
| Monthly Housing Costs | $648 | $7 |
| Real Estate Taxes | $3,379 | $85 |
Property Value by Mortgage Status in Penn Yan
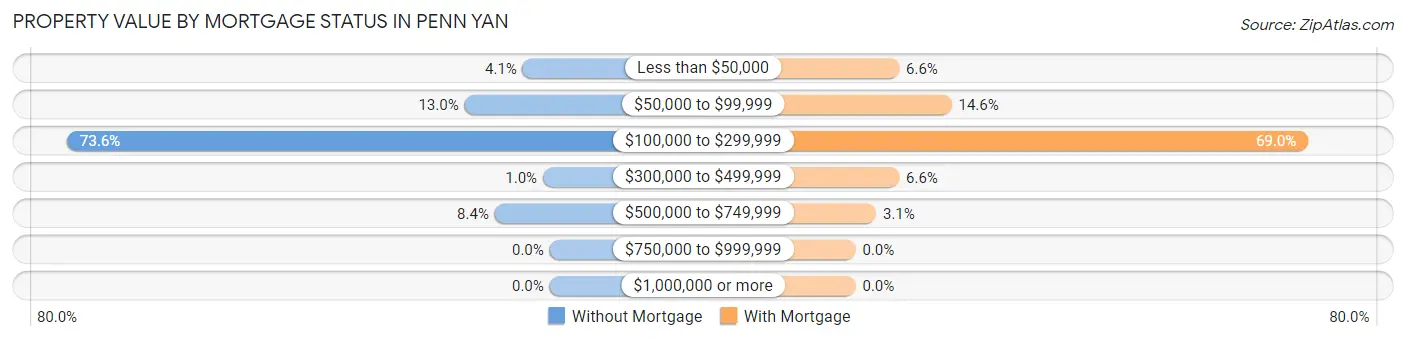
| Property Value | Without Mortgage | With Mortgage |
| Less than $50,000 | 24 (4.1%) | 49 (6.6%) |
| $50,000 to $99,999 | 76 (13.0%) | 108 (14.6%) |
| $100,000 to $299,999 | 431 (73.6%) | 509 (69.0%) |
| $300,000 to $499,999 | 6 (1.0%) | 49 (6.6%) |
| $500,000 to $749,999 | 49 (8.4%) | 23 (3.1%) |
| $750,000 to $999,999 | 0 (0.0%) | 0 (0.0%) |
| $1,000,000 or more | 0 (0.0%) | 0 (0.0%) |
| Total | 586 (100.0%) | 738 (100.0%) |
Household Income by Mortgage Status in Penn Yan
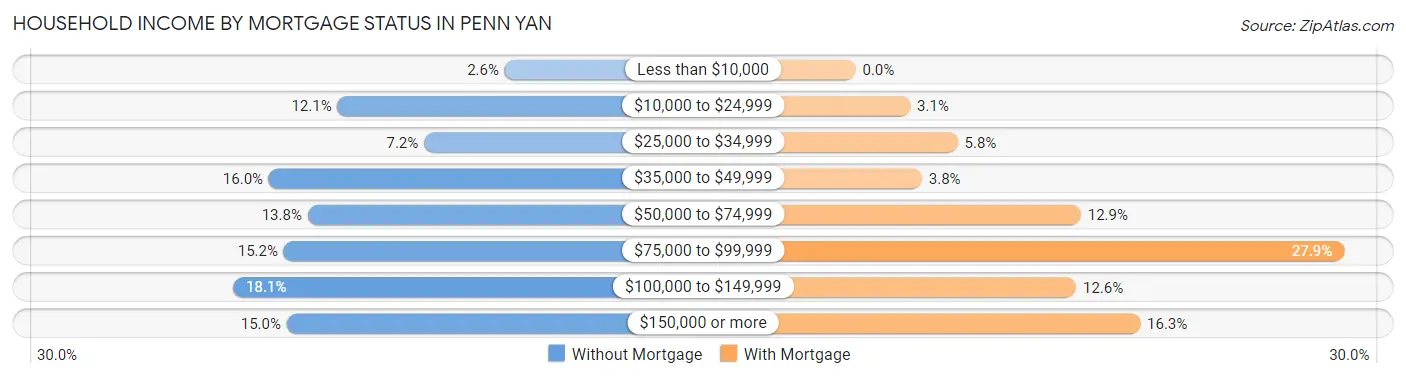
| Household Income | Without Mortgage | With Mortgage |
| Less than $10,000 | 15 (2.6%) | 0 (0.0%) |
| $10,000 to $24,999 | 71 (12.1%) | 23 (3.1%) |
| $25,000 to $34,999 | 42 (7.2%) | 43 (5.8%) |
| $35,000 to $49,999 | 94 (16.0%) | 28 (3.8%) |
| $50,000 to $74,999 | 81 (13.8%) | 95 (12.9%) |
| $75,000 to $99,999 | 89 (15.2%) | 206 (27.9%) |
| $100,000 to $149,999 | 106 (18.1%) | 93 (12.6%) |
| $150,000 or more | 88 (15.0%) | 120 (16.3%) |
| Total | 586 (100.0%) | 738 (100.0%) |
Property Value to Household Income Ratio in Penn Yan
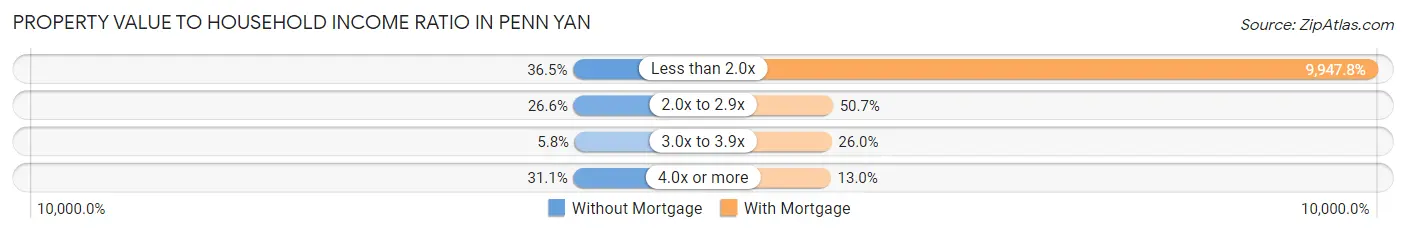
| Value-to-Income Ratio | Without Mortgage | With Mortgage |
| Less than 2.0x | 214 (36.5%) | 73,415 (9,947.8%) |
| 2.0x to 2.9x | 156 (26.6%) | 374 (50.7%) |
| 3.0x to 3.9x | 34 (5.8%) | 192 (26.0%) |
| 4.0x or more | 182 (31.1%) | 96 (13.0%) |
| Total | 586 (100.0%) | 738 (100.0%) |
Real Estate Taxes by Mortgage Status in Penn Yan
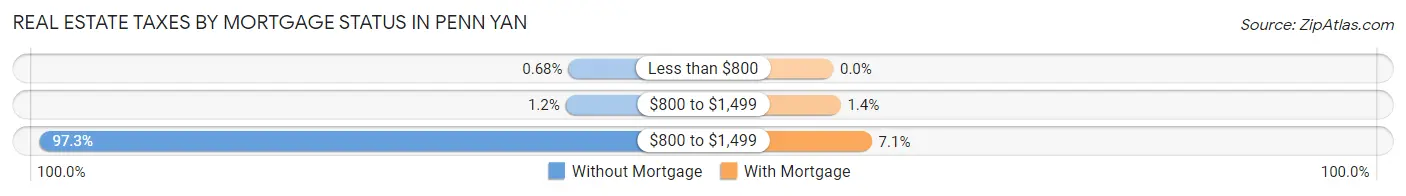
| Property Taxes | Without Mortgage | With Mortgage |
| Less than $800 | 4 (0.7%) | 0 (0.0%) |
| $800 to $1,499 | 7 (1.2%) | 10 (1.4%) |
| $800 to $1,499 | 570 (97.3%) | 52 (7.0%) |
| Total | 586 (100.0%) | 738 (100.0%) |
Health & Disability in Penn Yan
Health Insurance Coverage by Age in Penn Yan
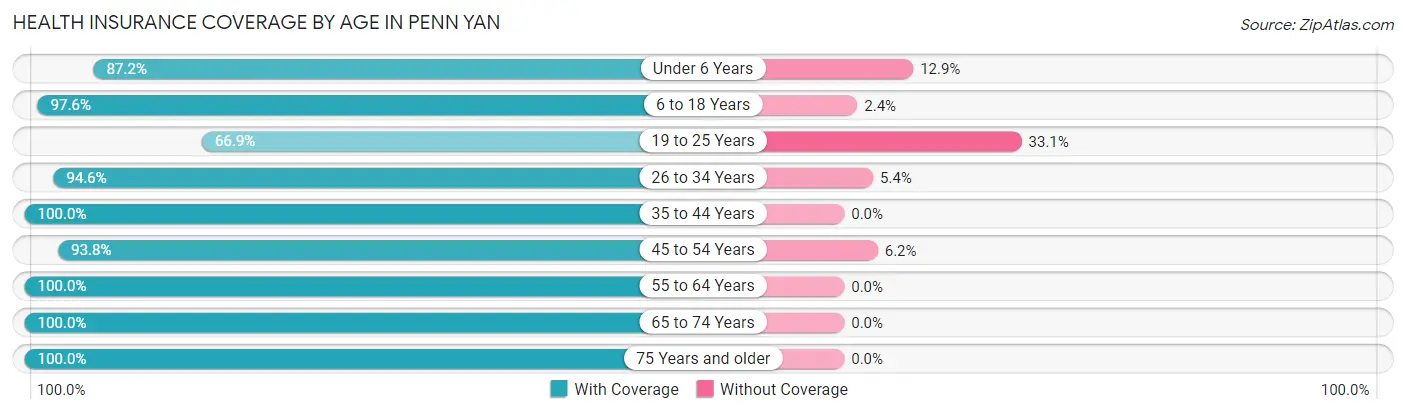
| Age Bracket | With Coverage | Without Coverage |
| Under 6 Years | 251 (87.2%) | 37 (12.9%) |
| 6 to 18 Years | 523 (97.6%) | 13 (2.4%) |
| 19 to 25 Years | 334 (66.9%) | 165 (33.1%) |
| 26 to 34 Years | 582 (94.6%) | 33 (5.4%) |
| 35 to 44 Years | 390 (100.0%) | 0 (0.0%) |
| 45 to 54 Years | 796 (93.8%) | 53 (6.2%) |
| 55 to 64 Years | 537 (100.0%) | 0 (0.0%) |
| 65 to 74 Years | 630 (100.0%) | 0 (0.0%) |
| 75 Years and older | 526 (100.0%) | 0 (0.0%) |
| Total | 4,569 (93.8%) | 301 (6.2%) |
Health Insurance Coverage by Citizenship Status in Penn Yan
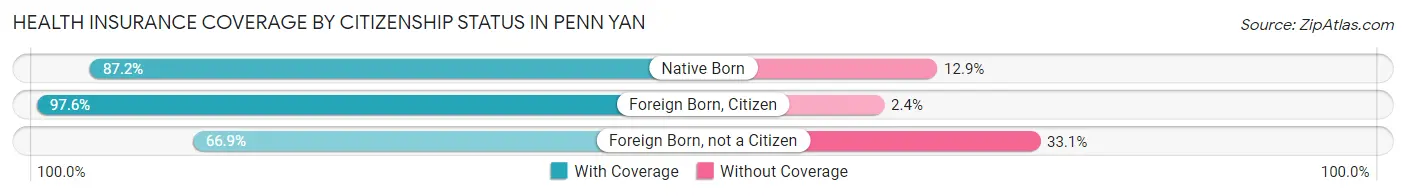
| Citizenship Status | With Coverage | Without Coverage |
| Native Born | 251 (87.2%) | 37 (12.9%) |
| Foreign Born, Citizen | 523 (97.6%) | 13 (2.4%) |
| Foreign Born, not a Citizen | 334 (66.9%) | 165 (33.1%) |
Health Insurance Coverage by Household Income in Penn Yan
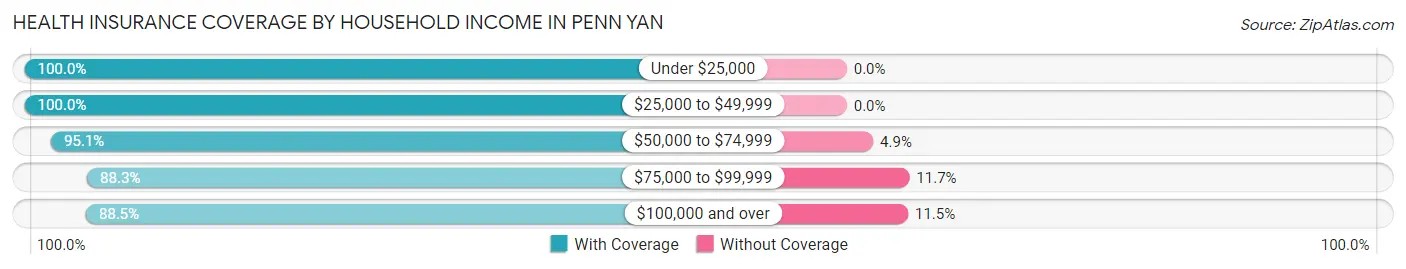
| Household Income | With Coverage | Without Coverage |
| Under $25,000 | 765 (100.0%) | 0 (0.0%) |
| $25,000 to $49,999 | 954 (100.0%) | 0 (0.0%) |
| $50,000 to $74,999 | 847 (95.1%) | 44 (4.9%) |
| $75,000 to $99,999 | 587 (88.3%) | 78 (11.7%) |
| $100,000 and over | 1,380 (88.5%) | 179 (11.5%) |
Public vs Private Health Insurance Coverage by Age in Penn Yan
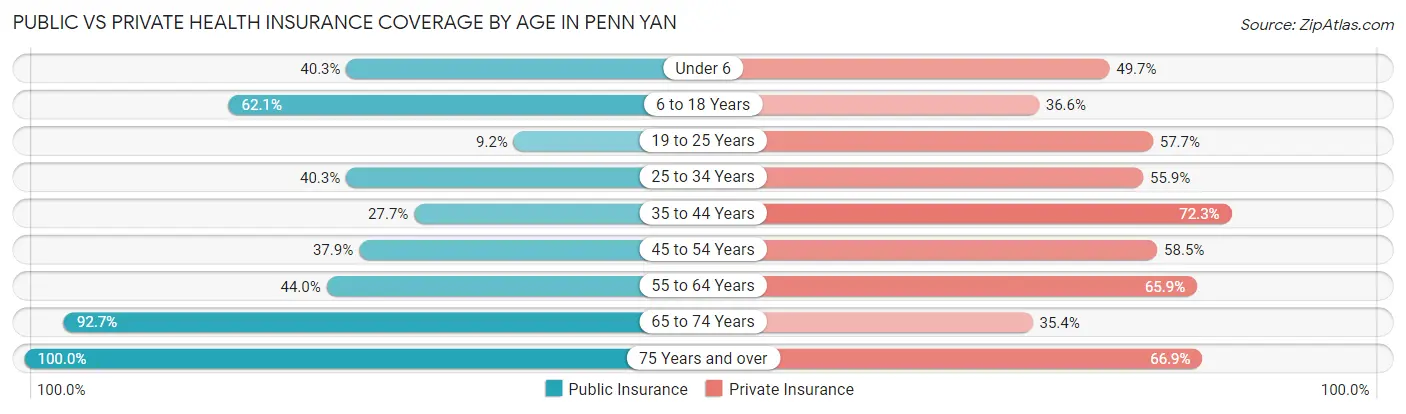
| Age Bracket | Public Insurance | Private Insurance |
| Under 6 | 116 (40.3%) | 143 (49.6%) |
| 6 to 18 Years | 333 (62.1%) | 196 (36.6%) |
| 19 to 25 Years | 46 (9.2%) | 288 (57.7%) |
| 25 to 34 Years | 248 (40.3%) | 344 (55.9%) |
| 35 to 44 Years | 108 (27.7%) | 282 (72.3%) |
| 45 to 54 Years | 322 (37.9%) | 497 (58.5%) |
| 55 to 64 Years | 236 (44.0%) | 354 (65.9%) |
| 65 to 74 Years | 584 (92.7%) | 223 (35.4%) |
| 75 Years and over | 526 (100.0%) | 352 (66.9%) |
| Total | 2,519 (51.7%) | 2,679 (55.0%) |
Disability Status by Sex by Age in Penn Yan
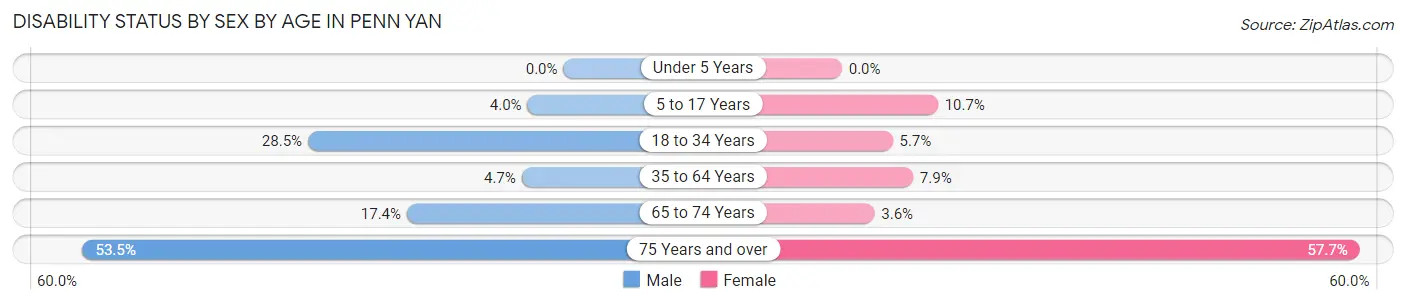
| Age Bracket | Male | Female |
| Under 5 Years | 0 (0.0%) | 0 (0.0%) |
| 5 to 17 Years | 8 (4.0%) | 36 (10.7%) |
| 18 to 34 Years | 134 (28.4%) | 37 (5.7%) |
| 35 to 64 Years | 35 (4.6%) | 81 (7.9%) |
| 65 to 74 Years | 57 (17.4%) | 11 (3.6%) |
| 75 Years and over | 121 (53.5%) | 173 (57.7%) |
Disability Class by Sex by Age in Penn Yan
Disability Class: Hearing Difficulty
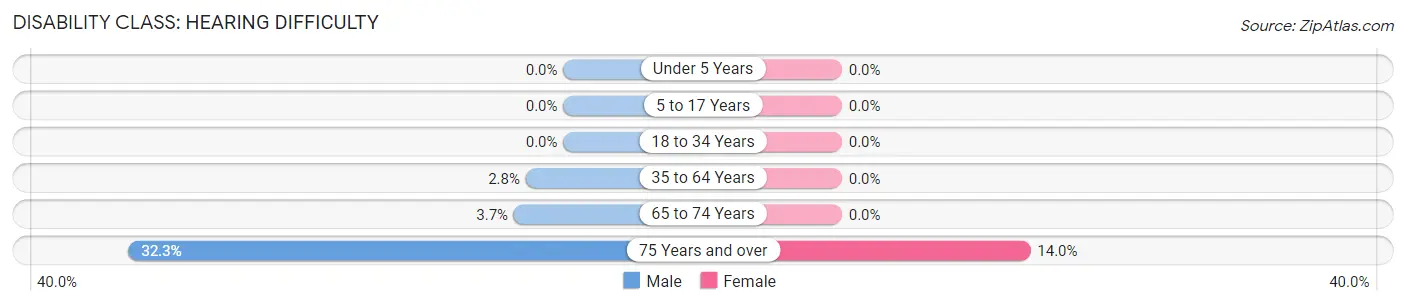
| Age Bracket | Male | Female |
| Under 5 Years | 0 (0.0%) | 0 (0.0%) |
| 5 to 17 Years | 0 (0.0%) | 0 (0.0%) |
| 18 to 34 Years | 0 (0.0%) | 0 (0.0%) |
| 35 to 64 Years | 21 (2.8%) | 0 (0.0%) |
| 65 to 74 Years | 12 (3.7%) | 0 (0.0%) |
| 75 Years and over | 73 (32.3%) | 42 (14.0%) |
Disability Class: Vision Difficulty
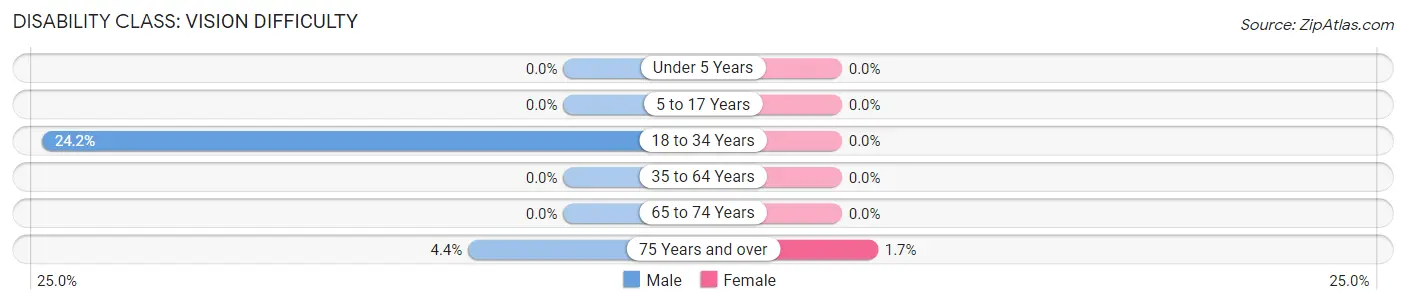
| Age Bracket | Male | Female |
| Under 5 Years | 0 (0.0%) | 0 (0.0%) |
| 5 to 17 Years | 0 (0.0%) | 0 (0.0%) |
| 18 to 34 Years | 114 (24.2%) | 0 (0.0%) |
| 35 to 64 Years | 0 (0.0%) | 0 (0.0%) |
| 65 to 74 Years | 0 (0.0%) | 0 (0.0%) |
| 75 Years and over | 10 (4.4%) | 5 (1.7%) |
Disability Class: Cognitive Difficulty
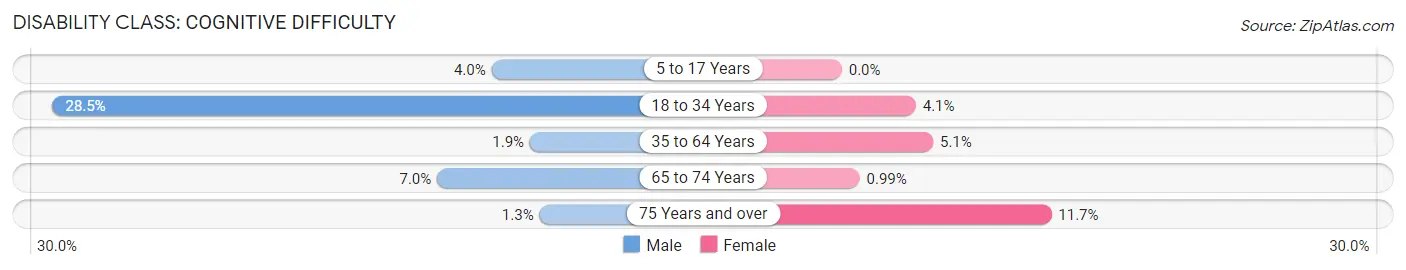
| Age Bracket | Male | Female |
| 5 to 17 Years | 8 (4.0%) | 0 (0.0%) |
| 18 to 34 Years | 134 (28.4%) | 27 (4.1%) |
| 35 to 64 Years | 14 (1.9%) | 52 (5.1%) |
| 65 to 74 Years | 23 (7.0%) | 3 (1.0%) |
| 75 Years and over | 3 (1.3%) | 35 (11.7%) |
Disability Class: Ambulatory Difficulty
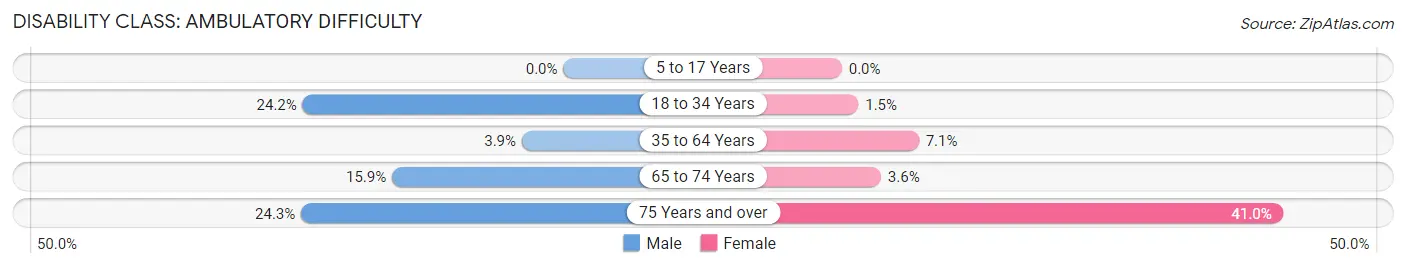
| Age Bracket | Male | Female |
| 5 to 17 Years | 0 (0.0%) | 0 (0.0%) |
| 18 to 34 Years | 114 (24.2%) | 10 (1.5%) |
| 35 to 64 Years | 29 (3.8%) | 73 (7.1%) |
| 65 to 74 Years | 52 (15.9%) | 11 (3.6%) |
| 75 Years and over | 55 (24.3%) | 123 (41.0%) |
Disability Class: Self-Care Difficulty
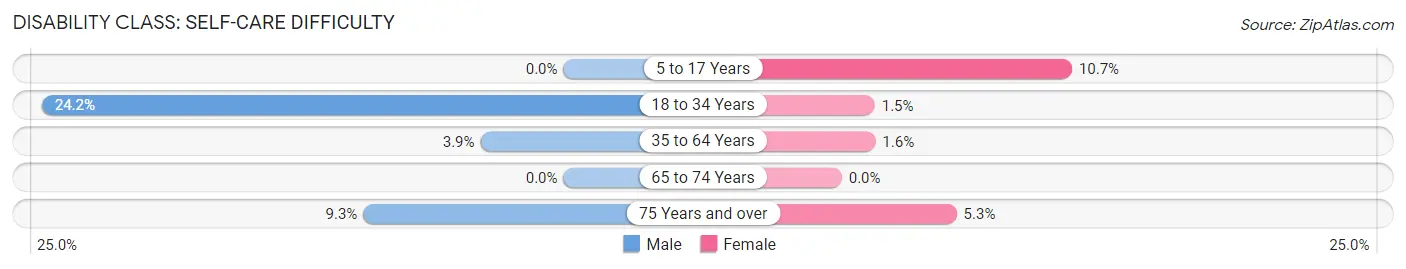
| Age Bracket | Male | Female |
| 5 to 17 Years | 0 (0.0%) | 36 (10.7%) |
| 18 to 34 Years | 114 (24.2%) | 10 (1.5%) |
| 35 to 64 Years | 29 (3.8%) | 16 (1.6%) |
| 65 to 74 Years | 0 (0.0%) | 0 (0.0%) |
| 75 Years and over | 21 (9.3%) | 16 (5.3%) |
Technology Access in Penn Yan
Computing Device Access in Penn Yan
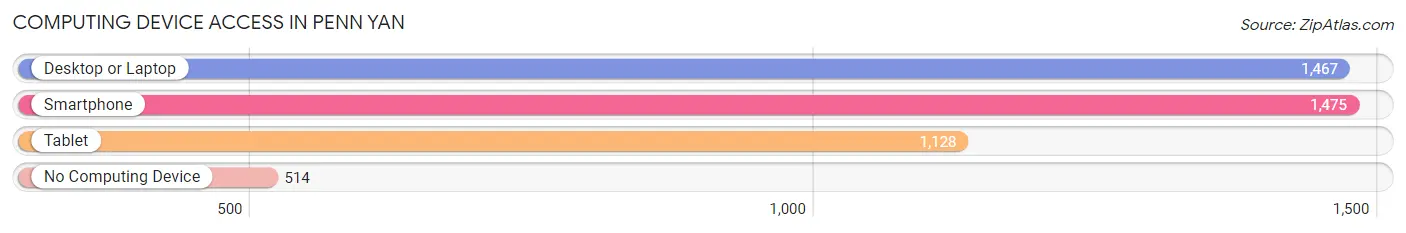
| Device Type | # Households | % Households |
| Desktop or Laptop | 1,467 | 65.6% |
| Smartphone | 1,475 | 66.0% |
| Tablet | 1,128 | 50.4% |
| No Computing Device | 514 | 23.0% |
| Total | 2,236 | 100.0% |
Internet Access in Penn Yan
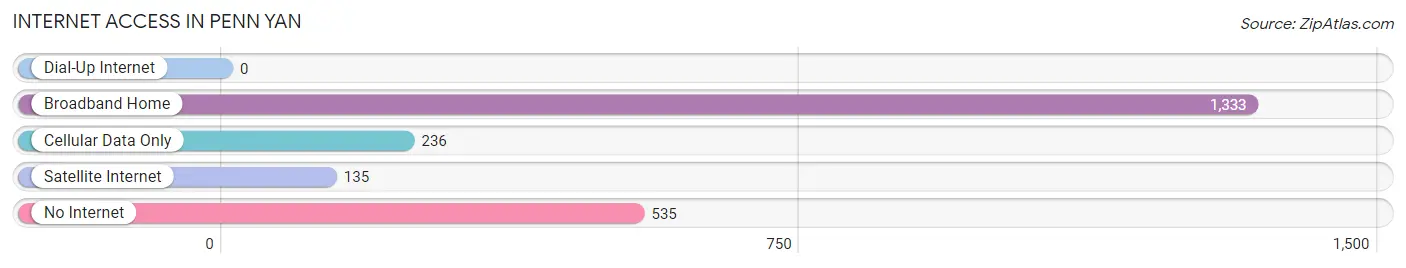
| Internet Type | # Households | % Households |
| Dial-Up Internet | 0 | 0.0% |
| Broadband Home | 1,333 | 59.6% |
| Cellular Data Only | 236 | 10.5% |
| Satellite Internet | 135 | 6.0% |
| No Internet | 535 | 23.9% |
| Total | 2,236 | 100.0% |
Penn Yan Summary
History
The village of Penn Yan, New York is located in the Finger Lakes region of the state. It is the county seat of Yates County and is situated on the eastern shore of Keuka Lake. The area was first settled in 1789 by Zebulon and Abigail Penn, who were Quakers from Pennsylvania. The village was incorporated in 1833 and was named after the Penns.
The village of Penn Yan has a long and rich history. It was an important stop on the Underground Railroad, and was home to many abolitionists. During the Civil War, the village was a major supplier of food and supplies to the Union Army. After the war, the village became an important center for the production of agricultural products, including apples, grapes, and dairy products.
The village was also an important center for the production of furniture and other wood products. In the late 19th century, the village was home to several large furniture factories, which employed hundreds of people. The village was also home to several large breweries, which produced beer and other alcoholic beverages.
Geography
Penn Yan is located in the Finger Lakes region of New York, on the eastern shore of Keuka Lake. The village is situated at the intersection of Routes 14A and 54A, and is about 30 miles south of Rochester. The village is surrounded by rolling hills and farmland, and is located in a valley between two large hills. The village is located at an elevation of 890 feet above sea level.
The climate in Penn Yan is generally mild, with cold winters and warm summers. The average annual temperature is around 50 degrees Fahrenheit. The average annual precipitation is around 40 inches.
Economy
The economy of Penn Yan is largely based on agriculture and tourism. The village is home to several wineries, which produce a variety of wines. The village is also home to several breweries, which produce beer and other alcoholic beverages.
The village is also home to several furniture factories, which produce a variety of furniture products. The village is also home to several retail stores, which sell a variety of goods.
Demographics
As of the 2010 census, the population of Penn Yan was 5,159. The racial makeup of the village was 95.3% White, 0.7% African American, 0.3% Native American, 0.7% Asian, 0.1% Pacific Islander, 1.2% from other races, and 1.7% from two or more races. Hispanic or Latino of any race were 3.2% of the population.
The median household income in Penn Yan was $37,917, and the median family income was $45,938. The per capita income was $20,945. About 11.3% of families and 14.2% of the population were below the poverty line, including 19.2% of those under age 18 and 8.2% of those age 65 or over.
Common Questions
What is Per Capita Income in Penn Yan?
Per Capita income in Penn Yan is $31,658.
What is the Median Family Income in Penn Yan?
Median Family Income in Penn Yan is $73,484.
What is the Median Household income in Penn Yan?
Median Household Income in Penn Yan is $50,878.
What is Income or Wage Gap in Penn Yan?
Income or Wage Gap in Penn Yan is 9.0%.
Women in Penn Yan earn 91.0 cents for every dollar earned by a man.
What is Inequality or Gini Index in Penn Yan?
Inequality or Gini Index in Penn Yan is 0.45.
What is the Total Population of Penn Yan?
Total Population of Penn Yan is 5,134.
What is the Total Male Population of Penn Yan?
Total Male Population of Penn Yan is 2,252.
What is the Total Female Population of Penn Yan?
Total Female Population of Penn Yan is 2,882.
What is the Ratio of Males per 100 Females in Penn Yan?
There are 78.14 Males per 100 Females in Penn Yan.
What is the Ratio of Females per 100 Males in Penn Yan?
There are 127.98 Females per 100 Males in Penn Yan.
What is the Median Population Age in Penn Yan?
Median Population Age in Penn Yan is 47.8 Years.
What is the Average Family Size in Penn Yan
Average Family Size in Penn Yan is 3.0 People.
What is the Average Household Size in Penn Yan
Average Household Size in Penn Yan is 2.2 People.
How Large is the Labor Force in Penn Yan?
There are 2,574 People in the Labor Forcein in Penn Yan.
What is the Percentage of People in the Labor Force in Penn Yan?
58.2% of People are in the Labor Force in Penn Yan.
What is the Unemployment Rate in Penn Yan?
Unemployment Rate in Penn Yan is 3.3%.