Suffern, NY Map & Demographics
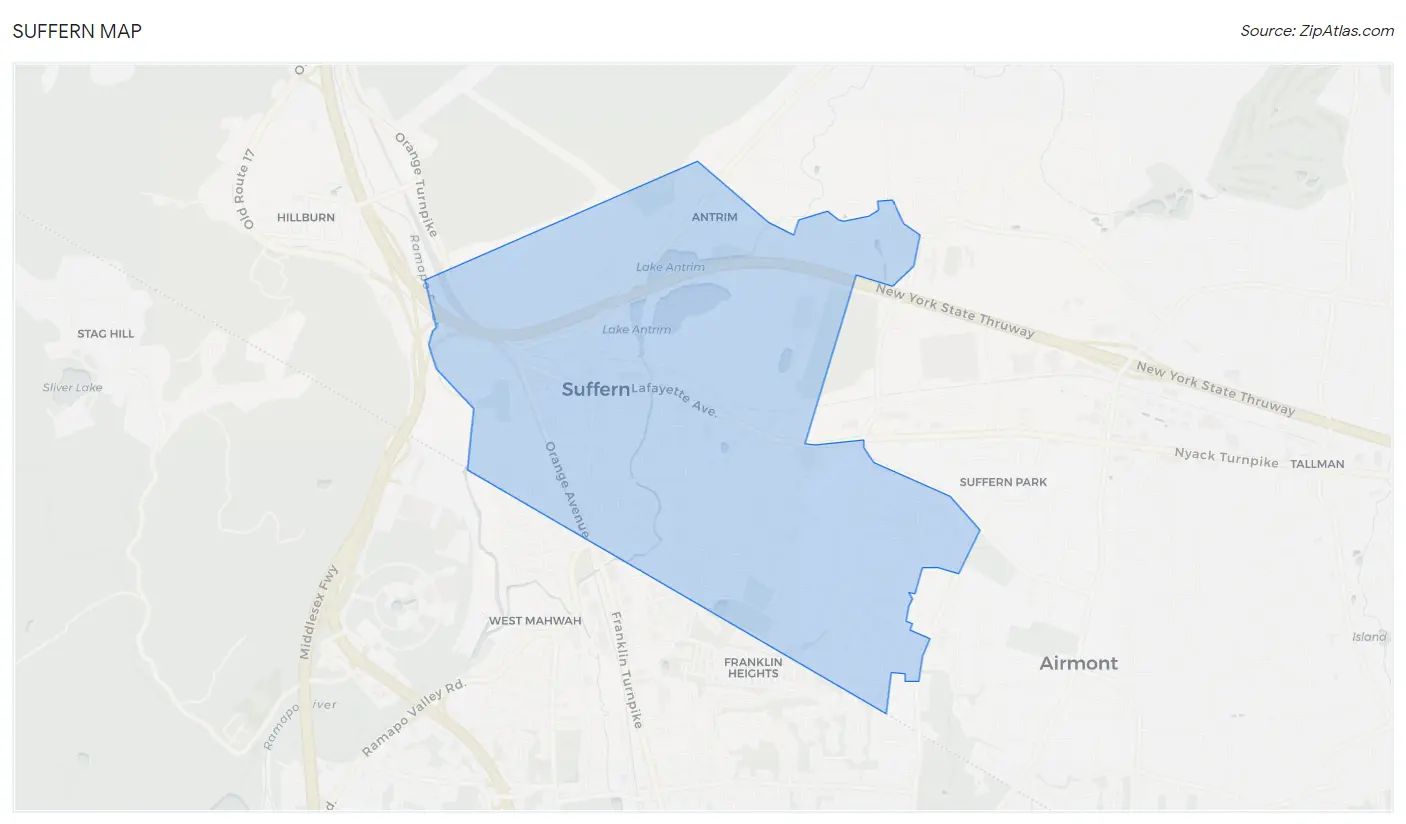
Suffern Map
Suffern Overview
$49,566
PER CAPITA INCOME
$128,993
AVG FAMILY INCOME
$94,688
AVG HOUSEHOLD INCOME
13.4%
WAGE / INCOME GAP [ % ]
86.6¢/ $1
WAGE / INCOME GAP [ $ ]
$13,679
FAMILY INCOME DEFICIT
0.43
INEQUALITY / GINI INDEX
11,376
TOTAL POPULATION
5,259
MALE POPULATION
6,117
FEMALE POPULATION
85.97
MALES / 100 FEMALES
116.31
FEMALES / 100 MALES
42.9
MEDIAN AGE
3.3
AVG FAMILY SIZE
2.4
AVG HOUSEHOLD SIZE
6,330
LABOR FORCE [ PEOPLE ]
67.4%
PERCENT IN LABOR FORCE
5.5%
UNEMPLOYMENT RATE
Suffern Zip Codes
Suffern Area Codes
Income in Suffern
Income Overview in Suffern
Per Capita Income in Suffern is $49,566, while median incomes of families and households are $128,993 and $94,688 respectively.
| Characteristic | Number | Measure |
| Per Capita Income | 11,376 | $49,566 |
| Median Family Income | 2,678 | $128,993 |
| Mean Family Income | 2,678 | $144,602 |
| Median Household Income | 4,663 | $94,688 |
| Mean Household Income | 4,663 | $116,715 |
| Income Deficit | 2,678 | $13,679 |
| Wage / Income Gap (%) | 11,376 | 13.42% |
| Wage / Income Gap ($) | 11,376 | 86.58¢ per $1 |
| Gini / Inequality Index | 11,376 | 0.43 |
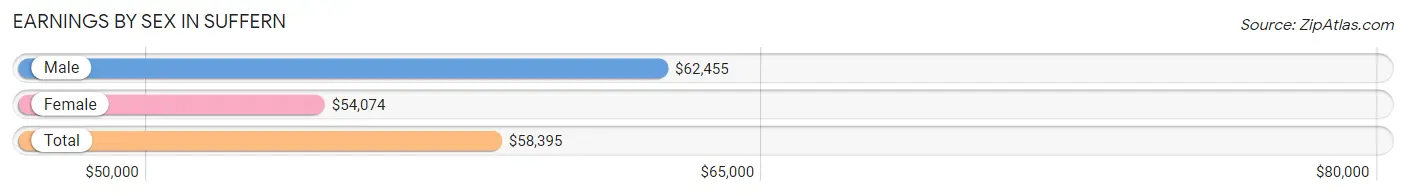
Earnings by Sex in Suffern
Average Earnings in Suffern are $58,395, $62,455 for men and $54,074 for women, a difference of 13.4%.
| Sex | Number | Average Earnings |
| Male | 3,042 (46.9%) | $62,455 |
| Female | 3,438 (53.1%) | $54,074 |
| Total | 6,480 (100.0%) | $58,395 |
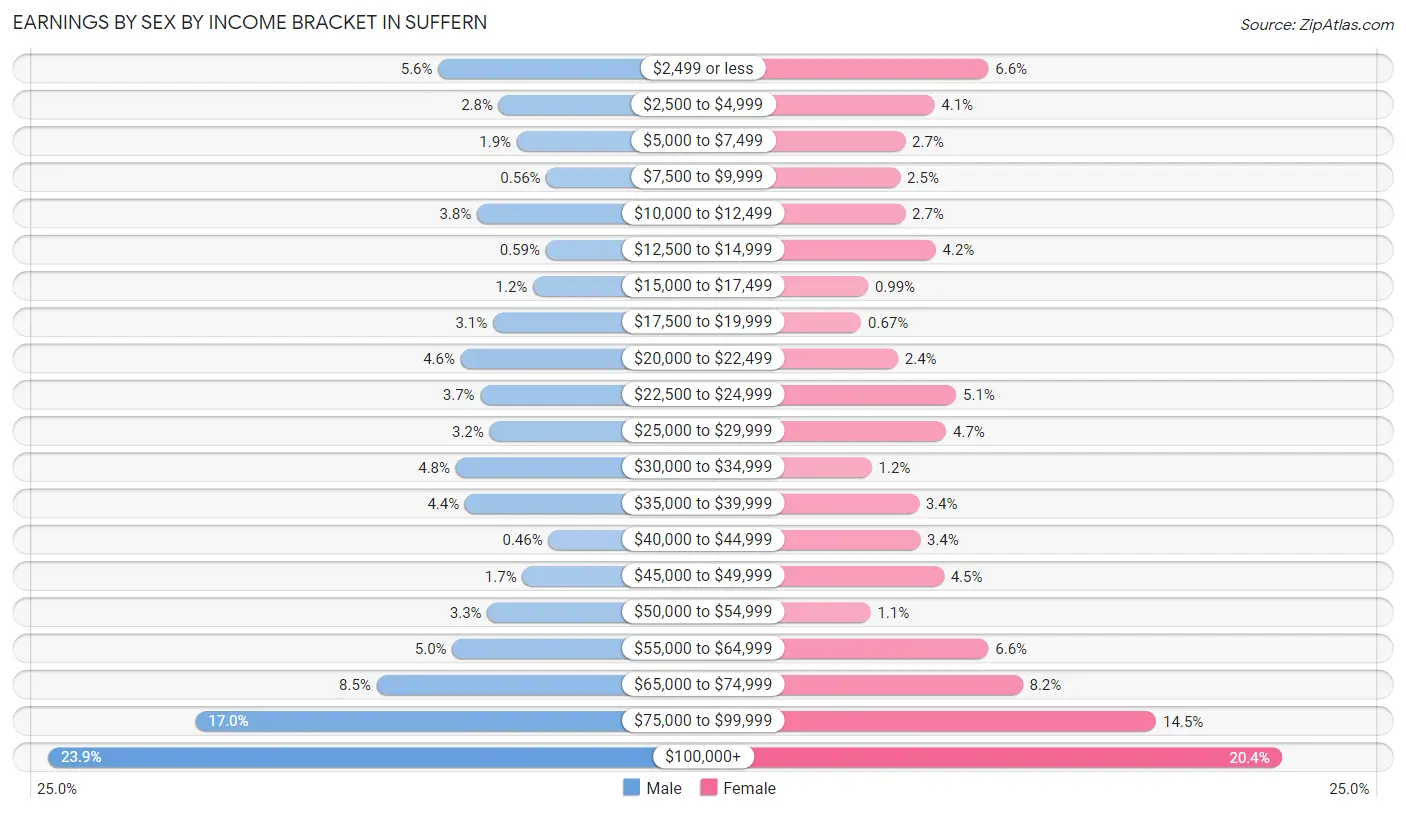
Earnings by Sex by Income Bracket in Suffern
The most common earnings brackets in Suffern are $100,000+ for men (727 | 23.9%) and $100,000+ for women (700 | 20.4%).
| Income | Male | Female |
| $2,499 or less | 171 (5.6%) | 228 (6.6%) |
| $2,500 to $4,999 | 85 (2.8%) | 141 (4.1%) |
| $5,000 to $7,499 | 59 (1.9%) | 94 (2.7%) |
| $7,500 to $9,999 | 17 (0.6%) | 86 (2.5%) |
| $10,000 to $12,499 | 116 (3.8%) | 94 (2.7%) |
| $12,500 to $14,999 | 18 (0.6%) | 143 (4.2%) |
| $15,000 to $17,499 | 36 (1.2%) | 34 (1.0%) |
| $17,500 to $19,999 | 93 (3.1%) | 23 (0.7%) |
| $20,000 to $22,499 | 139 (4.6%) | 82 (2.4%) |
| $22,500 to $24,999 | 111 (3.6%) | 176 (5.1%) |
| $25,000 to $29,999 | 98 (3.2%) | 160 (4.6%) |
| $30,000 to $34,999 | 146 (4.8%) | 40 (1.2%) |
| $35,000 to $39,999 | 133 (4.4%) | 116 (3.4%) |
| $40,000 to $44,999 | 14 (0.5%) | 118 (3.4%) |
| $45,000 to $49,999 | 51 (1.7%) | 156 (4.5%) |
| $50,000 to $54,999 | 101 (3.3%) | 38 (1.1%) |
| $55,000 to $64,999 | 151 (5.0%) | 228 (6.6%) |
| $65,000 to $74,999 | 259 (8.5%) | 283 (8.2%) |
| $75,000 to $99,999 | 517 (17.0%) | 498 (14.5%) |
| $100,000+ | 727 (23.9%) | 700 (20.4%) |
| Total | 3,042 (100.0%) | 3,438 (100.0%) |
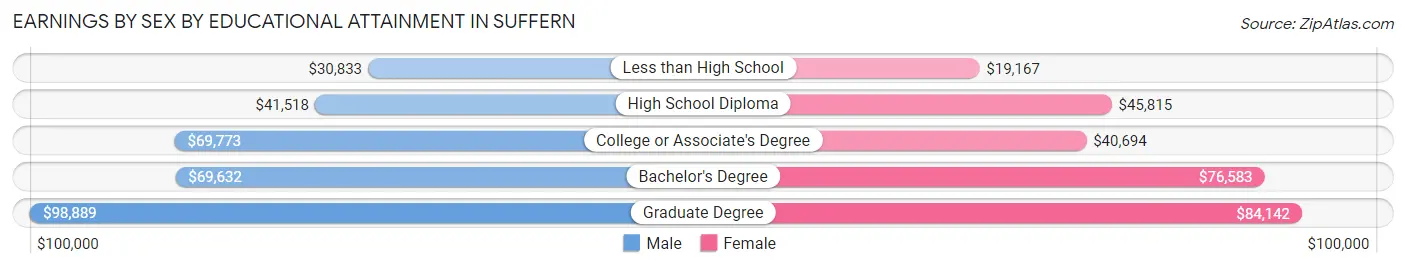
Earnings by Sex by Educational Attainment in Suffern
Average earnings in Suffern are $68,808 for men and $63,842 for women, a difference of 7.2%. Men with an educational attainment of graduate degree enjoy the highest average annual earnings of $98,889, while those with less than high school education earn the least with $30,833. Women with an educational attainment of graduate degree earn the most with the average annual earnings of $84,142, while those with less than high school education have the smallest earnings of $19,167.
| Educational Attainment | Male Income | Female Income |
| Less than High School | $30,833 | $19,167 |
| High School Diploma | $41,518 | $45,815 |
| College or Associate's Degree | $69,773 | $40,694 |
| Bachelor's Degree | $69,632 | $76,583 |
| Graduate Degree | $98,889 | $84,142 |
| Total | $68,808 | $63,842 |
Family Income in Suffern
Family Income Brackets in Suffern
According to the Suffern family income data, there are 672 families falling into the $100,000 to $149,999 income range, which is the most common income bracket and makes up 25.1% of all families. Conversely, the $15,000 to $24,999 income bracket is the least frequent group with only 8 families (0.3%) belonging to this category.
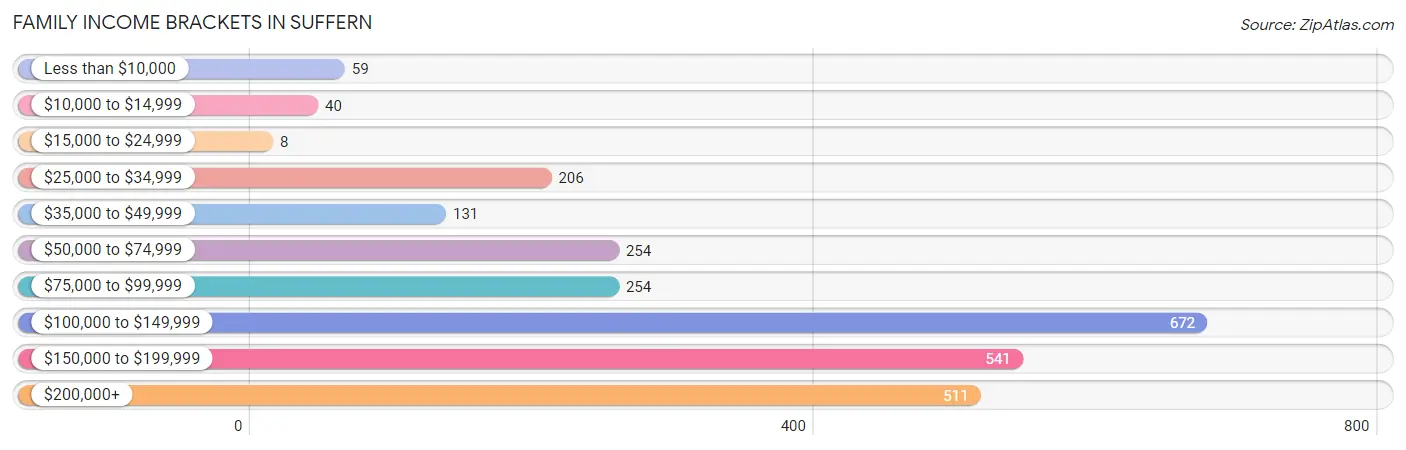
| Income Bracket | # Families | % Families |
| Less than $10,000 | 59 | 2.2% |
| $10,000 to $14,999 | 40 | 1.5% |
| $15,000 to $24,999 | 8 | 0.3% |
| $25,000 to $34,999 | 206 | 7.7% |
| $35,000 to $49,999 | 131 | 4.9% |
| $50,000 to $74,999 | 254 | 9.5% |
| $75,000 to $99,999 | 254 | 9.5% |
| $100,000 to $149,999 | 672 | 25.1% |
| $150,000 to $199,999 | 541 | 20.2% |
| $200,000+ | 511 | 19.1% |
Family Income by Famaliy Size in Suffern
5-person families (289 | 10.8%) account for the highest median family income in Suffern with $153,194 per family, while 2-person families (1,130 | 42.2%) have the highest median income of $58,438 per family member.
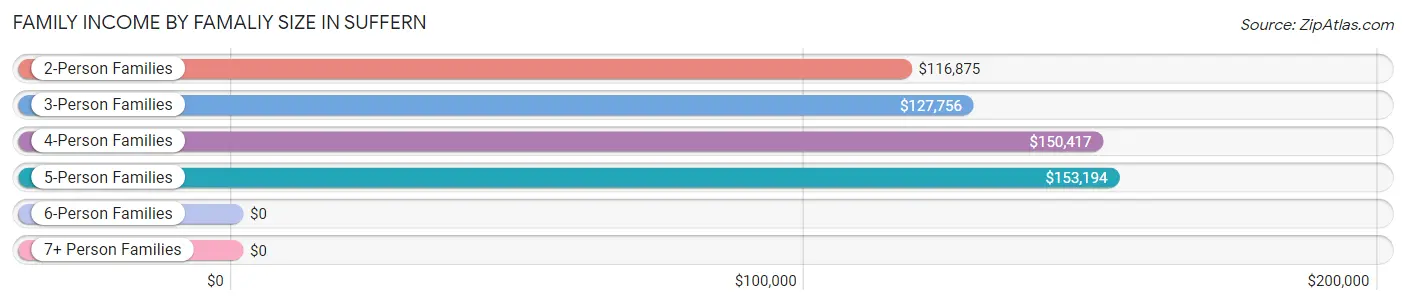
| Income Bracket | # Families | Median Income |
| 2-Person Families | 1,130 (42.2%) | $116,875 |
| 3-Person Families | 619 (23.1%) | $127,756 |
| 4-Person Families | 566 (21.1%) | $150,417 |
| 5-Person Families | 289 (10.8%) | $153,194 |
| 6-Person Families | 27 (1.0%) | $0 |
| 7+ Person Families | 47 (1.8%) | $0 |
| Total | 2,678 (100.0%) | $128,993 |
Family Income by Number of Earners in Suffern
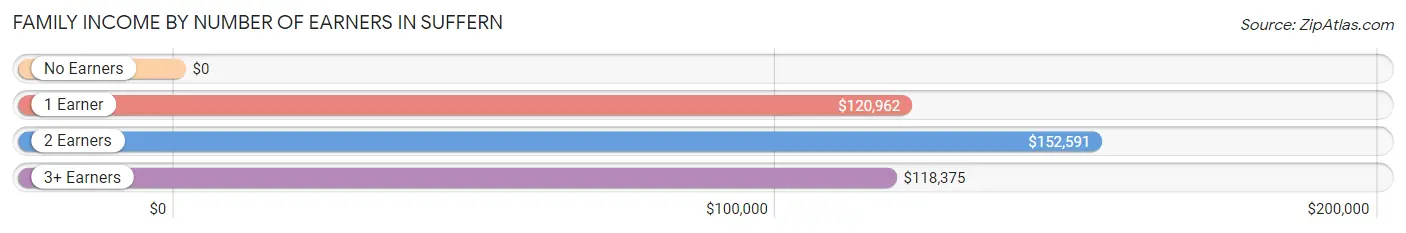
| Number of Earners | # Families | Median Income |
| No Earners | 340 (12.7%) | $0 |
| 1 Earner | 774 (28.9%) | $120,962 |
| 2 Earners | 1,071 (40.0%) | $152,591 |
| 3+ Earners | 493 (18.4%) | $118,375 |
| Total | 2,678 (100.0%) | $128,993 |
Household Income in Suffern
Household Income Brackets in Suffern
With 975 households falling in the category, the $100,000 to $149,999 income range is the most frequent in Suffern, accounting for 20.9% of all households. In contrast, only 182 households (3.9%) fall into the less than $10,000 income bracket, making it the least populous group.
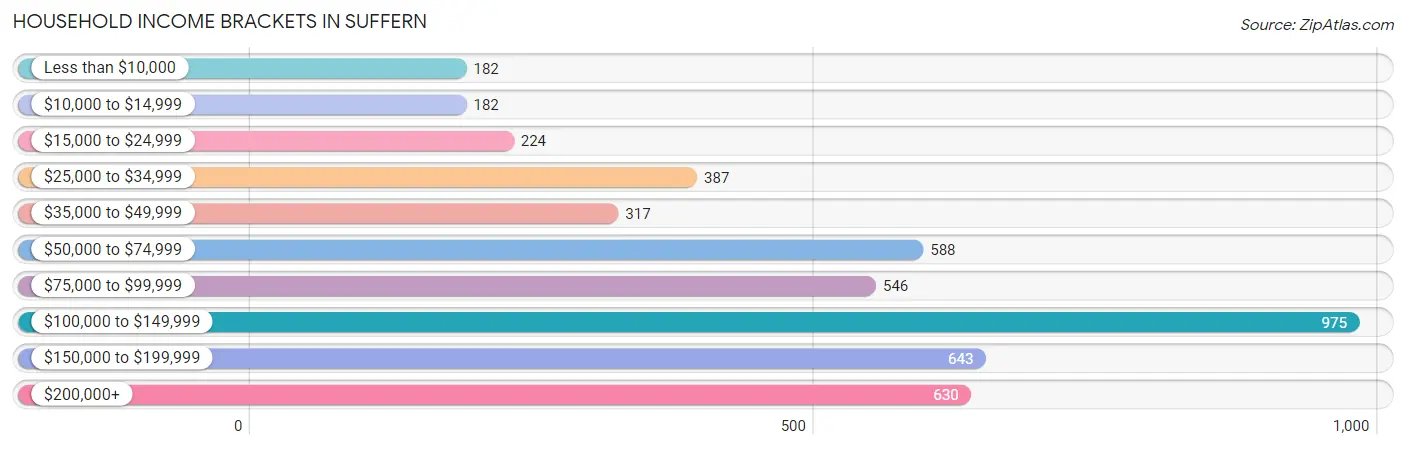
| Income Bracket | # Households | % Households |
| Less than $10,000 | 182 | 3.9% |
| $10,000 to $14,999 | 182 | 3.9% |
| $15,000 to $24,999 | 224 | 4.8% |
| $25,000 to $34,999 | 387 | 8.3% |
| $35,000 to $49,999 | 317 | 6.8% |
| $50,000 to $74,999 | 588 | 12.6% |
| $75,000 to $99,999 | 546 | 11.7% |
| $100,000 to $149,999 | 975 | 20.9% |
| $150,000 to $199,999 | 643 | 13.8% |
| $200,000+ | 630 | 13.5% |
Household Income by Householder Age in Suffern
The median household income in Suffern is $94,688, with the highest median household income of $135,270 found in the 45 to 64 years age bracket for the primary householder. A total of 1,774 households (38.0%) fall into this category. Meanwhile, the 15 to 24 years age bracket for the primary householder has the lowest median household income of $0, with 13 households (0.3%) in this group.
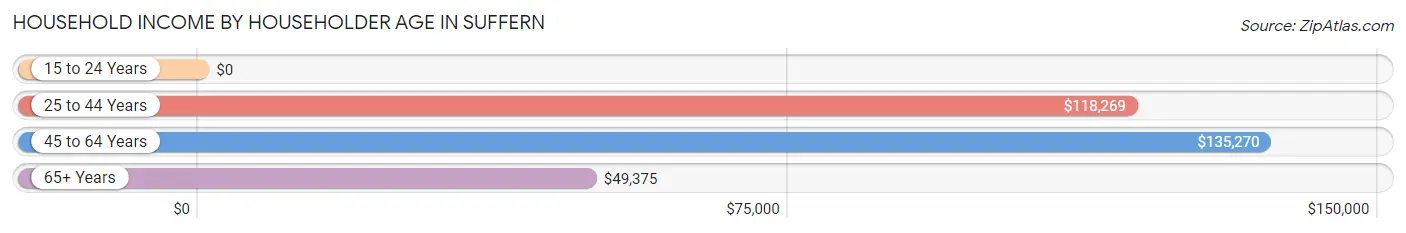
| Income Bracket | # Households | Median Income |
| 15 to 24 Years | 13 (0.3%) | $0 |
| 25 to 44 Years | 1,184 (25.4%) | $118,269 |
| 45 to 64 Years | 1,774 (38.0%) | $135,270 |
| 65+ Years | 1,692 (36.3%) | $49,375 |
| Total | 4,663 (100.0%) | $94,688 |
Poverty in Suffern
Income Below Poverty by Sex and Age in Suffern
With 5.0% poverty level for males and 7.0% for females among the residents of Suffern, 65 to 74 year old males and 15 year old females are the most vulnerable to poverty, with 64 males (15.1%) and 15 females (41.7%) in their respective age groups living below the poverty level.
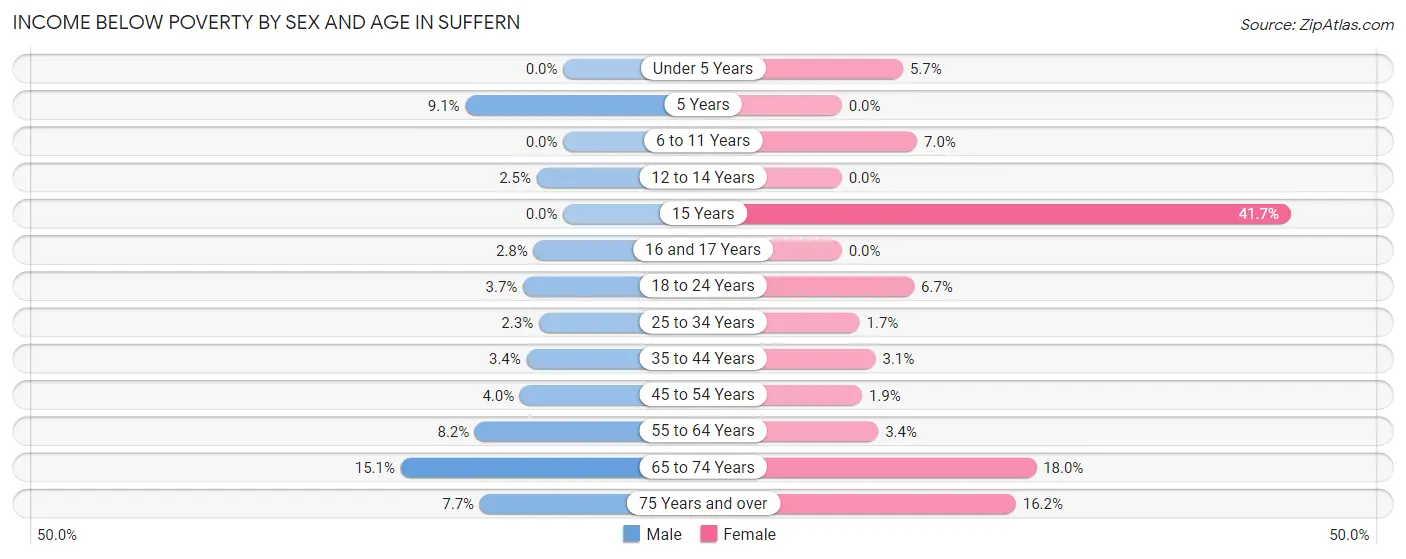
| Age Bracket | Male | Female |
| Under 5 Years | 0 (0.0%) | 20 (5.7%) |
| 5 Years | 17 (9.1%) | 0 (0.0%) |
| 6 to 11 Years | 0 (0.0%) | 23 (7.0%) |
| 12 to 14 Years | 6 (2.5%) | 0 (0.0%) |
| 15 Years | 0 (0.0%) | 15 (41.7%) |
| 16 and 17 Years | 7 (2.8%) | 0 (0.0%) |
| 18 to 24 Years | 9 (3.7%) | 31 (6.7%) |
| 25 to 34 Years | 12 (2.3%) | 10 (1.7%) |
| 35 to 44 Years | 28 (3.4%) | 26 (3.1%) |
| 45 to 54 Years | 32 (4.0%) | 15 (1.9%) |
| 55 to 64 Years | 59 (8.2%) | 29 (3.4%) |
| 65 to 74 Years | 64 (15.1%) | 136 (18.0%) |
| 75 Years and over | 25 (7.7%) | 114 (16.2%) |
| Total | 259 (5.0%) | 419 (7.0%) |
Income Above Poverty by Sex and Age in Suffern
According to the poverty statistics in Suffern, males aged under 5 years and females aged 5 years are the age groups that are most secure financially, with 100.0% of males and 100.0% of females in these age groups living above the poverty line.
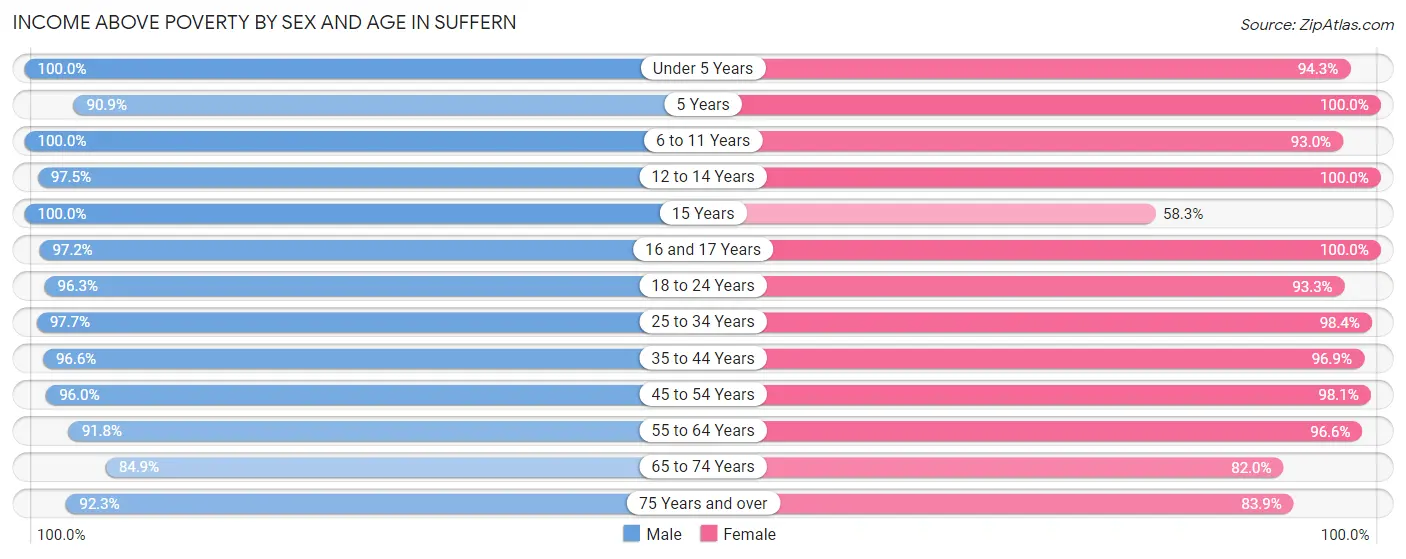
| Age Bracket | Male | Female |
| Under 5 Years | 248 (100.0%) | 332 (94.3%) |
| 5 Years | 170 (90.9%) | 8 (100.0%) |
| 6 to 11 Years | 293 (100.0%) | 306 (93.0%) |
| 12 to 14 Years | 238 (97.5%) | 163 (100.0%) |
| 15 Years | 110 (100.0%) | 21 (58.3%) |
| 16 and 17 Years | 247 (97.2%) | 94 (100.0%) |
| 18 to 24 Years | 232 (96.3%) | 431 (93.3%) |
| 25 to 34 Years | 518 (97.7%) | 595 (98.4%) |
| 35 to 44 Years | 793 (96.6%) | 805 (96.9%) |
| 45 to 54 Years | 765 (96.0%) | 786 (98.1%) |
| 55 to 64 Years | 661 (91.8%) | 829 (96.6%) |
| 65 to 74 Years | 360 (84.9%) | 618 (82.0%) |
| 75 Years and over | 298 (92.3%) | 592 (83.9%) |
| Total | 4,933 (95.0%) | 5,580 (93.0%) |
Income Below Poverty Among Married-Couple Families in Suffern
The poverty statistics for married-couple families in Suffern show that 2.9% or 59 of the total 2,064 families live below the poverty line. Families with no children have the highest poverty rate of 3.8%, comprising of 44 families. On the other hand, families with 3 or 4 children have the lowest poverty rate of 0.0%, which includes 0 families.
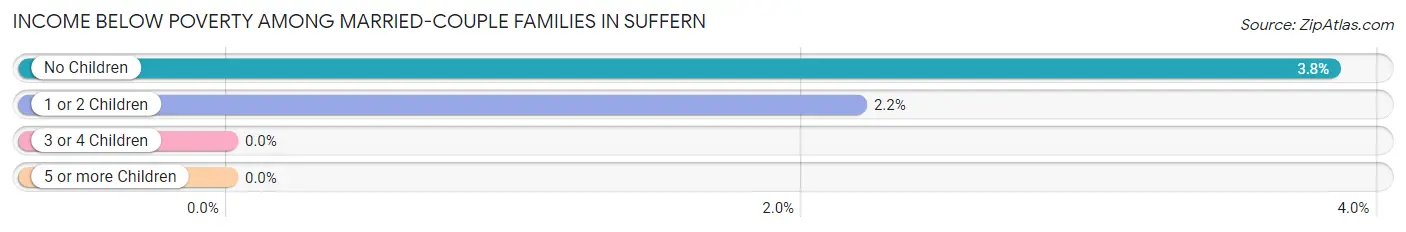
| Children | Above Poverty | Below Poverty |
| No Children | 1,101 (96.2%) | 44 (3.8%) |
| 1 or 2 Children | 671 (97.8%) | 15 (2.2%) |
| 3 or 4 Children | 219 (100.0%) | 0 (0.0%) |
| 5 or more Children | 14 (100.0%) | 0 (0.0%) |
| Total | 2,005 (97.1%) | 59 (2.9%) |
Income Below Poverty Among Single-Parent Households in Suffern
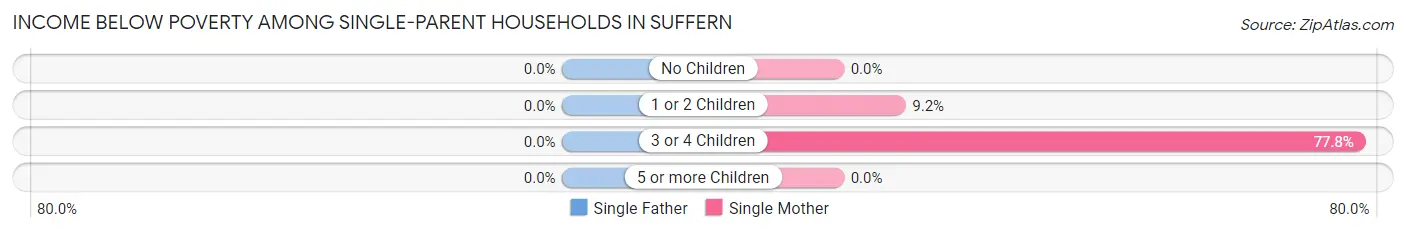
| Children | Single Father | Single Mother |
| No Children | 0 (0.0%) | 0 (0.0%) |
| 1 or 2 Children | 0 (0.0%) | 26 (9.2%) |
| 3 or 4 Children | 0 (0.0%) | 14 (77.8%) |
| 5 or more Children | 0 (0.0%) | 0 (0.0%) |
| Total | 0 (0.0%) | 40 (7.7%) |
Income Below Poverty Among Married-Couple vs Single-Parent Households in Suffern
The poverty data for Suffern shows that 59 of the married-couple family households (2.9%) and 40 of the single-parent households (6.5%) are living below the poverty level. Within the married-couple family households, those with no children have the highest poverty rate, with 44 households (3.8%) falling below the poverty line. Among the single-parent households, those with 3 or 4 children have the highest poverty rate, with 14 household (51.8%) living below poverty.
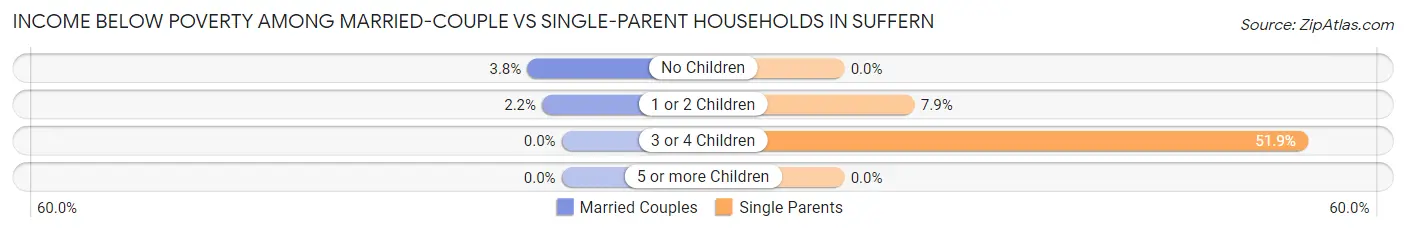
| Children | Married-Couple Families | Single-Parent Households |
| No Children | 44 (3.8%) | 0 (0.0%) |
| 1 or 2 Children | 15 (2.2%) | 26 (7.9%) |
| 3 or 4 Children | 0 (0.0%) | 14 (51.8%) |
| 5 or more Children | 0 (0.0%) | 0 (0.0%) |
| Total | 59 (2.9%) | 40 (6.5%) |
Race in Suffern
The most populous races in Suffern are White / Caucasian (7,262 | 63.8%), Hispanic or Latino (2,023 | 17.8%), and Black / African American (1,632 | 14.3%).
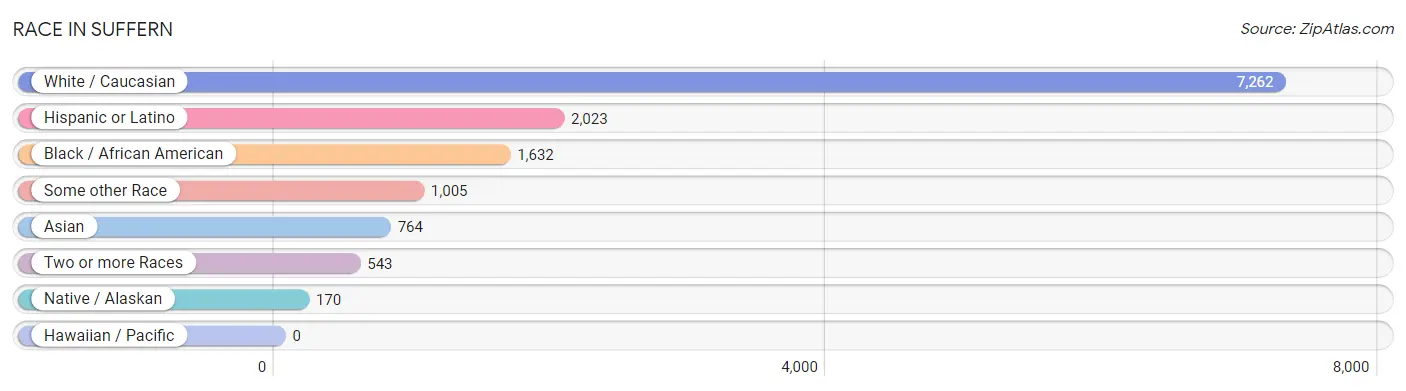
| Race | # Population | % Population |
| Asian | 764 | 6.7% |
| Black / African American | 1,632 | 14.3% |
| Hawaiian / Pacific | 0 | 0.0% |
| Hispanic or Latino | 2,023 | 17.8% |
| Native / Alaskan | 170 | 1.5% |
| White / Caucasian | 7,262 | 63.8% |
| Two or more Races | 543 | 4.8% |
| Some other Race | 1,005 | 8.8% |
| Total | 11,376 | 100.0% |
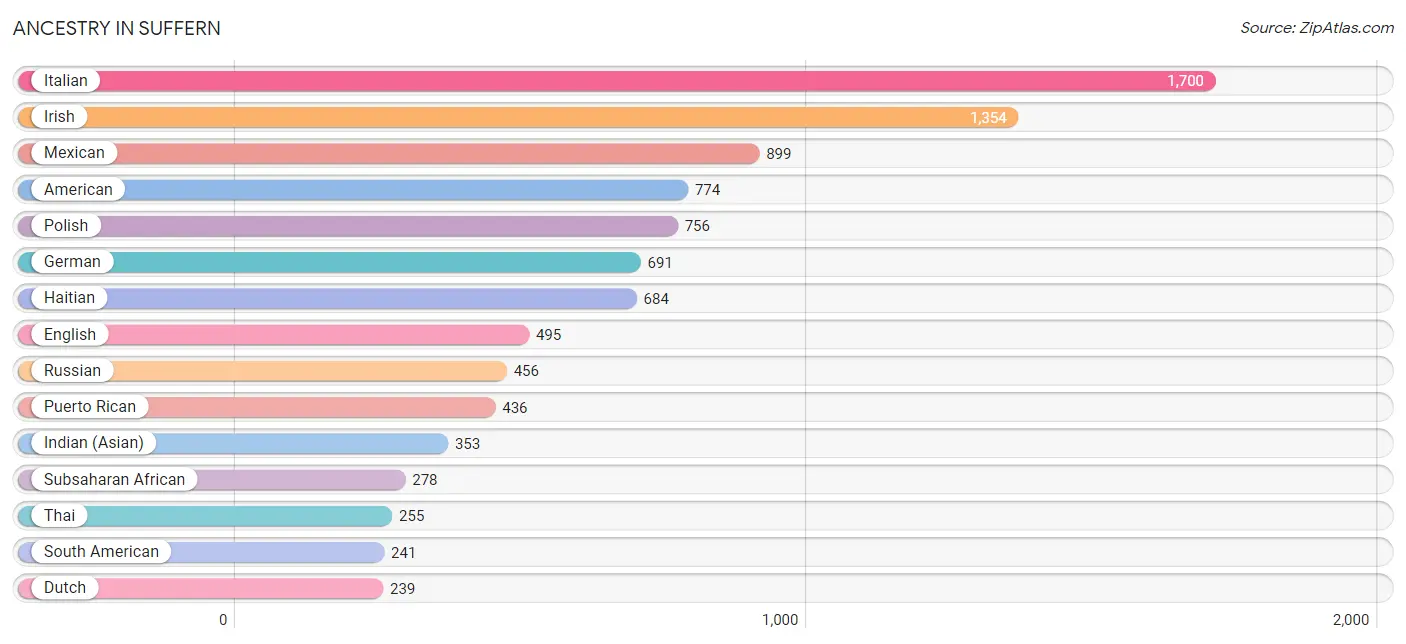
Ancestry in Suffern
The most populous ancestries reported in Suffern are Italian (1,700 | 14.9%), Irish (1,354 | 11.9%), Mexican (899 | 7.9%), American (774 | 6.8%), and Polish (756 | 6.7%), together accounting for 48.2% of all Suffern residents.
| Ancestry | # Population | % Population |
| African | 18 | 0.2% |
| Albanian | 19 | 0.2% |
| American | 774 | 6.8% |
| Arab | 79 | 0.7% |
| Austrian | 38 | 0.3% |
| Bhutanese | 25 | 0.2% |
| Brazilian | 44 | 0.4% |
| British | 17 | 0.2% |
| Bulgarian | 53 | 0.5% |
| Burmese | 49 | 0.4% |
| Canadian | 16 | 0.1% |
| Central American | 136 | 1.2% |
| Central American Indian | 64 | 0.6% |
| Cherokee | 5 | 0.0% |
| Chilean | 34 | 0.3% |
| Colombian | 87 | 0.8% |
| Costa Rican | 62 | 0.5% |
| Croatian | 9 | 0.1% |
| Cuban | 32 | 0.3% |
| Czech | 43 | 0.4% |
| Czechoslovakian | 7 | 0.1% |
| Danish | 11 | 0.1% |
| Dominican | 152 | 1.3% |
| Dutch | 239 | 2.1% |
| Dutch West Indian | 47 | 0.4% |
| Eastern European | 70 | 0.6% |
| Ecuadorian | 120 | 1.1% |
| Egyptian | 45 | 0.4% |
| English | 495 | 4.3% |
| European | 209 | 1.8% |
| Filipino | 11 | 0.1% |
| French | 46 | 0.4% |
| French Canadian | 97 | 0.9% |
| German | 691 | 6.1% |
| Guatemalan | 66 | 0.6% |
| Guyanese | 11 | 0.1% |
| Haitian | 684 | 6.0% |
| Hungarian | 83 | 0.7% |
| Indian (Asian) | 353 | 3.1% |
| Irish | 1,354 | 11.9% |
| Israeli | 29 | 0.3% |
| Italian | 1,700 | 14.9% |
| Jamaican | 165 | 1.5% |
| Korean | 62 | 0.5% |
| Latvian | 37 | 0.3% |
| Lebanese | 4 | 0.0% |
| Lithuanian | 20 | 0.2% |
| Mexican | 899 | 7.9% |
| Mexican American Indian | 149 | 1.3% |
| Nicaraguan | 8 | 0.1% |
| Nigerian | 179 | 1.6% |
| Northern European | 12 | 0.1% |
| Norwegian | 88 | 0.8% |
| Polish | 756 | 6.7% |
| Puerto Rican | 436 | 3.8% |
| Romanian | 53 | 0.5% |
| Russian | 456 | 4.0% |
| Scandinavian | 10 | 0.1% |
| Scotch-Irish | 97 | 0.9% |
| Scottish | 103 | 0.9% |
| Sierra Leonean | 31 | 0.3% |
| Slavic | 8 | 0.1% |
| Slovak | 8 | 0.1% |
| South African | 9 | 0.1% |
| South American | 241 | 2.1% |
| South American Indian | 55 | 0.5% |
| Spaniard | 7 | 0.1% |
| Sri Lankan | 92 | 0.8% |
| Subsaharan African | 278 | 2.4% |
| Swedish | 54 | 0.5% |
| Syrian | 5 | 0.0% |
| Thai | 255 | 2.2% |
| U.S. Virgin Islander | 30 | 0.3% |
| Ukrainian | 187 | 1.6% |
| Welsh | 48 | 0.4% |
| West Indian | 46 | 0.4% | View All 76 Rows |
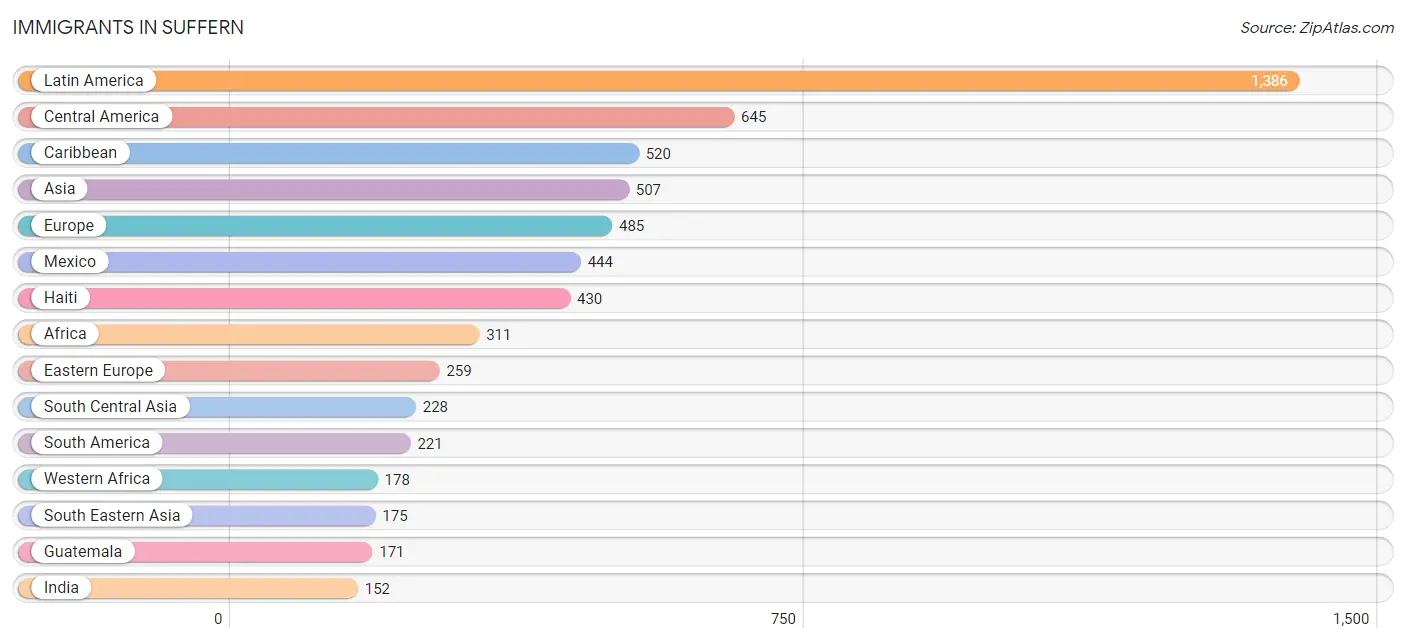
Immigrants in Suffern
The most numerous immigrant groups reported in Suffern came from Latin America (1,386 | 12.2%), Central America (645 | 5.7%), Caribbean (520 | 4.6%), Asia (507 | 4.5%), and Europe (485 | 4.3%), together accounting for 31.1% of all Suffern residents.
| Immigration Origin | # Population | % Population |
| Africa | 311 | 2.7% |
| Asia | 507 | 4.5% |
| Belarus | 9 | 0.1% |
| Brazil | 44 | 0.4% |
| Bulgaria | 44 | 0.4% |
| Cameroon | 14 | 0.1% |
| Canada | 15 | 0.1% |
| Caribbean | 520 | 4.6% |
| Central America | 645 | 5.7% |
| Chile | 34 | 0.3% |
| China | 36 | 0.3% |
| Colombia | 20 | 0.2% |
| Costa Rica | 27 | 0.2% |
| Croatia | 9 | 0.1% |
| Denmark | 11 | 0.1% |
| Dominican Republic | 14 | 0.1% |
| Eastern Africa | 8 | 0.1% |
| Eastern Asia | 59 | 0.5% |
| Eastern Europe | 259 | 2.3% |
| Ecuador | 91 | 0.8% |
| Egypt | 55 | 0.5% |
| England | 16 | 0.1% |
| Europe | 485 | 4.3% |
| Guatemala | 171 | 1.5% |
| Guyana | 32 | 0.3% |
| Haiti | 430 | 3.8% |
| Hungary | 24 | 0.2% |
| India | 152 | 1.3% |
| Indonesia | 119 | 1.1% |
| Ireland | 44 | 0.4% |
| Israel | 32 | 0.3% |
| Italy | 96 | 0.8% |
| Jamaica | 62 | 0.5% |
| Japan | 9 | 0.1% |
| Kenya | 8 | 0.1% |
| Korea | 14 | 0.1% |
| Latin America | 1,386 | 12.2% |
| Mexico | 444 | 3.9% |
| Middle Africa | 14 | 0.1% |
| Moldova | 15 | 0.1% |
| Nicaragua | 3 | 0.0% |
| Nigeria | 129 | 1.1% |
| Northern Africa | 84 | 0.7% |
| Northern Europe | 96 | 0.8% |
| Pakistan | 60 | 0.5% |
| Philippines | 22 | 0.2% |
| Poland | 49 | 0.4% |
| Romania | 8 | 0.1% |
| Russia | 45 | 0.4% |
| Saudi Arabia | 13 | 0.1% |
| Scotland | 6 | 0.1% |
| Sierra Leone | 49 | 0.4% |
| South Africa | 9 | 0.1% |
| South America | 221 | 1.9% |
| South Central Asia | 228 | 2.0% |
| South Eastern Asia | 175 | 1.5% |
| Southern Europe | 102 | 0.9% |
| Spain | 6 | 0.1% |
| Sudan | 29 | 0.3% |
| Sweden | 9 | 0.1% |
| Ukraine | 40 | 0.4% |
| Vietnam | 34 | 0.3% |
| Western Africa | 178 | 1.6% |
| Western Asia | 45 | 0.4% | View All 64 Rows |
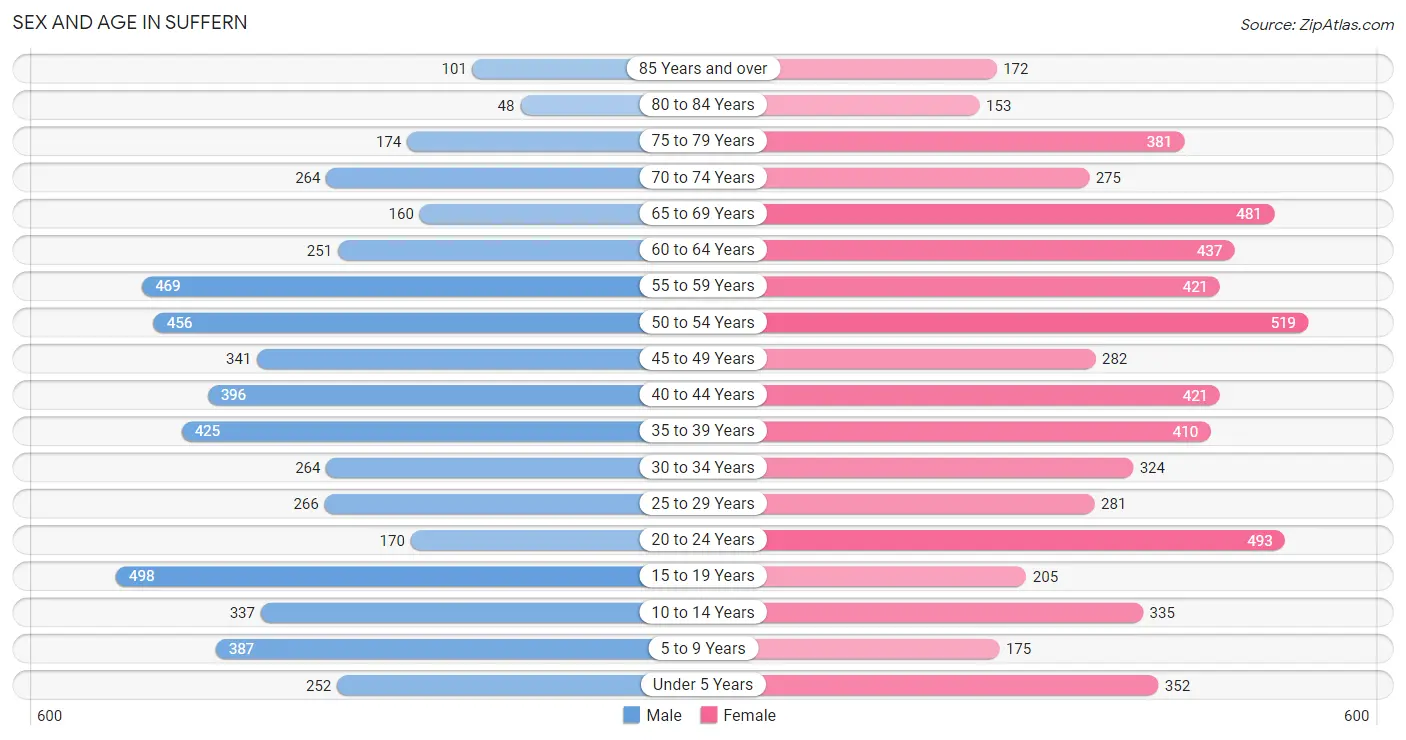
Sex and Age in Suffern
Sex and Age in Suffern
The most populous age groups in Suffern are 15 to 19 Years (498 | 9.5%) for men and 50 to 54 Years (519 | 8.5%) for women.
| Age Bracket | Male | Female |
| Under 5 Years | 252 (4.8%) | 352 (5.8%) |
| 5 to 9 Years | 387 (7.4%) | 175 (2.9%) |
| 10 to 14 Years | 337 (6.4%) | 335 (5.5%) |
| 15 to 19 Years | 498 (9.5%) | 205 (3.4%) |
| 20 to 24 Years | 170 (3.2%) | 493 (8.1%) |
| 25 to 29 Years | 266 (5.1%) | 281 (4.6%) |
| 30 to 34 Years | 264 (5.0%) | 324 (5.3%) |
| 35 to 39 Years | 425 (8.1%) | 410 (6.7%) |
| 40 to 44 Years | 396 (7.5%) | 421 (6.9%) |
| 45 to 49 Years | 341 (6.5%) | 282 (4.6%) |
| 50 to 54 Years | 456 (8.7%) | 519 (8.5%) |
| 55 to 59 Years | 469 (8.9%) | 421 (6.9%) |
| 60 to 64 Years | 251 (4.8%) | 437 (7.1%) |
| 65 to 69 Years | 160 (3.0%) | 481 (7.9%) |
| 70 to 74 Years | 264 (5.0%) | 275 (4.5%) |
| 75 to 79 Years | 174 (3.3%) | 381 (6.2%) |
| 80 to 84 Years | 48 (0.9%) | 153 (2.5%) |
| 85 Years and over | 101 (1.9%) | 172 (2.8%) |
| Total | 5,259 (100.0%) | 6,117 (100.0%) |
Families and Households in Suffern
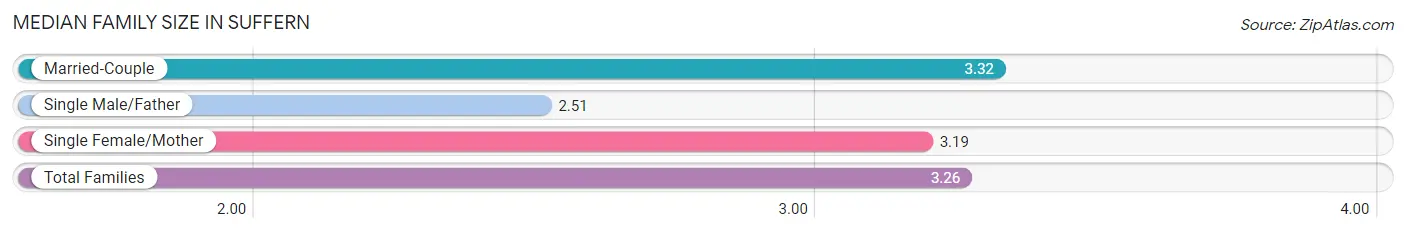
Median Family Size in Suffern
The median family size in Suffern is 3.26 persons per family, with married-couple families (2,064 | 77.1%) accounting for the largest median family size of 3.32 persons per family. On the other hand, single male/father families (98 | 3.7%) represent the smallest median family size with 2.51 persons per family.
| Family Type | # Families | Family Size |
| Married-Couple | 2,064 (77.1%) | 3.32 |
| Single Male/Father | 98 (3.7%) | 2.51 |
| Single Female/Mother | 516 (19.3%) | 3.19 |
| Total Families | 2,678 (100.0%) | 3.26 |
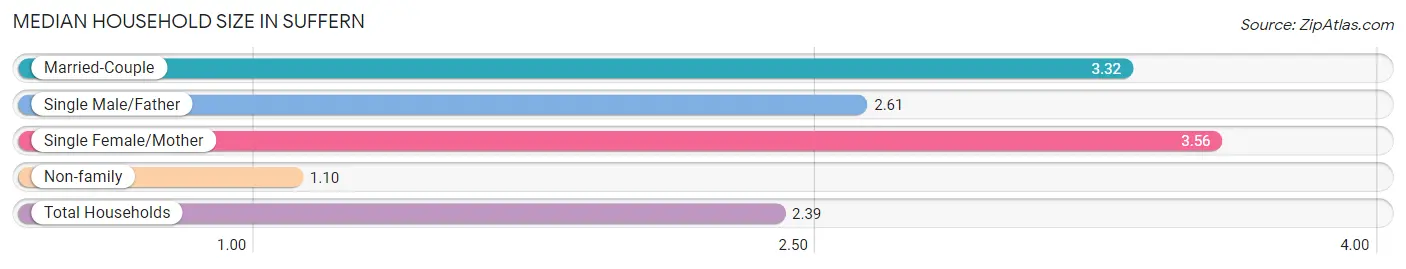
Median Household Size in Suffern
The median household size in Suffern is 2.39 persons per household, with single female/mother households (516 | 11.1%) accounting for the largest median household size of 3.56 persons per household. non-family households (1,985 | 42.6%) represent the smallest median household size with 1.10 persons per household.
| Household Type | # Households | Household Size |
| Married-Couple | 2,064 (44.3%) | 3.32 |
| Single Male/Father | 98 (2.1%) | 2.61 |
| Single Female/Mother | 516 (11.1%) | 3.56 |
| Non-family | 1,985 (42.6%) | 1.10 |
| Total Households | 4,663 (100.0%) | 2.39 |
Household Size by Marriage Status in Suffern
Out of a total of 4,663 households in Suffern, 2,678 (57.4%) are family households, while 1,985 (42.6%) are nonfamily households. The most numerous type of family households are 2-person households, comprising 1,070, and the most common type of nonfamily households are 1-person households, comprising 1,820.
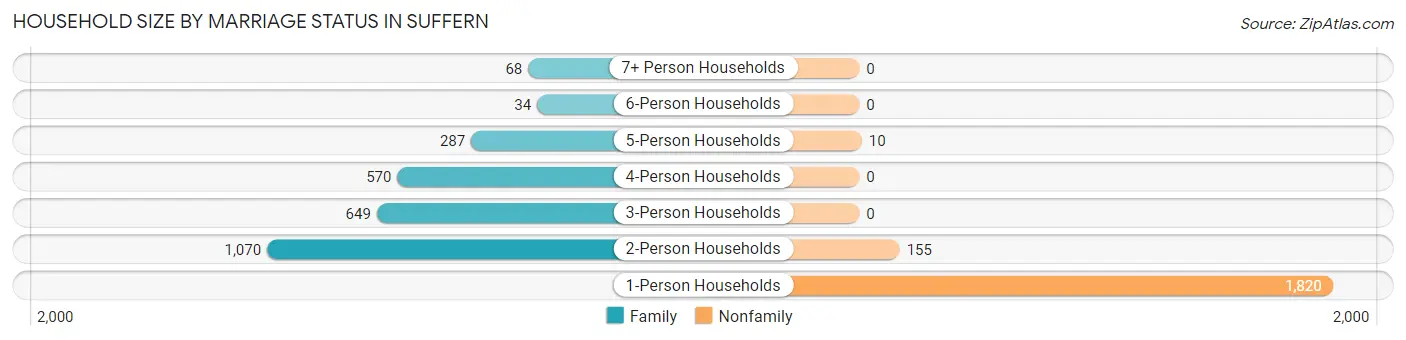
| Household Size | Family Households | Nonfamily Households |
| 1-Person Households | - | 1,820 (39.0%) |
| 2-Person Households | 1,070 (23.0%) | 155 (3.3%) |
| 3-Person Households | 649 (13.9%) | 0 (0.0%) |
| 4-Person Households | 570 (12.2%) | 0 (0.0%) |
| 5-Person Households | 287 (6.1%) | 10 (0.2%) |
| 6-Person Households | 34 (0.7%) | 0 (0.0%) |
| 7+ Person Households | 68 (1.5%) | 0 (0.0%) |
| Total | 2,678 (57.4%) | 1,985 (42.6%) |
Female Fertility in Suffern
Fertility by Age in Suffern
Average fertility rate in Suffern is 18.0 births per 1,000 women. Women in the age bracket of 35 to 50 years have the highest fertility rate with 28.0 births per 1,000 women. Women in the age bracket of 35 to 50 years acount for 75.0% of all women with births.
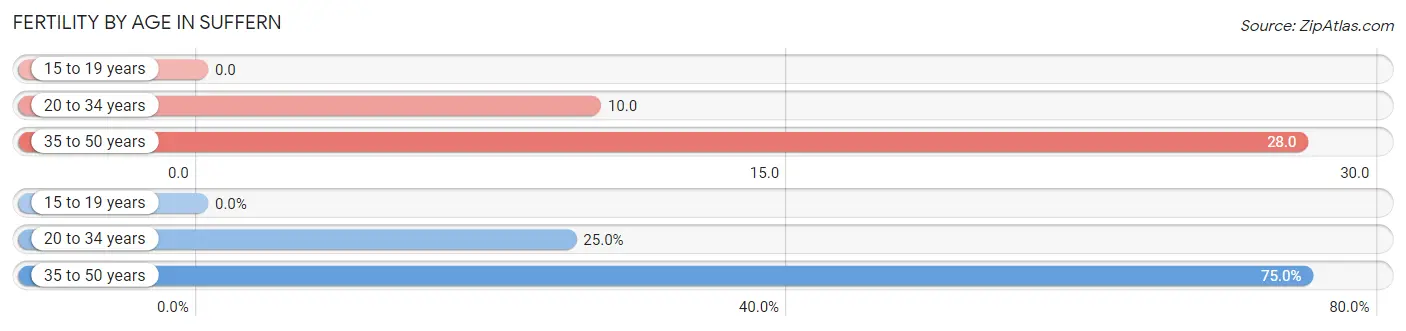
| Age Bracket | Women with Births | Births / 1,000 Women |
| 15 to 19 years | 0 (0.0%) | 0.0 |
| 20 to 34 years | 11 (25.0%) | 10.0 |
| 35 to 50 years | 33 (75.0%) | 28.0 |
| Total | 44 (100.0%) | 18.0 |
Fertility by Age by Marriage Status in Suffern
75.0% of women with births (44) in Suffern are married. The highest percentage of unmarried women with births falls into 35 to 50 years age bracket with 33.3% of them unmarried at the time of birth, while the lowest percentage of unmarried women with births belong to 20 to 34 years age bracket with 0.0% of them unmarried.
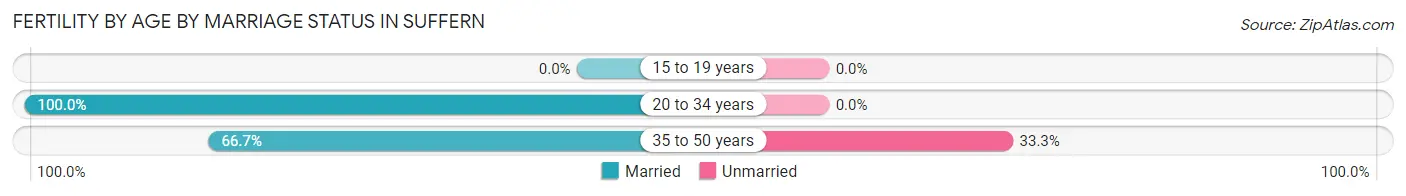
| Age Bracket | Married | Unmarried |
| 15 to 19 years | 0 (0.0%) | 0 (0.0%) |
| 20 to 34 years | 11 (100.0%) | 0 (0.0%) |
| 35 to 50 years | 22 (66.7%) | 11 (33.3%) |
| Total | 33 (75.0%) | 11 (25.0%) |
Fertility by Education in Suffern
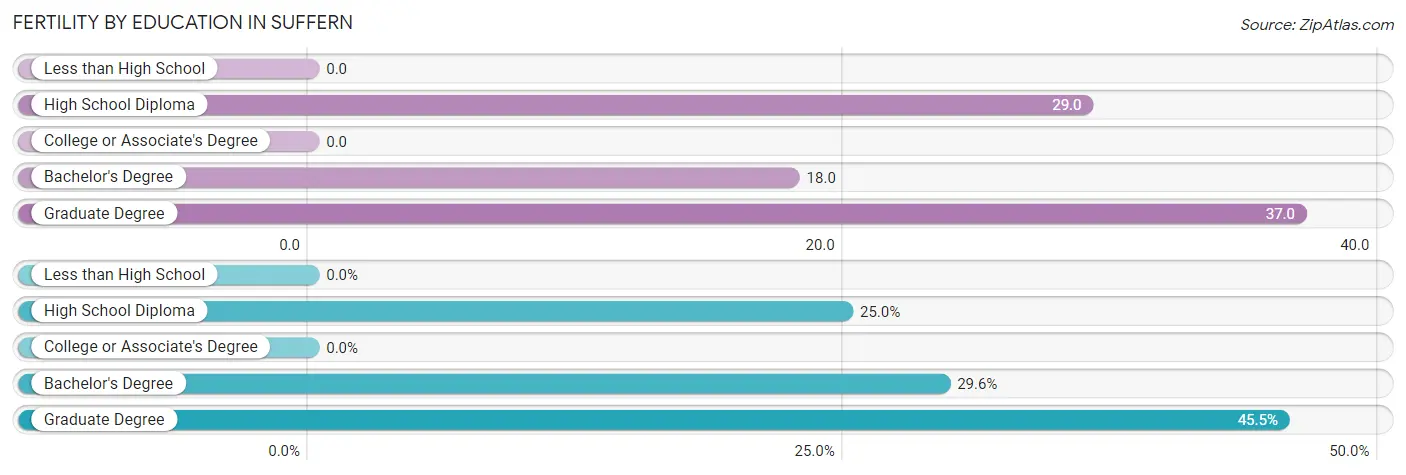
| Educational Attainment | Women with Births | Births / 1,000 Women |
| Less than High School | 0 (0.0%) | 0.0 |
| High School Diploma | 11 (25.0%) | 29.0 |
| College or Associate's Degree | 0 (0.0%) | 0.0 |
| Bachelor's Degree | 13 (29.5%) | 18.0 |
| Graduate Degree | 20 (45.5%) | 37.0 |
| Total | 44 (100.0%) | 18.0 |
Fertility by Education by Marriage Status in Suffern
25.0% of women with births in Suffern are unmarried. Women with the educational attainment of bachelor's degree are most likely to be married with 100.0% of them married at childbirth, while women with the educational attainment of high school diploma are least likely to be married with 100.0% of them unmarried at childbirth.
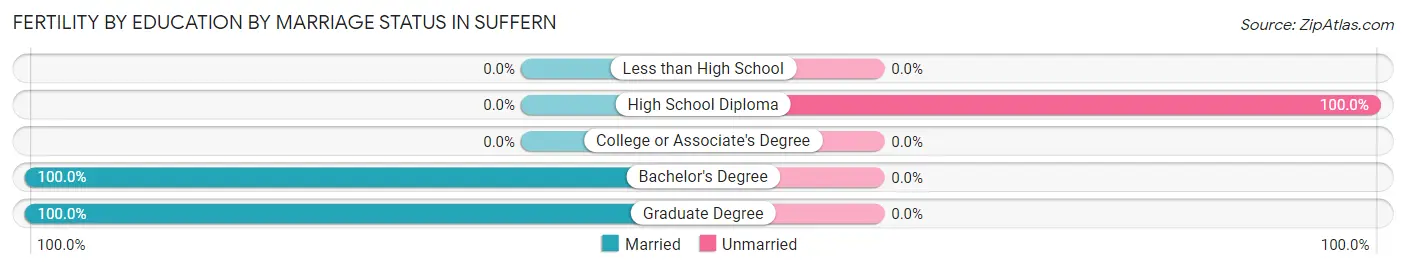
| Educational Attainment | Married | Unmarried |
| Less than High School | 0 (0.0%) | 0 (0.0%) |
| High School Diploma | 0 (0.0%) | 11 (100.0%) |
| College or Associate's Degree | 0 (0.0%) | 0 (0.0%) |
| Bachelor's Degree | 13 (100.0%) | 0 (0.0%) |
| Graduate Degree | 20 (100.0%) | 0 (0.0%) |
| Total | 33 (75.0%) | 11 (25.0%) |
Employment Characteristics in Suffern
Employment by Class of Employer in Suffern
Among the 5,806 employed individuals in Suffern, private company employees (3,750 | 64.6%), local government employees (590 | 10.2%), and not-for-profit organizations (502 | 8.6%) make up the most common classes of employment.
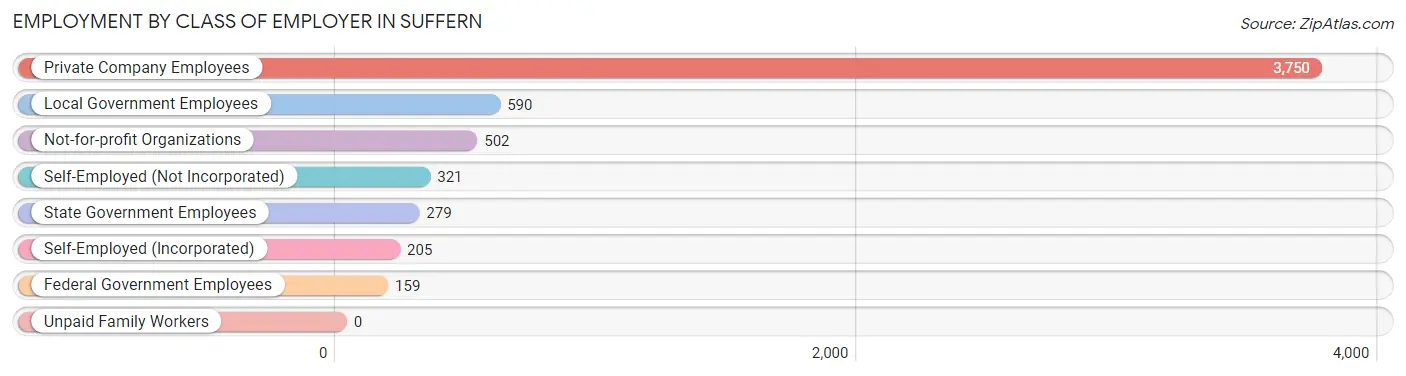
| Employer Class | # Employees | % Employees |
| Private Company Employees | 3,750 | 64.6% |
| Self-Employed (Incorporated) | 205 | 3.5% |
| Self-Employed (Not Incorporated) | 321 | 5.5% |
| Not-for-profit Organizations | 502 | 8.6% |
| Local Government Employees | 590 | 10.2% |
| State Government Employees | 279 | 4.8% |
| Federal Government Employees | 159 | 2.7% |
| Unpaid Family Workers | 0 | 0.0% |
| Total | 5,806 | 100.0% |
Employment Status by Age in Suffern
According to the labor force statistics for Suffern, out of the total population over 16 years of age (9,392), 67.4% or 6,330 individuals are in the labor force, with 5.5% or 348 of them unemployed. The age group with the highest labor force participation rate is 25 to 29 years, with 93.1% or 509 individuals in the labor force. Within the labor force, the 20 to 24 years age range has the highest percentage of unemployed individuals, with 20.6% or 109 of them being unemployed.
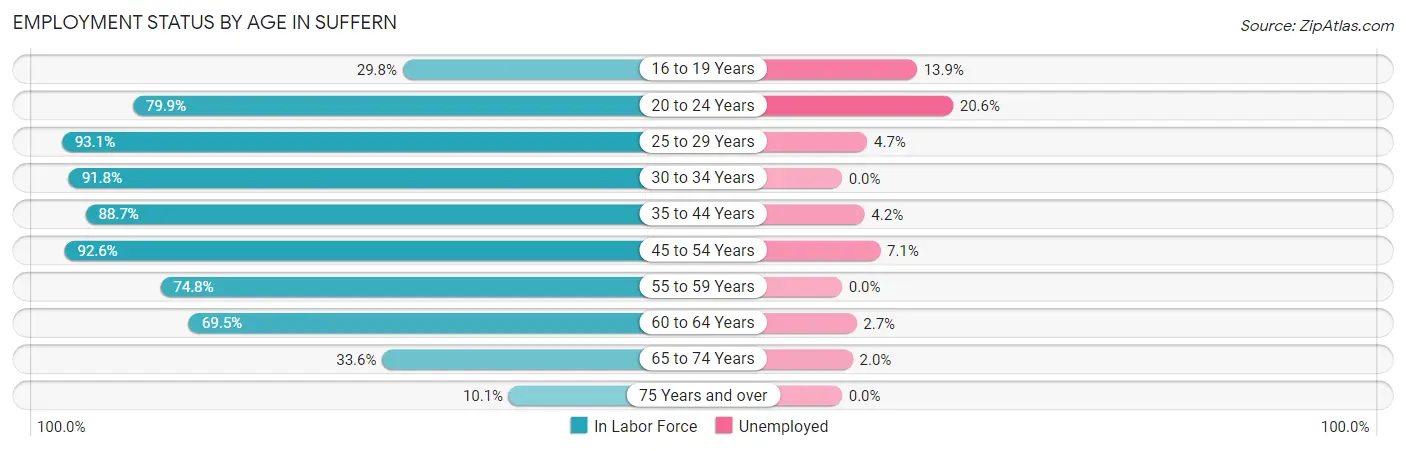
| Age Bracket | In Labor Force | Unemployed |
| 16 to 19 Years | 166 (29.8%) | 23 (13.9%) |
| 20 to 24 Years | 530 (79.9%) | 109 (20.6%) |
| 25 to 29 Years | 509 (93.1%) | 24 (4.7%) |
| 30 to 34 Years | 540 (91.8%) | 0 (0.0%) |
| 35 to 44 Years | 1,465 (88.7%) | 62 (4.2%) |
| 45 to 54 Years | 1,480 (92.6%) | 105 (7.1%) |
| 55 to 59 Years | 666 (74.8%) | 0 (0.0%) |
| 60 to 64 Years | 478 (69.5%) | 13 (2.7%) |
| 65 to 74 Years | 396 (33.6%) | 8 (2.0%) |
| 75 Years and over | 104 (10.1%) | 0 (0.0%) |
| Total | 6,330 (67.4%) | 348 (5.5%) |
Employment Status by Educational Attainment in Suffern
According to labor force statistics for Suffern, 86.2% of individuals (5,140) out of the total population between 25 and 64 years of age (5,963) are in the labor force, with 4.0% or 206 of them being unemployed. The group with the highest labor force participation rate are those with the educational attainment of bachelor's degree or higher, with 93.8% or 2,641 individuals in the labor force. Within the labor force, individuals with college / associate degree education have the highest percentage of unemployment, with 6.0% or 68 of them being unemployed.
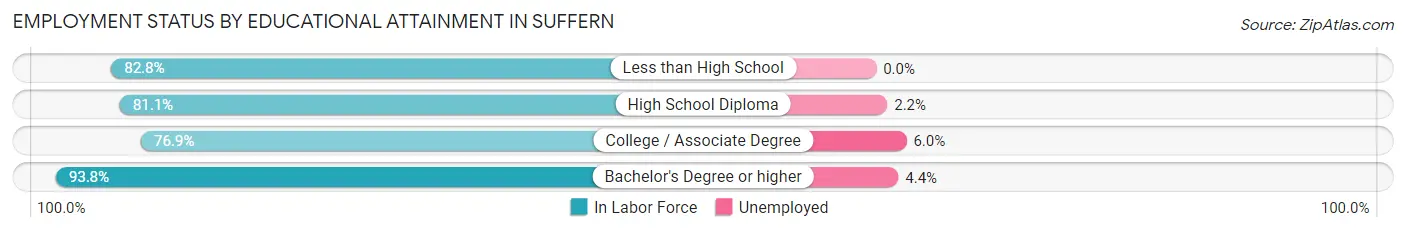
| Educational Attainment | In Labor Force | Unemployed |
| Less than High School | 360 (82.8%) | 0 (0.0%) |
| High School Diploma | 1,005 (81.1%) | 27 (2.2%) |
| College / Associate Degree | 1,133 (76.9%) | 88 (6.0%) |
| Bachelor's Degree or higher | 2,641 (93.8%) | 124 (4.4%) |
| Total | 5,140 (86.2%) | 239 (4.0%) |
Employment Occupations by Sex in Suffern
Management, Business, Science and Arts Occupations
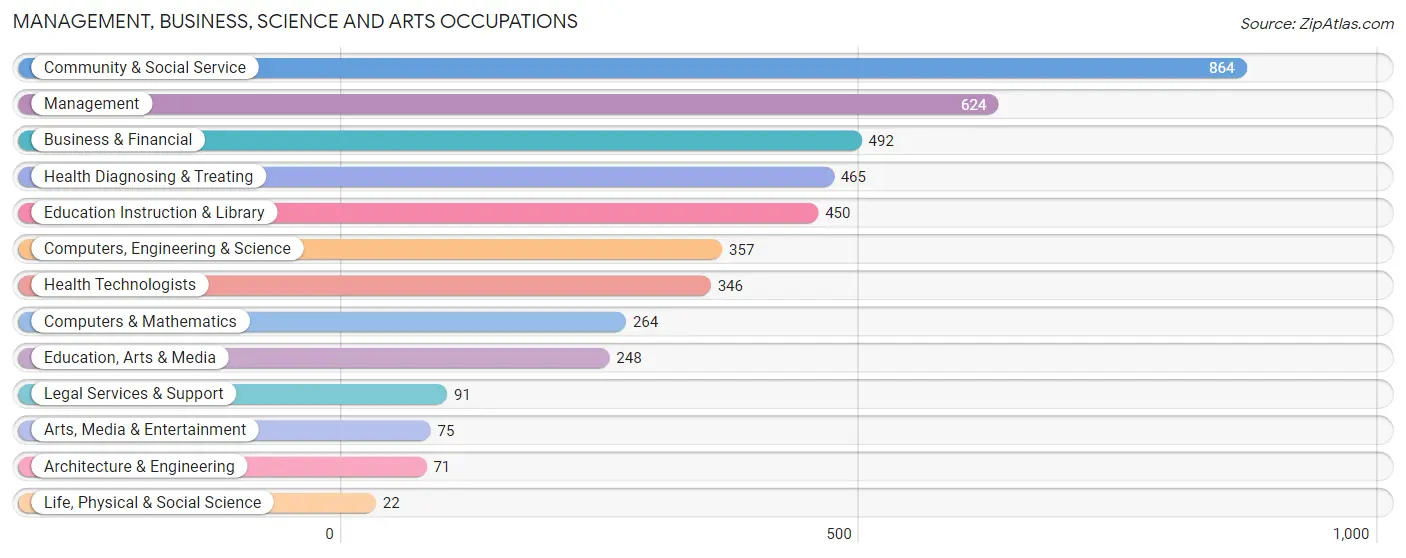
The most common Management, Business, Science and Arts occupations in Suffern are Community & Social Service (864 | 14.5%), Management (624 | 10.5%), Business & Financial (492 | 8.3%), Health Diagnosing & Treating (465 | 7.8%), and Education Instruction & Library (450 | 7.5%).
Management, Business, Science and Arts Occupations by Sex
Within the Management, Business, Science and Arts occupations in Suffern, the most male-oriented occupations are Architecture & Engineering (100.0%), Life, Physical & Social Science (95.5%), and Computers, Engineering & Science (76.2%), while the most female-oriented occupations are Education, Arts & Media (97.2%), Education Instruction & Library (86.9%), and Health Technologists (84.1%).
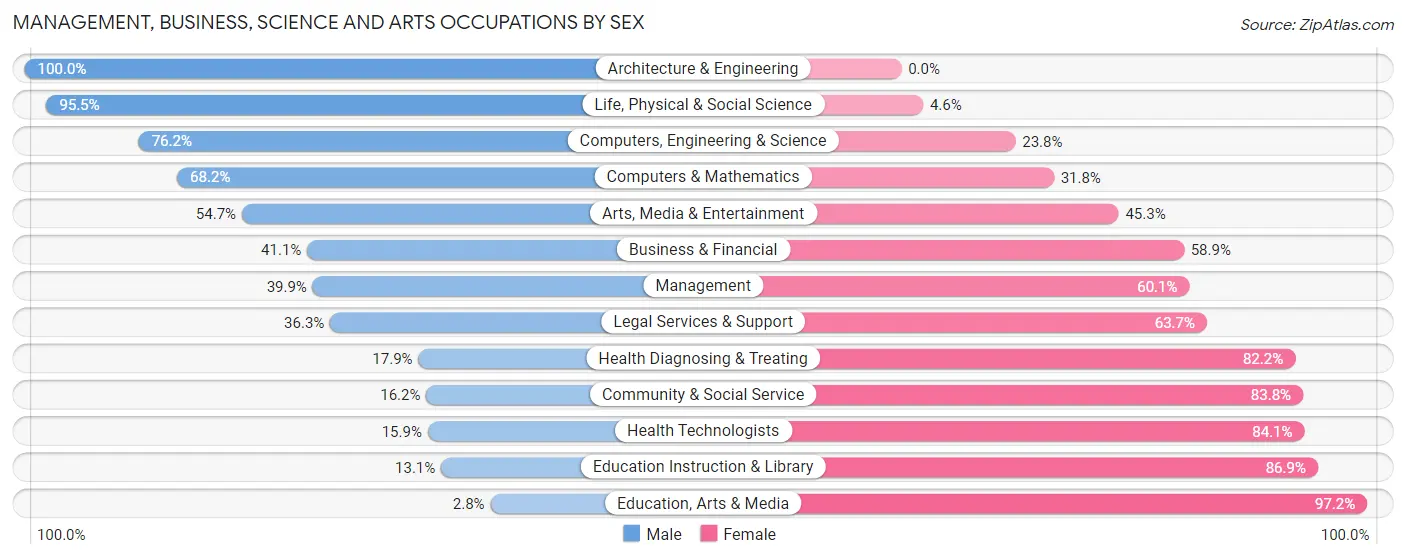
| Occupation | Male | Female |
| Management | 249 (39.9%) | 375 (60.1%) |
| Business & Financial | 202 (41.1%) | 290 (58.9%) |
| Computers, Engineering & Science | 272 (76.2%) | 85 (23.8%) |
| Computers & Mathematics | 180 (68.2%) | 84 (31.8%) |
| Architecture & Engineering | 71 (100.0%) | 0 (0.0%) |
| Life, Physical & Social Science | 21 (95.5%) | 1 (4.5%) |
| Community & Social Service | 140 (16.2%) | 724 (83.8%) |
| Education, Arts & Media | 7 (2.8%) | 241 (97.2%) |
| Legal Services & Support | 33 (36.3%) | 58 (63.7%) |
| Education Instruction & Library | 59 (13.1%) | 391 (86.9%) |
| Arts, Media & Entertainment | 41 (54.7%) | 34 (45.3%) |
| Health Diagnosing & Treating | 83 (17.8%) | 382 (82.2%) |
| Health Technologists | 55 (15.9%) | 291 (84.1%) |
| Total (Category) | 946 (33.8%) | 1,856 (66.2%) |
| Total (Overall) | 2,758 (46.3%) | 3,203 (53.7%) |
Services Occupations
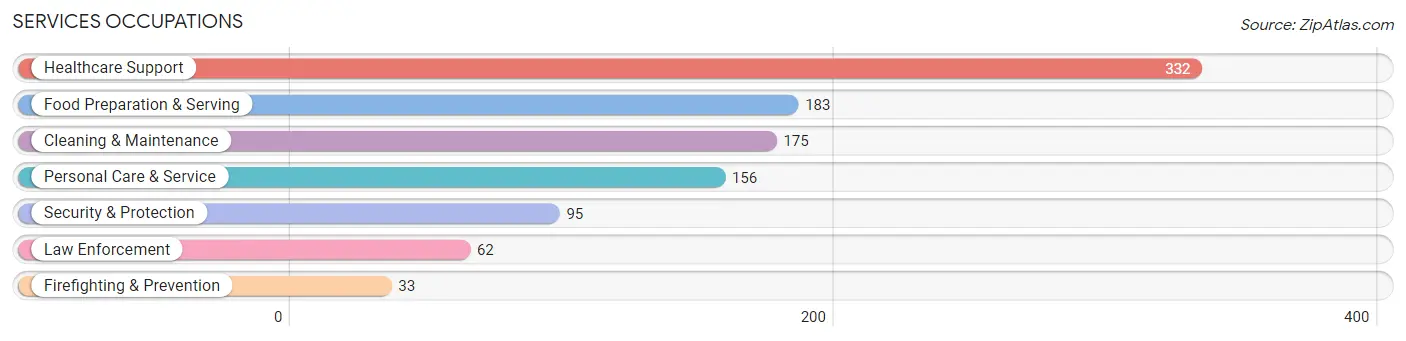
The most common Services occupations in Suffern are Healthcare Support (332 | 5.6%), Food Preparation & Serving (183 | 3.1%), Cleaning & Maintenance (175 | 2.9%), Personal Care & Service (156 | 2.6%), and Security & Protection (95 | 1.6%).
Services Occupations by Sex
Within the Services occupations in Suffern, the most male-oriented occupations are Law Enforcement (100.0%), Security & Protection (89.5%), and Firefighting & Prevention (69.7%), while the most female-oriented occupations are Personal Care & Service (82.7%), Healthcare Support (71.1%), and Cleaning & Maintenance (57.1%).
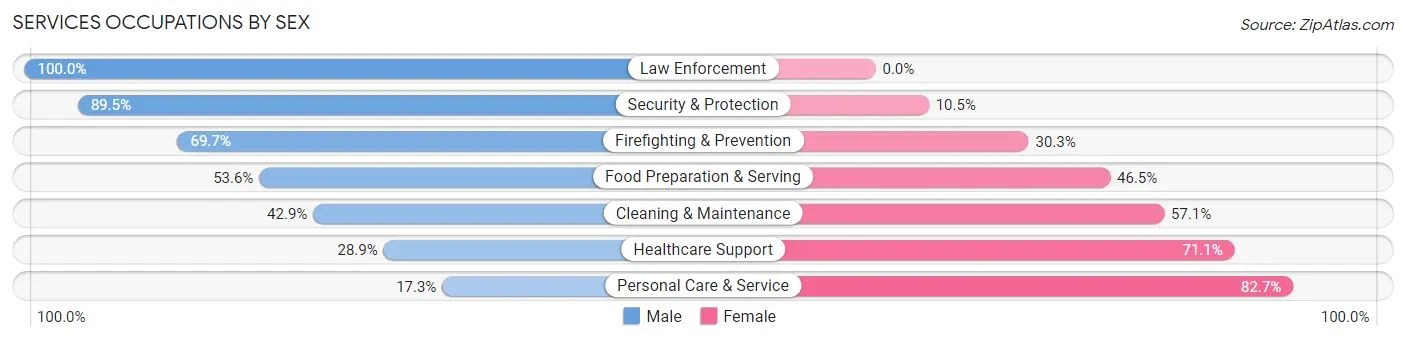
| Occupation | Male | Female |
| Healthcare Support | 96 (28.9%) | 236 (71.1%) |
| Security & Protection | 85 (89.5%) | 10 (10.5%) |
| Firefighting & Prevention | 23 (69.7%) | 10 (30.3%) |
| Law Enforcement | 62 (100.0%) | 0 (0.0%) |
| Food Preparation & Serving | 98 (53.5%) | 85 (46.5%) |
| Cleaning & Maintenance | 75 (42.9%) | 100 (57.1%) |
| Personal Care & Service | 27 (17.3%) | 129 (82.7%) |
| Total (Category) | 381 (40.5%) | 560 (59.5%) |
| Total (Overall) | 2,758 (46.3%) | 3,203 (53.7%) |
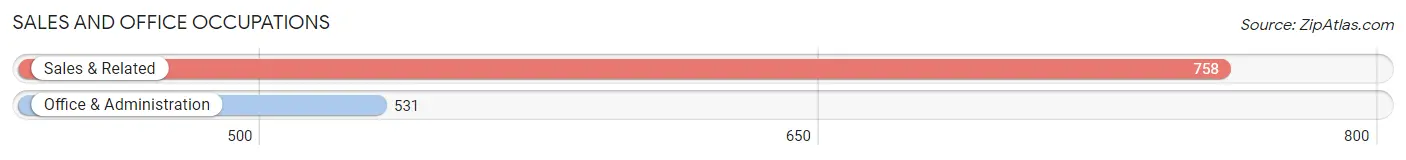
Sales and Office Occupations
The most common Sales and Office occupations in Suffern are Sales & Related (758 | 12.7%), and Office & Administration (531 | 8.9%).
Sales and Office Occupations by Sex
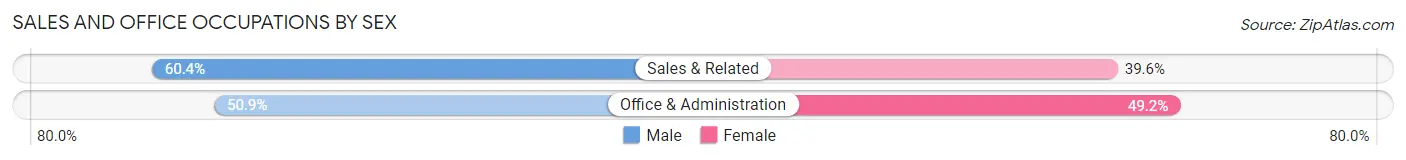
| Occupation | Male | Female |
| Sales & Related | 458 (60.4%) | 300 (39.6%) |
| Office & Administration | 270 (50.8%) | 261 (49.1%) |
| Total (Category) | 728 (56.5%) | 561 (43.5%) |
| Total (Overall) | 2,758 (46.3%) | 3,203 (53.7%) |
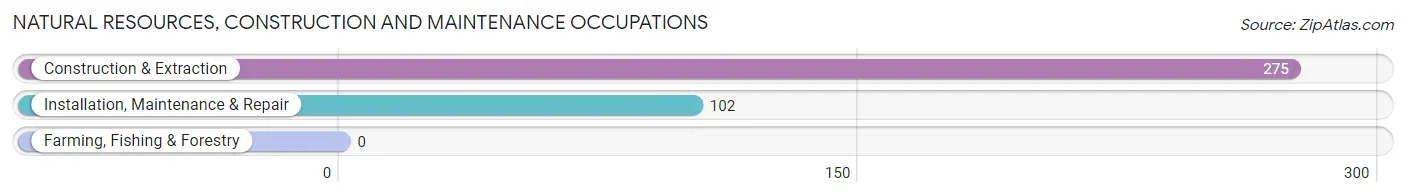
Natural Resources, Construction and Maintenance Occupations
The most common Natural Resources, Construction and Maintenance occupations in Suffern are Construction & Extraction (275 | 4.6%), and Installation, Maintenance & Repair (102 | 1.7%).
Natural Resources, Construction and Maintenance Occupations by Sex
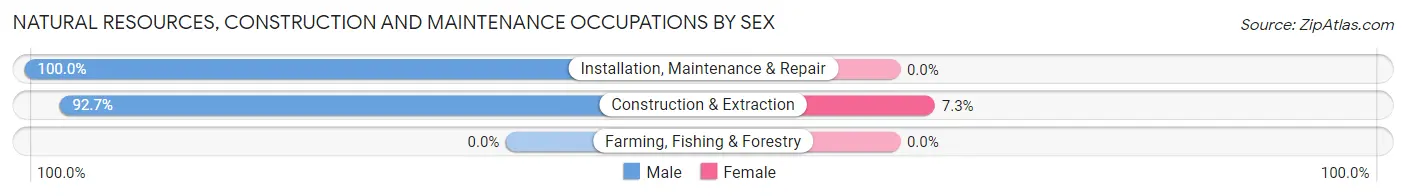
| Occupation | Male | Female |
| Farming, Fishing & Forestry | 0 (0.0%) | 0 (0.0%) |
| Construction & Extraction | 255 (92.7%) | 20 (7.3%) |
| Installation, Maintenance & Repair | 102 (100.0%) | 0 (0.0%) |
| Total (Category) | 357 (94.7%) | 20 (5.3%) |
| Total (Overall) | 2,758 (46.3%) | 3,203 (53.7%) |
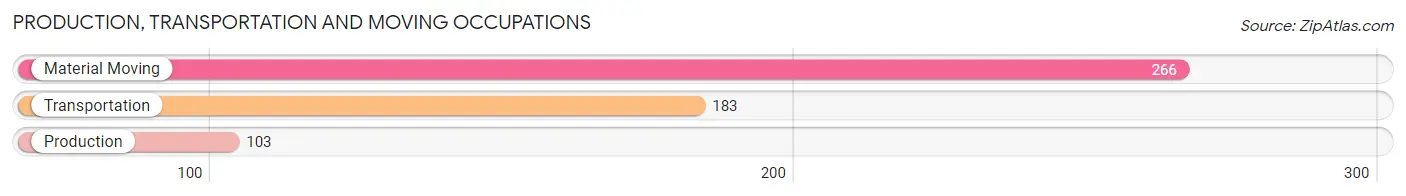
Production, Transportation and Moving Occupations
The most common Production, Transportation and Moving occupations in Suffern are Material Moving (266 | 4.5%), Transportation (183 | 3.1%), and Production (103 | 1.7%).
Production, Transportation and Moving Occupations by Sex
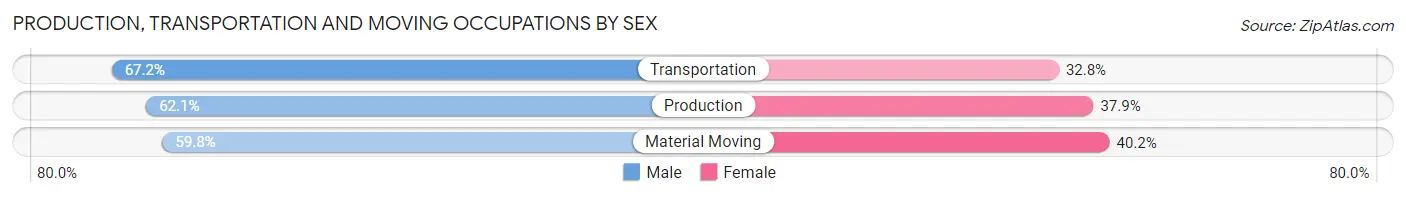
| Occupation | Male | Female |
| Production | 64 (62.1%) | 39 (37.9%) |
| Transportation | 123 (67.2%) | 60 (32.8%) |
| Material Moving | 159 (59.8%) | 107 (40.2%) |
| Total (Category) | 346 (62.7%) | 206 (37.3%) |
| Total (Overall) | 2,758 (46.3%) | 3,203 (53.7%) |
Employment Industries by Sex in Suffern
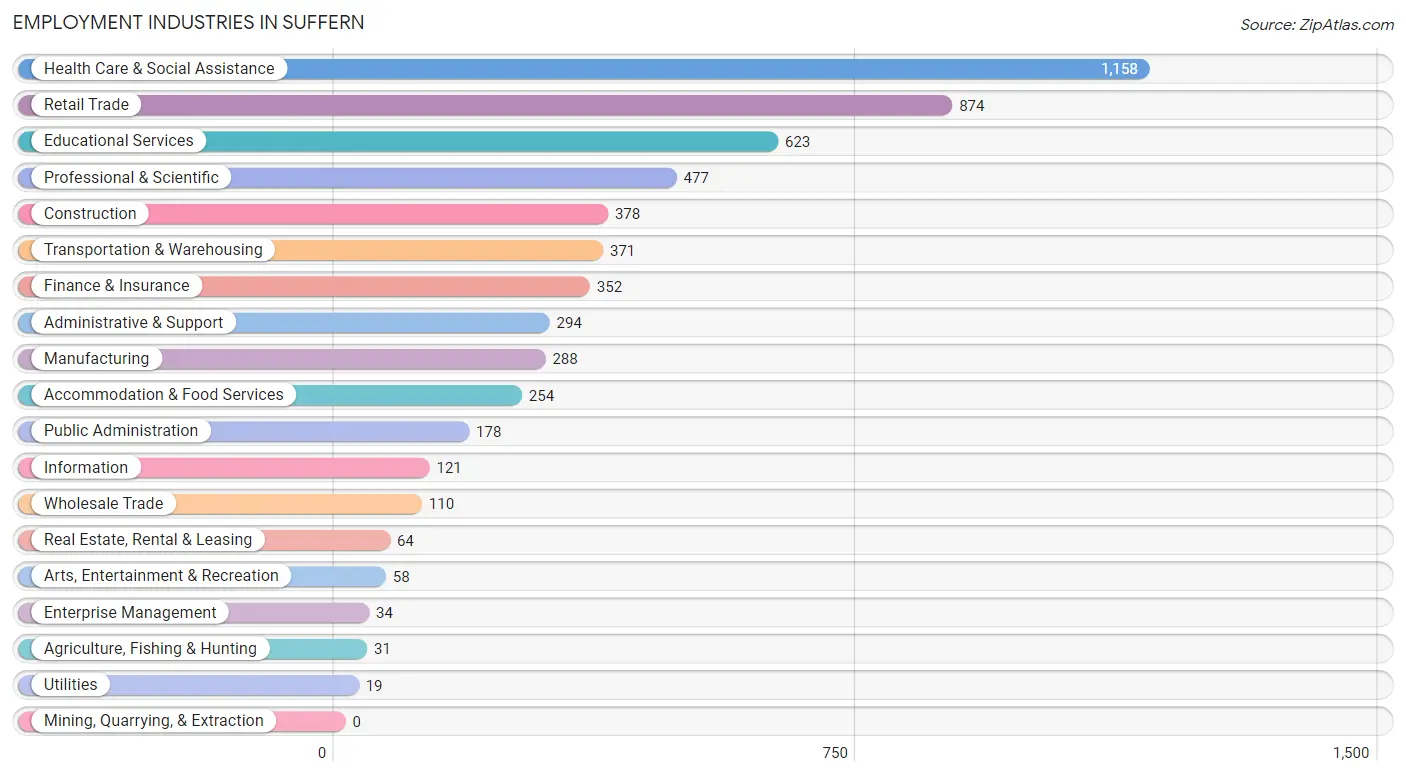
Employment Industries in Suffern
The major employment industries in Suffern include Health Care & Social Assistance (1,158 | 19.4%), Retail Trade (874 | 14.7%), Educational Services (623 | 10.4%), Professional & Scientific (477 | 8.0%), and Construction (378 | 6.3%).
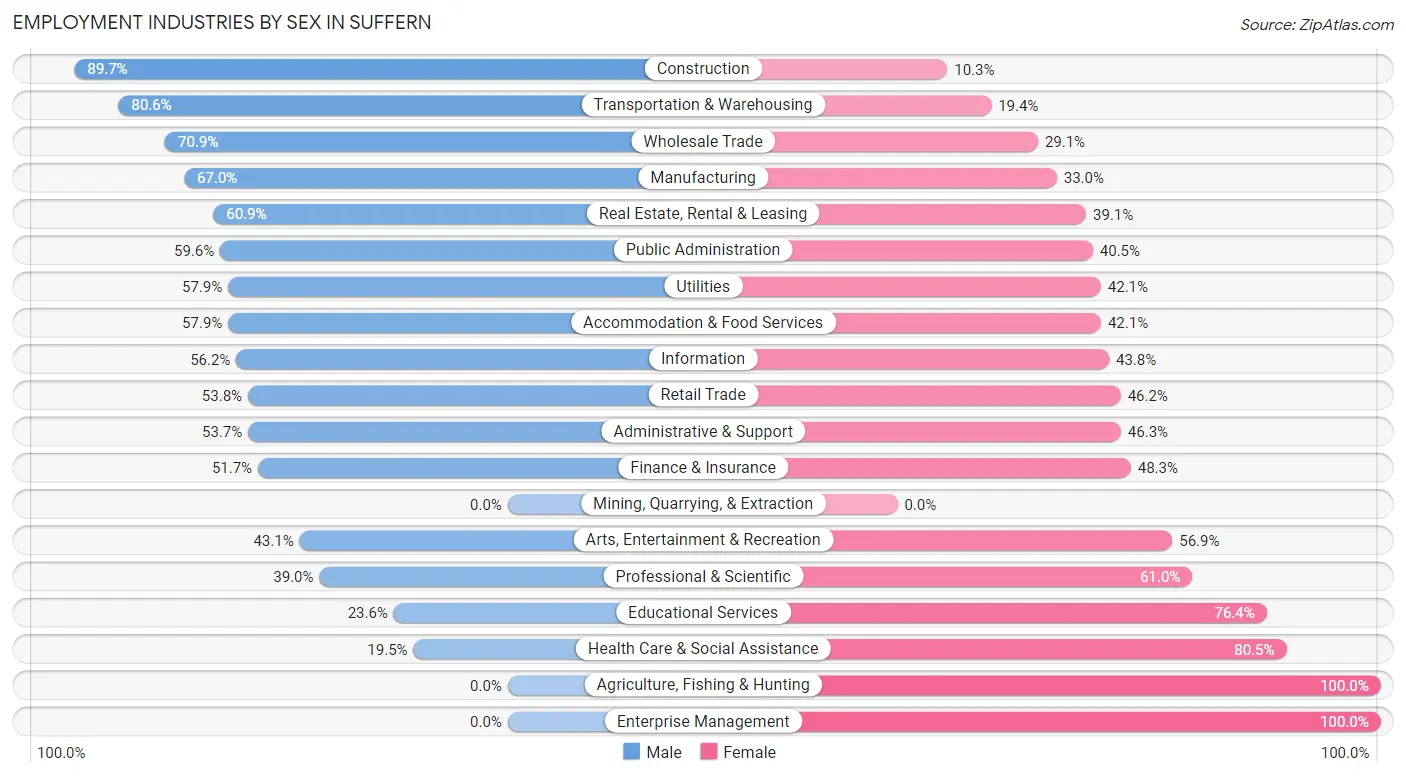
Employment Industries by Sex in Suffern
The Suffern industries that see more men than women are Construction (89.7%), Transportation & Warehousing (80.6%), and Wholesale Trade (70.9%), whereas the industries that tend to have a higher number of women are Agriculture, Fishing & Hunting (100.0%), Enterprise Management (100.0%), and Health Care & Social Assistance (80.5%).
| Industry | Male | Female |
| Agriculture, Fishing & Hunting | 0 (0.0%) | 31 (100.0%) |
| Mining, Quarrying, & Extraction | 0 (0.0%) | 0 (0.0%) |
| Construction | 339 (89.7%) | 39 (10.3%) |
| Manufacturing | 193 (67.0%) | 95 (33.0%) |
| Wholesale Trade | 78 (70.9%) | 32 (29.1%) |
| Retail Trade | 470 (53.8%) | 404 (46.2%) |
| Transportation & Warehousing | 299 (80.6%) | 72 (19.4%) |
| Utilities | 11 (57.9%) | 8 (42.1%) |
| Information | 68 (56.2%) | 53 (43.8%) |
| Finance & Insurance | 182 (51.7%) | 170 (48.3%) |
| Real Estate, Rental & Leasing | 39 (60.9%) | 25 (39.1%) |
| Professional & Scientific | 186 (39.0%) | 291 (61.0%) |
| Enterprise Management | 0 (0.0%) | 34 (100.0%) |
| Administrative & Support | 158 (53.7%) | 136 (46.3%) |
| Educational Services | 147 (23.6%) | 476 (76.4%) |
| Health Care & Social Assistance | 226 (19.5%) | 932 (80.5%) |
| Arts, Entertainment & Recreation | 25 (43.1%) | 33 (56.9%) |
| Accommodation & Food Services | 147 (57.9%) | 107 (42.1%) |
| Public Administration | 106 (59.6%) | 72 (40.5%) |
| Total | 2,758 (46.3%) | 3,203 (53.7%) |
Education in Suffern
School Enrollment in Suffern
The most common levels of schooling among the 2,833 students in Suffern are college / undergraduate (629 | 22.2%), high school (620 | 21.9%), and middle school (523 | 18.5%).
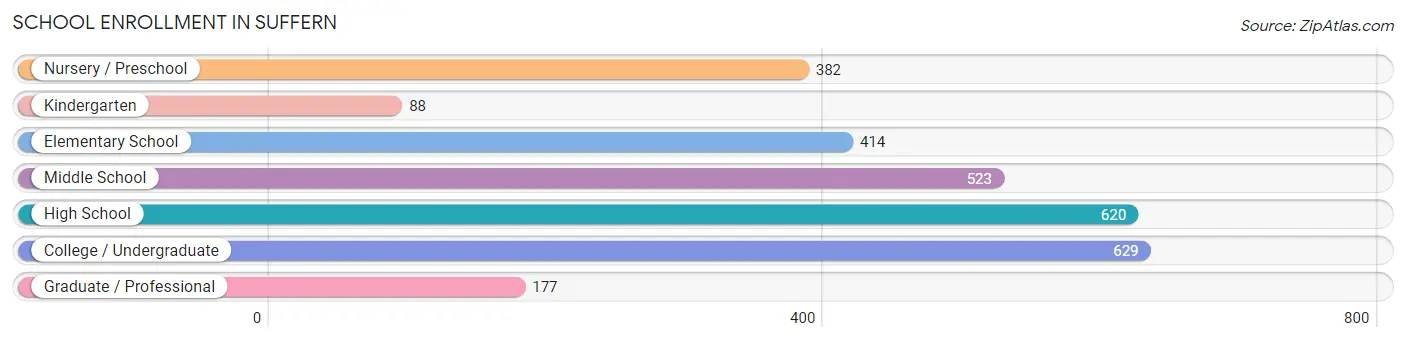
| School Level | # Students | % Students |
| Nursery / Preschool | 382 | 13.5% |
| Kindergarten | 88 | 3.1% |
| Elementary School | 414 | 14.6% |
| Middle School | 523 | 18.5% |
| High School | 620 | 21.9% |
| College / Undergraduate | 629 | 22.2% |
| Graduate / Professional | 177 | 6.2% |
| Total | 2,833 | 100.0% |
School Enrollment by Age by Funding Source in Suffern
Out of a total of 2,833 students who are enrolled in schools in Suffern, 632 (22.3%) attend a private institution, while the remaining 2,201 (77.7%) are enrolled in public schools. The age group of 18 to 19 year olds has the highest likelihood of being enrolled in private schools, with 101 (55.5% in the age bracket) enrolled. Conversely, the age group of 15 to 17 year olds has the lowest likelihood of being enrolled in a private school, with 494 (100.0% in the age bracket) attending a public institution.
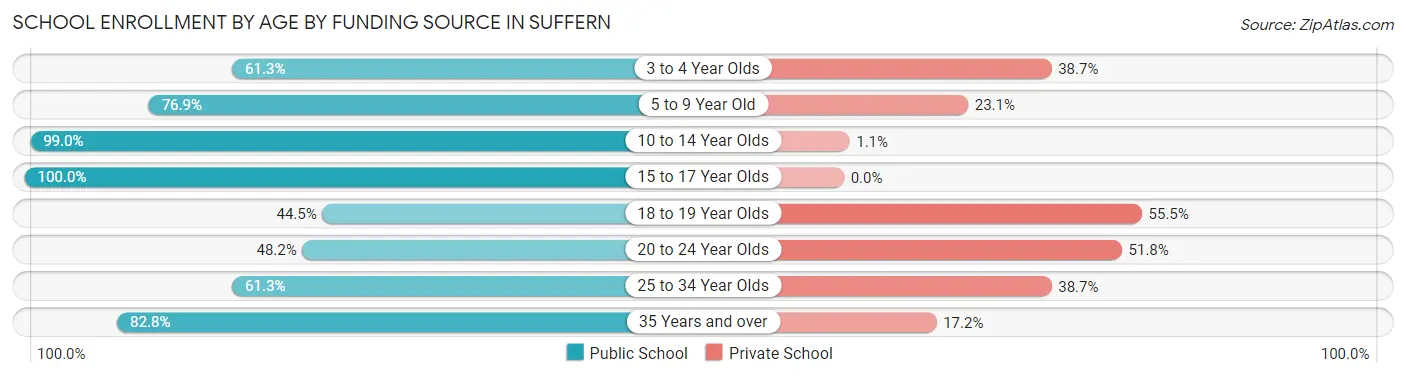
| Age Bracket | Public School | Private School |
| 3 to 4 Year Olds | 165 (61.3%) | 104 (38.7%) |
| 5 to 9 Year Old | 429 (76.9%) | 129 (23.1%) |
| 10 to 14 Year Olds | 659 (99.0%) | 7 (1.1%) |
| 15 to 17 Year Olds | 494 (100.0%) | 0 (0.0%) |
| 18 to 19 Year Olds | 81 (44.5%) | 101 (55.5%) |
| 20 to 24 Year Olds | 191 (48.2%) | 205 (51.8%) |
| 25 to 34 Year Olds | 111 (61.3%) | 70 (38.7%) |
| 35 Years and over | 72 (82.8%) | 15 (17.2%) |
| Total | 2,201 (77.7%) | 632 (22.3%) |
Educational Attainment by Field of Study in Suffern
Business (781 | 19.1%), science & technology (472 | 11.6%), education (419 | 10.3%), bio, nature & agricultural (320 | 7.8%), and social sciences (320 | 7.8%) are the most common fields of study among 4,084 individuals in Suffern who have obtained a bachelor's degree or higher.
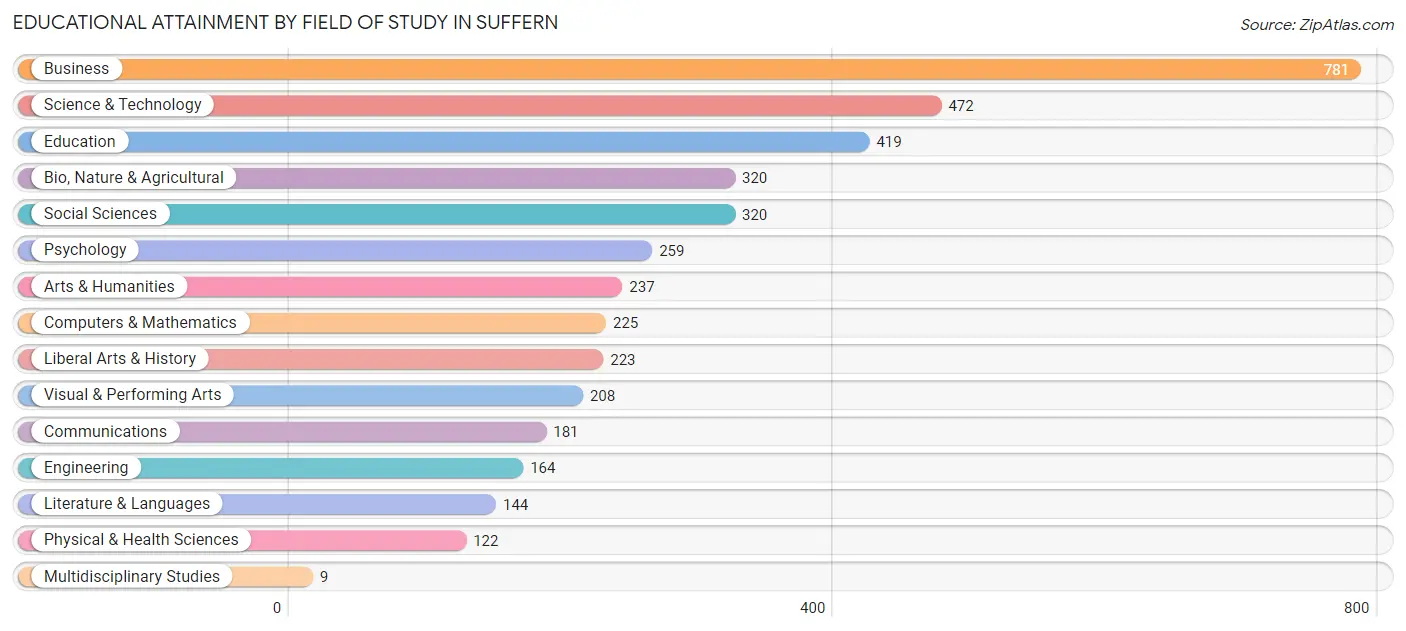
| Field of Study | # Graduates | % Graduates |
| Computers & Mathematics | 225 | 5.5% |
| Bio, Nature & Agricultural | 320 | 7.8% |
| Physical & Health Sciences | 122 | 3.0% |
| Psychology | 259 | 6.3% |
| Social Sciences | 320 | 7.8% |
| Engineering | 164 | 4.0% |
| Multidisciplinary Studies | 9 | 0.2% |
| Science & Technology | 472 | 11.6% |
| Business | 781 | 19.1% |
| Education | 419 | 10.3% |
| Literature & Languages | 144 | 3.5% |
| Liberal Arts & History | 223 | 5.5% |
| Visual & Performing Arts | 208 | 5.1% |
| Communications | 181 | 4.4% |
| Arts & Humanities | 237 | 5.8% |
| Total | 4,084 | 100.0% |
Transportation & Commute in Suffern
Vehicle Availability by Sex in Suffern
The most prevalent vehicle ownership categories in Suffern are males with 2 vehicles (1,269, accounting for 46.8%) and females with 2 vehicles (1,372, making up 41.6%).
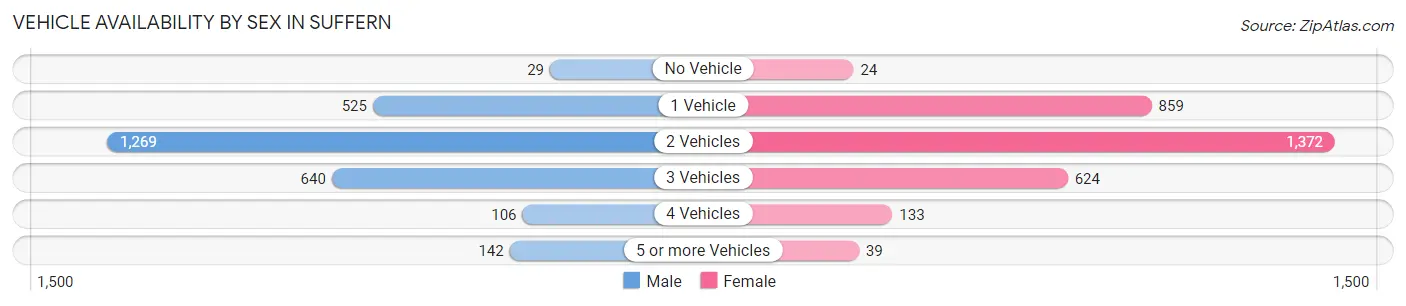
| Vehicles Available | Male | Female |
| No Vehicle | 29 (1.1%) | 24 (0.8%) |
| 1 Vehicle | 525 (19.4%) | 859 (28.1%) |
| 2 Vehicles | 1,269 (46.8%) | 1,372 (45.0%) |
| 3 Vehicles | 640 (23.6%) | 624 (20.4%) |
| 4 Vehicles | 106 (3.9%) | 133 (4.4%) |
| 5 or more Vehicles | 142 (5.2%) | 39 (1.3%) |
| Total | 2,711 (100.0%) | 3,051 (100.0%) |
Commute Time in Suffern
The most frequently occuring commute durations in Suffern are 30 to 34 minutes (840 commuters, 15.9%), 5 to 9 minutes (645 commuters, 12.2%), and 20 to 24 minutes (640 commuters, 12.1%).
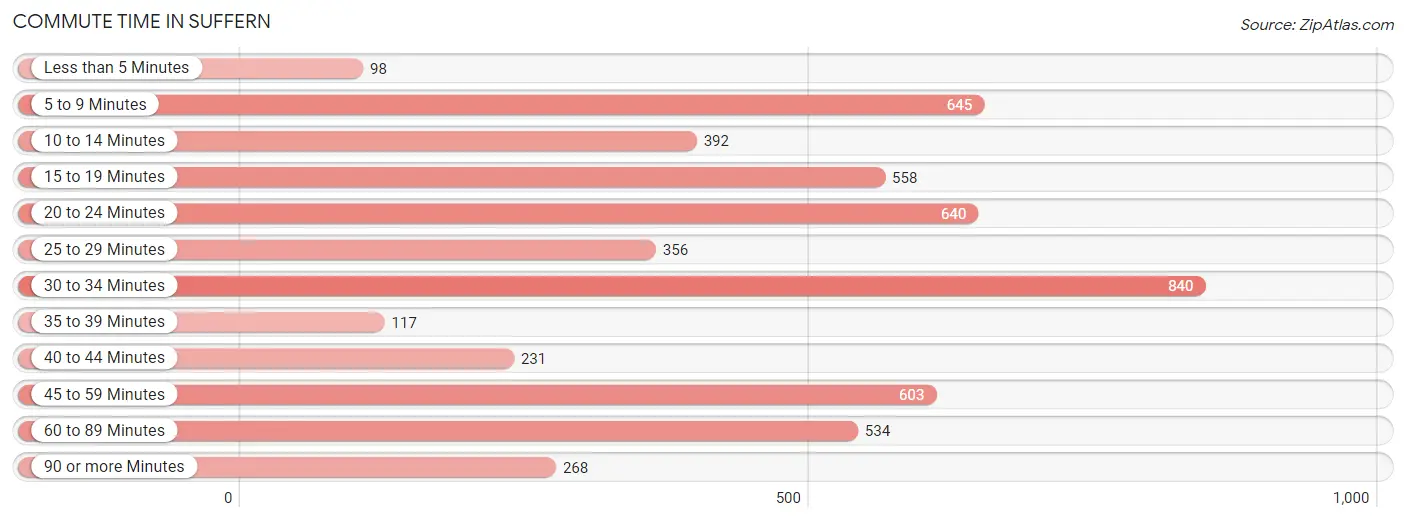
| Commute Time | # Commuters | % Commuters |
| Less than 5 Minutes | 98 | 1.9% |
| 5 to 9 Minutes | 645 | 12.2% |
| 10 to 14 Minutes | 392 | 7.4% |
| 15 to 19 Minutes | 558 | 10.6% |
| 20 to 24 Minutes | 640 | 12.1% |
| 25 to 29 Minutes | 356 | 6.7% |
| 30 to 34 Minutes | 840 | 15.9% |
| 35 to 39 Minutes | 117 | 2.2% |
| 40 to 44 Minutes | 231 | 4.4% |
| 45 to 59 Minutes | 603 | 11.4% |
| 60 to 89 Minutes | 534 | 10.1% |
| 90 or more Minutes | 268 | 5.1% |
Commute Time by Sex in Suffern
The most common commute times in Suffern are 15 to 19 minutes (398 commuters, 15.8%) for males and 30 to 34 minutes (513 commuters, 18.5%) for females.
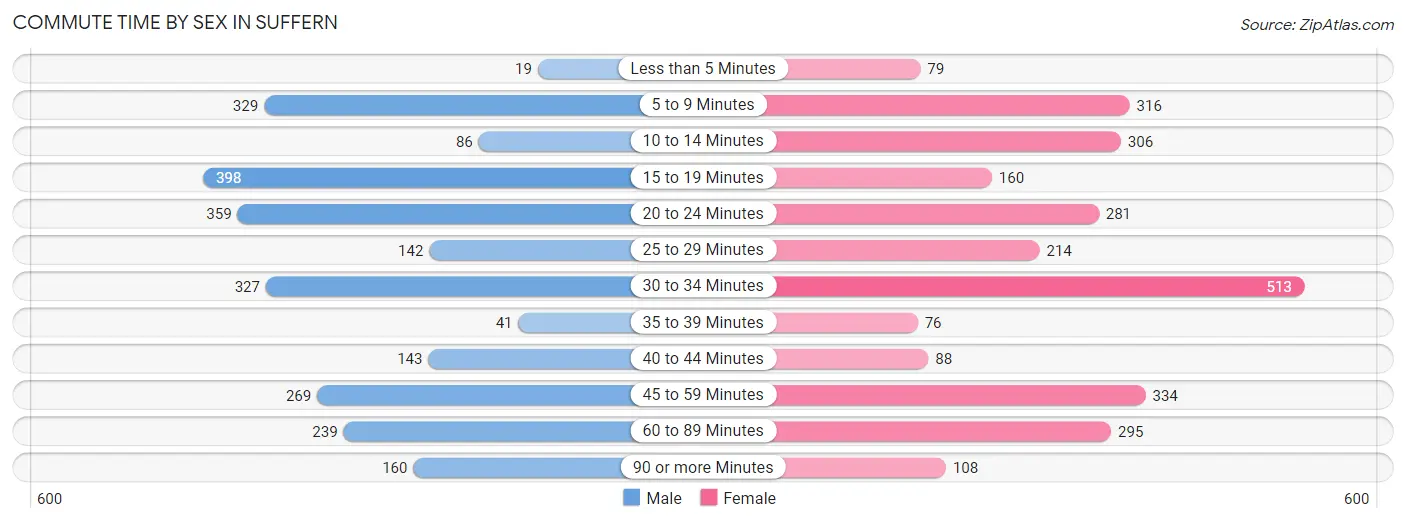
| Commute Time | Male | Female |
| Less than 5 Minutes | 19 (0.8%) | 79 (2.9%) |
| 5 to 9 Minutes | 329 (13.1%) | 316 (11.4%) |
| 10 to 14 Minutes | 86 (3.4%) | 306 (11.1%) |
| 15 to 19 Minutes | 398 (15.8%) | 160 (5.8%) |
| 20 to 24 Minutes | 359 (14.3%) | 281 (10.1%) |
| 25 to 29 Minutes | 142 (5.7%) | 214 (7.7%) |
| 30 to 34 Minutes | 327 (13.0%) | 513 (18.5%) |
| 35 to 39 Minutes | 41 (1.6%) | 76 (2.7%) |
| 40 to 44 Minutes | 143 (5.7%) | 88 (3.2%) |
| 45 to 59 Minutes | 269 (10.7%) | 334 (12.1%) |
| 60 to 89 Minutes | 239 (9.5%) | 295 (10.6%) |
| 90 or more Minutes | 160 (6.4%) | 108 (3.9%) |
Time of Departure to Work by Sex in Suffern
The most frequent times of departure to work in Suffern are 6:00 AM to 6:29 AM (369, 14.7%) for males and 7:00 AM to 7:29 AM (467, 16.9%) for females.
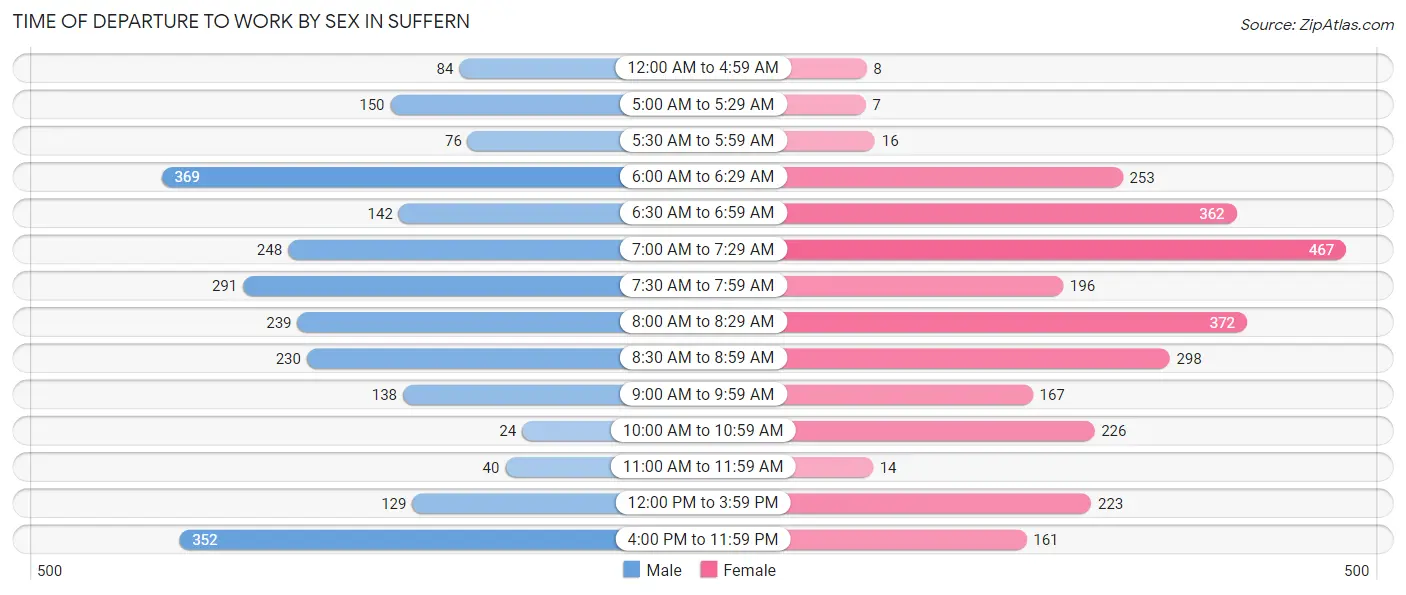
| Time of Departure | Male | Female |
| 12:00 AM to 4:59 AM | 84 (3.3%) | 8 (0.3%) |
| 5:00 AM to 5:29 AM | 150 (6.0%) | 7 (0.3%) |
| 5:30 AM to 5:59 AM | 76 (3.0%) | 16 (0.6%) |
| 6:00 AM to 6:29 AM | 369 (14.7%) | 253 (9.1%) |
| 6:30 AM to 6:59 AM | 142 (5.7%) | 362 (13.1%) |
| 7:00 AM to 7:29 AM | 248 (9.9%) | 467 (16.9%) |
| 7:30 AM to 7:59 AM | 291 (11.6%) | 196 (7.1%) |
| 8:00 AM to 8:29 AM | 239 (9.5%) | 372 (13.4%) |
| 8:30 AM to 8:59 AM | 230 (9.2%) | 298 (10.8%) |
| 9:00 AM to 9:59 AM | 138 (5.5%) | 167 (6.0%) |
| 10:00 AM to 10:59 AM | 24 (1.0%) | 226 (8.2%) |
| 11:00 AM to 11:59 AM | 40 (1.6%) | 14 (0.5%) |
| 12:00 PM to 3:59 PM | 129 (5.1%) | 223 (8.1%) |
| 4:00 PM to 11:59 PM | 352 (14.0%) | 161 (5.8%) |
| Total | 2,512 (100.0%) | 2,770 (100.0%) |
Housing Occupancy in Suffern
Occupancy by Ownership in Suffern
Of the total 4,663 dwellings in Suffern, owner-occupied units account for 3,223 (69.1%), while renter-occupied units make up 1,440 (30.9%).
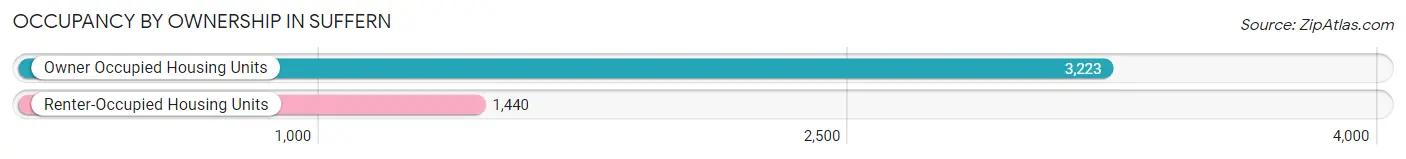
| Occupancy | # Housing Units | % Housing Units |
| Owner Occupied Housing Units | 3,223 | 69.1% |
| Renter-Occupied Housing Units | 1,440 | 30.9% |
| Total Occupied Housing Units | 4,663 | 100.0% |
Occupancy by Household Size in Suffern
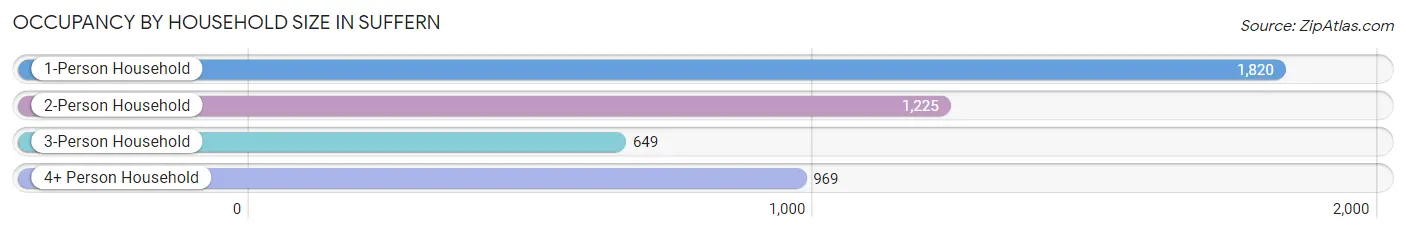
| Household Size | # Housing Units | % Housing Units |
| 1-Person Household | 1,820 | 39.0% |
| 2-Person Household | 1,225 | 26.3% |
| 3-Person Household | 649 | 13.9% |
| 4+ Person Household | 969 | 20.8% |
| Total Housing Units | 4,663 | 100.0% |
Occupancy by Ownership by Household Size in Suffern
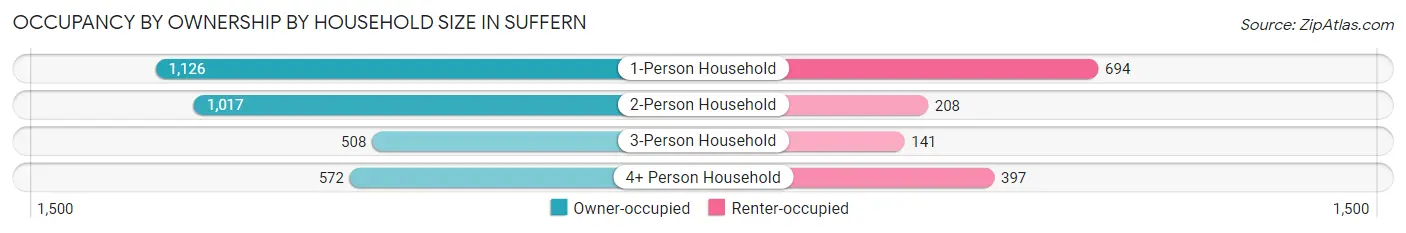
| Household Size | Owner-occupied | Renter-occupied |
| 1-Person Household | 1,126 (61.9%) | 694 (38.1%) |
| 2-Person Household | 1,017 (83.0%) | 208 (17.0%) |
| 3-Person Household | 508 (78.3%) | 141 (21.7%) |
| 4+ Person Household | 572 (59.0%) | 397 (41.0%) |
| Total Housing Units | 3,223 (69.1%) | 1,440 (30.9%) |
Occupancy by Educational Attainment in Suffern
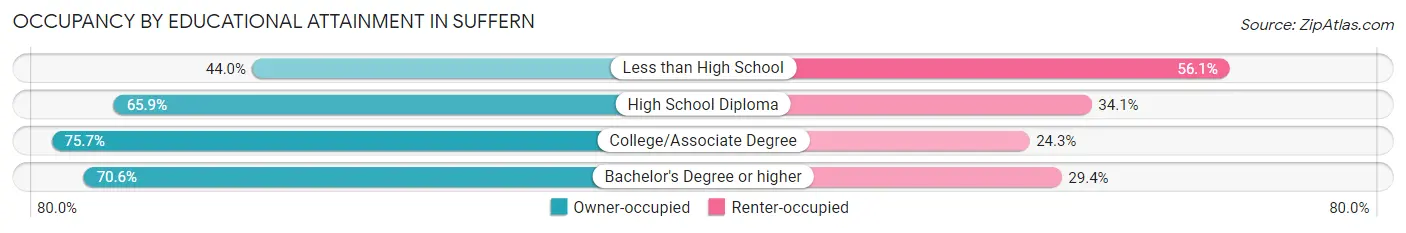
| Household Size | Owner-occupied | Renter-occupied |
| Less than High School | 149 (44.0%) | 190 (56.0%) |
| High School Diploma | 517 (65.9%) | 268 (34.1%) |
| College/Associate Degree | 858 (75.7%) | 275 (24.3%) |
| Bachelor's Degree or higher | 1,699 (70.6%) | 707 (29.4%) |
Occupancy by Age of Householder in Suffern
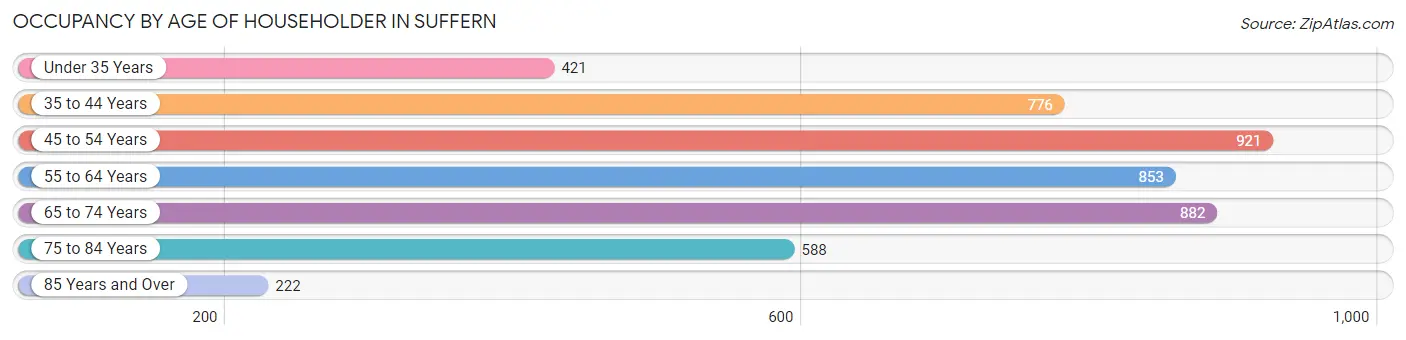
| Age Bracket | # Households | % Households |
| Under 35 Years | 421 | 9.0% |
| 35 to 44 Years | 776 | 16.6% |
| 45 to 54 Years | 921 | 19.8% |
| 55 to 64 Years | 853 | 18.3% |
| 65 to 74 Years | 882 | 18.9% |
| 75 to 84 Years | 588 | 12.6% |
| 85 Years and Over | 222 | 4.8% |
| Total | 4,663 | 100.0% |
Housing Finances in Suffern
Median Income by Occupancy in Suffern
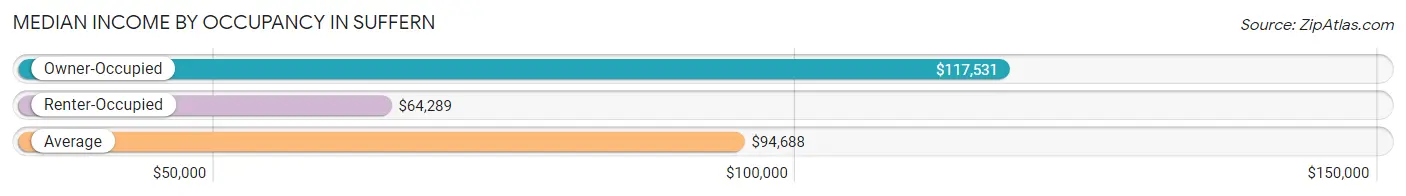
| Occupancy Type | # Households | Median Income |
| Owner-Occupied | 3,223 (69.1%) | $117,531 |
| Renter-Occupied | 1,440 (30.9%) | $64,289 |
| Average | 4,663 (100.0%) | $94,688 |
Occupancy by Householder Income Bracket in Suffern
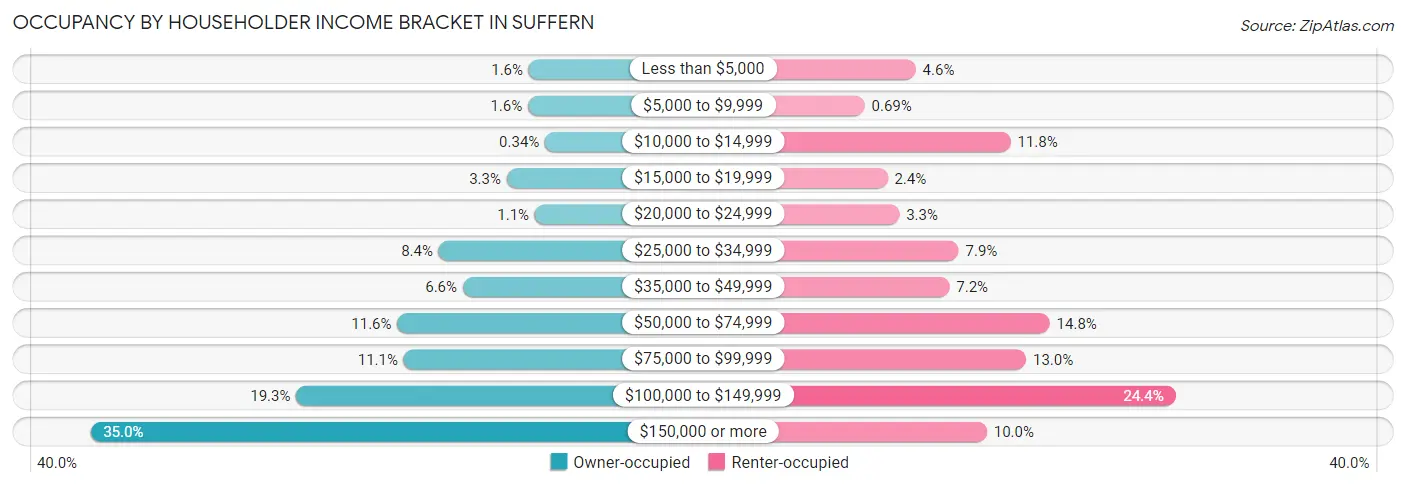
| Income Bracket | Owner-occupied | Renter-occupied |
| Less than $5,000 | 51 (1.6%) | 66 (4.6%) |
| $5,000 to $9,999 | 53 (1.6%) | 10 (0.7%) |
| $10,000 to $14,999 | 11 (0.3%) | 170 (11.8%) |
| $15,000 to $19,999 | 105 (3.3%) | 35 (2.4%) |
| $20,000 to $24,999 | 36 (1.1%) | 48 (3.3%) |
| $25,000 to $34,999 | 272 (8.4%) | 113 (7.9%) |
| $35,000 to $49,999 | 213 (6.6%) | 103 (7.1%) |
| $50,000 to $74,999 | 374 (11.6%) | 213 (14.8%) |
| $75,000 to $99,999 | 358 (11.1%) | 187 (13.0%) |
| $100,000 to $149,999 | 622 (19.3%) | 351 (24.4%) |
| $150,000 or more | 1,128 (35.0%) | 144 (10.0%) |
| Total | 3,223 (100.0%) | 1,440 (100.0%) |
Monthly Housing Cost Tiers in Suffern
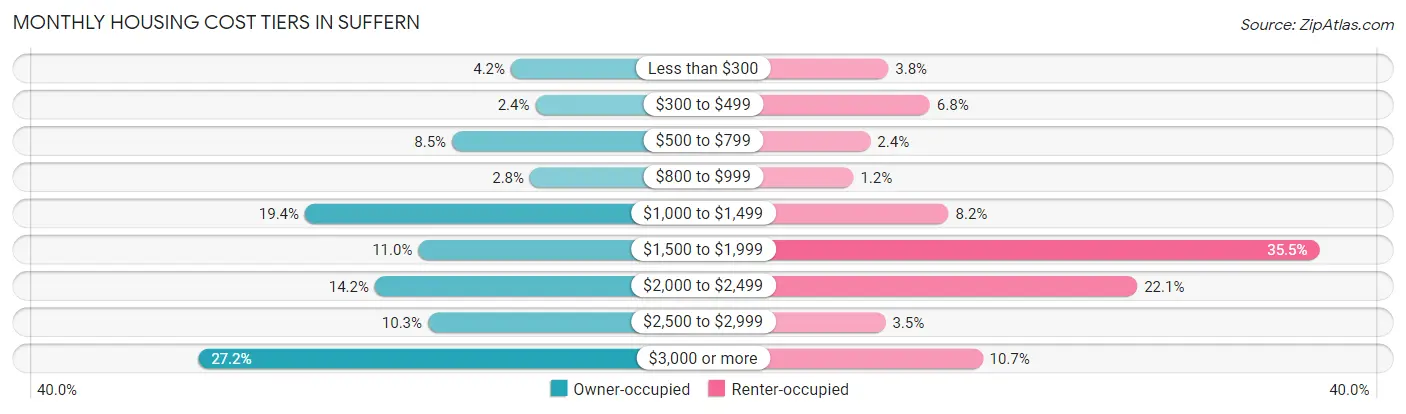
| Monthly Cost | Owner-occupied | Renter-occupied |
| Less than $300 | 135 (4.2%) | 54 (3.7%) |
| $300 to $499 | 77 (2.4%) | 98 (6.8%) |
| $500 to $799 | 275 (8.5%) | 35 (2.4%) |
| $800 to $999 | 90 (2.8%) | 17 (1.2%) |
| $1,000 to $1,499 | 624 (19.4%) | 118 (8.2%) |
| $1,500 to $1,999 | 355 (11.0%) | 511 (35.5%) |
| $2,000 to $2,499 | 458 (14.2%) | 318 (22.1%) |
| $2,500 to $2,999 | 332 (10.3%) | 51 (3.5%) |
| $3,000 or more | 877 (27.2%) | 154 (10.7%) |
| Total | 3,223 (100.0%) | 1,440 (100.0%) |
Physical Housing Characteristics in Suffern
Housing Structures in Suffern
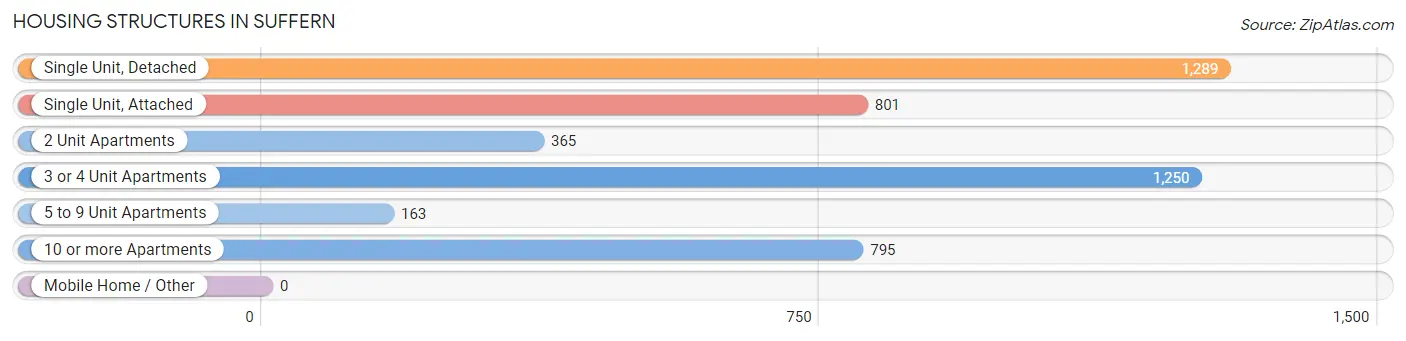
| Structure Type | # Housing Units | % Housing Units |
| Single Unit, Detached | 1,289 | 27.6% |
| Single Unit, Attached | 801 | 17.2% |
| 2 Unit Apartments | 365 | 7.8% |
| 3 or 4 Unit Apartments | 1,250 | 26.8% |
| 5 to 9 Unit Apartments | 163 | 3.5% |
| 10 or more Apartments | 795 | 17.1% |
| Mobile Home / Other | 0 | 0.0% |
| Total | 4,663 | 100.0% |
Housing Structures by Occupancy in Suffern
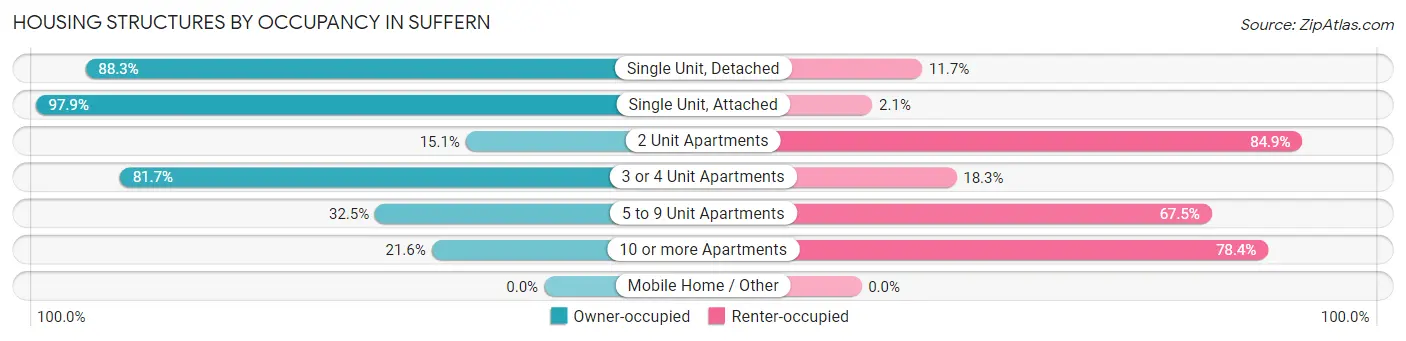
| Structure Type | Owner-occupied | Renter-occupied |
| Single Unit, Detached | 1,138 (88.3%) | 151 (11.7%) |
| Single Unit, Attached | 784 (97.9%) | 17 (2.1%) |
| 2 Unit Apartments | 55 (15.1%) | 310 (84.9%) |
| 3 or 4 Unit Apartments | 1,021 (81.7%) | 229 (18.3%) |
| 5 to 9 Unit Apartments | 53 (32.5%) | 110 (67.5%) |
| 10 or more Apartments | 172 (21.6%) | 623 (78.4%) |
| Mobile Home / Other | 0 (0.0%) | 0 (0.0%) |
| Total | 3,223 (69.1%) | 1,440 (30.9%) |
Housing Structures by Number of Rooms in Suffern
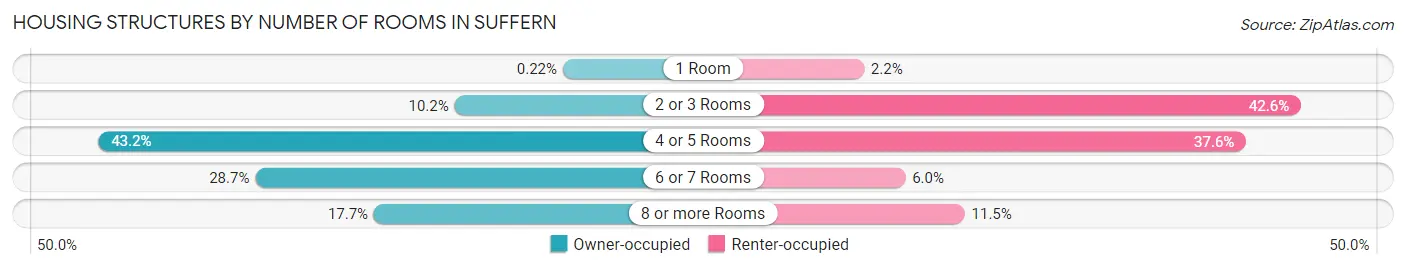
| Number of Rooms | Owner-occupied | Renter-occupied |
| 1 Room | 7 (0.2%) | 32 (2.2%) |
| 2 or 3 Rooms | 330 (10.2%) | 614 (42.6%) |
| 4 or 5 Rooms | 1,392 (43.2%) | 541 (37.6%) |
| 6 or 7 Rooms | 924 (28.7%) | 87 (6.0%) |
| 8 or more Rooms | 570 (17.7%) | 166 (11.5%) |
| Total | 3,223 (100.0%) | 1,440 (100.0%) |
Housing Structure by Heating Type in Suffern
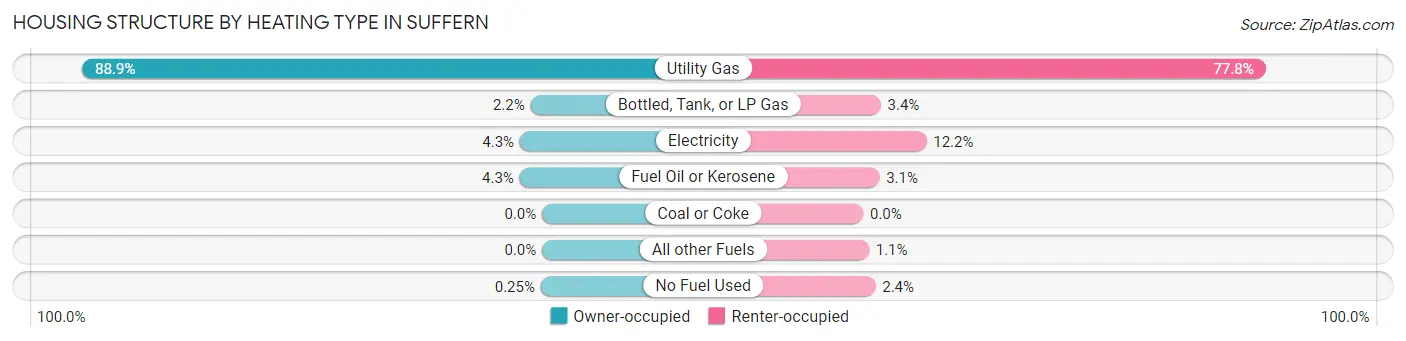
| Heating Type | Owner-occupied | Renter-occupied |
| Utility Gas | 2,865 (88.9%) | 1,120 (77.8%) |
| Bottled, Tank, or LP Gas | 72 (2.2%) | 49 (3.4%) |
| Electricity | 138 (4.3%) | 176 (12.2%) |
| Fuel Oil or Kerosene | 140 (4.3%) | 45 (3.1%) |
| Coal or Coke | 0 (0.0%) | 0 (0.0%) |
| All other Fuels | 0 (0.0%) | 16 (1.1%) |
| No Fuel Used | 8 (0.3%) | 34 (2.4%) |
| Total | 3,223 (100.0%) | 1,440 (100.0%) |
Household Vehicle Usage in Suffern
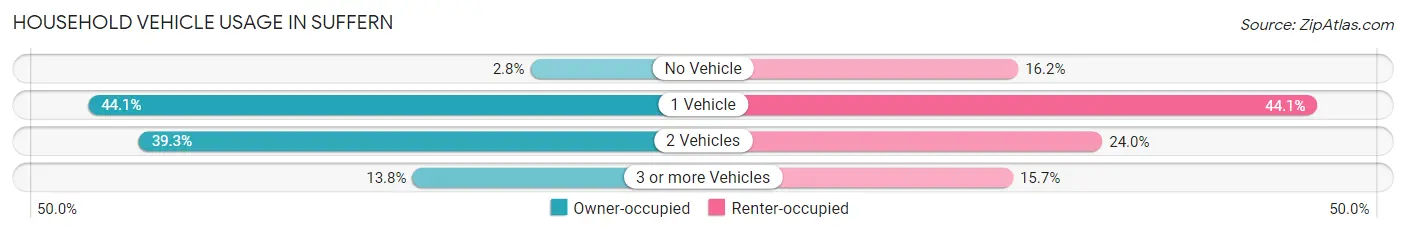
| Vehicles per Household | Owner-occupied | Renter-occupied |
| No Vehicle | 90 (2.8%) | 233 (16.2%) |
| 1 Vehicle | 1,420 (44.1%) | 635 (44.1%) |
| 2 Vehicles | 1,268 (39.3%) | 346 (24.0%) |
| 3 or more Vehicles | 445 (13.8%) | 226 (15.7%) |
| Total | 3,223 (100.0%) | 1,440 (100.0%) |
Real Estate & Mortgages in Suffern
Real Estate and Mortgage Overview in Suffern
| Characteristic | Without Mortgage | With Mortgage |
| Housing Units | 1,349 | 1,874 |
| Median Property Value | $261,900 | $376,800 |
| Median Household Income | $60,123 | $915 |
| Monthly Housing Costs | $1,198 | $866 |
| Real Estate Taxes | $6,196 | $123 |
Property Value by Mortgage Status in Suffern
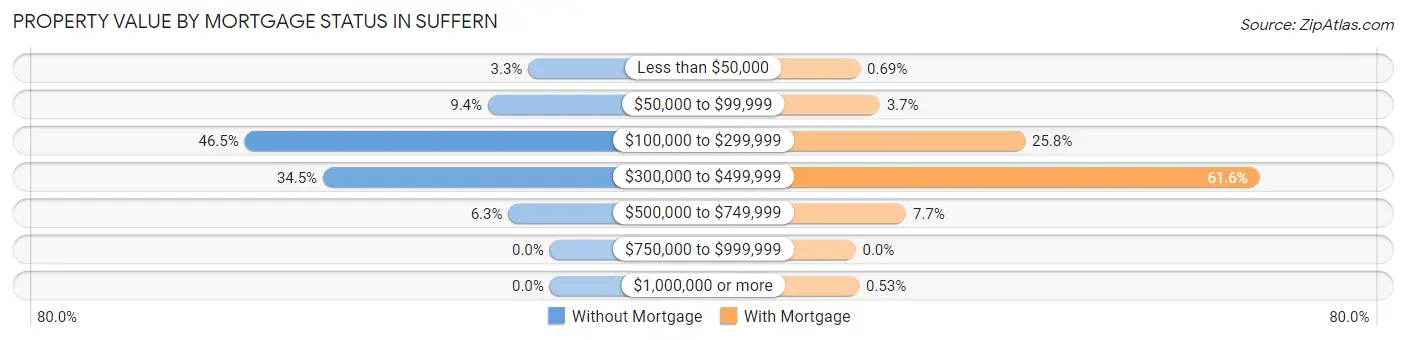
| Property Value | Without Mortgage | With Mortgage |
| Less than $50,000 | 44 (3.3%) | 13 (0.7%) |
| $50,000 to $99,999 | 127 (9.4%) | 69 (3.7%) |
| $100,000 to $299,999 | 627 (46.5%) | 484 (25.8%) |
| $300,000 to $499,999 | 466 (34.5%) | 1,154 (61.6%) |
| $500,000 to $749,999 | 85 (6.3%) | 144 (7.7%) |
| $750,000 to $999,999 | 0 (0.0%) | 0 (0.0%) |
| $1,000,000 or more | 0 (0.0%) | 10 (0.5%) |
| Total | 1,349 (100.0%) | 1,874 (100.0%) |
Household Income by Mortgage Status in Suffern
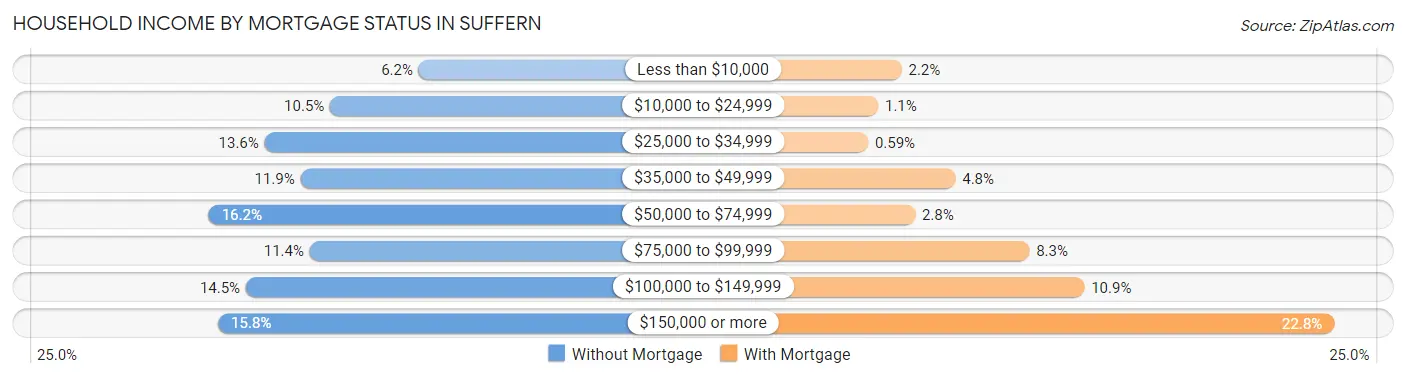
| Household Income | Without Mortgage | With Mortgage |
| Less than $10,000 | 84 (6.2%) | 41 (2.2%) |
| $10,000 to $24,999 | 141 (10.4%) | 20 (1.1%) |
| $25,000 to $34,999 | 183 (13.6%) | 11 (0.6%) |
| $35,000 to $49,999 | 160 (11.9%) | 89 (4.8%) |
| $50,000 to $74,999 | 219 (16.2%) | 53 (2.8%) |
| $75,000 to $99,999 | 154 (11.4%) | 155 (8.3%) |
| $100,000 to $149,999 | 195 (14.5%) | 204 (10.9%) |
| $150,000 or more | 213 (15.8%) | 427 (22.8%) |
| Total | 1,349 (100.0%) | 1,874 (100.0%) |
Property Value to Household Income Ratio in Suffern
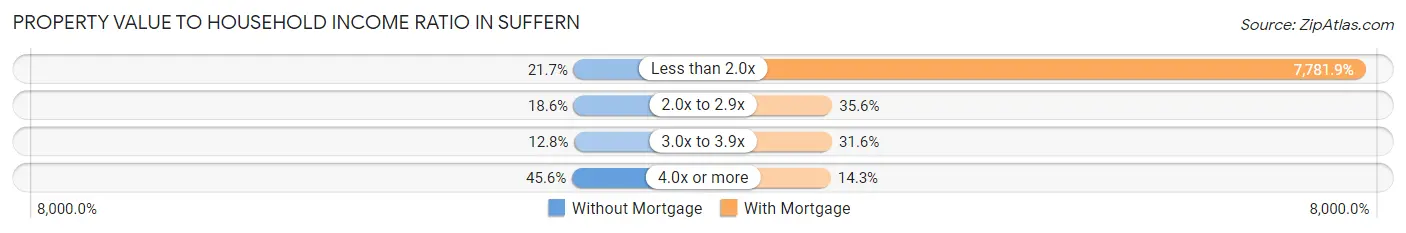
| Value-to-Income Ratio | Without Mortgage | With Mortgage |
| Less than 2.0x | 292 (21.6%) | 145,833 (7,781.9%) |
| 2.0x to 2.9x | 251 (18.6%) | 667 (35.6%) |
| 3.0x to 3.9x | 172 (12.8%) | 592 (31.6%) |
| 4.0x or more | 615 (45.6%) | 267 (14.2%) |
| Total | 1,349 (100.0%) | 1,874 (100.0%) |
Real Estate Taxes by Mortgage Status in Suffern
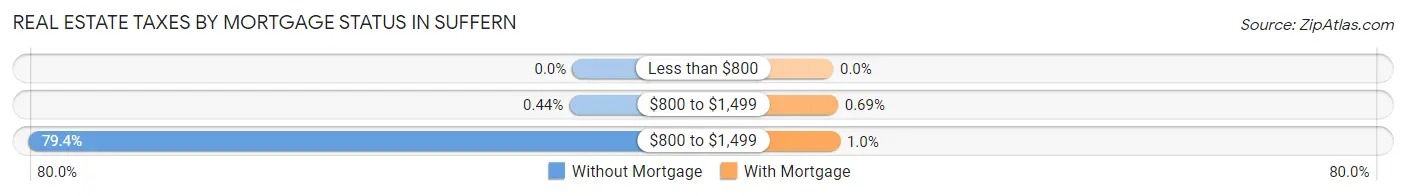
| Property Taxes | Without Mortgage | With Mortgage |
| Less than $800 | 0 (0.0%) | 0 (0.0%) |
| $800 to $1,499 | 6 (0.4%) | 13 (0.7%) |
| $800 to $1,499 | 1,071 (79.4%) | 19 (1.0%) |
| Total | 1,349 (100.0%) | 1,874 (100.0%) |
Health & Disability in Suffern
Health Insurance Coverage by Age in Suffern
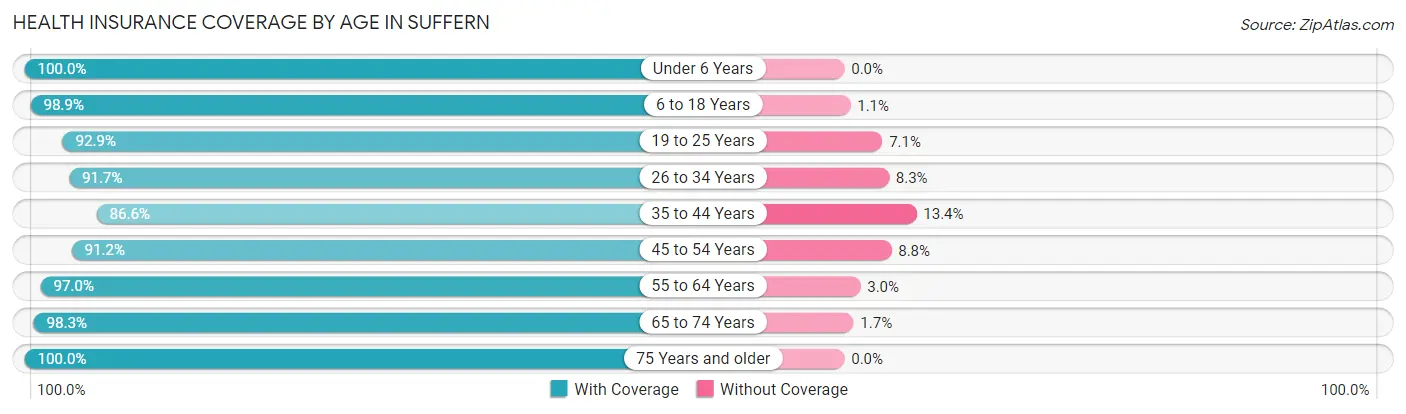
| Age Bracket | With Coverage | Without Coverage |
| Under 6 Years | 799 (100.0%) | 0 (0.0%) |
| 6 to 18 Years | 1,592 (98.9%) | 18 (1.1%) |
| 19 to 25 Years | 827 (92.9%) | 63 (7.1%) |
| 26 to 34 Years | 927 (91.7%) | 84 (8.3%) |
| 35 to 44 Years | 1,430 (86.6%) | 222 (13.4%) |
| 45 to 54 Years | 1,458 (91.2%) | 140 (8.8%) |
| 55 to 64 Years | 1,531 (97.0%) | 47 (3.0%) |
| 65 to 74 Years | 1,158 (98.3%) | 20 (1.7%) |
| 75 Years and older | 1,029 (100.0%) | 0 (0.0%) |
| Total | 10,751 (94.8%) | 594 (5.2%) |
Health Insurance Coverage by Citizenship Status in Suffern
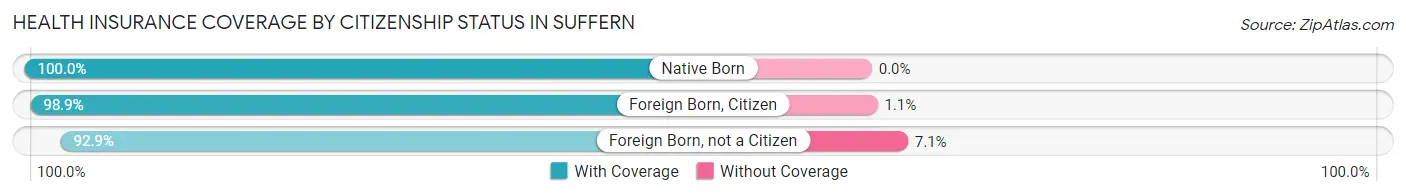
| Citizenship Status | With Coverage | Without Coverage |
| Native Born | 799 (100.0%) | 0 (0.0%) |
| Foreign Born, Citizen | 1,592 (98.9%) | 18 (1.1%) |
| Foreign Born, not a Citizen | 827 (92.9%) | 63 (7.1%) |
Health Insurance Coverage by Household Income in Suffern
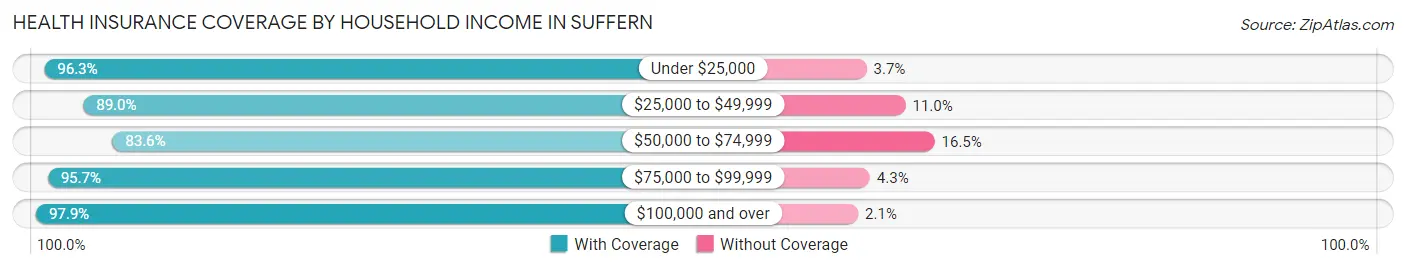
| Household Income | With Coverage | Without Coverage |
| Under $25,000 | 726 (96.3%) | 28 (3.7%) |
| $25,000 to $49,999 | 1,108 (89.0%) | 137 (11.0%) |
| $50,000 to $74,999 | 1,163 (83.6%) | 229 (16.5%) |
| $75,000 to $99,999 | 950 (95.7%) | 43 (4.3%) |
| $100,000 and over | 6,574 (97.9%) | 143 (2.1%) |
Public vs Private Health Insurance Coverage by Age in Suffern
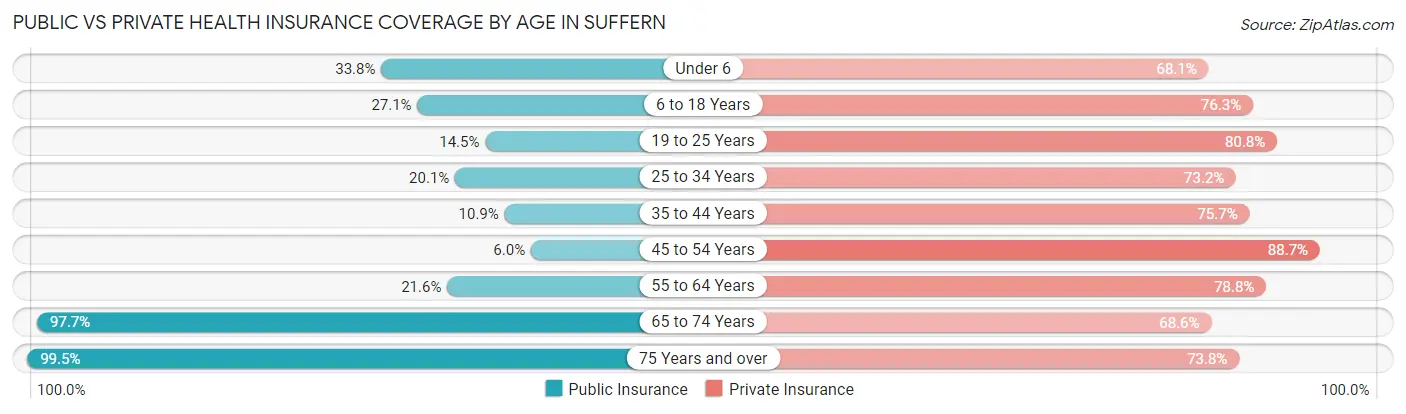
| Age Bracket | Public Insurance | Private Insurance |
| Under 6 | 270 (33.8%) | 544 (68.1%) |
| 6 to 18 Years | 436 (27.1%) | 1,229 (76.3%) |
| 19 to 25 Years | 129 (14.5%) | 719 (80.8%) |
| 25 to 34 Years | 203 (20.1%) | 740 (73.2%) |
| 35 to 44 Years | 180 (10.9%) | 1,250 (75.7%) |
| 45 to 54 Years | 96 (6.0%) | 1,418 (88.7%) |
| 55 to 64 Years | 340 (21.5%) | 1,243 (78.8%) |
| 65 to 74 Years | 1,151 (97.7%) | 808 (68.6%) |
| 75 Years and over | 1,024 (99.5%) | 759 (73.8%) |
| Total | 3,829 (33.8%) | 8,710 (76.8%) |
Disability Status by Sex by Age in Suffern
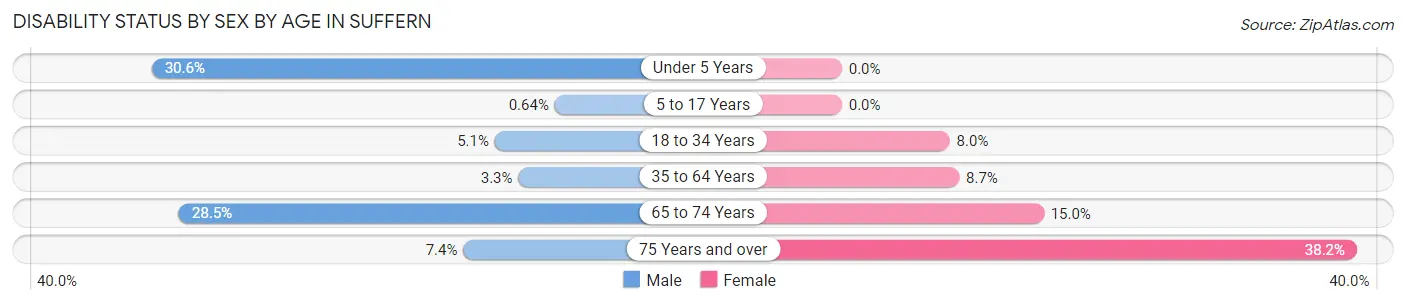
| Age Bracket | Male | Female |
| Under 5 Years | 77 (30.6%) | 0 (0.0%) |
| 5 to 17 Years | 7 (0.6%) | 0 (0.0%) |
| 18 to 34 Years | 41 (5.1%) | 94 (8.0%) |
| 35 to 64 Years | 78 (3.3%) | 217 (8.7%) |
| 65 to 74 Years | 121 (28.5%) | 113 (15.0%) |
| 75 Years and over | 24 (7.4%) | 270 (38.2%) |
Disability Class by Sex by Age in Suffern
Disability Class: Hearing Difficulty
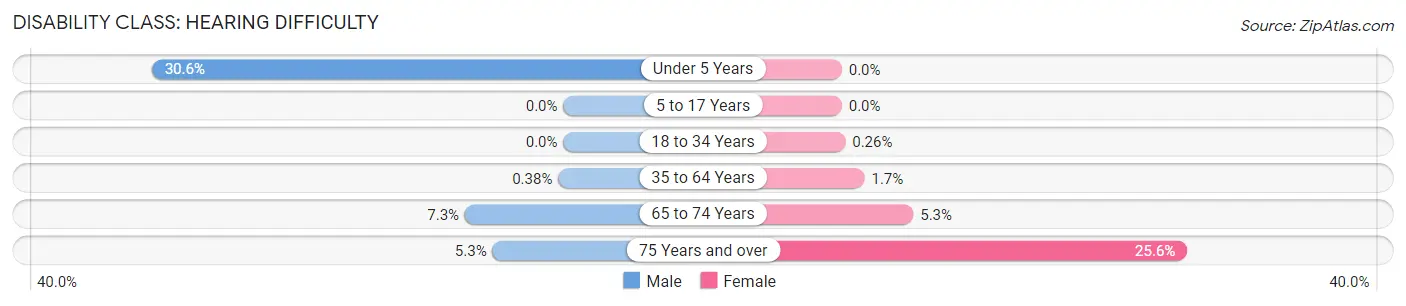
| Age Bracket | Male | Female |
| Under 5 Years | 77 (30.6%) | 0 (0.0%) |
| 5 to 17 Years | 0 (0.0%) | 0 (0.0%) |
| 18 to 34 Years | 0 (0.0%) | 3 (0.3%) |
| 35 to 64 Years | 9 (0.4%) | 42 (1.7%) |
| 65 to 74 Years | 31 (7.3%) | 40 (5.3%) |
| 75 Years and over | 17 (5.3%) | 181 (25.6%) |
Disability Class: Vision Difficulty
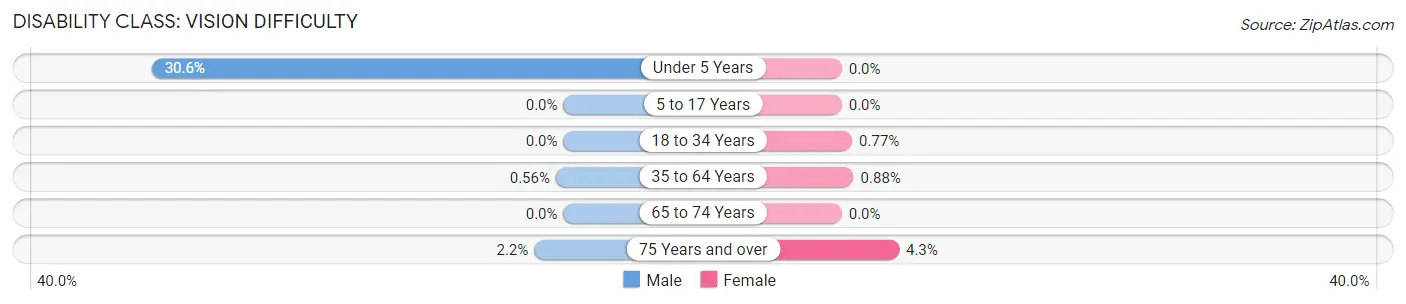
| Age Bracket | Male | Female |
| Under 5 Years | 77 (30.6%) | 0 (0.0%) |
| 5 to 17 Years | 0 (0.0%) | 0 (0.0%) |
| 18 to 34 Years | 0 (0.0%) | 9 (0.8%) |
| 35 to 64 Years | 13 (0.6%) | 22 (0.9%) |
| 65 to 74 Years | 0 (0.0%) | 0 (0.0%) |
| 75 Years and over | 7 (2.2%) | 30 (4.3%) |
Disability Class: Cognitive Difficulty
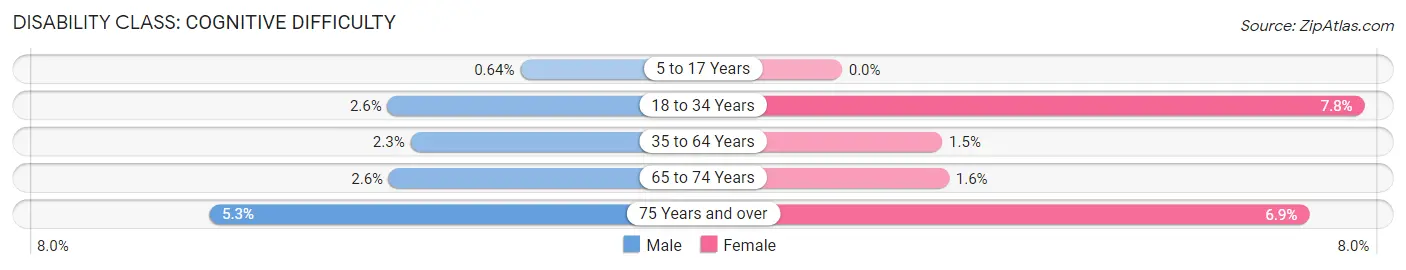
| Age Bracket | Male | Female |
| 5 to 17 Years | 7 (0.6%) | 0 (0.0%) |
| 18 to 34 Years | 21 (2.6%) | 91 (7.8%) |
| 35 to 64 Years | 53 (2.3%) | 37 (1.5%) |
| 65 to 74 Years | 11 (2.6%) | 12 (1.6%) |
| 75 Years and over | 17 (5.3%) | 49 (6.9%) |
Disability Class: Ambulatory Difficulty
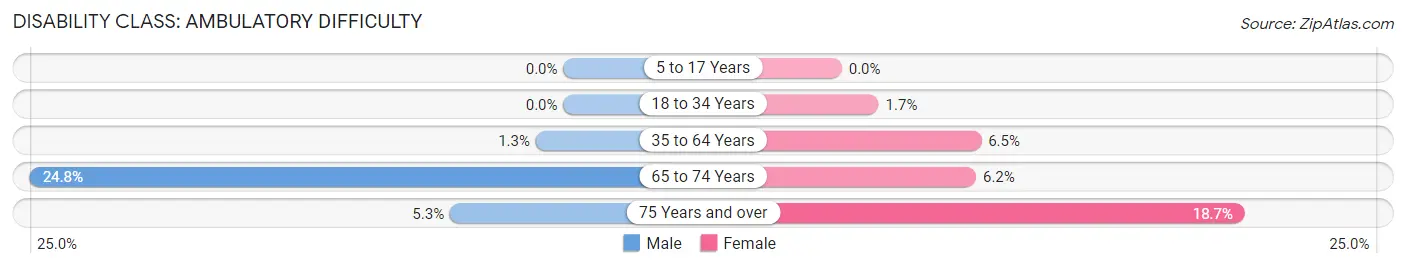
| Age Bracket | Male | Female |
| 5 to 17 Years | 0 (0.0%) | 0 (0.0%) |
| 18 to 34 Years | 0 (0.0%) | 20 (1.7%) |
| 35 to 64 Years | 30 (1.3%) | 161 (6.5%) |
| 65 to 74 Years | 105 (24.8%) | 47 (6.2%) |
| 75 Years and over | 17 (5.3%) | 132 (18.7%) |
Disability Class: Self-Care Difficulty
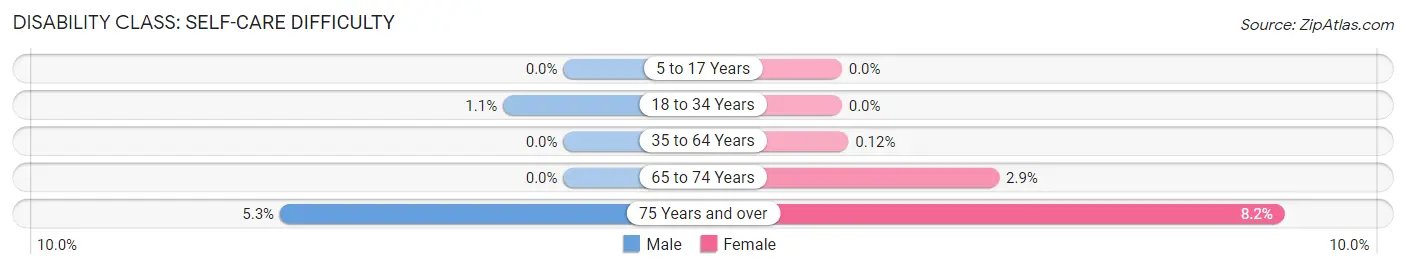
| Age Bracket | Male | Female |
| 5 to 17 Years | 0 (0.0%) | 0 (0.0%) |
| 18 to 34 Years | 9 (1.1%) | 0 (0.0%) |
| 35 to 64 Years | 0 (0.0%) | 3 (0.1%) |
| 65 to 74 Years | 0 (0.0%) | 22 (2.9%) |
| 75 Years and over | 17 (5.3%) | 58 (8.2%) |
Technology Access in Suffern
Computing Device Access in Suffern
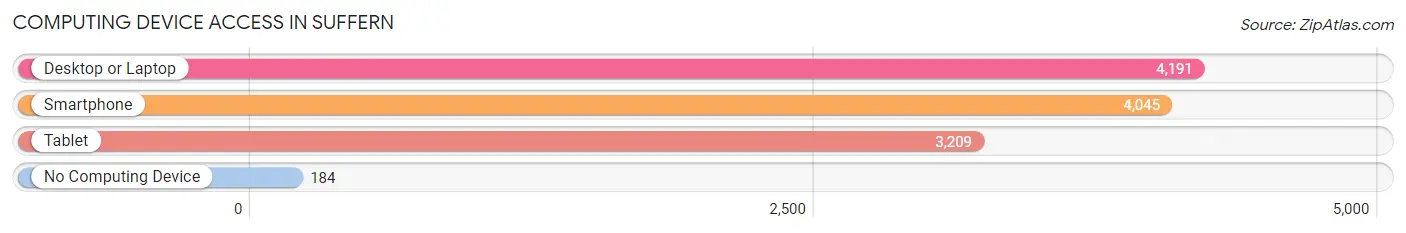
| Device Type | # Households | % Households |
| Desktop or Laptop | 4,191 | 89.9% |
| Smartphone | 4,045 | 86.8% |
| Tablet | 3,209 | 68.8% |
| No Computing Device | 184 | 4.0% |
| Total | 4,663 | 100.0% |
Internet Access in Suffern
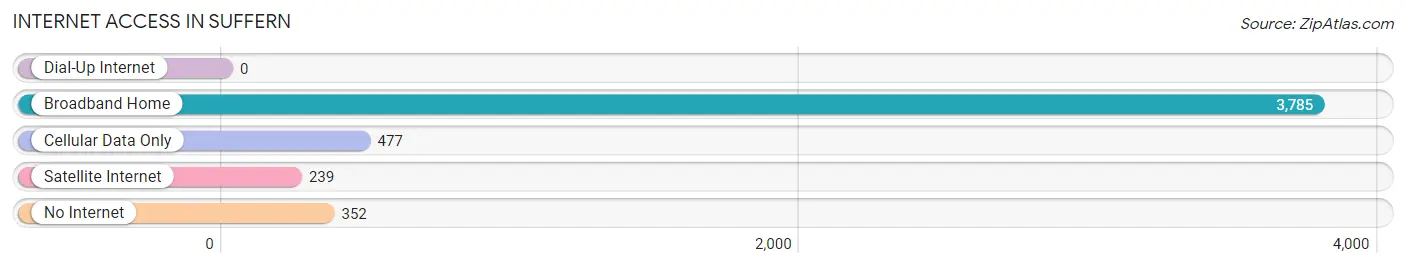
| Internet Type | # Households | % Households |
| Dial-Up Internet | 0 | 0.0% |
| Broadband Home | 3,785 | 81.2% |
| Cellular Data Only | 477 | 10.2% |
| Satellite Internet | 239 | 5.1% |
| No Internet | 352 | 7.5% |
| Total | 4,663 | 100.0% |
Suffern Summary
Suffern is a village located in the town of Ramapo in Rockland County, New York. It is located approximately 25 miles northwest of New York City and is part of the New York metropolitan area. The village has a population of 10,723 as of the 2010 census.
History
The area that is now Suffern was originally inhabited by the Munsee people, a branch of the Lenape Native Americans. The first European settlers arrived in the area in the late 17th century. The village was founded in 1796 by John Suffern, a Revolutionary War veteran who had served under General George Washington. The village was originally known as “Suffern’s Corners” and was later renamed “Suffern” in 1817.
In the 19th century, Suffern became a popular summer resort for wealthy New Yorkers. The village was also a stop on the Erie Railroad, which connected New York City to Buffalo. The railroad brought many visitors to the area and helped to spur economic growth.
In the early 20th century, Suffern became a popular destination for movie stars and other celebrities. The village was also home to the first drive-in movie theater in the United States.
Geography
Suffern is located at 41°7′N 74°10′W (41.1167, -74.1667). According to the United States Census Bureau, the village has a total area of 2.2 square miles (5.7 km2), all of it land.
The village is located in the Ramapo Mountains and is bordered by the towns of Ramapo, Mahwah, and Hillburn. The village is located near the New York-New Jersey border and is approximately 25 miles northwest of New York City.
Economy
Suffern’s economy is largely based on tourism and retail. The village is home to several shopping centers, including the Shops at Nanuet and the Palisades Center. The village is also home to several corporate headquarters, including the headquarters of the pharmaceutical company Pfizer.
The village is also home to several manufacturing companies, including the electronics manufacturer JVC and the medical device manufacturer Becton Dickinson.
Demographics
As of the 2010 census, there were 10,723 people, 3,845 households, and 2,717 families residing in the village. The population density was 4,845.3 people per square mile (1,876.2/km2). There were 4,039 housing units at an average density of 1,817.3 per square mile (701.2/km2). The racial makeup of the village was 79.2% White, 8.2% African American, 0.2% Native American, 6.3% Asian, 0.1% Pacific Islander, 3.2% from other races, and 2.9% from two or more races. Hispanic or Latino of any race were 10.2% of the population.
There were 3,845 households, out of which 33.2% had children under the age of 18 living with them, 54.2% were married couples living together, 11.2% had a female householder with no husband present, and 30.2% were non-families. 24.7% of all households were made up of individuals, and 9.3% had someone living alone who was 65 years of age or older. The average household size was 2.77 and the average family size was 3.33.
In the village, the population was spread out, with 24.2% under the age of 18, 7.2% from 18 to 24, 30.2% from 25 to 44, 24.2% from 45 to 64, and 14.2% who were 65 years of age or older. The median age was 38 years. For every 100 females, there were 93.2 males. For every 100 females age 18 and over, there were 90.2 males.
The median income for a household in the village was $71,945, and the median income for a family was $83,929. Males had a median income of $51,919 versus $41,919 for females. The per capita income for the village was $30,945. About 3.2% of families and 5.2% of the population were below the poverty line, including 6.2% of those under age 18 and 5.2% of those age 65 or over.
Common Questions
What is Per Capita Income in Suffern?
Per Capita income in Suffern is $49,566.
What is the Median Family Income in Suffern?
Median Family Income in Suffern is $128,993.
What is the Median Household income in Suffern?
Median Household Income in Suffern is $94,688.
What is Income or Wage Gap in Suffern?
Income or Wage Gap in Suffern is 13.4%.
Women in Suffern earn 86.6 cents for every dollar earned by a man.
What is Family Income Deficit in Suffern?
Family Income Deficit in Suffern is $13,679.
Families that are below poverty line in Suffern earn $13,679 less on average than the poverty threshold level.
What is Inequality or Gini Index in Suffern?
Inequality or Gini Index in Suffern is 0.43.
What is the Total Population of Suffern?
Total Population of Suffern is 11,376.
What is the Total Male Population of Suffern?
Total Male Population of Suffern is 5,259.
What is the Total Female Population of Suffern?
Total Female Population of Suffern is 6,117.
What is the Ratio of Males per 100 Females in Suffern?
There are 85.97 Males per 100 Females in Suffern.
What is the Ratio of Females per 100 Males in Suffern?
There are 116.31 Females per 100 Males in Suffern.
What is the Median Population Age in Suffern?
Median Population Age in Suffern is 42.9 Years.
What is the Average Family Size in Suffern
Average Family Size in Suffern is 3.3 People.
What is the Average Household Size in Suffern
Average Household Size in Suffern is 2.4 People.
How Large is the Labor Force in Suffern?
There are 6,330 People in the Labor Forcein in Suffern.
What is the Percentage of People in the Labor Force in Suffern?
67.4% of People are in the Labor Force in Suffern.
What is the Unemployment Rate in Suffern?
Unemployment Rate in Suffern is 5.5%.