Ogdensburg, NY Map & Demographics
Ogdensburg Map
Ogdensburg Overview
$28,379
PER CAPITA INCOME
$68,845
AVG FAMILY INCOME
$58,184
AVG HOUSEHOLD INCOME
17.6%
WAGE / INCOME GAP [ % ]
82.4¢/ $1
WAGE / INCOME GAP [ $ ]
$10,357
FAMILY INCOME DEFICIT
0.45
INEQUALITY / GINI INDEX
9,902
TOTAL POPULATION
5,479
MALE POPULATION
4,423
FEMALE POPULATION
123.88
MALES / 100 FEMALES
80.73
FEMALES / 100 MALES
41.9
MEDIAN AGE
2.6
AVG FAMILY SIZE
2.1
AVG HOUSEHOLD SIZE
3,803
LABOR FORCE [ PEOPLE ]
46.5%
PERCENT IN LABOR FORCE
6.9%
UNEMPLOYMENT RATE
Ogdensburg Zip Codes
Ogdensburg Area Codes
Income in Ogdensburg
Income Overview in Ogdensburg
Per Capita Income in Ogdensburg is $28,379, while median incomes of families and households are $68,845 and $58,184 respectively.
| Characteristic | Number | Measure |
| Per Capita Income | 9,902 | $28,379 |
| Median Family Income | 2,355 | $68,845 |
| Mean Family Income | 2,355 | $78,269 |
| Median Household Income | 3,948 | $58,184 |
| Mean Household Income | 3,948 | $69,689 |
| Income Deficit | 2,355 | $10,357 |
| Wage / Income Gap (%) | 9,902 | 17.59% |
| Wage / Income Gap ($) | 9,902 | 82.41¢ per $1 |
| Gini / Inequality Index | 9,902 | 0.45 |
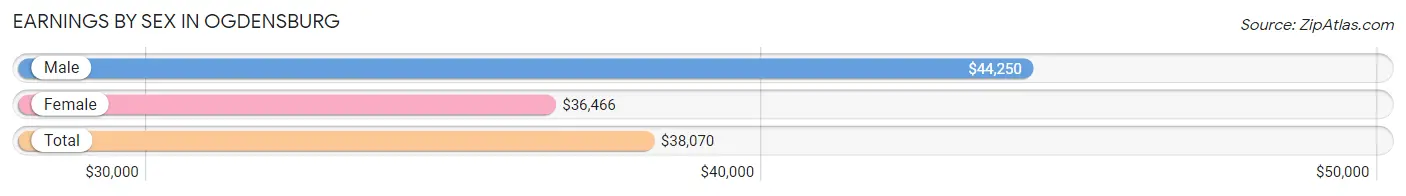
Earnings by Sex in Ogdensburg
Average Earnings in Ogdensburg are $38,070, $44,250 for men and $36,466 for women, a difference of 17.6%.
| Sex | Number | Average Earnings |
| Male | 2,252 (55.7%) | $44,250 |
| Female | 1,794 (44.3%) | $36,466 |
| Total | 4,046 (100.0%) | $38,070 |
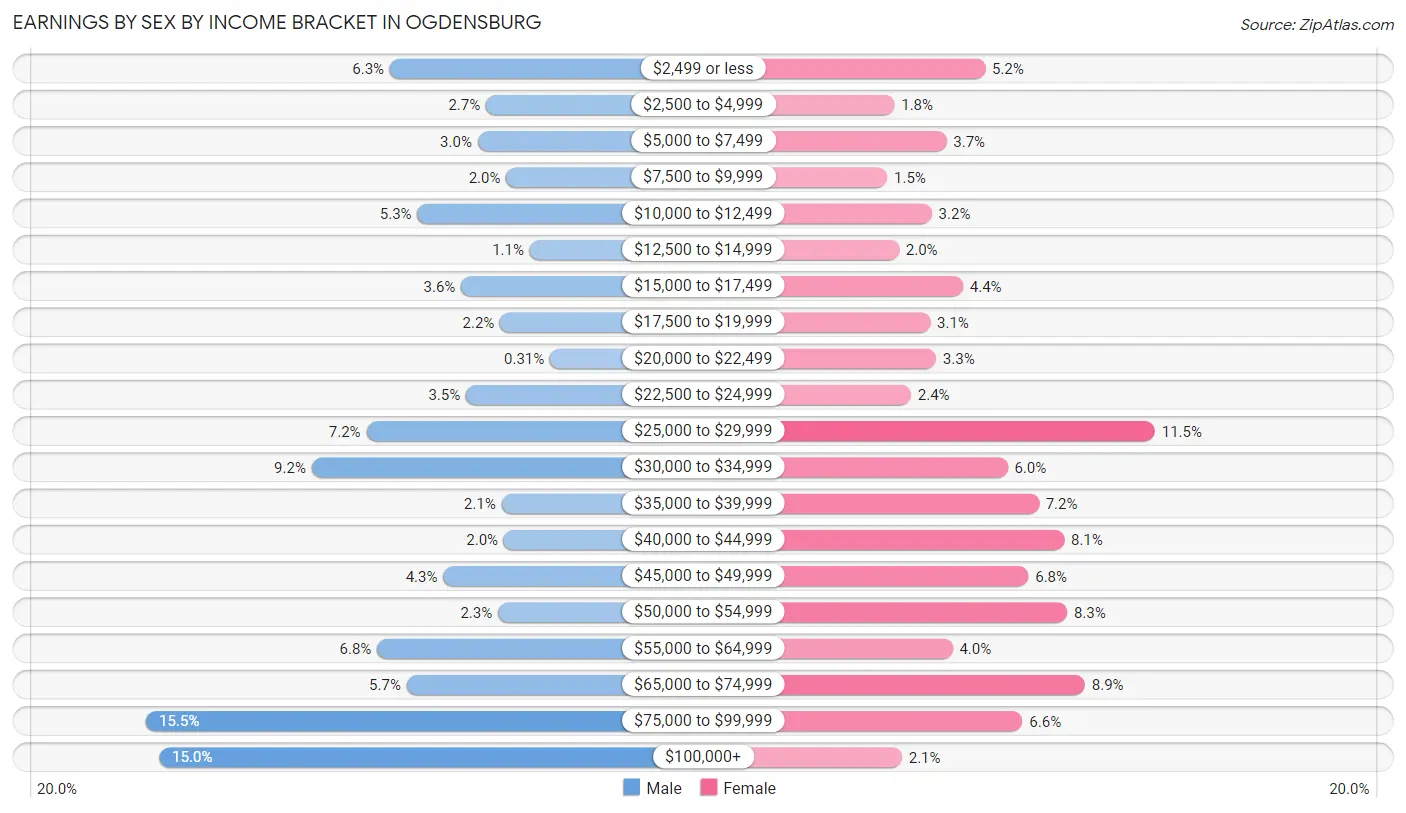
Earnings by Sex by Income Bracket in Ogdensburg
The most common earnings brackets in Ogdensburg are $75,000 to $99,999 for men (348 | 15.4%) and $25,000 to $29,999 for women (207 | 11.5%).
| Income | Male | Female |
| $2,499 or less | 142 (6.3%) | 93 (5.2%) |
| $2,500 to $4,999 | 61 (2.7%) | 32 (1.8%) |
| $5,000 to $7,499 | 68 (3.0%) | 67 (3.7%) |
| $7,500 to $9,999 | 44 (1.9%) | 27 (1.5%) |
| $10,000 to $12,499 | 119 (5.3%) | 57 (3.2%) |
| $12,500 to $14,999 | 24 (1.1%) | 35 (1.9%) |
| $15,000 to $17,499 | 82 (3.6%) | 78 (4.3%) |
| $17,500 to $19,999 | 49 (2.2%) | 56 (3.1%) |
| $20,000 to $22,499 | 7 (0.3%) | 60 (3.3%) |
| $22,500 to $24,999 | 78 (3.5%) | 43 (2.4%) |
| $25,000 to $29,999 | 162 (7.2%) | 207 (11.5%) |
| $30,000 to $34,999 | 208 (9.2%) | 108 (6.0%) |
| $35,000 to $39,999 | 48 (2.1%) | 129 (7.2%) |
| $40,000 to $44,999 | 46 (2.0%) | 146 (8.1%) |
| $45,000 to $49,999 | 97 (4.3%) | 122 (6.8%) |
| $50,000 to $54,999 | 51 (2.3%) | 148 (8.3%) |
| $55,000 to $64,999 | 153 (6.8%) | 71 (4.0%) |
| $65,000 to $74,999 | 128 (5.7%) | 160 (8.9%) |
| $75,000 to $99,999 | 348 (15.4%) | 118 (6.6%) |
| $100,000+ | 337 (15.0%) | 37 (2.1%) |
| Total | 2,252 (100.0%) | 1,794 (100.0%) |
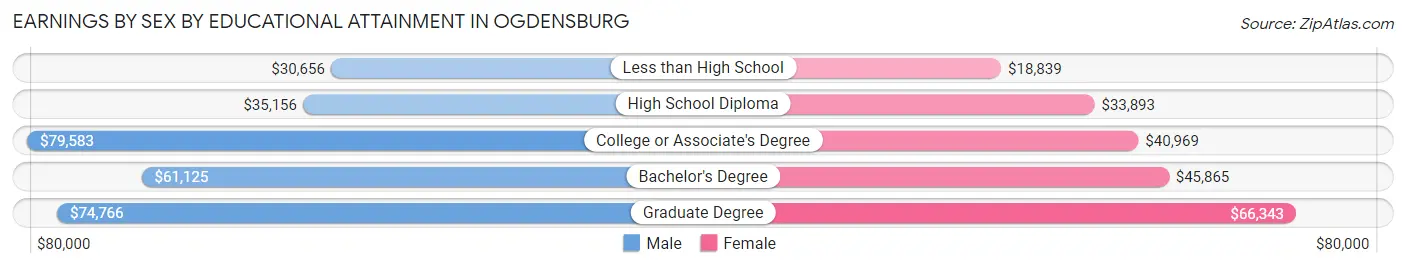
Earnings by Sex by Educational Attainment in Ogdensburg
Average earnings in Ogdensburg are $51,544 for men and $40,029 for women, a difference of 22.3%. Men with an educational attainment of college or associate's degree enjoy the highest average annual earnings of $79,583, while those with less than high school education earn the least with $30,656. Women with an educational attainment of graduate degree earn the most with the average annual earnings of $66,343, while those with less than high school education have the smallest earnings of $18,839.
| Educational Attainment | Male Income | Female Income |
| Less than High School | $30,656 | $18,839 |
| High School Diploma | $35,156 | $33,893 |
| College or Associate's Degree | $79,583 | $40,969 |
| Bachelor's Degree | $61,125 | $45,865 |
| Graduate Degree | $74,766 | $66,343 |
| Total | $51,544 | $40,029 |
Family Income in Ogdensburg
Family Income Brackets in Ogdensburg
According to the Ogdensburg family income data, there are 485 families falling into the $100,000 to $149,999 income range, which is the most common income bracket and makes up 20.6% of all families. Conversely, the $200,000+ income bracket is the least frequent group with only 47 families (2.0%) belonging to this category.
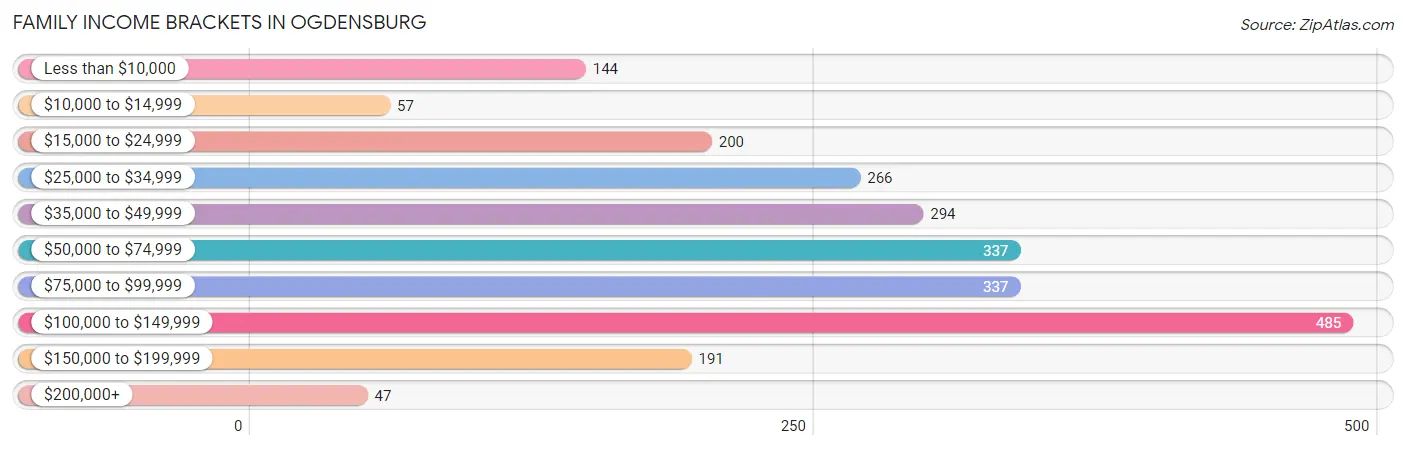
| Income Bracket | # Families | % Families |
| Less than $10,000 | 144 | 6.1% |
| $10,000 to $14,999 | 57 | 2.4% |
| $15,000 to $24,999 | 200 | 8.5% |
| $25,000 to $34,999 | 266 | 11.3% |
| $35,000 to $49,999 | 294 | 12.5% |
| $50,000 to $74,999 | 337 | 14.3% |
| $75,000 to $99,999 | 337 | 14.3% |
| $100,000 to $149,999 | 485 | 20.6% |
| $150,000 to $199,999 | 191 | 8.1% |
| $200,000+ | 47 | 2.0% |
Family Income by Famaliy Size in Ogdensburg
5-person families (196 | 8.3%) account for the highest median family income in Ogdensburg with $128,320 per family, while 2-person families (1,351 | 57.4%) have the highest median income of $35,584 per family member.
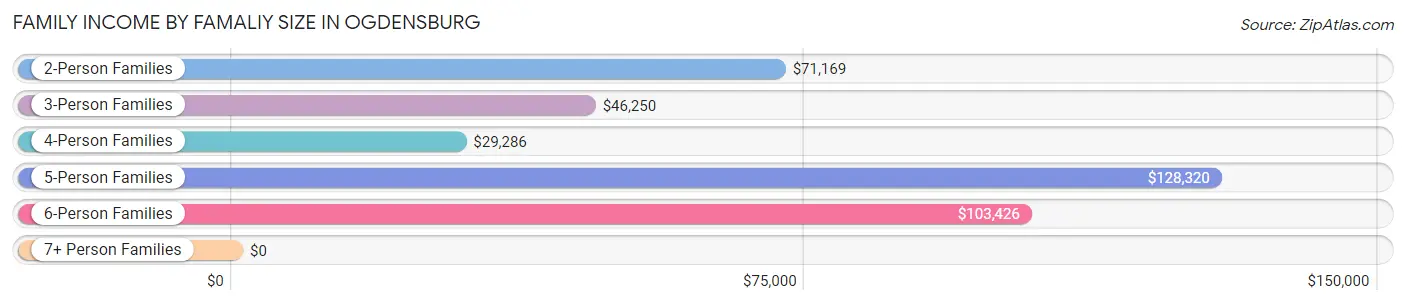
| Income Bracket | # Families | Median Income |
| 2-Person Families | 1,351 (57.4%) | $71,169 |
| 3-Person Families | 514 (21.8%) | $46,250 |
| 4-Person Families | 218 (9.3%) | $29,286 |
| 5-Person Families | 196 (8.3%) | $128,320 |
| 6-Person Families | 66 (2.8%) | $103,426 |
| 7+ Person Families | 10 (0.4%) | $0 |
| Total | 2,355 (100.0%) | $68,845 |
Family Income by Number of Earners in Ogdensburg
The median family income in Ogdensburg is $68,845, with families comprising 3+ earners (143) having the highest median family income of $128,776, while families with no earners (507) have the lowest median family income of $42,375, accounting for 6.1% and 21.5% of families, respectively.
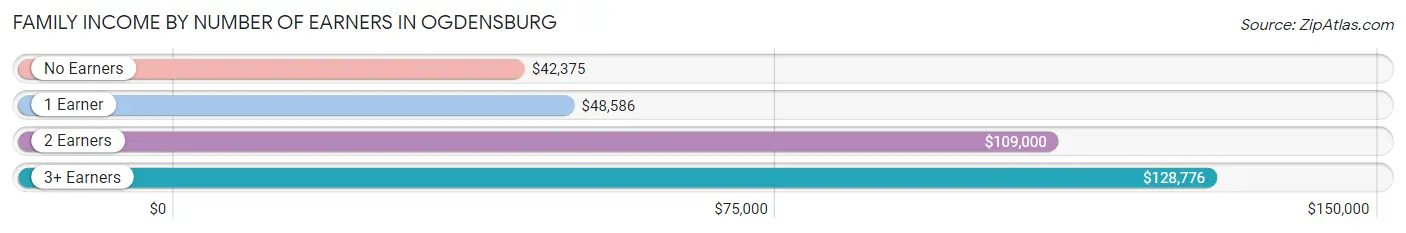
| Number of Earners | # Families | Median Income |
| No Earners | 507 (21.5%) | $42,375 |
| 1 Earner | 1,051 (44.6%) | $48,586 |
| 2 Earners | 654 (27.8%) | $109,000 |
| 3+ Earners | 143 (6.1%) | $128,776 |
| Total | 2,355 (100.0%) | $68,845 |
Household Income in Ogdensburg
Household Income Brackets in Ogdensburg
With 766 households falling in the category, the $50,000 to $74,999 income range is the most frequent in Ogdensburg, accounting for 19.4% of all households. In contrast, only 79 households (2.0%) fall into the $200,000+ income bracket, making it the least populous group.
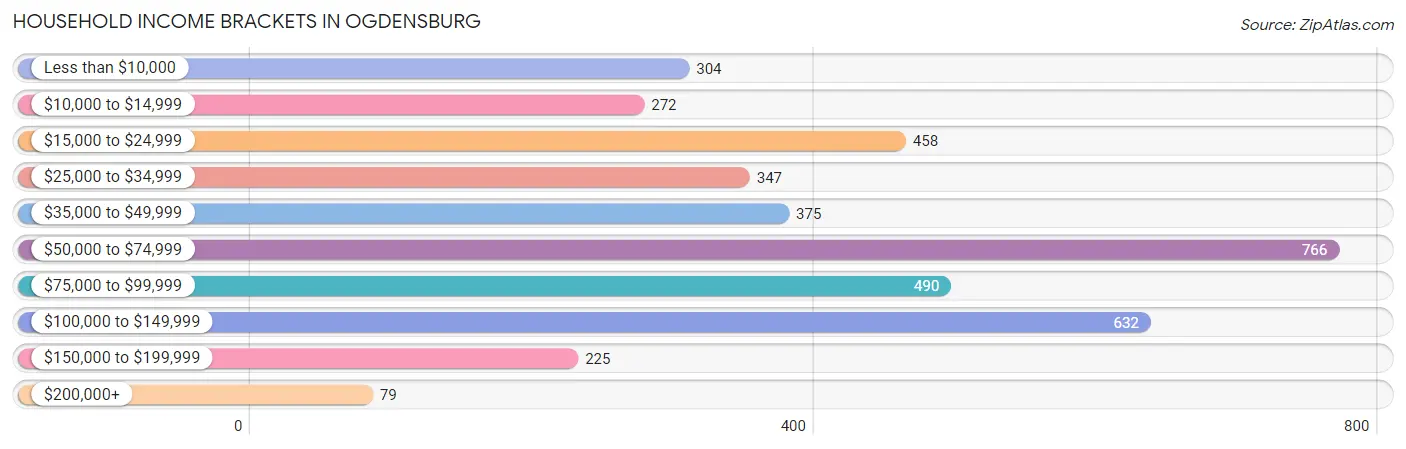
| Income Bracket | # Households | % Households |
| Less than $10,000 | 304 | 7.7% |
| $10,000 to $14,999 | 272 | 6.9% |
| $15,000 to $24,999 | 458 | 11.6% |
| $25,000 to $34,999 | 347 | 8.8% |
| $35,000 to $49,999 | 375 | 9.5% |
| $50,000 to $74,999 | 766 | 19.4% |
| $75,000 to $99,999 | 490 | 12.4% |
| $100,000 to $149,999 | 632 | 16.0% |
| $150,000 to $199,999 | 225 | 5.7% |
| $200,000+ | 79 | 2.0% |
Household Income by Householder Age in Ogdensburg
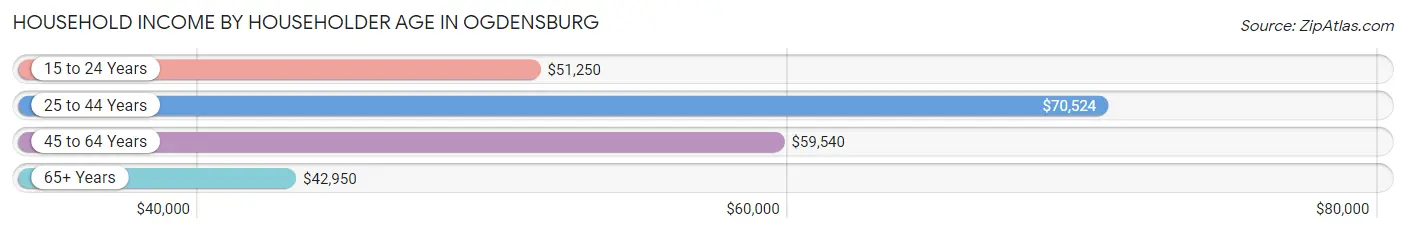
The median household income in Ogdensburg is $58,184, with the highest median household income of $70,524 found in the 25 to 44 years age bracket for the primary householder. A total of 1,043 households (26.4%) fall into this category. Meanwhile, the 65+ years age bracket for the primary householder has the lowest median household income of $42,950, with 1,083 households (27.4%) in this group.
| Income Bracket | # Households | Median Income |
| 15 to 24 Years | 176 (4.5%) | $51,250 |
| 25 to 44 Years | 1,043 (26.4%) | $70,524 |
| 45 to 64 Years | 1,646 (41.7%) | $59,540 |
| 65+ Years | 1,083 (27.4%) | $42,950 |
| Total | 3,948 (100.0%) | $58,184 |
Poverty in Ogdensburg
Income Below Poverty by Sex and Age in Ogdensburg
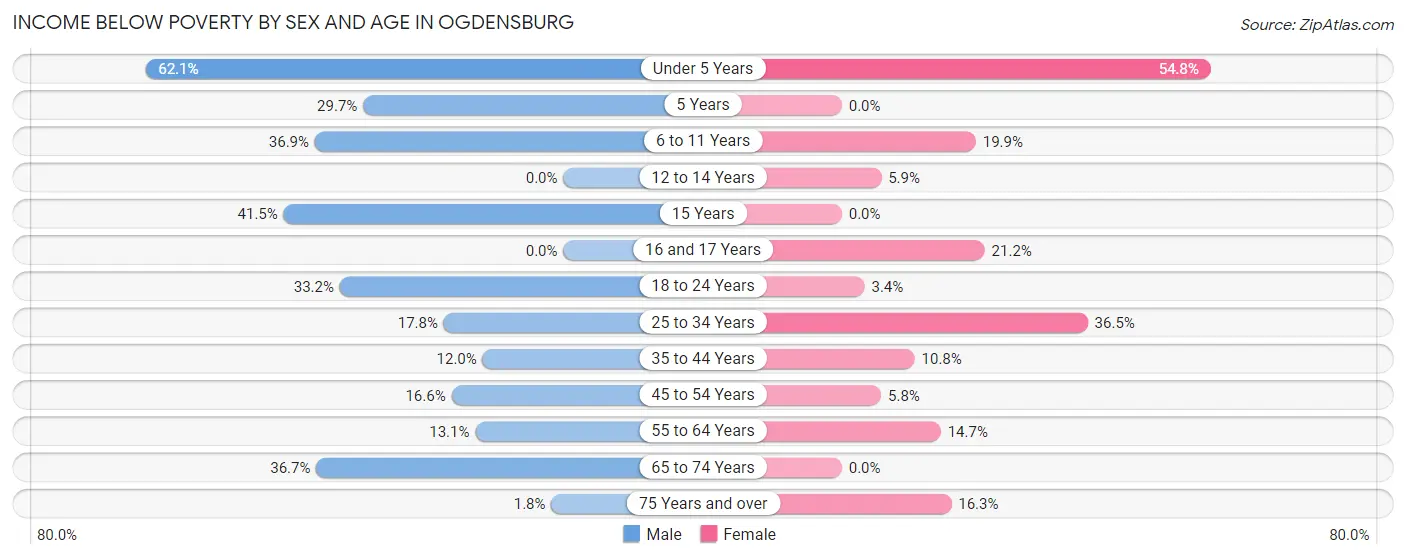
With 21.4% poverty level for males and 15.6% for females among the residents of Ogdensburg, under 5 year old males and under 5 year old females are the most vulnerable to poverty, with 144 males (62.1%) and 103 females (54.8%) in their respective age groups living below the poverty level.
| Age Bracket | Male | Female |
| Under 5 Years | 144 (62.1%) | 103 (54.8%) |
| 5 Years | 11 (29.7%) | 0 (0.0%) |
| 6 to 11 Years | 124 (36.9%) | 83 (19.9%) |
| 12 to 14 Years | 0 (0.0%) | 10 (5.9%) |
| 15 Years | 27 (41.5%) | 0 (0.0%) |
| 16 and 17 Years | 0 (0.0%) | 21 (21.2%) |
| 18 to 24 Years | 85 (33.2%) | 12 (3.4%) |
| 25 to 34 Years | 74 (17.7%) | 176 (36.5%) |
| 35 to 44 Years | 64 (12.0%) | 51 (10.8%) |
| 45 to 54 Years | 92 (16.6%) | 30 (5.8%) |
| 55 to 64 Years | 102 (13.1%) | 110 (14.7%) |
| 65 to 74 Years | 182 (36.7%) | 0 (0.0%) |
| 75 Years and over | 5 (1.8%) | 60 (16.3%) |
| Total | 910 (21.4%) | 656 (15.6%) |
Income Above Poverty by Sex and Age in Ogdensburg
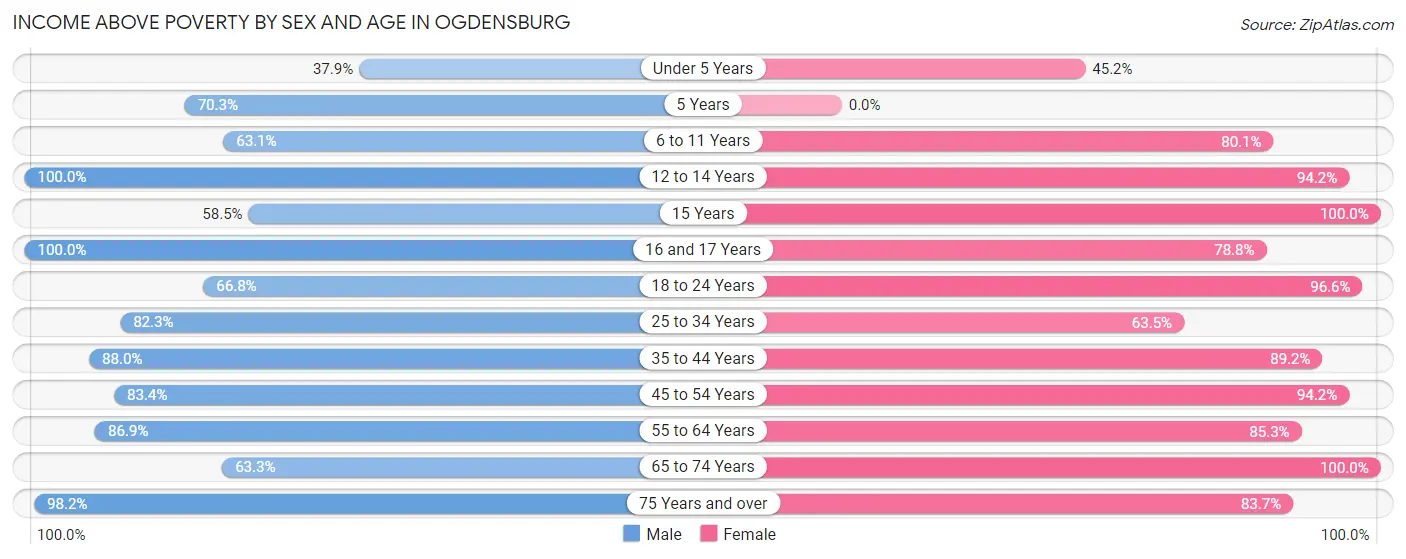
According to the poverty statistics in Ogdensburg, males aged 12 to 14 years and females aged 15 years are the age groups that are most secure financially, with 100.0% of males and 100.0% of females in these age groups living above the poverty line.
| Age Bracket | Male | Female |
| Under 5 Years | 88 (37.9%) | 85 (45.2%) |
| 5 Years | 26 (70.3%) | 0 (0.0%) |
| 6 to 11 Years | 212 (63.1%) | 334 (80.1%) |
| 12 to 14 Years | 154 (100.0%) | 161 (94.2%) |
| 15 Years | 38 (58.5%) | 11 (100.0%) |
| 16 and 17 Years | 101 (100.0%) | 78 (78.8%) |
| 18 to 24 Years | 171 (66.8%) | 343 (96.6%) |
| 25 to 34 Years | 343 (82.3%) | 306 (63.5%) |
| 35 to 44 Years | 470 (88.0%) | 421 (89.2%) |
| 45 to 54 Years | 462 (83.4%) | 484 (94.2%) |
| 55 to 64 Years | 678 (86.9%) | 639 (85.3%) |
| 65 to 74 Years | 314 (63.3%) | 382 (100.0%) |
| 75 Years and over | 276 (98.2%) | 309 (83.7%) |
| Total | 3,333 (78.5%) | 3,553 (84.4%) |
Income Below Poverty Among Married-Couple Families in Ogdensburg
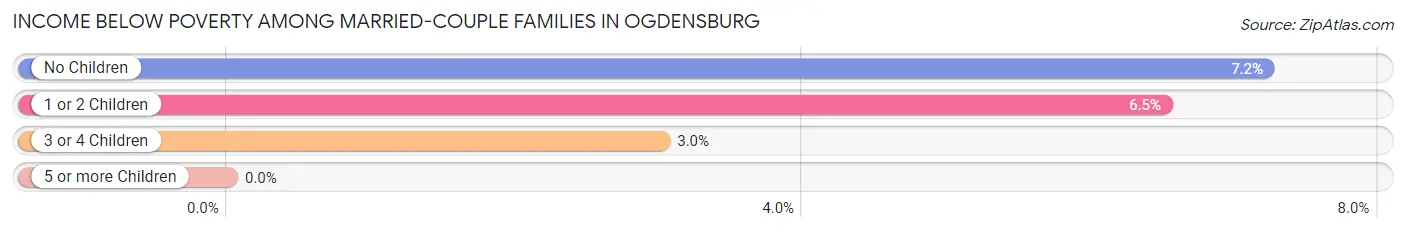
The poverty statistics for married-couple families in Ogdensburg show that 6.5% or 85 of the total 1,299 families live below the poverty line. Families with no children have the highest poverty rate of 7.2%, comprising of 63 families. On the other hand, families with 3 or 4 children have the lowest poverty rate of 3.0%, which includes 5 families.
| Children | Above Poverty | Below Poverty |
| No Children | 809 (92.8%) | 63 (7.2%) |
| 1 or 2 Children | 244 (93.5%) | 17 (6.5%) |
| 3 or 4 Children | 161 (97.0%) | 5 (3.0%) |
| 5 or more Children | 0 (0.0%) | 0 (0.0%) |
| Total | 1,214 (93.5%) | 85 (6.5%) |
Income Below Poverty Among Single-Parent Households in Ogdensburg
According to the poverty data in Ogdensburg, 27.5% or 84 single-father households and 25.7% or 193 single-mother households are living below the poverty line. Among single-father households, those with 3 or 4 children have the highest poverty rate, with 59 households (93.6%) experiencing poverty. Likewise, among single-mother households, those with 3 or 4 children have the highest poverty rate, with 76 households (100.0%) falling below the poverty line.
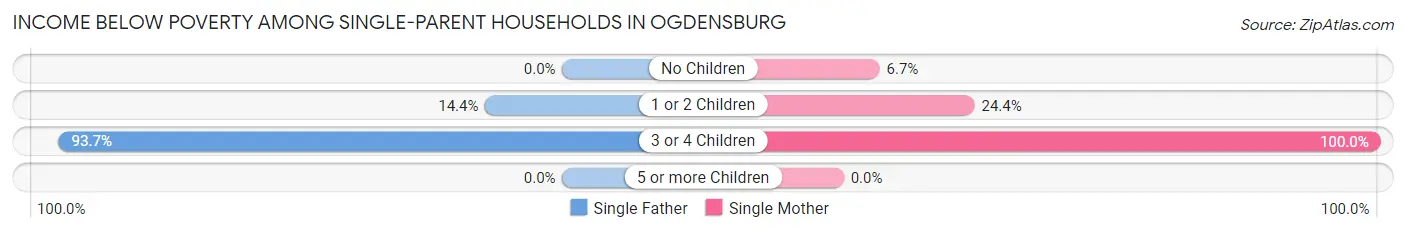
| Children | Single Father | Single Mother |
| No Children | 0 (0.0%) | 18 (6.7%) |
| 1 or 2 Children | 25 (14.4%) | 99 (24.4%) |
| 3 or 4 Children | 59 (93.6%) | 76 (100.0%) |
| 5 or more Children | 0 (0.0%) | 0 (0.0%) |
| Total | 84 (27.5%) | 193 (25.7%) |
Income Below Poverty Among Married-Couple vs Single-Parent Households in Ogdensburg
The poverty data for Ogdensburg shows that 85 of the married-couple family households (6.5%) and 277 of the single-parent households (26.2%) are living below the poverty level. Within the married-couple family households, those with no children have the highest poverty rate, with 63 households (7.2%) falling below the poverty line. Among the single-parent households, those with 3 or 4 children have the highest poverty rate, with 135 household (97.1%) living below poverty.
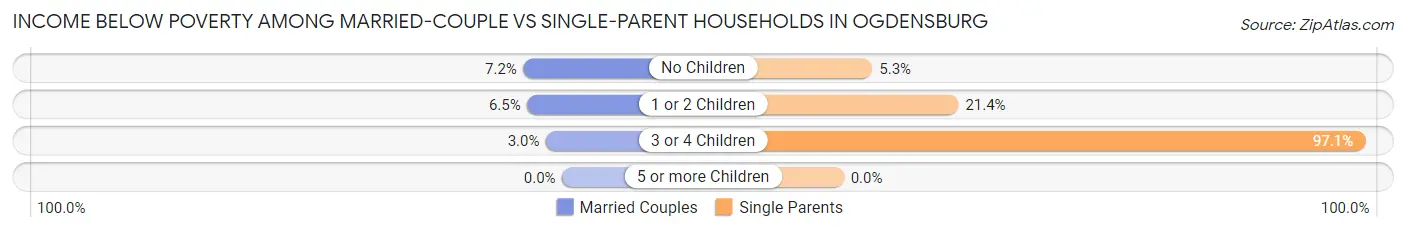
| Children | Married-Couple Families | Single-Parent Households |
| No Children | 63 (7.2%) | 18 (5.3%) |
| 1 or 2 Children | 17 (6.5%) | 124 (21.4%) |
| 3 or 4 Children | 5 (3.0%) | 135 (97.1%) |
| 5 or more Children | 0 (0.0%) | 0 (0.0%) |
| Total | 85 (6.5%) | 277 (26.2%) |
Race in Ogdensburg
The most populous races in Ogdensburg are White / Caucasian (8,633 | 87.2%), Black / African American (701 | 7.1%), and Hispanic or Latino (249 | 2.5%).
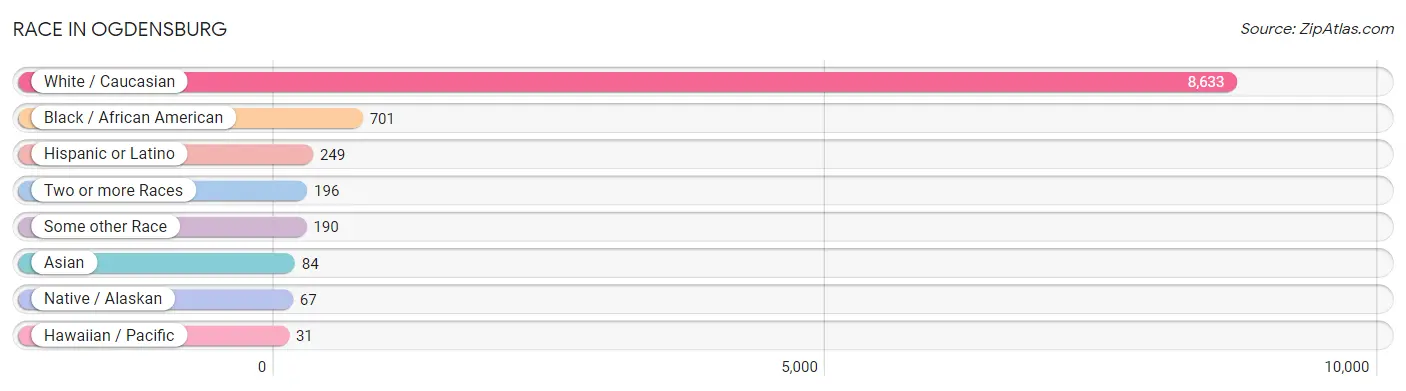
| Race | # Population | % Population |
| Asian | 84 | 0.9% |
| Black / African American | 701 | 7.1% |
| Hawaiian / Pacific | 31 | 0.3% |
| Hispanic or Latino | 249 | 2.5% |
| Native / Alaskan | 67 | 0.7% |
| White / Caucasian | 8,633 | 87.2% |
| Two or more Races | 196 | 2.0% |
| Some other Race | 190 | 1.9% |
| Total | 9,902 | 100.0% |
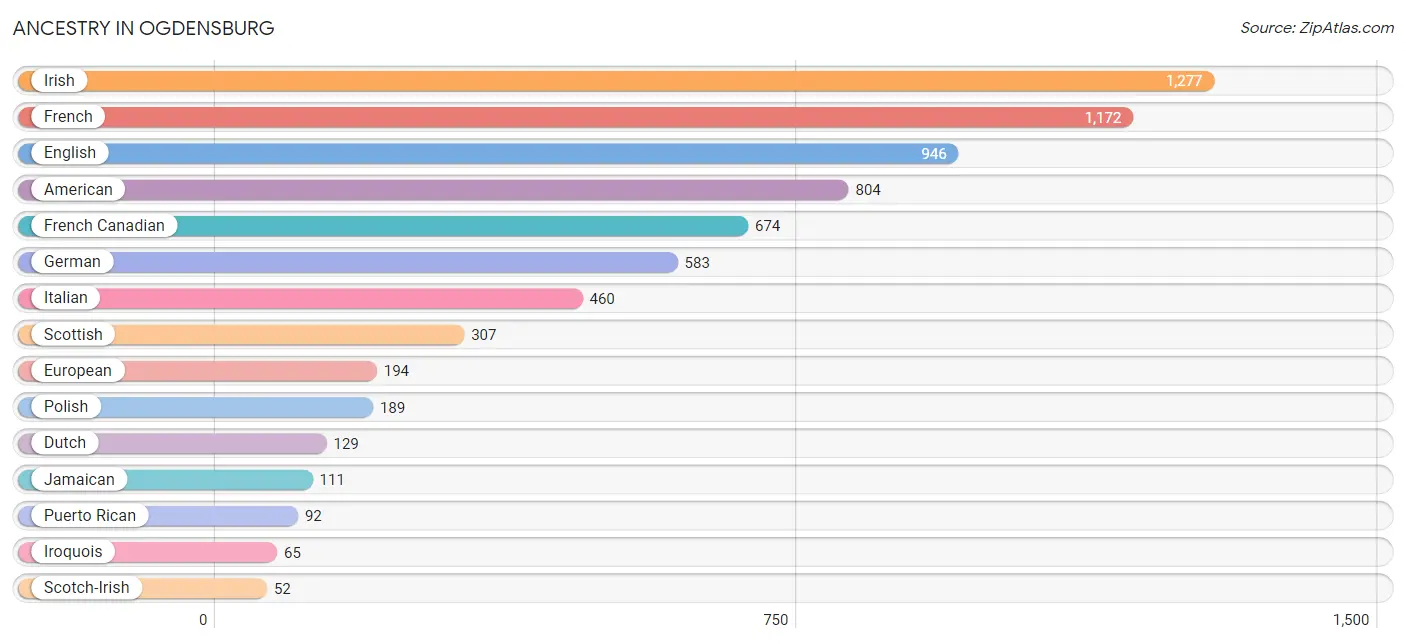
Ancestry in Ogdensburg
The most populous ancestries reported in Ogdensburg are Irish (1,277 | 12.9%), French (1,172 | 11.8%), English (946 | 9.6%), American (804 | 8.1%), and French Canadian (674 | 6.8%), together accounting for 49.2% of all Ogdensburg residents.
| Ancestry | # Population | % Population |
| African | 1 | 0.0% |
| American | 804 | 8.1% |
| Arab | 16 | 0.2% |
| Armenian | 18 | 0.2% |
| Blackfeet | 11 | 0.1% |
| British | 36 | 0.4% |
| Burmese | 12 | 0.1% |
| Canadian | 43 | 0.4% |
| Central American | 13 | 0.1% |
| Cherokee | 20 | 0.2% |
| Choctaw | 3 | 0.0% |
| Cuban | 18 | 0.2% |
| Czechoslovakian | 17 | 0.2% |
| Danish | 8 | 0.1% |
| Dominican | 28 | 0.3% |
| Dutch | 129 | 1.3% |
| Eastern European | 19 | 0.2% |
| Ecuadorian | 23 | 0.2% |
| English | 946 | 9.6% |
| Ethiopian | 1 | 0.0% |
| European | 194 | 2.0% |
| French | 1,172 | 11.8% |
| French Canadian | 674 | 6.8% |
| German | 583 | 5.9% |
| Ghanaian | 3 | 0.0% |
| Greek | 25 | 0.3% |
| Guatemalan | 13 | 0.1% |
| Indian (Asian) | 32 | 0.3% |
| Irish | 1,277 | 12.9% |
| Iroquois | 65 | 0.7% |
| Italian | 460 | 4.6% |
| Jamaican | 111 | 1.1% |
| Korean | 15 | 0.2% |
| Lebanese | 7 | 0.1% |
| Mexican | 44 | 0.4% |
| Nigerian | 18 | 0.2% |
| Northern European | 7 | 0.1% |
| Norwegian | 11 | 0.1% |
| Pakistani | 10 | 0.1% |
| Polish | 189 | 1.9% |
| Portuguese | 26 | 0.3% |
| Puerto Rican | 92 | 0.9% |
| Russian | 19 | 0.2% |
| Scandinavian | 19 | 0.2% |
| Scotch-Irish | 52 | 0.5% |
| Scottish | 307 | 3.1% |
| Slovak | 9 | 0.1% |
| South American | 23 | 0.2% |
| Subsaharan African | 23 | 0.2% |
| Swedish | 42 | 0.4% |
| Swiss | 7 | 0.1% |
| Syrian | 16 | 0.2% |
| Thai | 39 | 0.4% |
| Ukrainian | 5 | 0.1% |
| Welsh | 46 | 0.5% | View All 55 Rows |
Immigrants in Ogdensburg
The most numerous immigrant groups reported in Ogdensburg came from Latin America (207 | 2.1%), Caribbean (131 | 1.3%), Jamaica (111 | 1.1%), Asia (72 | 0.7%), and Eastern Asia (53 | 0.5%), together accounting for 5.8% of all Ogdensburg residents.
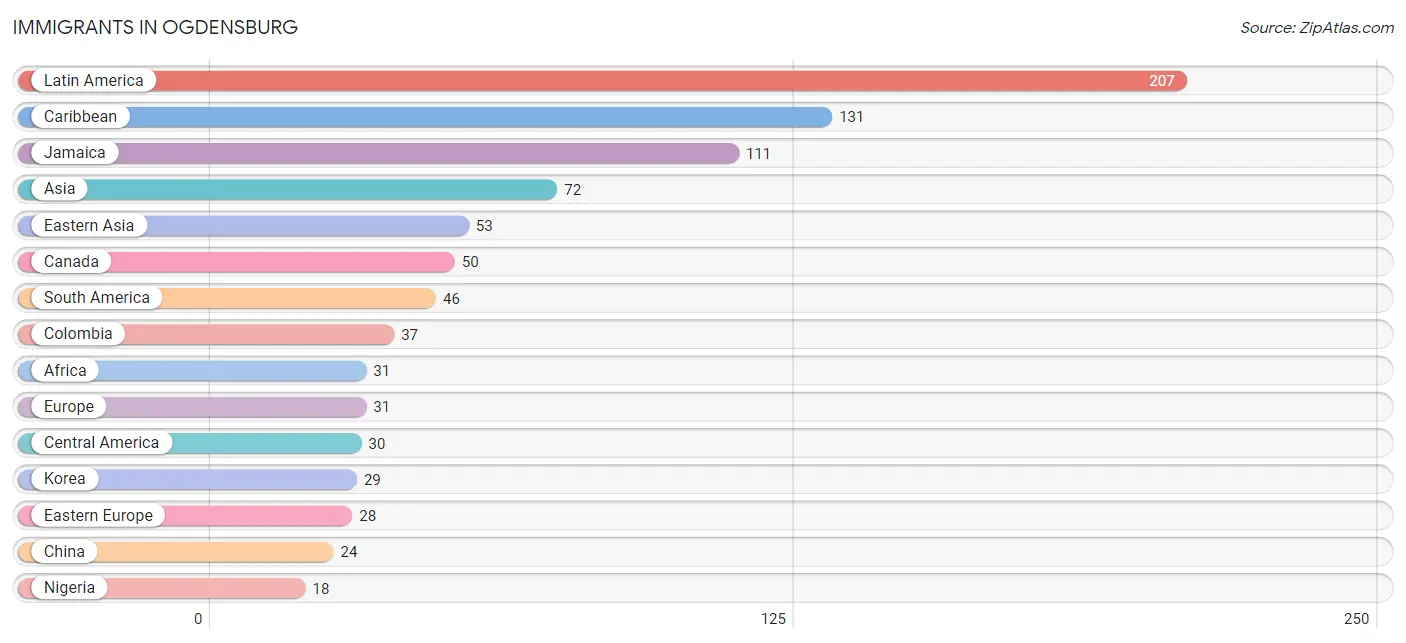
| Immigration Origin | # Population | % Population |
| Africa | 31 | 0.3% |
| Asia | 72 | 0.7% |
| Canada | 50 | 0.5% |
| Caribbean | 131 | 1.3% |
| Central America | 30 | 0.3% |
| China | 24 | 0.2% |
| Colombia | 37 | 0.4% |
| Cuba | 5 | 0.1% |
| Dominican Republic | 15 | 0.2% |
| Eastern Africa | 1 | 0.0% |
| Eastern Asia | 53 | 0.5% |
| Eastern Europe | 28 | 0.3% |
| Ecuador | 9 | 0.1% |
| Egypt | 12 | 0.1% |
| Ethiopia | 1 | 0.0% |
| Europe | 31 | 0.3% |
| Guatemala | 13 | 0.1% |
| Hong Kong | 11 | 0.1% |
| India | 6 | 0.1% |
| Jamaica | 111 | 1.1% |
| Korea | 29 | 0.3% |
| Latin America | 207 | 2.1% |
| Mexico | 17 | 0.2% |
| Nigeria | 18 | 0.2% |
| Northern Africa | 12 | 0.1% |
| Northern Europe | 3 | 0.0% |
| Philippines | 2 | 0.0% |
| Poland | 14 | 0.1% |
| Scotland | 3 | 0.0% |
| South America | 46 | 0.5% |
| South Central Asia | 7 | 0.1% |
| South Eastern Asia | 12 | 0.1% |
| Taiwan | 1 | 0.0% |
| Thailand | 10 | 0.1% |
| Ukraine | 14 | 0.1% |
| Western Africa | 18 | 0.2% | View All 36 Rows |
Sex and Age in Ogdensburg
Sex and Age in Ogdensburg
The most populous age groups in Ogdensburg are 55 to 59 Years (538 | 9.8%) for men and 55 to 59 Years (477 | 10.8%) for women.
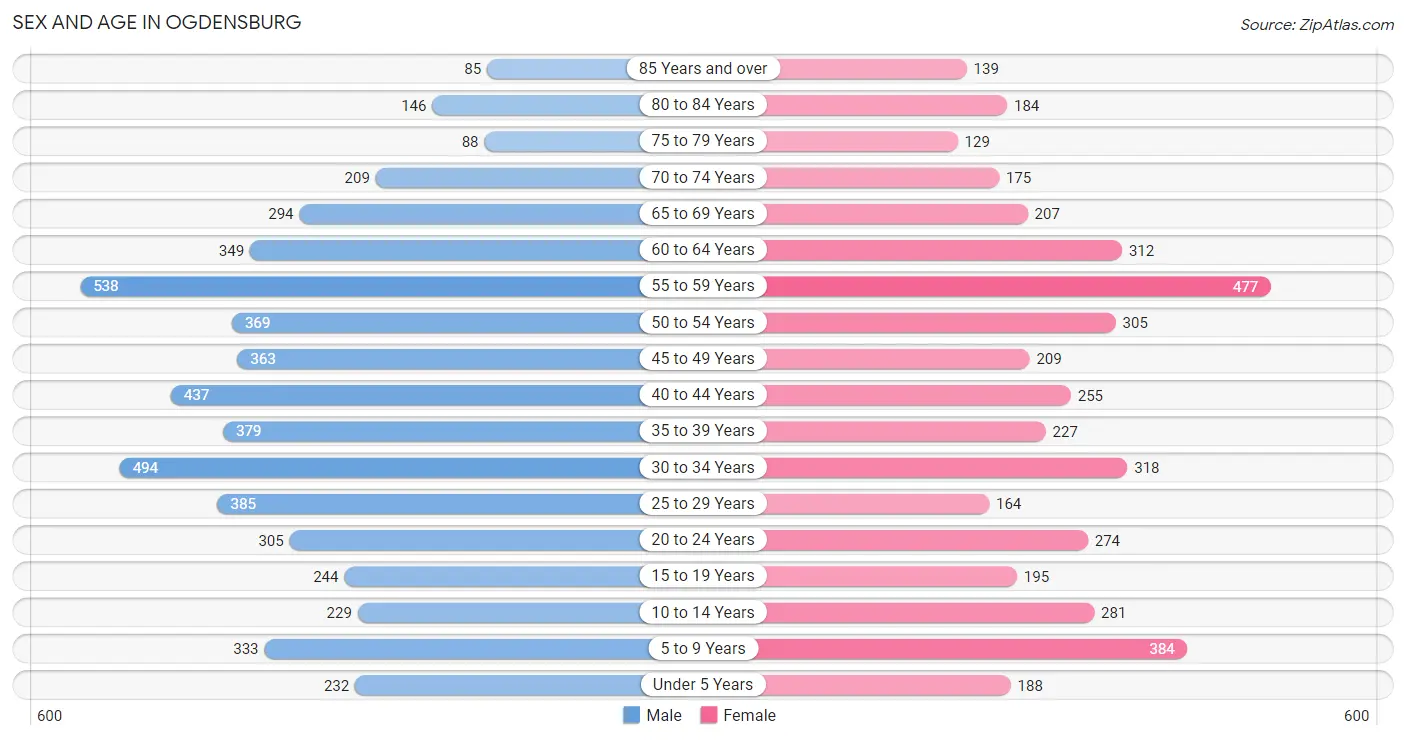
| Age Bracket | Male | Female |
| Under 5 Years | 232 (4.2%) | 188 (4.3%) |
| 5 to 9 Years | 333 (6.1%) | 384 (8.7%) |
| 10 to 14 Years | 229 (4.2%) | 281 (6.4%) |
| 15 to 19 Years | 244 (4.4%) | 195 (4.4%) |
| 20 to 24 Years | 305 (5.6%) | 274 (6.2%) |
| 25 to 29 Years | 385 (7.0%) | 164 (3.7%) |
| 30 to 34 Years | 494 (9.0%) | 318 (7.2%) |
| 35 to 39 Years | 379 (6.9%) | 227 (5.1%) |
| 40 to 44 Years | 437 (8.0%) | 255 (5.8%) |
| 45 to 49 Years | 363 (6.6%) | 209 (4.7%) |
| 50 to 54 Years | 369 (6.7%) | 305 (6.9%) |
| 55 to 59 Years | 538 (9.8%) | 477 (10.8%) |
| 60 to 64 Years | 349 (6.4%) | 312 (7.0%) |
| 65 to 69 Years | 294 (5.4%) | 207 (4.7%) |
| 70 to 74 Years | 209 (3.8%) | 175 (4.0%) |
| 75 to 79 Years | 88 (1.6%) | 129 (2.9%) |
| 80 to 84 Years | 146 (2.7%) | 184 (4.2%) |
| 85 Years and over | 85 (1.5%) | 139 (3.1%) |
| Total | 5,479 (100.0%) | 4,423 (100.0%) |
Families and Households in Ogdensburg
Median Family Size in Ogdensburg
The median family size in Ogdensburg is 2.62 persons per family, with married-couple families (1,299 | 55.2%) accounting for the largest median family size of 2.67 persons per family. On the other hand, single female/mother families (751 | 31.9%) represent the smallest median family size with 2.55 persons per family.
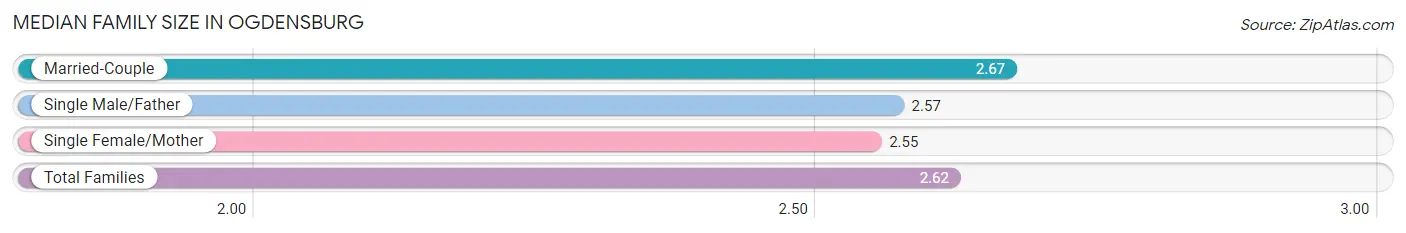
| Family Type | # Families | Family Size |
| Married-Couple | 1,299 (55.2%) | 2.67 |
| Single Male/Father | 305 (13.0%) | 2.57 |
| Single Female/Mother | 751 (31.9%) | 2.55 |
| Total Families | 2,355 (100.0%) | 2.62 |
Median Household Size in Ogdensburg
The median household size in Ogdensburg is 2.14 persons per household, with single male/father households (305 | 7.7%) accounting for the largest median household size of 3.03 persons per household. non-family households (1,593 | 40.4%) represent the smallest median household size with 1.16 persons per household.
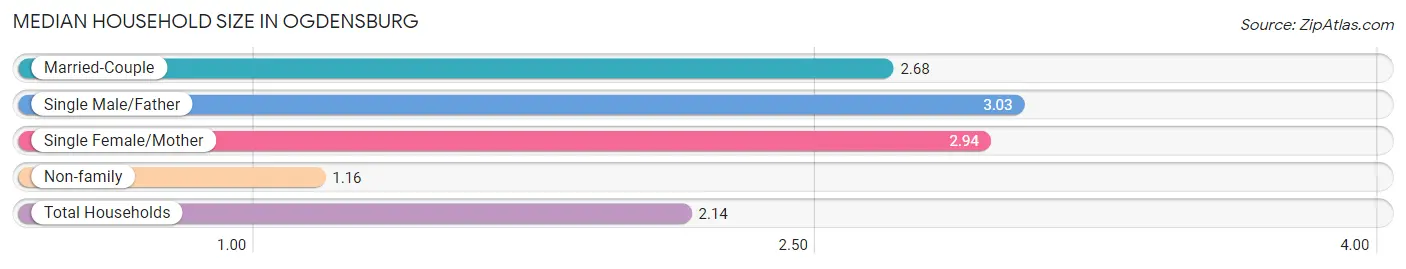
| Household Type | # Households | Household Size |
| Married-Couple | 1,299 (32.9%) | 2.68 |
| Single Male/Father | 305 (7.7%) | 3.03 |
| Single Female/Mother | 751 (19.0%) | 2.94 |
| Non-family | 1,593 (40.4%) | 1.16 |
| Total Households | 3,948 (100.0%) | 2.14 |
Household Size by Marriage Status in Ogdensburg
Out of a total of 3,948 households in Ogdensburg, 2,355 (59.7%) are family households, while 1,593 (40.4%) are nonfamily households. The most numerous type of family households are 2-person households, comprising 1,274, and the most common type of nonfamily households are 1-person households, comprising 1,334.
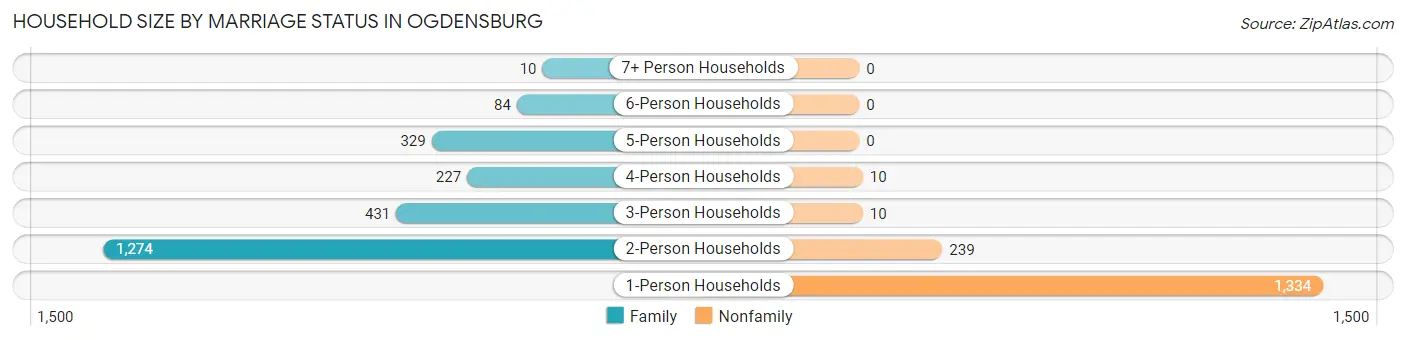
| Household Size | Family Households | Nonfamily Households |
| 1-Person Households | - | 1,334 (33.8%) |
| 2-Person Households | 1,274 (32.3%) | 239 (6.0%) |
| 3-Person Households | 431 (10.9%) | 10 (0.3%) |
| 4-Person Households | 227 (5.8%) | 10 (0.3%) |
| 5-Person Households | 329 (8.3%) | 0 (0.0%) |
| 6-Person Households | 84 (2.1%) | 0 (0.0%) |
| 7+ Person Households | 10 (0.3%) | 0 (0.0%) |
| Total | 2,355 (59.7%) | 1,593 (40.4%) |
Female Fertility in Ogdensburg
Fertility by Age in Ogdensburg
Average fertility rate in Ogdensburg is 86.0 births per 1,000 women. Women in the age bracket of 35 to 50 years have the highest fertility rate with 123.0 births per 1,000 women. Women in the age bracket of 35 to 50 years acount for 64.2% of all women with births.
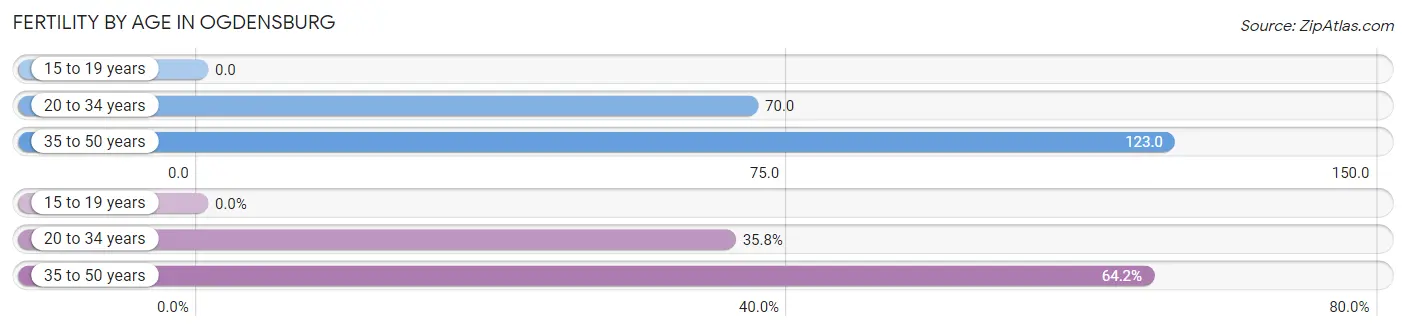
| Age Bracket | Women with Births | Births / 1,000 Women |
| 15 to 19 years | 0 (0.0%) | 0.0 |
| 20 to 34 years | 53 (35.8%) | 70.0 |
| 35 to 50 years | 95 (64.2%) | 123.0 |
| Total | 148 (100.0%) | 86.0 |
Fertility by Age by Marriage Status in Ogdensburg
67.6% of women with births (148) in Ogdensburg are married. The highest percentage of unmarried women with births falls into 20 to 34 years age bracket with 56.6% of them unmarried at the time of birth, while the lowest percentage of unmarried women with births belong to 35 to 50 years age bracket with 19.0% of them unmarried.
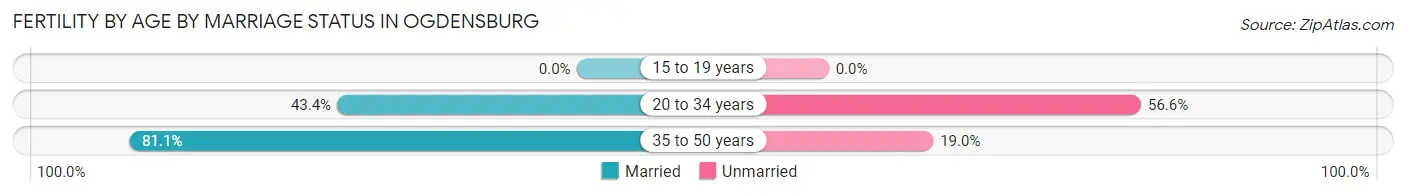
| Age Bracket | Married | Unmarried |
| 15 to 19 years | 0 (0.0%) | 0 (0.0%) |
| 20 to 34 years | 23 (43.4%) | 30 (56.6%) |
| 35 to 50 years | 77 (81.0%) | 18 (19.0%) |
| Total | 100 (67.6%) | 48 (32.4%) |
Fertility by Education in Ogdensburg
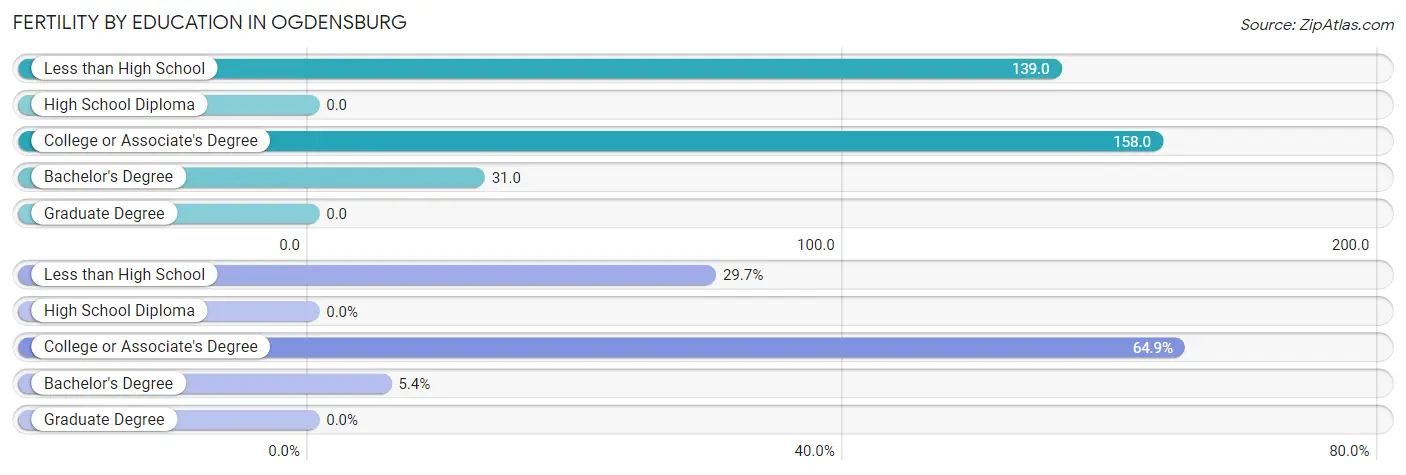
| Educational Attainment | Women with Births | Births / 1,000 Women |
| Less than High School | 44 (29.7%) | 139.0 |
| High School Diploma | 0 (0.0%) | 0.0 |
| College or Associate's Degree | 96 (64.9%) | 158.0 |
| Bachelor's Degree | 8 (5.4%) | 31.0 |
| Graduate Degree | 0 (0.0%) | 0.0 |
| Total | 148 (100.0%) | 86.0 |
Fertility by Education by Marriage Status in Ogdensburg
32.4% of women with births in Ogdensburg are unmarried. Women with the educational attainment of bachelor's degree are most likely to be married with 100.0% of them married at childbirth, while women with the educational attainment of college or associate's degree are least likely to be married with 37.5% of them unmarried at childbirth.
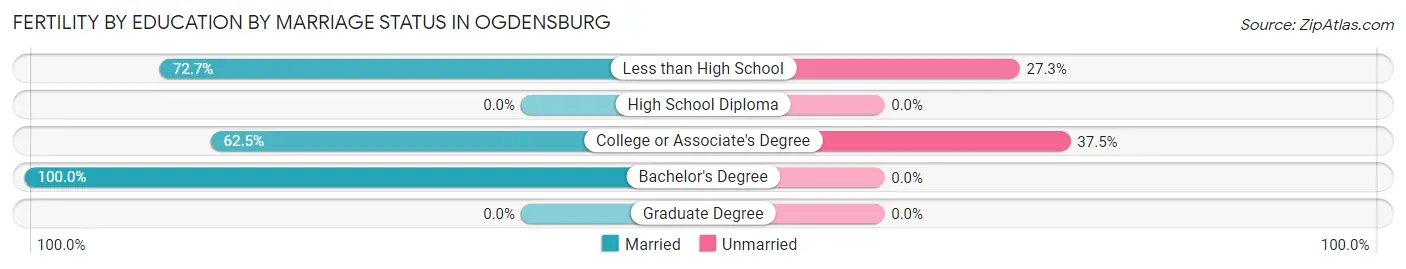
| Educational Attainment | Married | Unmarried |
| Less than High School | 32 (72.7%) | 12 (27.3%) |
| High School Diploma | 0 (0.0%) | 0 (0.0%) |
| College or Associate's Degree | 60 (62.5%) | 36 (37.5%) |
| Bachelor's Degree | 8 (100.0%) | 0 (0.0%) |
| Graduate Degree | 0 (0.0%) | 0 (0.0%) |
| Total | 100 (67.6%) | 48 (32.4%) |
Employment Characteristics in Ogdensburg
Employment by Class of Employer in Ogdensburg
Among the 3,492 employed individuals in Ogdensburg, private company employees (1,596 | 45.7%), state government employees (549 | 15.7%), and local government employees (444 | 12.7%) make up the most common classes of employment.
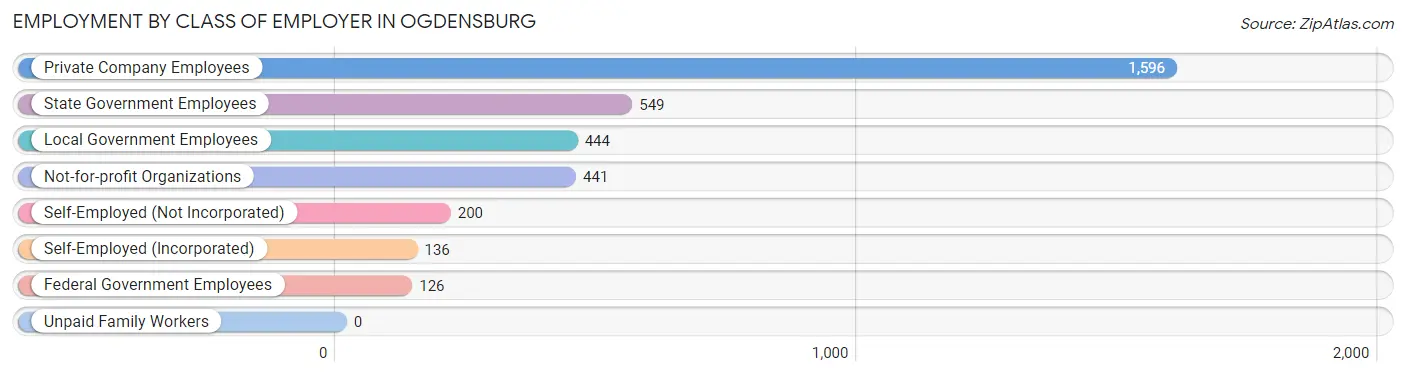
| Employer Class | # Employees | % Employees |
| Private Company Employees | 1,596 | 45.7% |
| Self-Employed (Incorporated) | 136 | 3.9% |
| Self-Employed (Not Incorporated) | 200 | 5.7% |
| Not-for-profit Organizations | 441 | 12.6% |
| Local Government Employees | 444 | 12.7% |
| State Government Employees | 549 | 15.7% |
| Federal Government Employees | 126 | 3.6% |
| Unpaid Family Workers | 0 | 0.0% |
| Total | 3,492 | 100.0% |
Employment Status by Age in Ogdensburg
According to the labor force statistics for Ogdensburg, out of the total population over 16 years of age (8,178), 46.5% or 3,803 individuals are in the labor force, with 6.9% or 262 of them unemployed. The age group with the highest labor force participation rate is 35 to 44 years, with 71.1% or 923 individuals in the labor force. Within the labor force, the 16 to 19 years age range has the highest percentage of unemployed individuals, with 46.2% or 42 of them being unemployed.
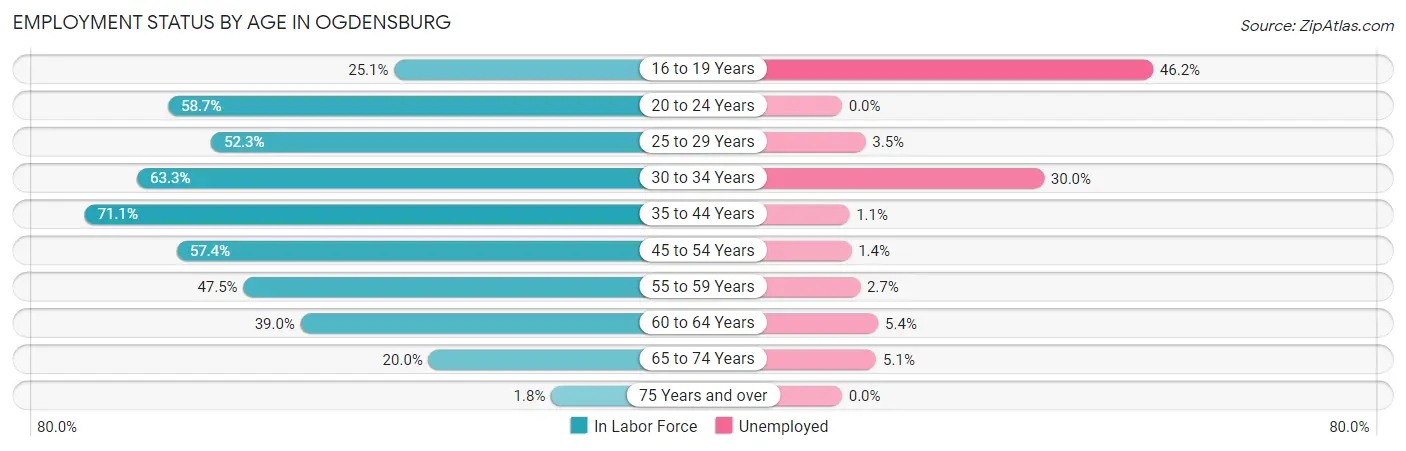
| Age Bracket | In Labor Force | Unemployed |
| 16 to 19 Years | 91 (25.1%) | 42 (46.2%) |
| 20 to 24 Years | 340 (58.7%) | 0 (0.0%) |
| 25 to 29 Years | 287 (52.3%) | 10 (3.5%) |
| 30 to 34 Years | 514 (63.3%) | 154 (30.0%) |
| 35 to 44 Years | 923 (71.1%) | 10 (1.1%) |
| 45 to 54 Years | 715 (57.4%) | 10 (1.4%) |
| 55 to 59 Years | 482 (47.5%) | 13 (2.7%) |
| 60 to 64 Years | 258 (39.0%) | 14 (5.4%) |
| 65 to 74 Years | 177 (20.0%) | 9 (5.1%) |
| 75 Years and over | 14 (1.8%) | 0 (0.0%) |
| Total | 3,803 (46.5%) | 262 (6.9%) |
Employment Status by Educational Attainment in Ogdensburg
According to labor force statistics for Ogdensburg, 57.0% of individuals (3,181) out of the total population between 25 and 64 years of age (5,581) are in the labor force, with 6.6% or 210 of them being unemployed. The group with the highest labor force participation rate are those with the educational attainment of bachelor's degree or higher, with 79.5% or 833 individuals in the labor force. Within the labor force, individuals with less than high school education have the highest percentage of unemployment, with 39.3% or 90 of them being unemployed.
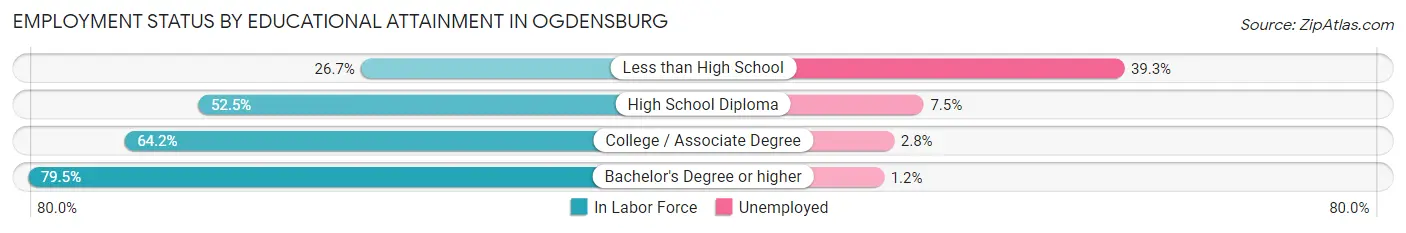
| Educational Attainment | In Labor Force | Unemployed |
| Less than High School | 229 (26.7%) | 337 (39.3%) |
| High School Diploma | 1,094 (52.5%) | 156 (7.5%) |
| College / Associate Degree | 1,021 (64.2%) | 45 (2.8%) |
| Bachelor's Degree or higher | 833 (79.5%) | 13 (1.2%) |
| Total | 3,181 (57.0%) | 368 (6.6%) |
Employment Occupations by Sex in Ogdensburg
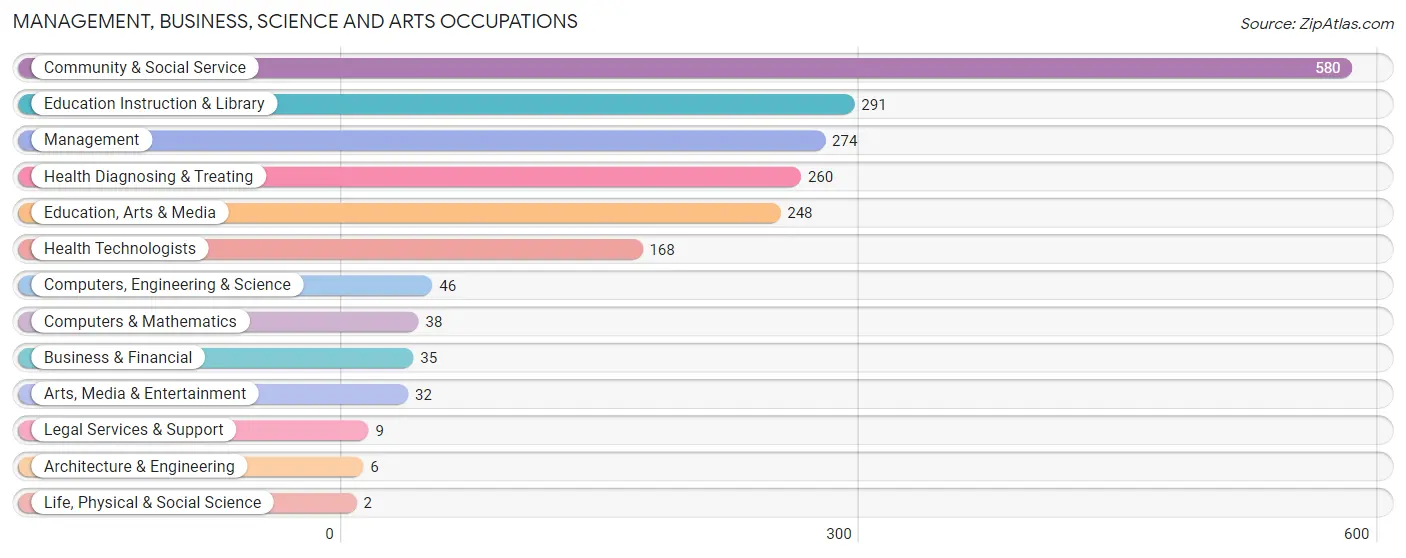
Management, Business, Science and Arts Occupations
The most common Management, Business, Science and Arts occupations in Ogdensburg are Community & Social Service (580 | 16.5%), Education Instruction & Library (291 | 8.3%), Management (274 | 7.8%), Health Diagnosing & Treating (260 | 7.4%), and Education, Arts & Media (248 | 7.0%).
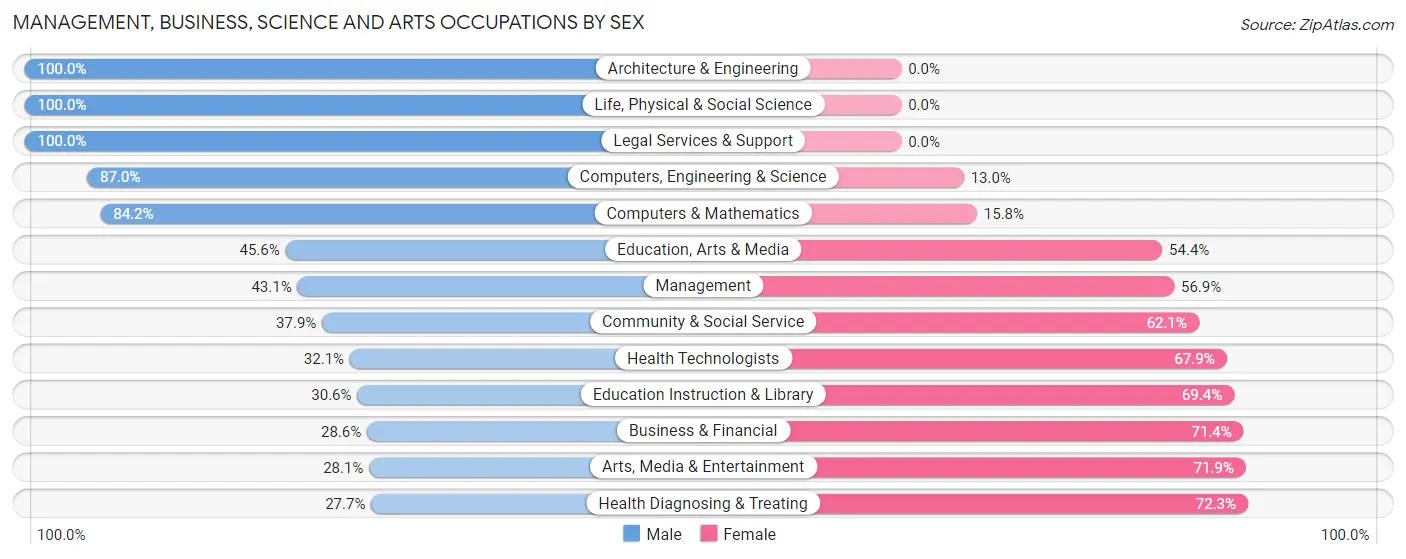
Management, Business, Science and Arts Occupations by Sex
Within the Management, Business, Science and Arts occupations in Ogdensburg, the most male-oriented occupations are Architecture & Engineering (100.0%), Life, Physical & Social Science (100.0%), and Legal Services & Support (100.0%), while the most female-oriented occupations are Health Diagnosing & Treating (72.3%), Arts, Media & Entertainment (71.9%), and Business & Financial (71.4%).
| Occupation | Male | Female |
| Management | 118 (43.1%) | 156 (56.9%) |
| Business & Financial | 10 (28.6%) | 25 (71.4%) |
| Computers, Engineering & Science | 40 (87.0%) | 6 (13.0%) |
| Computers & Mathematics | 32 (84.2%) | 6 (15.8%) |
| Architecture & Engineering | 6 (100.0%) | 0 (0.0%) |
| Life, Physical & Social Science | 2 (100.0%) | 0 (0.0%) |
| Community & Social Service | 220 (37.9%) | 360 (62.1%) |
| Education, Arts & Media | 113 (45.6%) | 135 (54.4%) |
| Legal Services & Support | 9 (100.0%) | 0 (0.0%) |
| Education Instruction & Library | 89 (30.6%) | 202 (69.4%) |
| Arts, Media & Entertainment | 9 (28.1%) | 23 (71.9%) |
| Health Diagnosing & Treating | 72 (27.7%) | 188 (72.3%) |
| Health Technologists | 54 (32.1%) | 114 (67.9%) |
| Total (Category) | 460 (38.5%) | 735 (61.5%) |
| Total (Overall) | 1,866 (52.9%) | 1,660 (47.1%) |
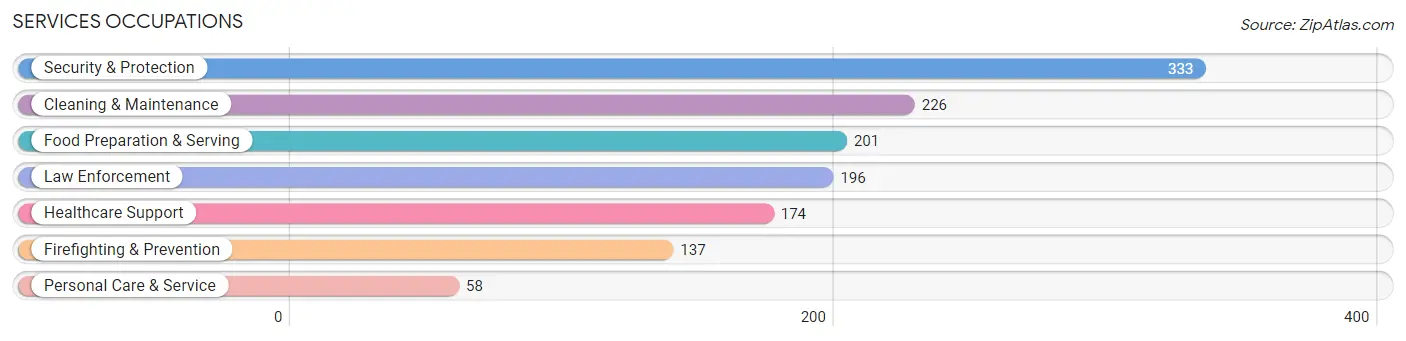
Services Occupations
The most common Services occupations in Ogdensburg are Security & Protection (333 | 9.4%), Cleaning & Maintenance (226 | 6.4%), Food Preparation & Serving (201 | 5.7%), Law Enforcement (196 | 5.6%), and Healthcare Support (174 | 4.9%).
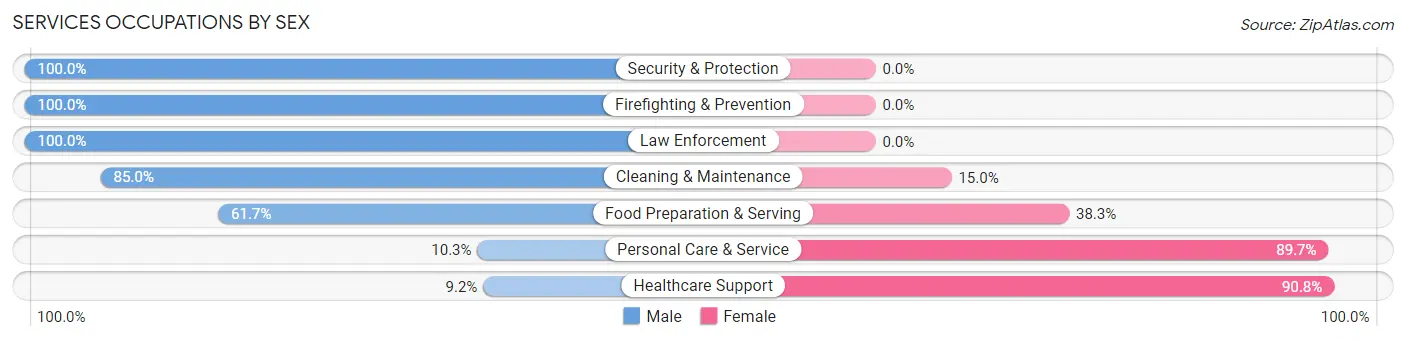
Services Occupations by Sex
Within the Services occupations in Ogdensburg, the most male-oriented occupations are Security & Protection (100.0%), Firefighting & Prevention (100.0%), and Law Enforcement (100.0%), while the most female-oriented occupations are Healthcare Support (90.8%), Personal Care & Service (89.7%), and Food Preparation & Serving (38.3%).
| Occupation | Male | Female |
| Healthcare Support | 16 (9.2%) | 158 (90.8%) |
| Security & Protection | 333 (100.0%) | 0 (0.0%) |
| Firefighting & Prevention | 137 (100.0%) | 0 (0.0%) |
| Law Enforcement | 196 (100.0%) | 0 (0.0%) |
| Food Preparation & Serving | 124 (61.7%) | 77 (38.3%) |
| Cleaning & Maintenance | 192 (85.0%) | 34 (15.0%) |
| Personal Care & Service | 6 (10.3%) | 52 (89.7%) |
| Total (Category) | 671 (67.6%) | 321 (32.4%) |
| Total (Overall) | 1,866 (52.9%) | 1,660 (47.1%) |
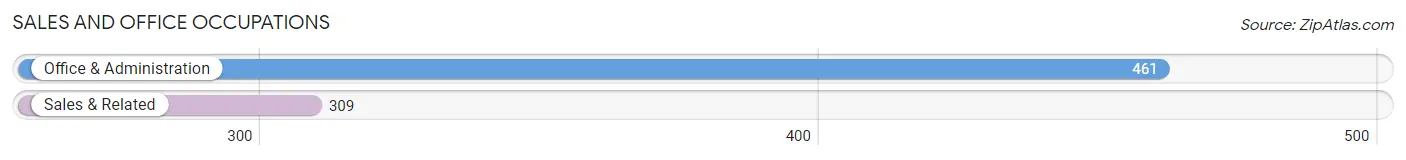
Sales and Office Occupations
The most common Sales and Office occupations in Ogdensburg are Office & Administration (461 | 13.1%), and Sales & Related (309 | 8.8%).
Sales and Office Occupations by Sex
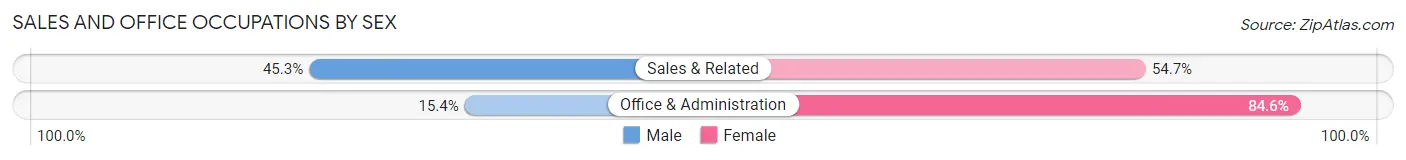
| Occupation | Male | Female |
| Sales & Related | 140 (45.3%) | 169 (54.7%) |
| Office & Administration | 71 (15.4%) | 390 (84.6%) |
| Total (Category) | 211 (27.4%) | 559 (72.6%) |
| Total (Overall) | 1,866 (52.9%) | 1,660 (47.1%) |
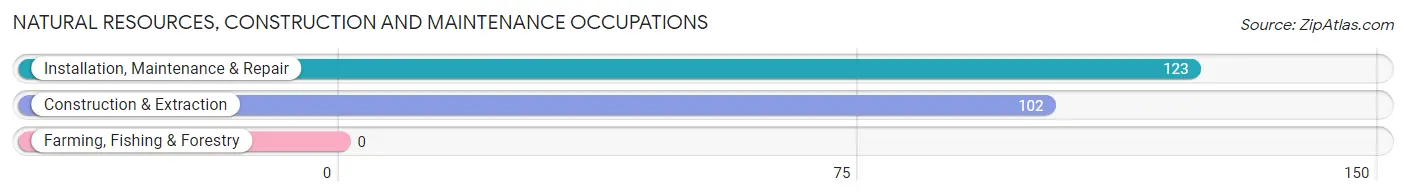
Natural Resources, Construction and Maintenance Occupations
The most common Natural Resources, Construction and Maintenance occupations in Ogdensburg are Installation, Maintenance & Repair (123 | 3.5%), and Construction & Extraction (102 | 2.9%).
Natural Resources, Construction and Maintenance Occupations by Sex
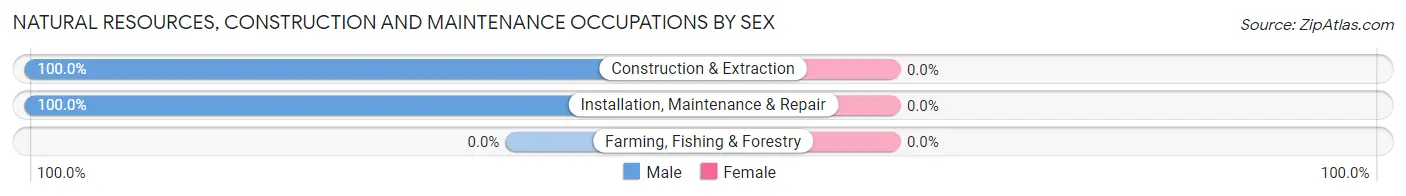
| Occupation | Male | Female |
| Farming, Fishing & Forestry | 0 (0.0%) | 0 (0.0%) |
| Construction & Extraction | 102 (100.0%) | 0 (0.0%) |
| Installation, Maintenance & Repair | 123 (100.0%) | 0 (0.0%) |
| Total (Category) | 225 (100.0%) | 0 (0.0%) |
| Total (Overall) | 1,866 (52.9%) | 1,660 (47.1%) |
Production, Transportation and Moving Occupations
The most common Production, Transportation and Moving occupations in Ogdensburg are Material Moving (147 | 4.2%), Transportation (104 | 2.9%), and Production (93 | 2.6%).
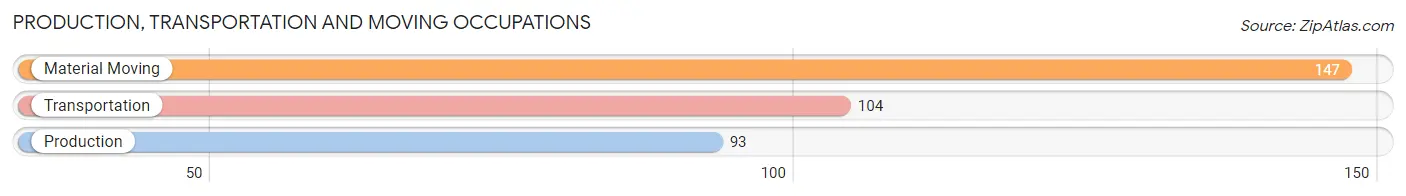
Production, Transportation and Moving Occupations by Sex
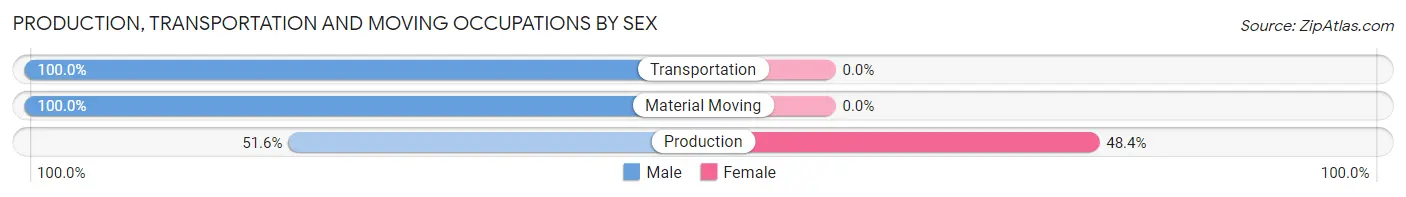
| Occupation | Male | Female |
| Production | 48 (51.6%) | 45 (48.4%) |
| Transportation | 104 (100.0%) | 0 (0.0%) |
| Material Moving | 147 (100.0%) | 0 (0.0%) |
| Total (Category) | 299 (86.9%) | 45 (13.1%) |
| Total (Overall) | 1,866 (52.9%) | 1,660 (47.1%) |
Employment Industries by Sex in Ogdensburg
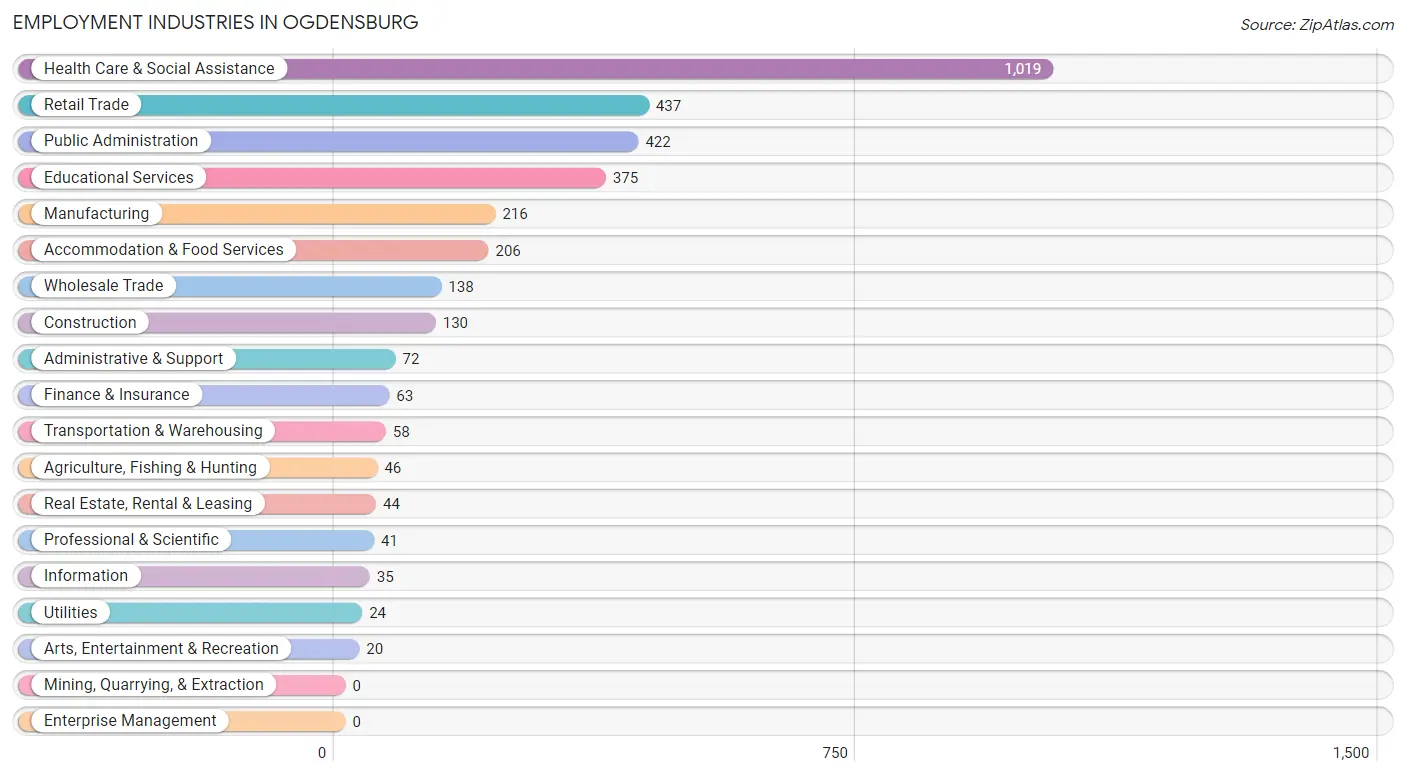
Employment Industries in Ogdensburg
The major employment industries in Ogdensburg include Health Care & Social Assistance (1,019 | 28.9%), Retail Trade (437 | 12.4%), Public Administration (422 | 12.0%), Educational Services (375 | 10.6%), and Manufacturing (216 | 6.1%).
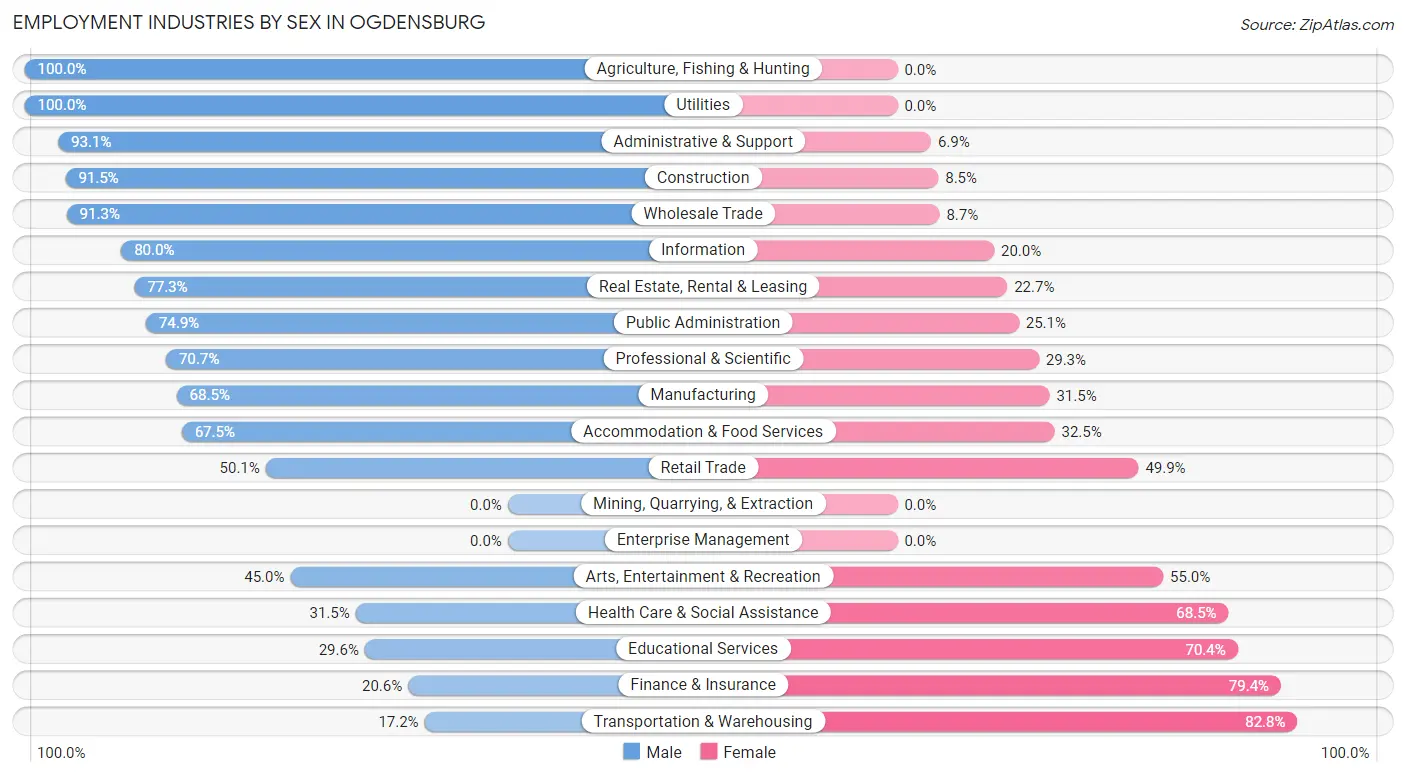
Employment Industries by Sex in Ogdensburg
The Ogdensburg industries that see more men than women are Agriculture, Fishing & Hunting (100.0%), Utilities (100.0%), and Administrative & Support (93.1%), whereas the industries that tend to have a higher number of women are Transportation & Warehousing (82.8%), Finance & Insurance (79.4%), and Educational Services (70.4%).
| Industry | Male | Female |
| Agriculture, Fishing & Hunting | 46 (100.0%) | 0 (0.0%) |
| Mining, Quarrying, & Extraction | 0 (0.0%) | 0 (0.0%) |
| Construction | 119 (91.5%) | 11 (8.5%) |
| Manufacturing | 148 (68.5%) | 68 (31.5%) |
| Wholesale Trade | 126 (91.3%) | 12 (8.7%) |
| Retail Trade | 219 (50.1%) | 218 (49.9%) |
| Transportation & Warehousing | 10 (17.2%) | 48 (82.8%) |
| Utilities | 24 (100.0%) | 0 (0.0%) |
| Information | 28 (80.0%) | 7 (20.0%) |
| Finance & Insurance | 13 (20.6%) | 50 (79.4%) |
| Real Estate, Rental & Leasing | 34 (77.3%) | 10 (22.7%) |
| Professional & Scientific | 29 (70.7%) | 12 (29.3%) |
| Enterprise Management | 0 (0.0%) | 0 (0.0%) |
| Administrative & Support | 67 (93.1%) | 5 (6.9%) |
| Educational Services | 111 (29.6%) | 264 (70.4%) |
| Health Care & Social Assistance | 321 (31.5%) | 698 (68.5%) |
| Arts, Entertainment & Recreation | 9 (45.0%) | 11 (55.0%) |
| Accommodation & Food Services | 139 (67.5%) | 67 (32.5%) |
| Public Administration | 316 (74.9%) | 106 (25.1%) |
| Total | 1,866 (52.9%) | 1,660 (47.1%) |
Education in Ogdensburg
School Enrollment in Ogdensburg
The most common levels of schooling among the 1,853 students in Ogdensburg are elementary school (560 | 30.2%), high school (423 | 22.8%), and college / undergraduate (301 | 16.2%).
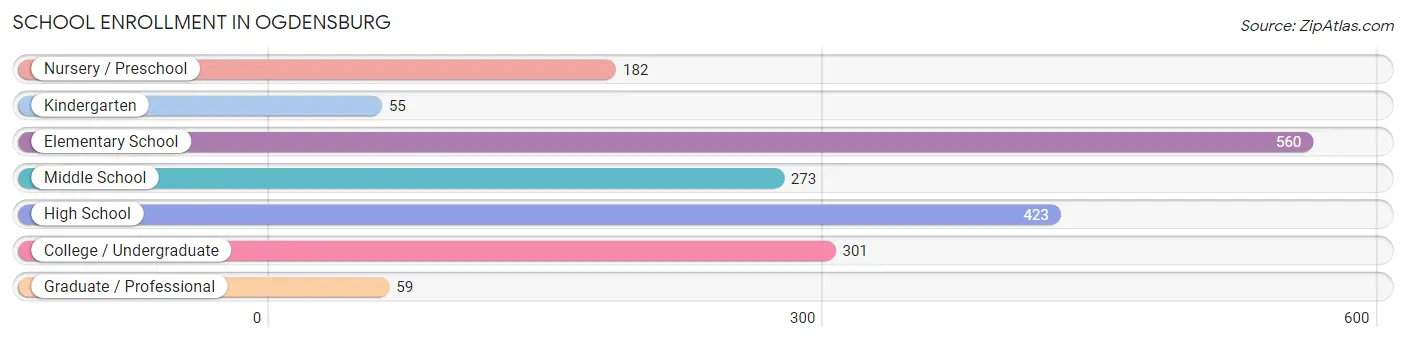
| School Level | # Students | % Students |
| Nursery / Preschool | 182 | 9.8% |
| Kindergarten | 55 | 3.0% |
| Elementary School | 560 | 30.2% |
| Middle School | 273 | 14.7% |
| High School | 423 | 22.8% |
| College / Undergraduate | 301 | 16.2% |
| Graduate / Professional | 59 | 3.2% |
| Total | 1,853 | 100.0% |
School Enrollment by Age by Funding Source in Ogdensburg
Out of a total of 1,853 students who are enrolled in schools in Ogdensburg, 180 (9.7%) attend a private institution, while the remaining 1,673 (90.3%) are enrolled in public schools. The age group of 25 to 34 year olds has the highest likelihood of being enrolled in private schools, with 42 (56.0% in the age bracket) enrolled. Conversely, the age group of 18 to 19 year olds has the lowest likelihood of being enrolled in a private school, with 143 (100.0% in the age bracket) attending a public institution.
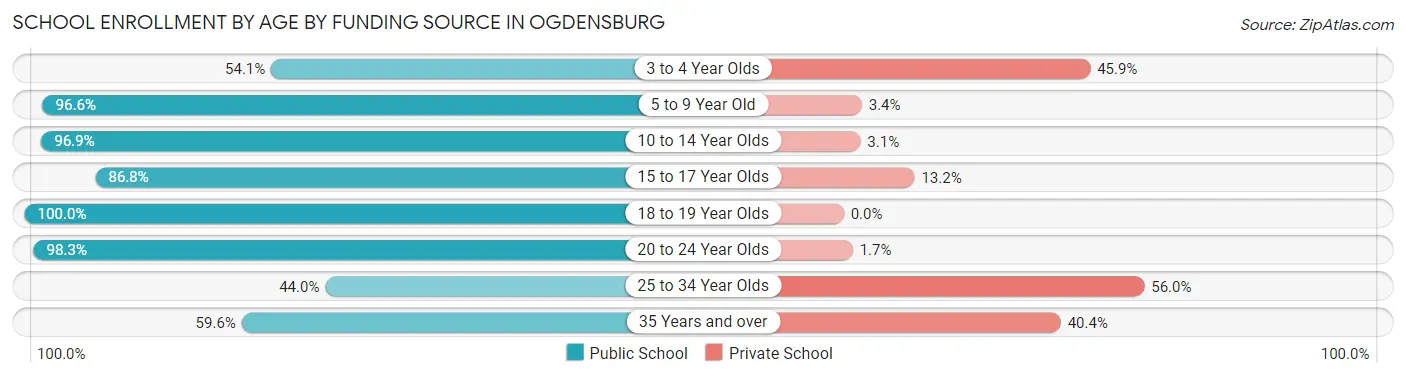
| Age Bracket | Public School | Private School |
| 3 to 4 Year Olds | 53 (54.1%) | 45 (45.9%) |
| 5 to 9 Year Old | 631 (96.6%) | 22 (3.4%) |
| 10 to 14 Year Olds | 373 (96.9%) | 12 (3.1%) |
| 15 to 17 Year Olds | 237 (86.8%) | 36 (13.2%) |
| 18 to 19 Year Olds | 143 (100.0%) | 0 (0.0%) |
| 20 to 24 Year Olds | 176 (98.3%) | 3 (1.7%) |
| 25 to 34 Year Olds | 33 (44.0%) | 42 (56.0%) |
| 35 Years and over | 28 (59.6%) | 19 (40.4%) |
| Total | 1,673 (90.3%) | 180 (9.7%) |
Educational Attainment by Field of Study in Ogdensburg
Education (342 | 26.5%), business (127 | 9.9%), arts & humanities (119 | 9.2%), social sciences (116 | 9.0%), and psychology (104 | 8.1%) are the most common fields of study among 1,289 individuals in Ogdensburg who have obtained a bachelor's degree or higher.
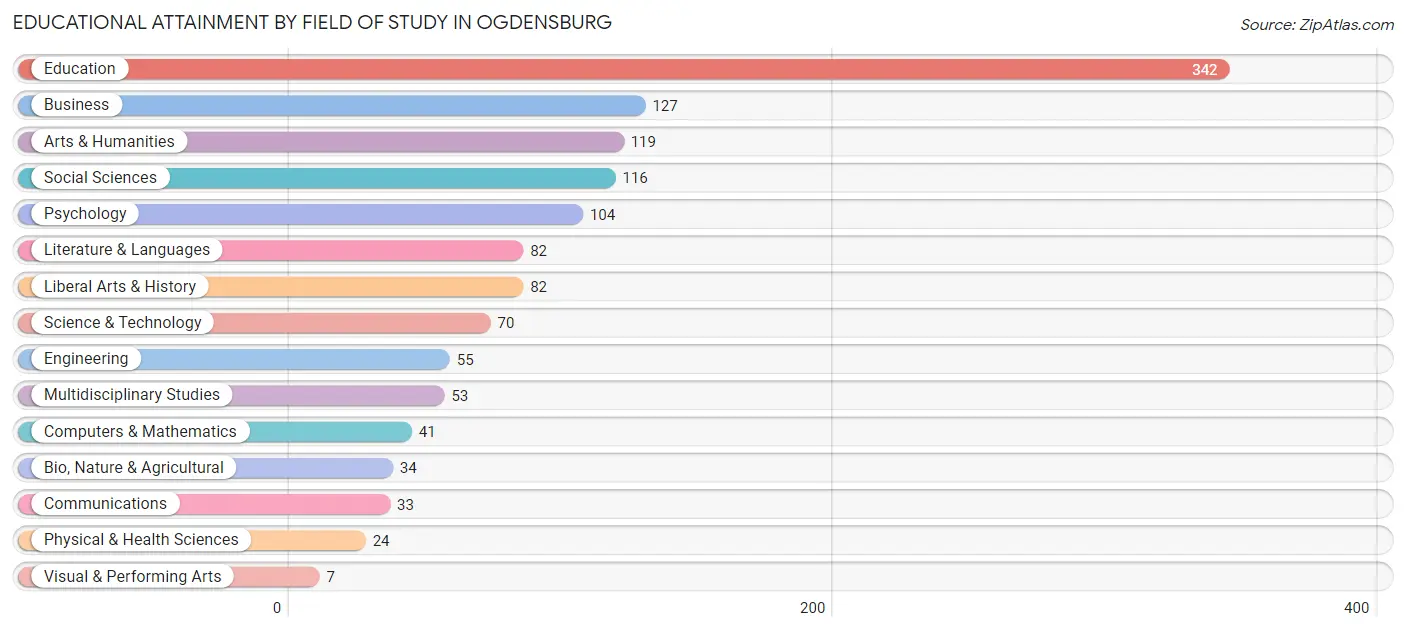
| Field of Study | # Graduates | % Graduates |
| Computers & Mathematics | 41 | 3.2% |
| Bio, Nature & Agricultural | 34 | 2.6% |
| Physical & Health Sciences | 24 | 1.9% |
| Psychology | 104 | 8.1% |
| Social Sciences | 116 | 9.0% |
| Engineering | 55 | 4.3% |
| Multidisciplinary Studies | 53 | 4.1% |
| Science & Technology | 70 | 5.4% |
| Business | 127 | 9.9% |
| Education | 342 | 26.5% |
| Literature & Languages | 82 | 6.4% |
| Liberal Arts & History | 82 | 6.4% |
| Visual & Performing Arts | 7 | 0.5% |
| Communications | 33 | 2.6% |
| Arts & Humanities | 119 | 9.2% |
| Total | 1,289 | 100.0% |
Transportation & Commute in Ogdensburg
Vehicle Availability by Sex in Ogdensburg
The most prevalent vehicle ownership categories in Ogdensburg are males with 2 vehicles (910, accounting for 50.2%) and females with 2 vehicles (786, making up 55.6%).
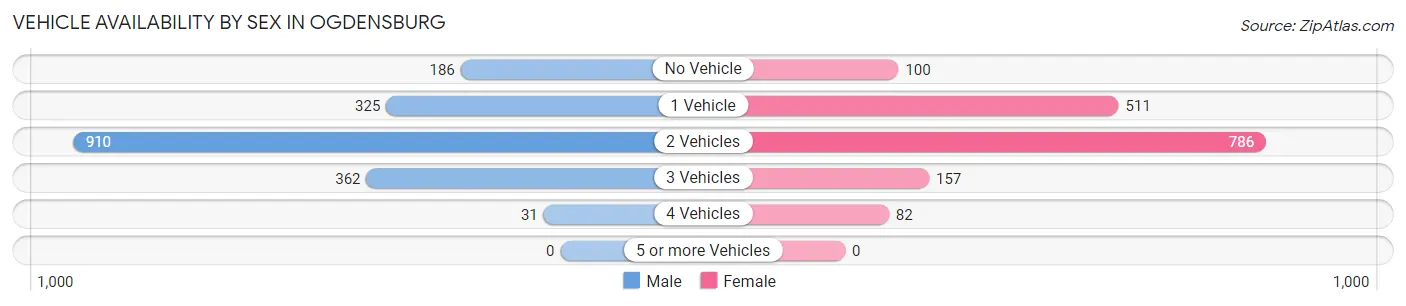
| Vehicles Available | Male | Female |
| No Vehicle | 186 (10.2%) | 100 (6.1%) |
| 1 Vehicle | 325 (17.9%) | 511 (31.2%) |
| 2 Vehicles | 910 (50.2%) | 786 (48.0%) |
| 3 Vehicles | 362 (20.0%) | 157 (9.6%) |
| 4 Vehicles | 31 (1.7%) | 82 (5.0%) |
| 5 or more Vehicles | 0 (0.0%) | 0 (0.0%) |
| Total | 1,814 (100.0%) | 1,636 (100.0%) |
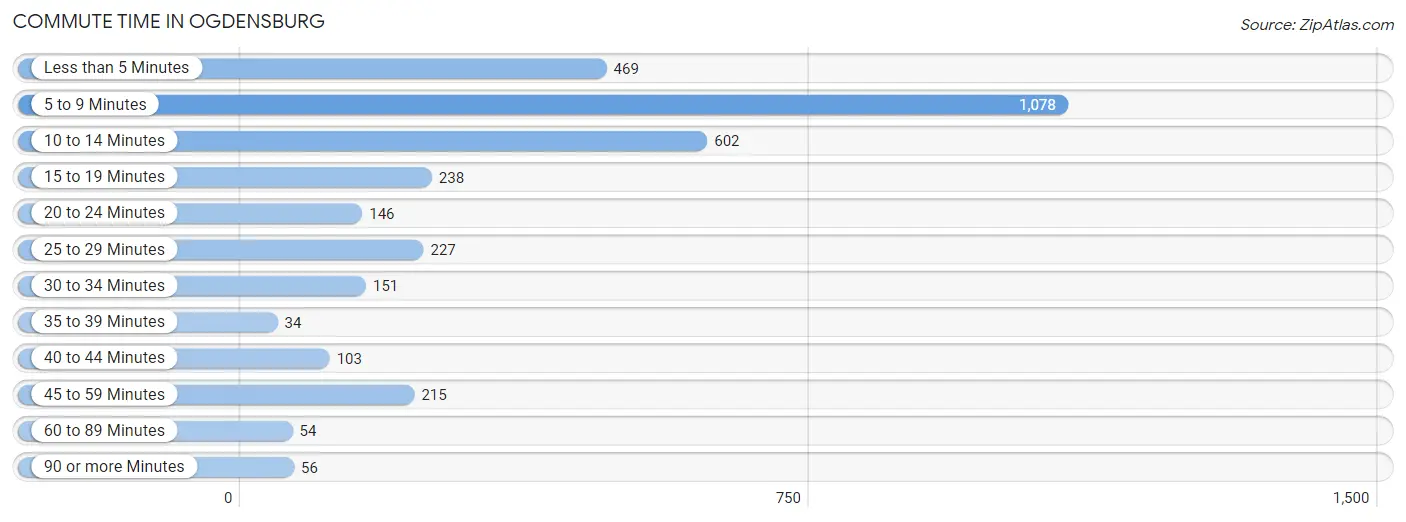
Commute Time in Ogdensburg
The most frequently occuring commute durations in Ogdensburg are 5 to 9 minutes (1,078 commuters, 32.0%), 10 to 14 minutes (602 commuters, 17.8%), and less than 5 minutes (469 commuters, 13.9%).
| Commute Time | # Commuters | % Commuters |
| Less than 5 Minutes | 469 | 13.9% |
| 5 to 9 Minutes | 1,078 | 32.0% |
| 10 to 14 Minutes | 602 | 17.8% |
| 15 to 19 Minutes | 238 | 7.1% |
| 20 to 24 Minutes | 146 | 4.3% |
| 25 to 29 Minutes | 227 | 6.7% |
| 30 to 34 Minutes | 151 | 4.5% |
| 35 to 39 Minutes | 34 | 1.0% |
| 40 to 44 Minutes | 103 | 3.0% |
| 45 to 59 Minutes | 215 | 6.4% |
| 60 to 89 Minutes | 54 | 1.6% |
| 90 or more Minutes | 56 | 1.7% |
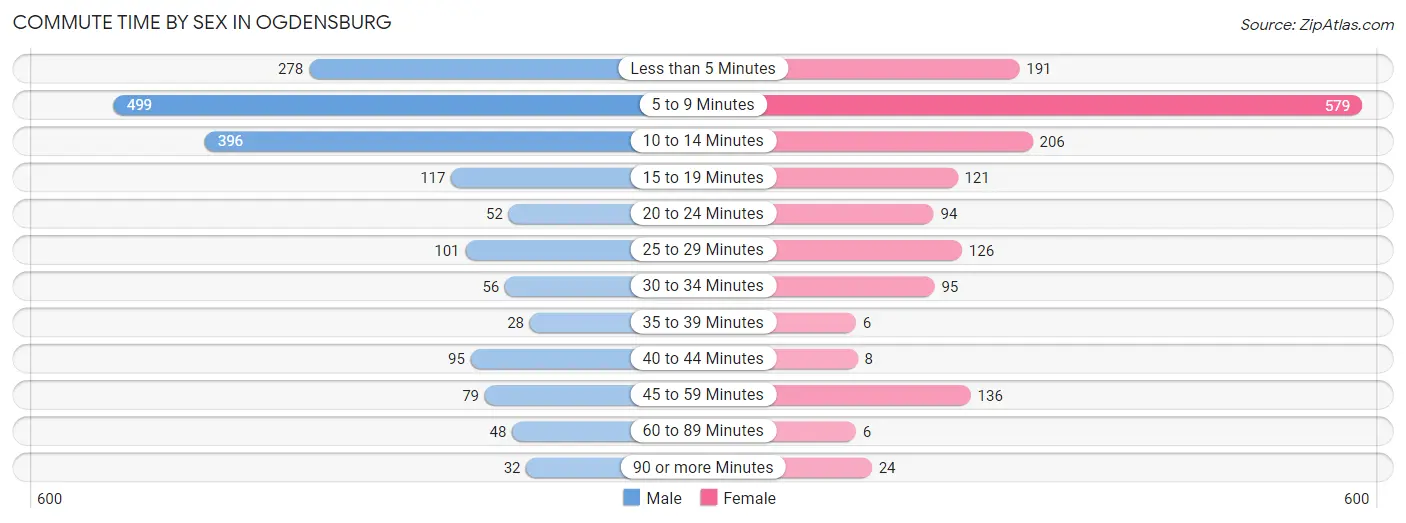
Commute Time by Sex in Ogdensburg
The most common commute times in Ogdensburg are 5 to 9 minutes (499 commuters, 28.0%) for males and 5 to 9 minutes (579 commuters, 36.4%) for females.
| Commute Time | Male | Female |
| Less than 5 Minutes | 278 (15.6%) | 191 (12.0%) |
| 5 to 9 Minutes | 499 (28.0%) | 579 (36.4%) |
| 10 to 14 Minutes | 396 (22.2%) | 206 (12.9%) |
| 15 to 19 Minutes | 117 (6.6%) | 121 (7.6%) |
| 20 to 24 Minutes | 52 (2.9%) | 94 (5.9%) |
| 25 to 29 Minutes | 101 (5.7%) | 126 (7.9%) |
| 30 to 34 Minutes | 56 (3.1%) | 95 (6.0%) |
| 35 to 39 Minutes | 28 (1.6%) | 6 (0.4%) |
| 40 to 44 Minutes | 95 (5.3%) | 8 (0.5%) |
| 45 to 59 Minutes | 79 (4.4%) | 136 (8.5%) |
| 60 to 89 Minutes | 48 (2.7%) | 6 (0.4%) |
| 90 or more Minutes | 32 (1.8%) | 24 (1.5%) |
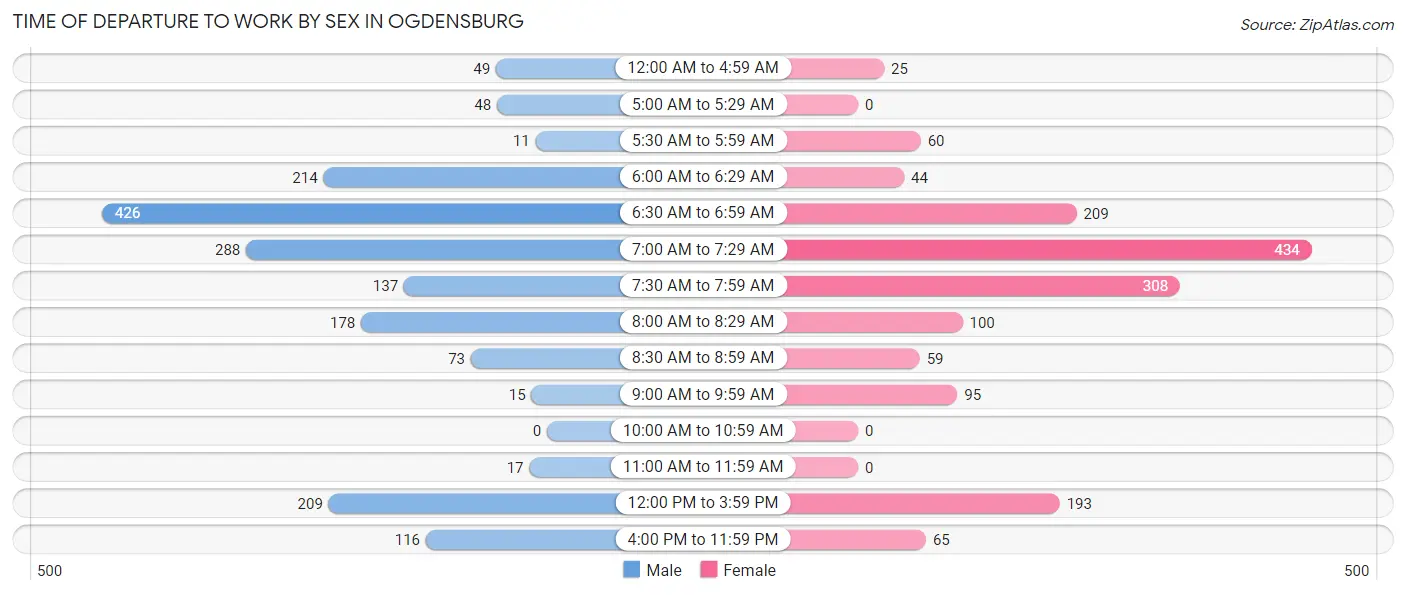
Time of Departure to Work by Sex in Ogdensburg
The most frequent times of departure to work in Ogdensburg are 6:30 AM to 6:59 AM (426, 23.9%) for males and 7:00 AM to 7:29 AM (434, 27.3%) for females.
| Time of Departure | Male | Female |
| 12:00 AM to 4:59 AM | 49 (2.8%) | 25 (1.6%) |
| 5:00 AM to 5:29 AM | 48 (2.7%) | 0 (0.0%) |
| 5:30 AM to 5:59 AM | 11 (0.6%) | 60 (3.8%) |
| 6:00 AM to 6:29 AM | 214 (12.0%) | 44 (2.8%) |
| 6:30 AM to 6:59 AM | 426 (23.9%) | 209 (13.1%) |
| 7:00 AM to 7:29 AM | 288 (16.2%) | 434 (27.3%) |
| 7:30 AM to 7:59 AM | 137 (7.7%) | 308 (19.4%) |
| 8:00 AM to 8:29 AM | 178 (10.0%) | 100 (6.3%) |
| 8:30 AM to 8:59 AM | 73 (4.1%) | 59 (3.7%) |
| 9:00 AM to 9:59 AM | 15 (0.8%) | 95 (6.0%) |
| 10:00 AM to 10:59 AM | 0 (0.0%) | 0 (0.0%) |
| 11:00 AM to 11:59 AM | 17 (0.9%) | 0 (0.0%) |
| 12:00 PM to 3:59 PM | 209 (11.7%) | 193 (12.1%) |
| 4:00 PM to 11:59 PM | 116 (6.5%) | 65 (4.1%) |
| Total | 1,781 (100.0%) | 1,592 (100.0%) |
Housing Occupancy in Ogdensburg
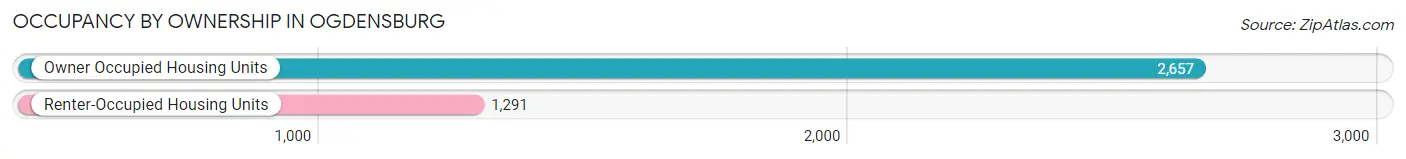
Occupancy by Ownership in Ogdensburg
Of the total 3,948 dwellings in Ogdensburg, owner-occupied units account for 2,657 (67.3%), while renter-occupied units make up 1,291 (32.7%).
| Occupancy | # Housing Units | % Housing Units |
| Owner Occupied Housing Units | 2,657 | 67.3% |
| Renter-Occupied Housing Units | 1,291 | 32.7% |
| Total Occupied Housing Units | 3,948 | 100.0% |
Occupancy by Household Size in Ogdensburg
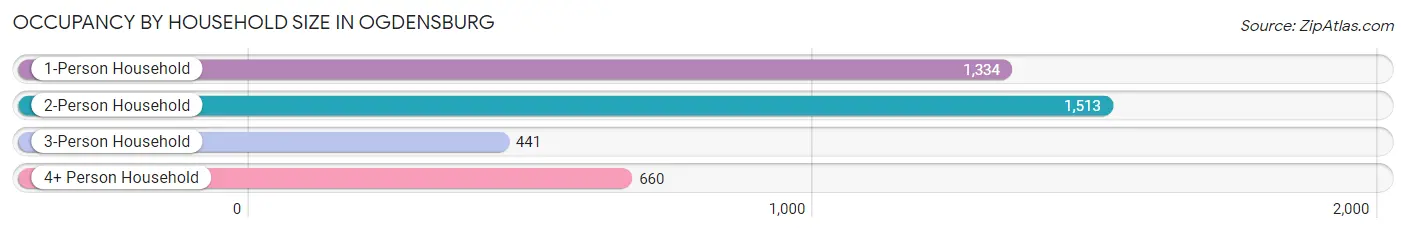
| Household Size | # Housing Units | % Housing Units |
| 1-Person Household | 1,334 | 33.8% |
| 2-Person Household | 1,513 | 38.3% |
| 3-Person Household | 441 | 11.2% |
| 4+ Person Household | 660 | 16.7% |
| Total Housing Units | 3,948 | 100.0% |
Occupancy by Ownership by Household Size in Ogdensburg
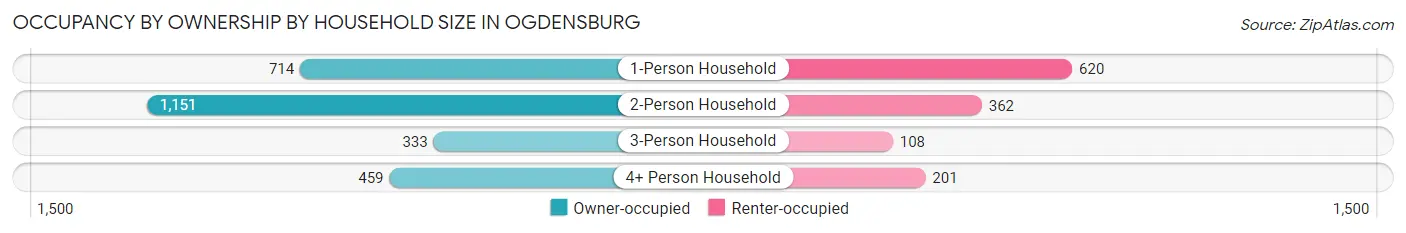
| Household Size | Owner-occupied | Renter-occupied |
| 1-Person Household | 714 (53.5%) | 620 (46.5%) |
| 2-Person Household | 1,151 (76.1%) | 362 (23.9%) |
| 3-Person Household | 333 (75.5%) | 108 (24.5%) |
| 4+ Person Household | 459 (69.6%) | 201 (30.4%) |
| Total Housing Units | 2,657 (67.3%) | 1,291 (32.7%) |
Occupancy by Educational Attainment in Ogdensburg
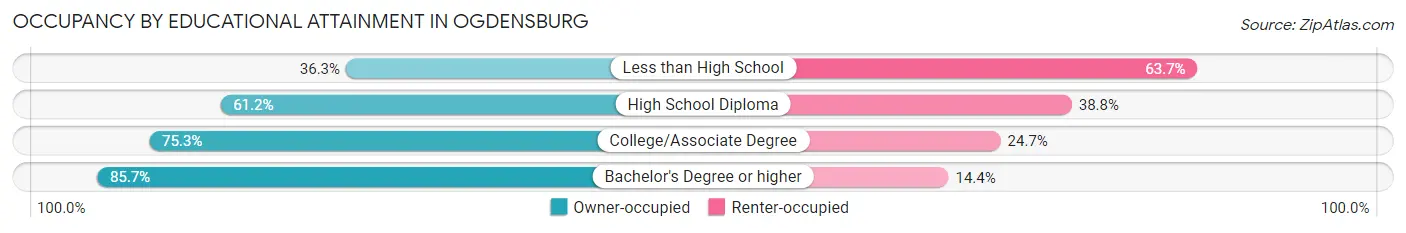
| Household Size | Owner-occupied | Renter-occupied |
| Less than High School | 183 (36.3%) | 321 (63.7%) |
| High School Diploma | 827 (61.2%) | 524 (38.8%) |
| College/Associate Degree | 1,062 (75.3%) | 348 (24.7%) |
| Bachelor's Degree or higher | 585 (85.7%) | 98 (14.3%) |
Occupancy by Age of Householder in Ogdensburg
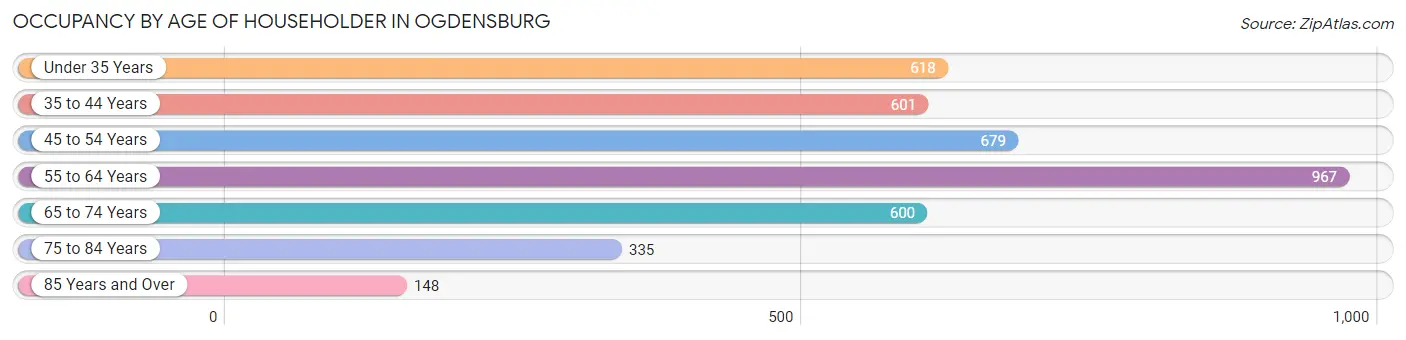
| Age Bracket | # Households | % Households |
| Under 35 Years | 618 | 15.7% |
| 35 to 44 Years | 601 | 15.2% |
| 45 to 54 Years | 679 | 17.2% |
| 55 to 64 Years | 967 | 24.5% |
| 65 to 74 Years | 600 | 15.2% |
| 75 to 84 Years | 335 | 8.5% |
| 85 Years and Over | 148 | 3.7% |
| Total | 3,948 | 100.0% |
Housing Finances in Ogdensburg
Median Income by Occupancy in Ogdensburg
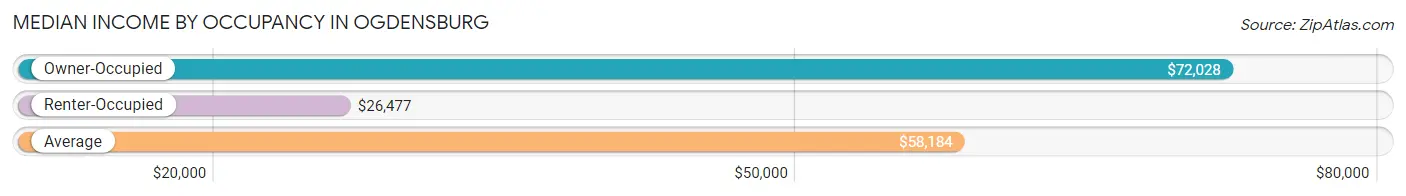
| Occupancy Type | # Households | Median Income |
| Owner-Occupied | 2,657 (67.3%) | $72,028 |
| Renter-Occupied | 1,291 (32.7%) | $26,477 |
| Average | 3,948 (100.0%) | $58,184 |
Occupancy by Householder Income Bracket in Ogdensburg
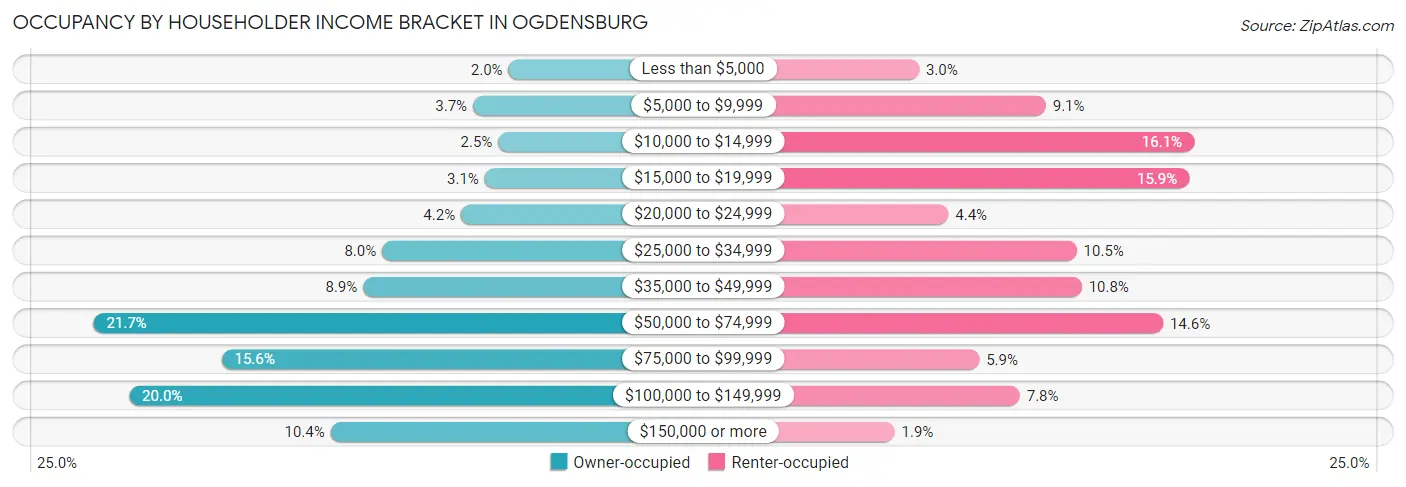
| Income Bracket | Owner-occupied | Renter-occupied |
| Less than $5,000 | 52 (2.0%) | 39 (3.0%) |
| $5,000 to $9,999 | 97 (3.6%) | 117 (9.1%) |
| $10,000 to $14,999 | 65 (2.5%) | 208 (16.1%) |
| $15,000 to $19,999 | 82 (3.1%) | 205 (15.9%) |
| $20,000 to $24,999 | 112 (4.2%) | 57 (4.4%) |
| $25,000 to $34,999 | 212 (8.0%) | 136 (10.5%) |
| $35,000 to $49,999 | 236 (8.9%) | 139 (10.8%) |
| $50,000 to $74,999 | 577 (21.7%) | 189 (14.6%) |
| $75,000 to $99,999 | 415 (15.6%) | 76 (5.9%) |
| $100,000 to $149,999 | 532 (20.0%) | 101 (7.8%) |
| $150,000 or more | 277 (10.4%) | 24 (1.9%) |
| Total | 2,657 (100.0%) | 1,291 (100.0%) |
Monthly Housing Cost Tiers in Ogdensburg
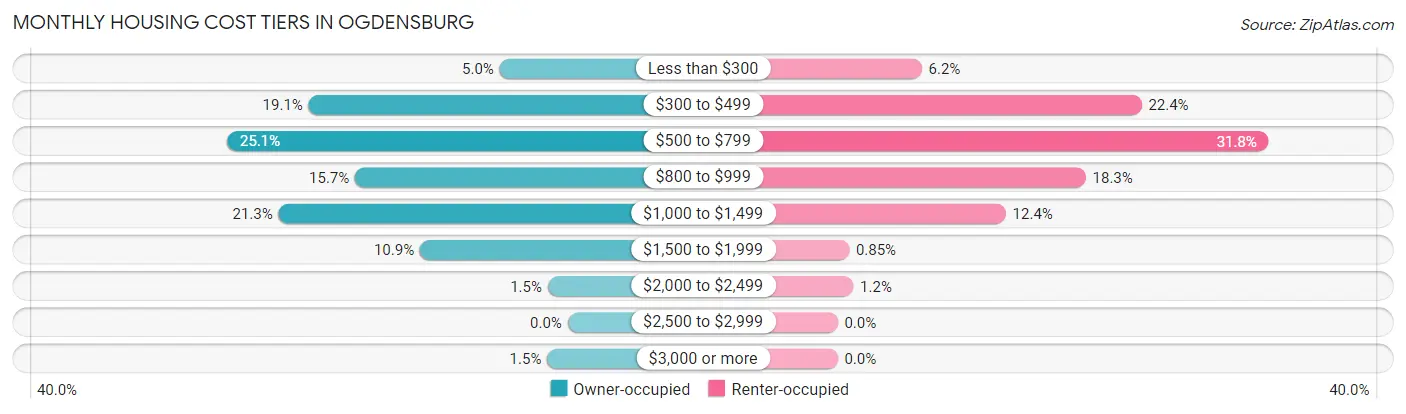
| Monthly Cost | Owner-occupied | Renter-occupied |
| Less than $300 | 133 (5.0%) | 80 (6.2%) |
| $300 to $499 | 507 (19.1%) | 289 (22.4%) |
| $500 to $799 | 667 (25.1%) | 410 (31.8%) |
| $800 to $999 | 416 (15.7%) | 236 (18.3%) |
| $1,000 to $1,499 | 566 (21.3%) | 160 (12.4%) |
| $1,500 to $1,999 | 289 (10.9%) | 11 (0.9%) |
| $2,000 to $2,499 | 39 (1.5%) | 15 (1.2%) |
| $2,500 to $2,999 | 0 (0.0%) | 0 (0.0%) |
| $3,000 or more | 40 (1.5%) | 0 (0.0%) |
| Total | 2,657 (100.0%) | 1,291 (100.0%) |
Physical Housing Characteristics in Ogdensburg
Housing Structures in Ogdensburg
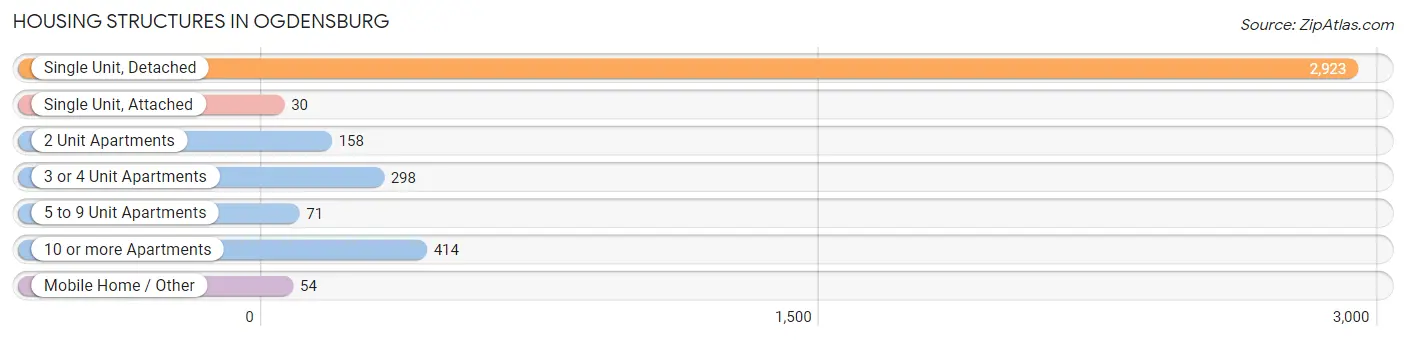
| Structure Type | # Housing Units | % Housing Units |
| Single Unit, Detached | 2,923 | 74.0% |
| Single Unit, Attached | 30 | 0.8% |
| 2 Unit Apartments | 158 | 4.0% |
| 3 or 4 Unit Apartments | 298 | 7.5% |
| 5 to 9 Unit Apartments | 71 | 1.8% |
| 10 or more Apartments | 414 | 10.5% |
| Mobile Home / Other | 54 | 1.4% |
| Total | 3,948 | 100.0% |
Housing Structures by Occupancy in Ogdensburg
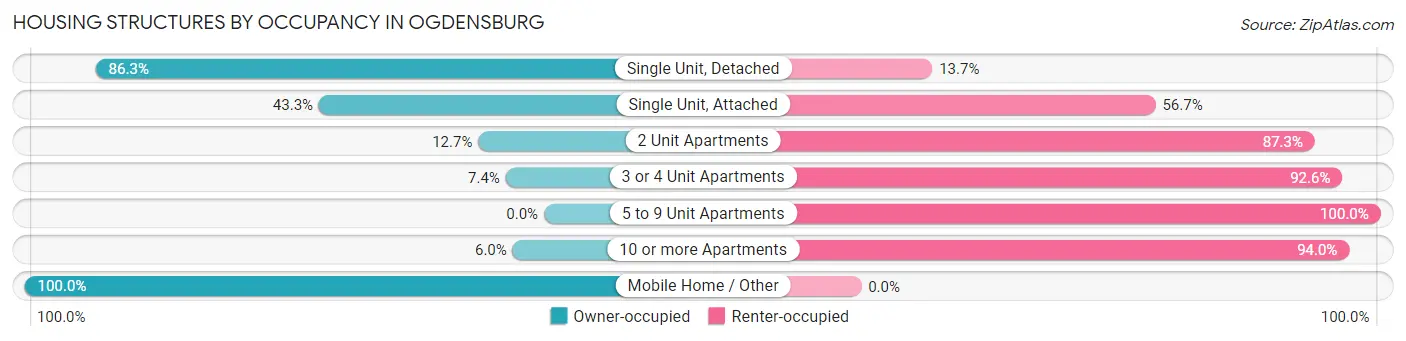
| Structure Type | Owner-occupied | Renter-occupied |
| Single Unit, Detached | 2,523 (86.3%) | 400 (13.7%) |
| Single Unit, Attached | 13 (43.3%) | 17 (56.7%) |
| 2 Unit Apartments | 20 (12.7%) | 138 (87.3%) |
| 3 or 4 Unit Apartments | 22 (7.4%) | 276 (92.6%) |
| 5 to 9 Unit Apartments | 0 (0.0%) | 71 (100.0%) |
| 10 or more Apartments | 25 (6.0%) | 389 (94.0%) |
| Mobile Home / Other | 54 (100.0%) | 0 (0.0%) |
| Total | 2,657 (67.3%) | 1,291 (32.7%) |
Housing Structures by Number of Rooms in Ogdensburg
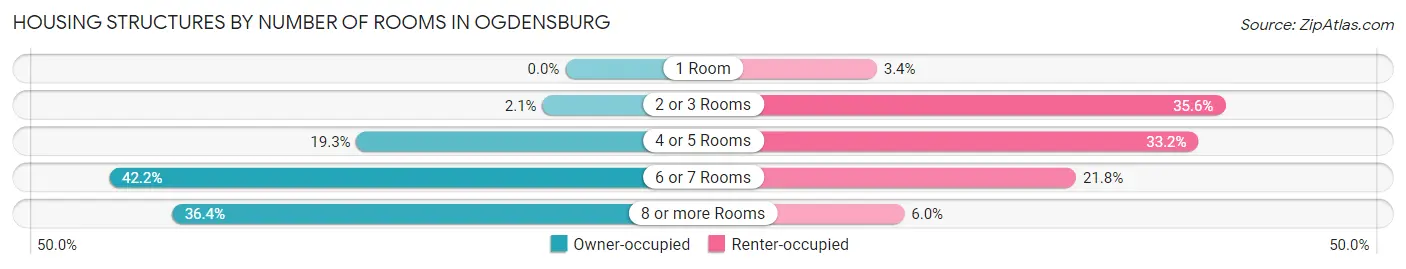
| Number of Rooms | Owner-occupied | Renter-occupied |
| 1 Room | 0 (0.0%) | 44 (3.4%) |
| 2 or 3 Rooms | 56 (2.1%) | 460 (35.6%) |
| 4 or 5 Rooms | 513 (19.3%) | 428 (33.2%) |
| 6 or 7 Rooms | 1,121 (42.2%) | 282 (21.8%) |
| 8 or more Rooms | 967 (36.4%) | 77 (6.0%) |
| Total | 2,657 (100.0%) | 1,291 (100.0%) |
Housing Structure by Heating Type in Ogdensburg
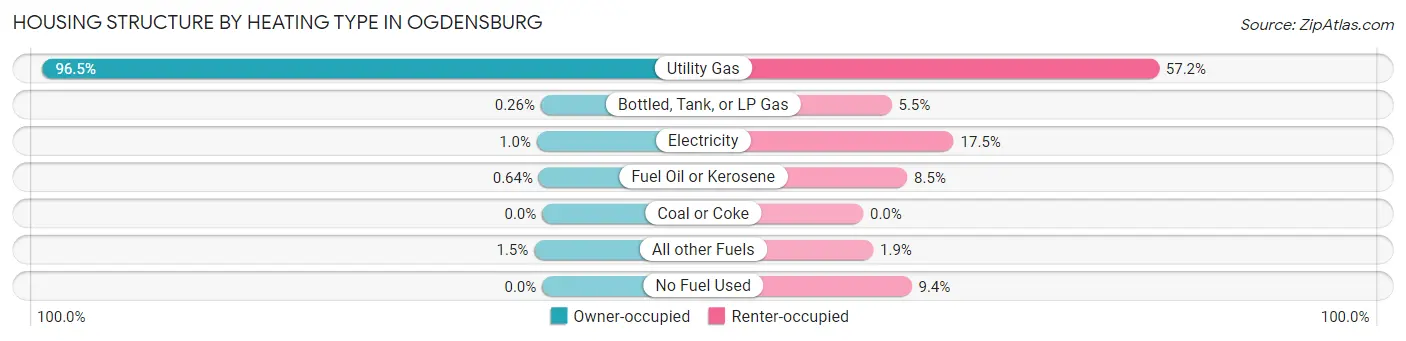
| Heating Type | Owner-occupied | Renter-occupied |
| Utility Gas | 2,565 (96.5%) | 738 (57.2%) |
| Bottled, Tank, or LP Gas | 7 (0.3%) | 71 (5.5%) |
| Electricity | 27 (1.0%) | 226 (17.5%) |
| Fuel Oil or Kerosene | 17 (0.6%) | 110 (8.5%) |
| Coal or Coke | 0 (0.0%) | 0 (0.0%) |
| All other Fuels | 41 (1.5%) | 25 (1.9%) |
| No Fuel Used | 0 (0.0%) | 121 (9.4%) |
| Total | 2,657 (100.0%) | 1,291 (100.0%) |
Household Vehicle Usage in Ogdensburg
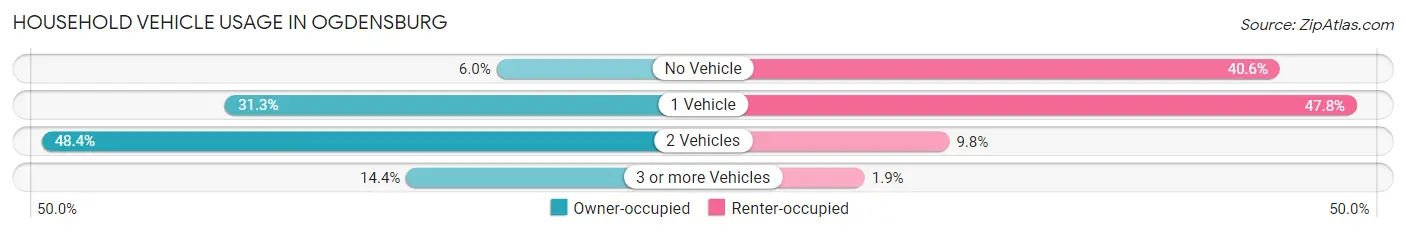
| Vehicles per Household | Owner-occupied | Renter-occupied |
| No Vehicle | 158 (5.9%) | 524 (40.6%) |
| 1 Vehicle | 831 (31.3%) | 617 (47.8%) |
| 2 Vehicles | 1,286 (48.4%) | 126 (9.8%) |
| 3 or more Vehicles | 382 (14.4%) | 24 (1.9%) |
| Total | 2,657 (100.0%) | 1,291 (100.0%) |
Real Estate & Mortgages in Ogdensburg
Real Estate and Mortgage Overview in Ogdensburg
| Characteristic | Without Mortgage | With Mortgage |
| Housing Units | 1,356 | 1,301 |
| Median Property Value | $73,300 | $89,400 |
| Median Household Income | $63,151 | $220 |
| Monthly Housing Costs | $516 | $40 |
| Real Estate Taxes | $2,383 | $58 |
Property Value by Mortgage Status in Ogdensburg
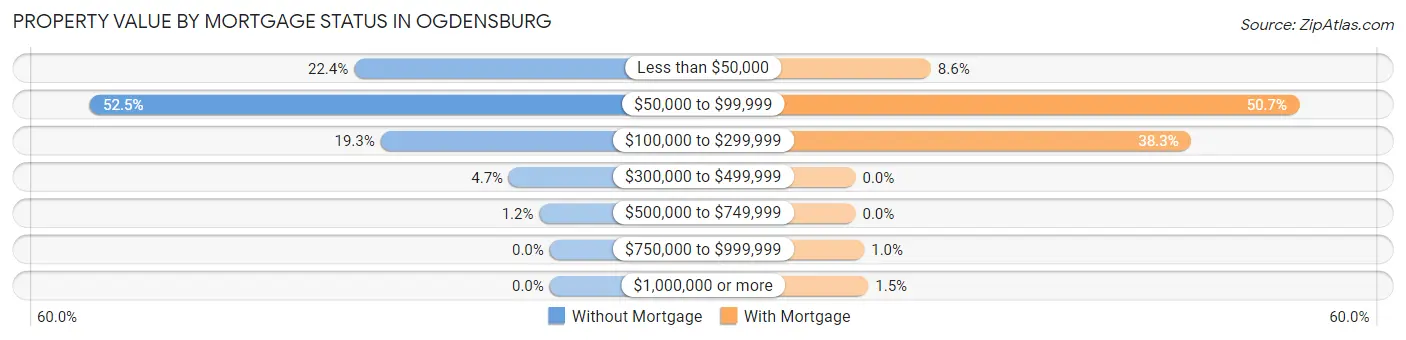
| Property Value | Without Mortgage | With Mortgage |
| Less than $50,000 | 303 (22.4%) | 112 (8.6%) |
| $50,000 to $99,999 | 712 (52.5%) | 659 (50.6%) |
| $100,000 to $299,999 | 262 (19.3%) | 498 (38.3%) |
| $300,000 to $499,999 | 63 (4.6%) | 0 (0.0%) |
| $500,000 to $749,999 | 16 (1.2%) | 0 (0.0%) |
| $750,000 to $999,999 | 0 (0.0%) | 13 (1.0%) |
| $1,000,000 or more | 0 (0.0%) | 19 (1.5%) |
| Total | 1,356 (100.0%) | 1,301 (100.0%) |
Household Income by Mortgage Status in Ogdensburg
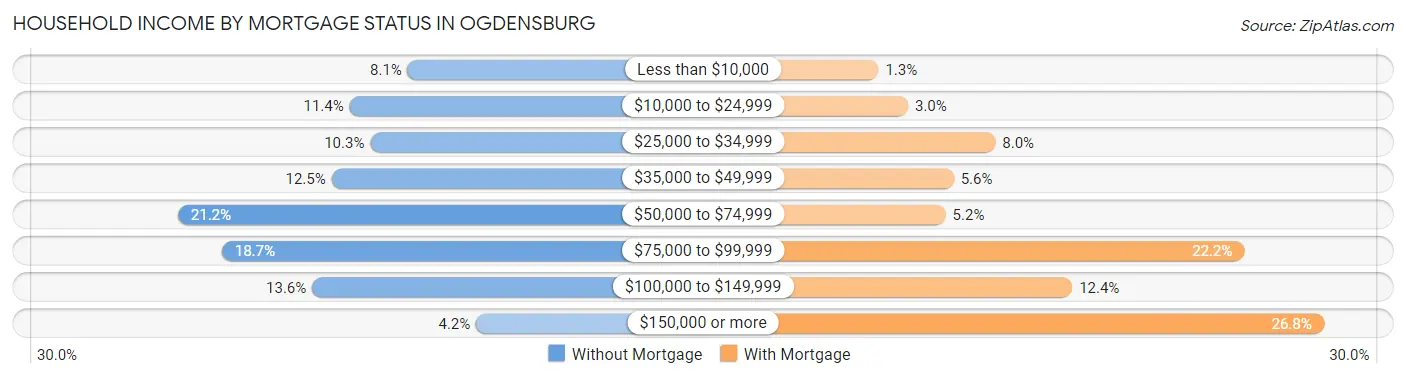
| Household Income | Without Mortgage | With Mortgage |
| Less than $10,000 | 110 (8.1%) | 17 (1.3%) |
| $10,000 to $24,999 | 155 (11.4%) | 39 (3.0%) |
| $25,000 to $34,999 | 139 (10.2%) | 104 (8.0%) |
| $35,000 to $49,999 | 169 (12.5%) | 73 (5.6%) |
| $50,000 to $74,999 | 288 (21.2%) | 67 (5.1%) |
| $75,000 to $99,999 | 254 (18.7%) | 289 (22.2%) |
| $100,000 to $149,999 | 184 (13.6%) | 161 (12.4%) |
| $150,000 or more | 57 (4.2%) | 348 (26.8%) |
| Total | 1,356 (100.0%) | 1,301 (100.0%) |
Property Value to Household Income Ratio in Ogdensburg
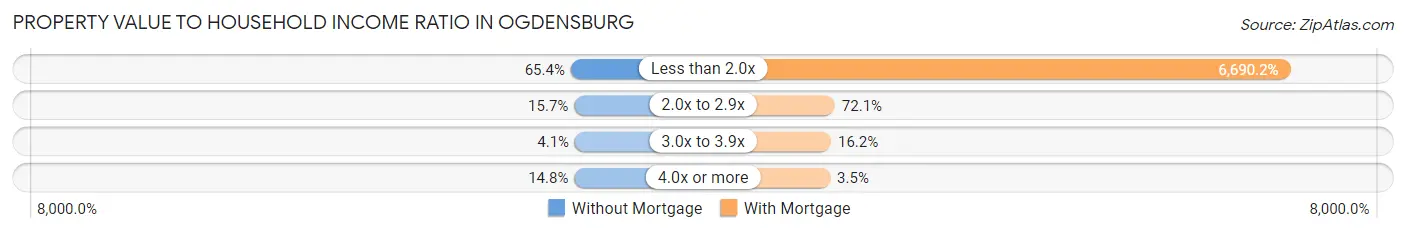
| Value-to-Income Ratio | Without Mortgage | With Mortgage |
| Less than 2.0x | 887 (65.4%) | 87,039 (6,690.2%) |
| 2.0x to 2.9x | 213 (15.7%) | 938 (72.1%) |
| 3.0x to 3.9x | 56 (4.1%) | 211 (16.2%) |
| 4.0x or more | 200 (14.7%) | 45 (3.5%) |
| Total | 1,356 (100.0%) | 1,301 (100.0%) |
Real Estate Taxes by Mortgage Status in Ogdensburg
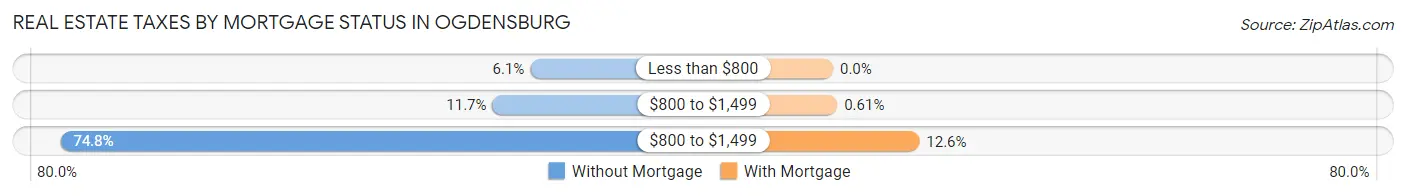
| Property Taxes | Without Mortgage | With Mortgage |
| Less than $800 | 83 (6.1%) | 0 (0.0%) |
| $800 to $1,499 | 158 (11.7%) | 8 (0.6%) |
| $800 to $1,499 | 1,014 (74.8%) | 164 (12.6%) |
| Total | 1,356 (100.0%) | 1,301 (100.0%) |
Health & Disability in Ogdensburg
Health Insurance Coverage by Age in Ogdensburg
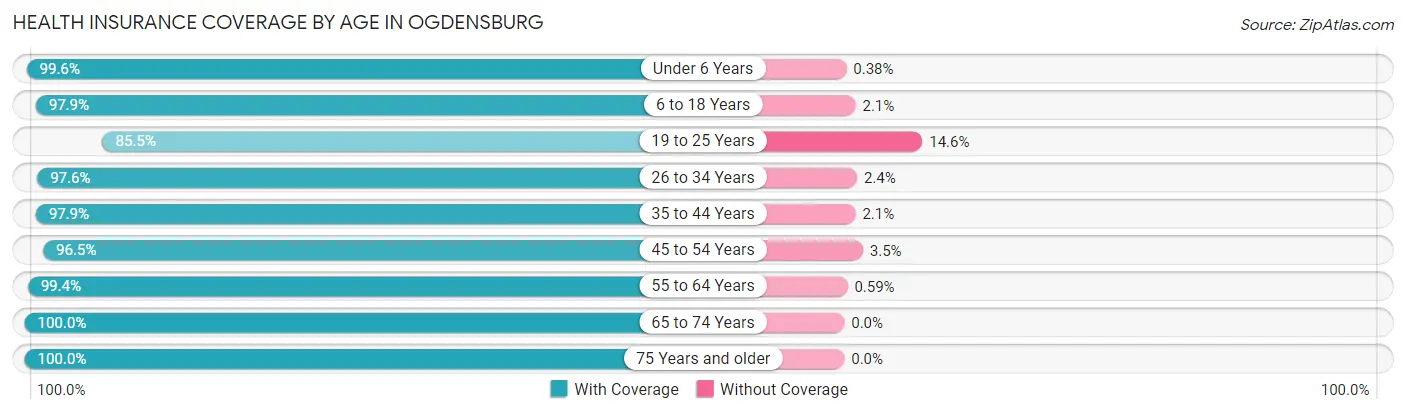
| Age Bracket | With Coverage | Without Coverage |
| Under 6 Years | 523 (99.6%) | 2 (0.4%) |
| 6 to 18 Years | 1,493 (97.9%) | 32 (2.1%) |
| 19 to 25 Years | 411 (85.5%) | 70 (14.5%) |
| 26 to 34 Years | 867 (97.6%) | 21 (2.4%) |
| 35 to 44 Years | 985 (97.9%) | 21 (2.1%) |
| 45 to 54 Years | 1,031 (96.5%) | 37 (3.5%) |
| 55 to 64 Years | 1,520 (99.4%) | 9 (0.6%) |
| 65 to 74 Years | 878 (100.0%) | 0 (0.0%) |
| 75 Years and older | 650 (100.0%) | 0 (0.0%) |
| Total | 8,358 (97.8%) | 192 (2.2%) |
Health Insurance Coverage by Citizenship Status in Ogdensburg
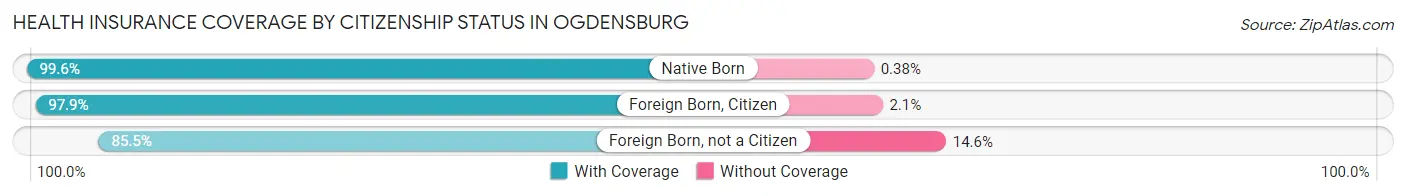
| Citizenship Status | With Coverage | Without Coverage |
| Native Born | 523 (99.6%) | 2 (0.4%) |
| Foreign Born, Citizen | 1,493 (97.9%) | 32 (2.1%) |
| Foreign Born, not a Citizen | 411 (85.5%) | 70 (14.5%) |
Health Insurance Coverage by Household Income in Ogdensburg
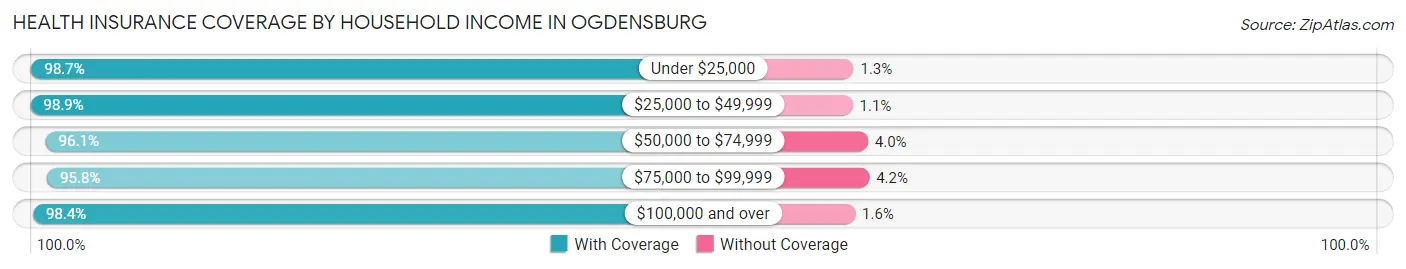
| Household Income | With Coverage | Without Coverage |
| Under $25,000 | 1,414 (98.7%) | 18 (1.3%) |
| $25,000 to $49,999 | 1,452 (98.9%) | 16 (1.1%) |
| $50,000 to $74,999 | 1,799 (96.1%) | 74 (4.0%) |
| $75,000 to $99,999 | 935 (95.8%) | 41 (4.2%) |
| $100,000 and over | 2,651 (98.4%) | 42 (1.6%) |
Public vs Private Health Insurance Coverage by Age in Ogdensburg
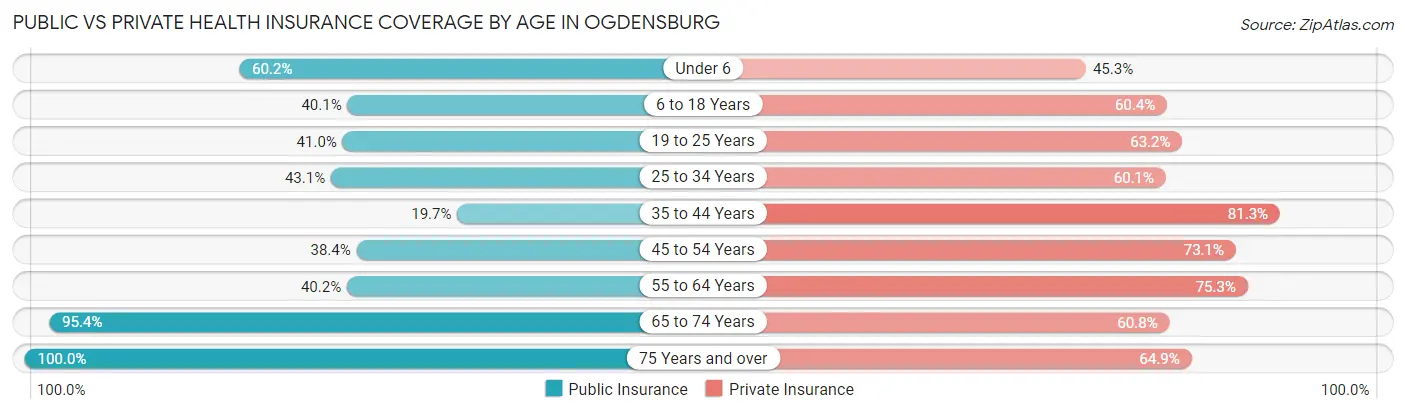
| Age Bracket | Public Insurance | Private Insurance |
| Under 6 | 316 (60.2%) | 238 (45.3%) |
| 6 to 18 Years | 611 (40.1%) | 921 (60.4%) |
| 19 to 25 Years | 197 (41.0%) | 304 (63.2%) |
| 25 to 34 Years | 383 (43.1%) | 534 (60.1%) |
| 35 to 44 Years | 198 (19.7%) | 818 (81.3%) |
| 45 to 54 Years | 410 (38.4%) | 781 (73.1%) |
| 55 to 64 Years | 614 (40.2%) | 1,152 (75.3%) |
| 65 to 74 Years | 838 (95.4%) | 534 (60.8%) |
| 75 Years and over | 650 (100.0%) | 422 (64.9%) |
| Total | 4,217 (49.3%) | 5,704 (66.7%) |
Disability Status by Sex by Age in Ogdensburg
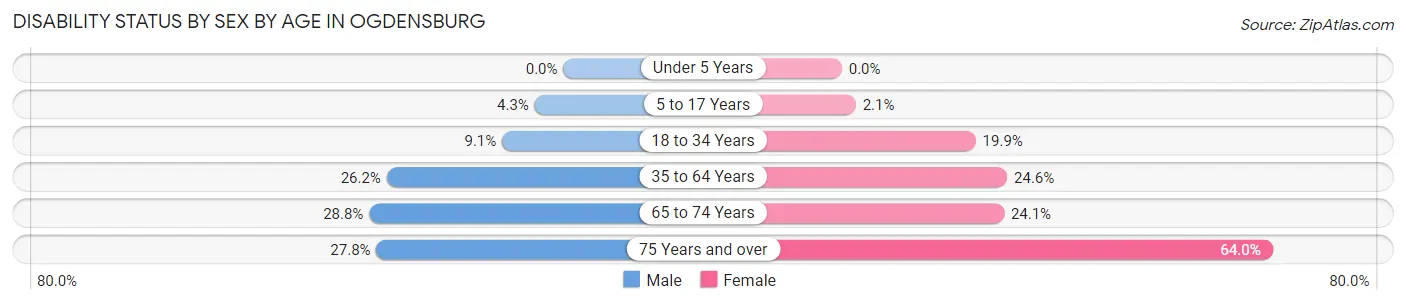
| Age Bracket | Male | Female |
| Under 5 Years | 0 (0.0%) | 0 (0.0%) |
| 5 to 17 Years | 31 (4.3%) | 16 (2.1%) |
| 18 to 34 Years | 60 (9.1%) | 167 (19.9%) |
| 35 to 64 Years | 490 (26.2%) | 426 (24.5%) |
| 65 to 74 Years | 143 (28.8%) | 92 (24.1%) |
| 75 Years and over | 78 (27.8%) | 236 (64.0%) |
Disability Class by Sex by Age in Ogdensburg
Disability Class: Hearing Difficulty
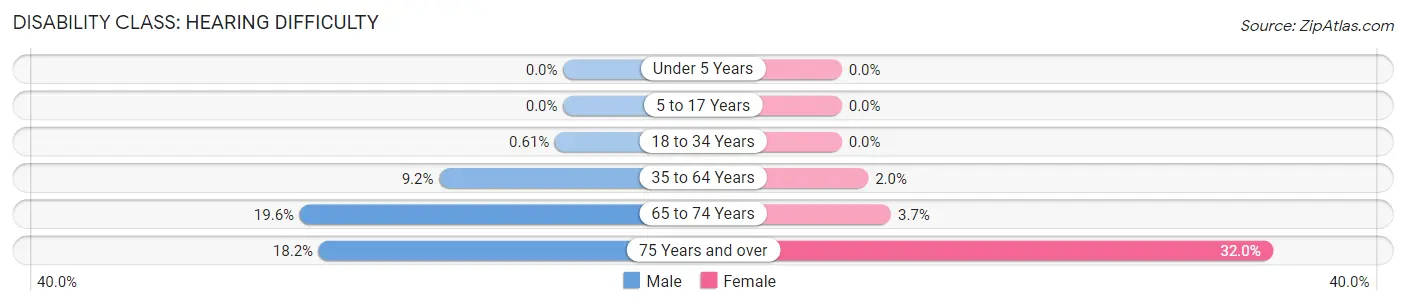
| Age Bracket | Male | Female |
| Under 5 Years | 0 (0.0%) | 0 (0.0%) |
| 5 to 17 Years | 0 (0.0%) | 0 (0.0%) |
| 18 to 34 Years | 4 (0.6%) | 0 (0.0%) |
| 35 to 64 Years | 172 (9.2%) | 34 (2.0%) |
| 65 to 74 Years | 97 (19.6%) | 14 (3.7%) |
| 75 Years and over | 51 (18.1%) | 118 (32.0%) |
Disability Class: Vision Difficulty
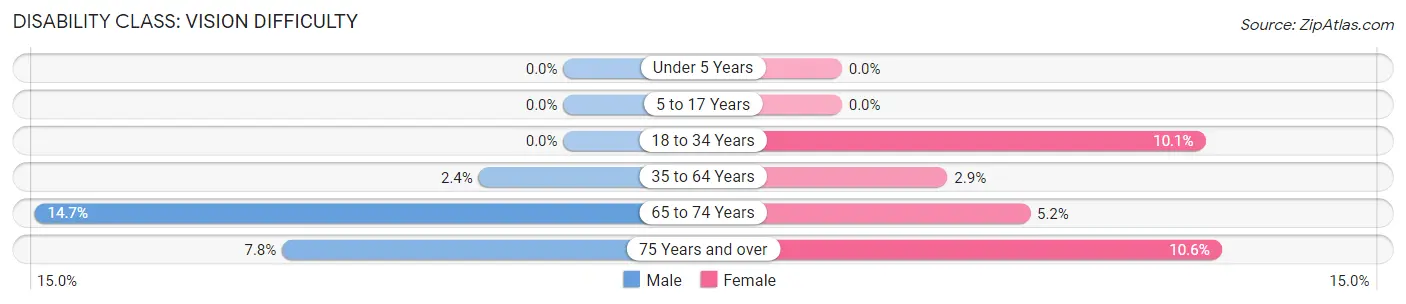
| Age Bracket | Male | Female |
| Under 5 Years | 0 (0.0%) | 0 (0.0%) |
| 5 to 17 Years | 0 (0.0%) | 0 (0.0%) |
| 18 to 34 Years | 0 (0.0%) | 85 (10.1%) |
| 35 to 64 Years | 44 (2.4%) | 51 (2.9%) |
| 65 to 74 Years | 73 (14.7%) | 20 (5.2%) |
| 75 Years and over | 22 (7.8%) | 39 (10.6%) |
Disability Class: Cognitive Difficulty
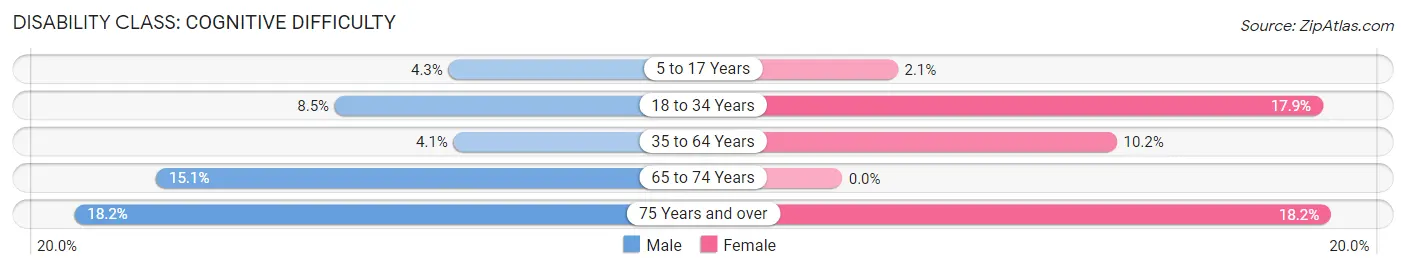
| Age Bracket | Male | Female |
| 5 to 17 Years | 31 (4.3%) | 16 (2.1%) |
| 18 to 34 Years | 56 (8.5%) | 150 (17.9%) |
| 35 to 64 Years | 76 (4.1%) | 177 (10.2%) |
| 65 to 74 Years | 75 (15.1%) | 0 (0.0%) |
| 75 Years and over | 51 (18.1%) | 67 (18.2%) |
Disability Class: Ambulatory Difficulty
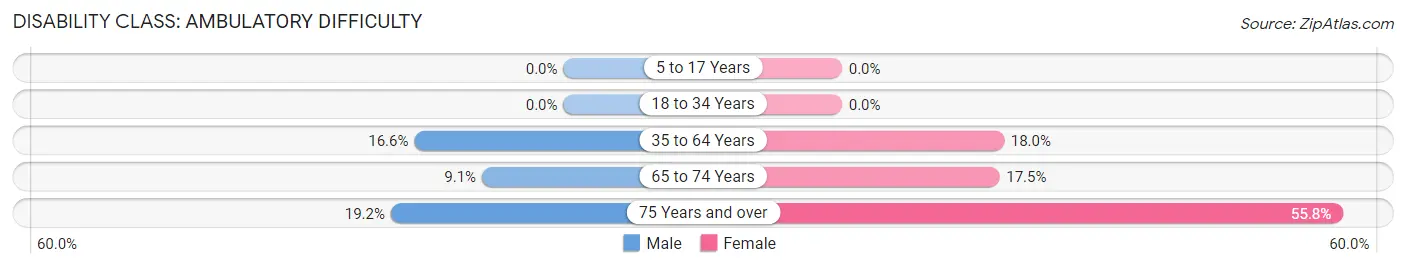
| Age Bracket | Male | Female |
| 5 to 17 Years | 0 (0.0%) | 0 (0.0%) |
| 18 to 34 Years | 0 (0.0%) | 0 (0.0%) |
| 35 to 64 Years | 310 (16.6%) | 313 (18.0%) |
| 65 to 74 Years | 45 (9.1%) | 67 (17.5%) |
| 75 Years and over | 54 (19.2%) | 206 (55.8%) |
Disability Class: Self-Care Difficulty
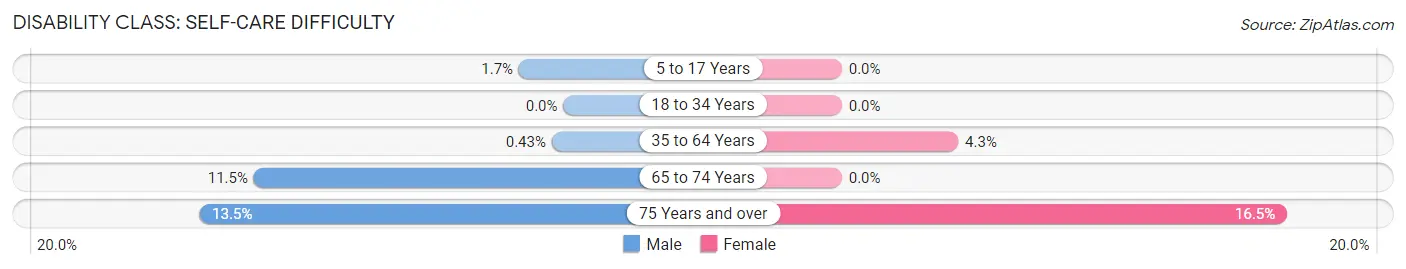
| Age Bracket | Male | Female |
| 5 to 17 Years | 12 (1.7%) | 0 (0.0%) |
| 18 to 34 Years | 0 (0.0%) | 0 (0.0%) |
| 35 to 64 Years | 8 (0.4%) | 75 (4.3%) |
| 65 to 74 Years | 57 (11.5%) | 0 (0.0%) |
| 75 Years and over | 38 (13.5%) | 61 (16.5%) |
Technology Access in Ogdensburg
Computing Device Access in Ogdensburg
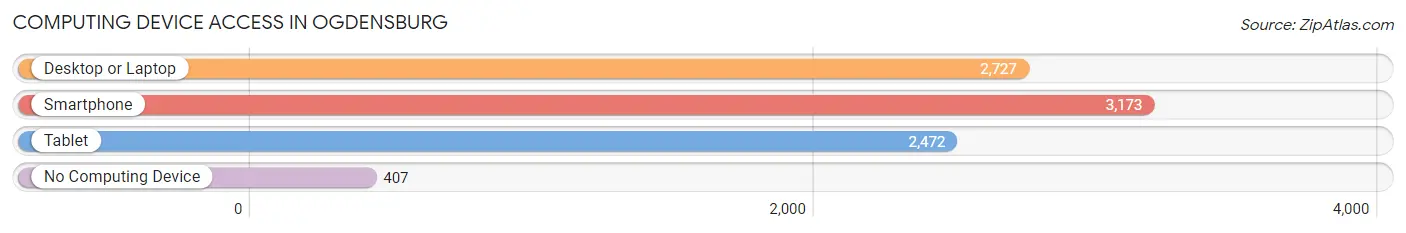
| Device Type | # Households | % Households |
| Desktop or Laptop | 2,727 | 69.1% |
| Smartphone | 3,173 | 80.4% |
| Tablet | 2,472 | 62.6% |
| No Computing Device | 407 | 10.3% |
| Total | 3,948 | 100.0% |
Internet Access in Ogdensburg
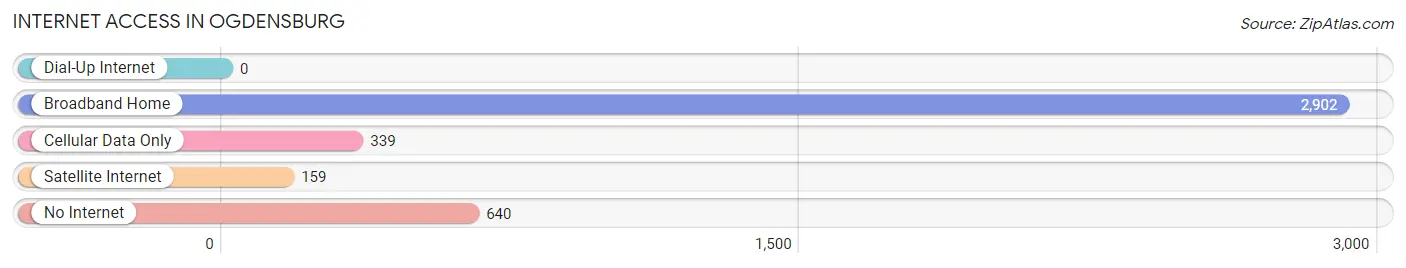
| Internet Type | # Households | % Households |
| Dial-Up Internet | 0 | 0.0% |
| Broadband Home | 2,902 | 73.5% |
| Cellular Data Only | 339 | 8.6% |
| Satellite Internet | 159 | 4.0% |
| No Internet | 640 | 16.2% |
| Total | 3,948 | 100.0% |
Ogdensburg Summary
Ogdensburg is a city located in St. Lawrence County, New York, United States. It is situated on the south bank of the St. Lawrence River, just east of the city of Massena. The population was 11,128 at the 2010 census. Ogdensburg is the county seat of St. Lawrence County.
History
The area around Ogdensburg was first settled by Europeans in 1749, when French-Canadian fur traders established a trading post at the site. The city was founded in 1798 by George Scriba, a German immigrant who had purchased the land from the Iroquois. The city was named after his son, John Augustus Ogdensburg.
In 1803, the city was incorporated as a village. In 1811, it was incorporated as a city. During the War of 1812, Ogdensburg was the site of a major battle between the British and American forces. The city was also the site of a major battle during the American Civil War.
In the late 19th century, Ogdensburg became an important industrial center, with several large factories located in the city. The city was also an important transportation hub, with several railroads and a canal connecting it to the rest of the country.
Geography
Ogdensburg is located at 44°44′N 75°25′W (44.735, -75.417). According to the United States Census Bureau, the city has a total area of 8.2 square miles (21.2 km2), of which 7.9 square miles (20.5 km2) is land and 0.3 square miles (0.8 km2) is water.
The city is located on the south bank of the St. Lawrence River, just east of the city of Massena. The city is bordered to the north by the town of Oswegatchie, to the east by the town of Lisbon, to the south by the town of Louisville, and to the west by the town of Morristown.
Economy
Ogdensburg is the county seat of St. Lawrence County and is the economic and cultural center of the region. The city is home to several large employers, including St. Lawrence University, Ogdensburg Free Academy, and the Ogdensburg-Prescott International Bridge.
The city is also home to several manufacturing companies, including Ogdensburg Specialty Products, Ogdensburg Steel, and Ogdensburg Plastics. The city is also home to several retail stores, including Walmart, Kmart, and Target.
Demographics
As of the census of 2010, there were 11,128 people, 4,717 households, and 2,845 families residing in the city. The population density was 1,400.3 people per square mile (541.2/km2). There were 5,093 housing units at an average density of 637.3 per square mile (246.2/km2). The racial makeup of the city was 94.2% White, 2.2% African American, 0.5% Native American, 0.7% Asian, 0.1% Pacific Islander, 0.7% from other races, and 1.7% from two or more races. Hispanic or Latino of any race were 2.7% of the population.
There were 4,717 households, out of which 28.2% had children under the age of 18 living with them, 41.2% were married couples living together, 14.7% had a female householder with no husband present, and 39.2% were non-families. 33.2% of all households were made up of individuals, and 14.2% had someone living alone who was 65 years of age or older. The average household size was 2.30 and the average family size was 2.90.
In the city, the population was spread out, with 23.2% under the age of 18, 9.2% from 18 to 24, 25.7% from 25 to 44, 24.2% from 45 to 64, and 17.7% who were 65 years of age or older. The median age was 39 years. For every 100 females, there were 88.3 males. For every 100 females age 18 and over, there were 84.2 males.
The median income for a household in the city was $31,944, and the median income for a family was $41,945. Males had a median income of $31,944 versus $25,944 for females. The per capita income for the city was $17,945. About 11.2% of families and 14.7% of the population were below the poverty line, including 20.2% of those under age 18 and 8.7% of those age 65 or over.
Common Questions
What is Per Capita Income in Ogdensburg?
Per Capita income in Ogdensburg is $28,379.
What is the Median Family Income in Ogdensburg?
Median Family Income in Ogdensburg is $68,845.
What is the Median Household income in Ogdensburg?
Median Household Income in Ogdensburg is $58,184.
What is Income or Wage Gap in Ogdensburg?
Income or Wage Gap in Ogdensburg is 17.6%.
Women in Ogdensburg earn 82.4 cents for every dollar earned by a man.
What is Family Income Deficit in Ogdensburg?
Family Income Deficit in Ogdensburg is $10,357.
Families that are below poverty line in Ogdensburg earn $10,357 less on average than the poverty threshold level.
What is Inequality or Gini Index in Ogdensburg?
Inequality or Gini Index in Ogdensburg is 0.45.
What is the Total Population of Ogdensburg?
Total Population of Ogdensburg is 9,902.
What is the Total Male Population of Ogdensburg?
Total Male Population of Ogdensburg is 5,479.
What is the Total Female Population of Ogdensburg?
Total Female Population of Ogdensburg is 4,423.
What is the Ratio of Males per 100 Females in Ogdensburg?
There are 123.88 Males per 100 Females in Ogdensburg.
What is the Ratio of Females per 100 Males in Ogdensburg?
There are 80.73 Females per 100 Males in Ogdensburg.
What is the Median Population Age in Ogdensburg?
Median Population Age in Ogdensburg is 41.9 Years.
What is the Average Family Size in Ogdensburg
Average Family Size in Ogdensburg is 2.6 People.
What is the Average Household Size in Ogdensburg
Average Household Size in Ogdensburg is 2.1 People.
How Large is the Labor Force in Ogdensburg?
There are 3,803 People in the Labor Forcein in Ogdensburg.
What is the Percentage of People in the Labor Force in Ogdensburg?
46.5% of People are in the Labor Force in Ogdensburg.
What is the Unemployment Rate in Ogdensburg?
Unemployment Rate in Ogdensburg is 6.9%.