Zip Codes with the Highest Percentage of Households Heated by Bottled Gas / Liquid Propane in Springfield, MO
RELATED REPORTS & OPTIONS
Bottled Gas / LP Heating
Springfield
Compare Zip Codes
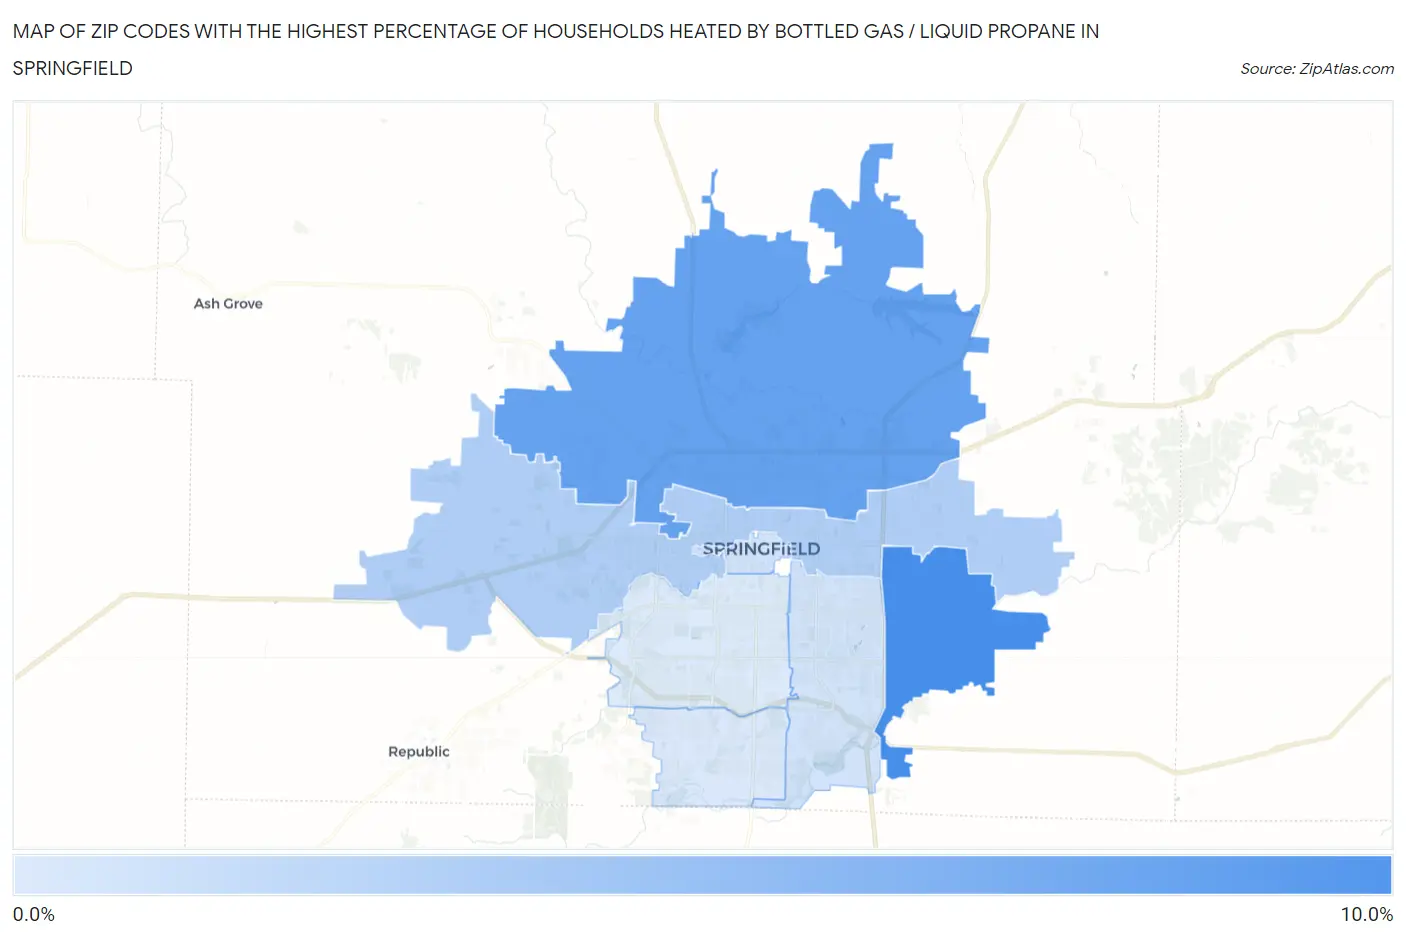
Map of Zip Codes with the Highest Percentage of Households Heated by Bottled Gas / Liquid Propane in Springfield
1.5%
8.7%
Zip Codes with the Highest Percentage of Households Heated by Bottled Gas / Liquid Propane in Springfield, MO
| Zip Code | Bottled Gas / LP Heating | vs State | vs National | |
| 1. | 65809 | 8.7% | 8.5%(+0.200)#750 | 4.9%(+3.80)#15,381 |
| 2. | 65803 | 7.2% | 8.5%(-1.30)#774 | 4.9%(+2.30)#16,574 |
| 3. | 65802 | 3.7% | 8.5%(-4.80)#829 | 4.9%(-1.20)#19,960 |
| 4. | 65804 | 2.0% | 8.5%(-6.50)#873 | 4.9%(-2.90)#23,140 |
| 5. | 65806 | 2.0% | 8.5%(-6.50)#877 | 4.9%(-2.90)#23,255 |
| 6. | 65810 | 1.6% | 8.5%(-6.90)#892 | 4.9%(-3.30)#24,430 |
| 7. | 65807 | 1.5% | 8.5%(-7.00)#896 | 4.9%(-3.40)#24,619 |
1
Common Questions
What are the Top 5 Zip Codes with the Highest Percentage of Households Heated by Bottled Gas / Liquid Propane in Springfield, MO?
Top 5 Zip Codes with the Highest Percentage of Households Heated by Bottled Gas / Liquid Propane in Springfield, MO are:
What zip code has the Highest Percentage of Households Heated by Bottled Gas / Liquid Propane in Springfield, MO?
65809 has the Highest Percentage of Households Heated by Bottled Gas / Liquid Propane in Springfield, MO with 8.7%.
What is the Percentage of Households Heated by Bottled Gas / Liquid Propane in Springfield, MO?
Percentage of Households Heated by Bottled Gas / Liquid Propane in Springfield is 1.7%.
What is the Percentage of Households Heated by Bottled Gas / Liquid Propane in Missouri?
Percentage of Households Heated by Bottled Gas / Liquid Propane in Missouri is 8.5%.
What is the Percentage of Households Heated by Bottled Gas / Liquid Propane in the United States?
Percentage of Households Heated by Bottled Gas / Liquid Propane in the United States is 4.9%.