Zip Codes with the Highest Percentage of Population Employed in Office & Administration in Springfield, MO
RELATED REPORTS & OPTIONS
Office & Administration
Springfield
Compare Zip Codes
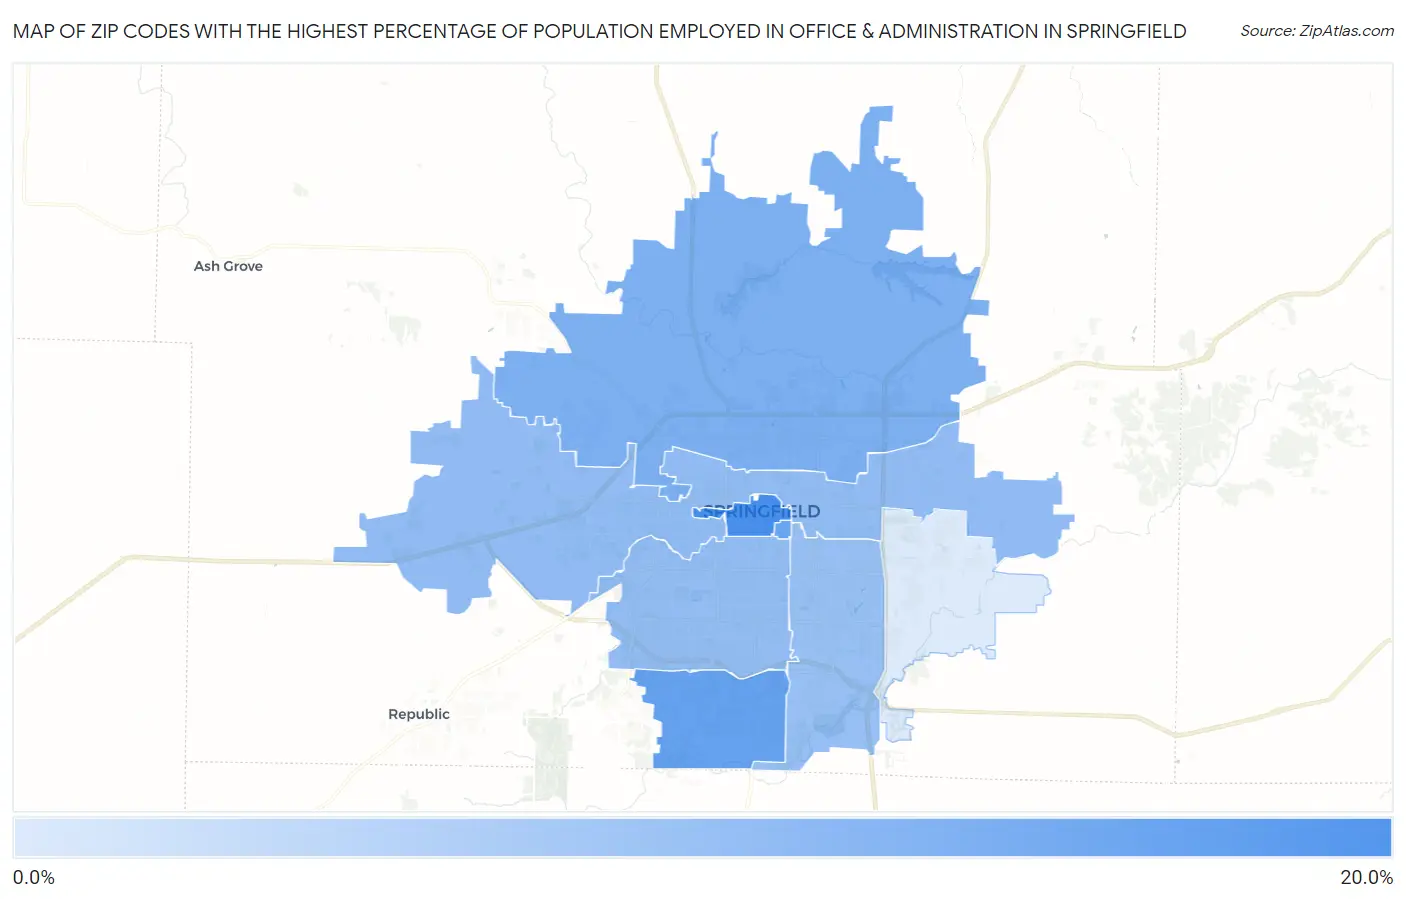
Map of Zip Codes with the Highest Percentage of Population Employed in Office & Administration in Springfield
9.9%
16.2%
Zip Codes with the Highest Percentage of Population Employed in Office & Administration in Springfield, MO
| Zip Code | % Employed | vs State | vs National | |
| 1. | 65806 | 16.2% | 11.3%(+4.89)#136 | 10.9%(+5.38)#3,373 |
| 2. | 65810 | 14.9% | 11.3%(+3.56)#182 | 10.9%(+4.06)#4,665 |
| 3. | 65897 | 14.7% | 11.3%(+3.39)#191 | 10.9%(+3.88)#4,920 |
| 4. | 65803 | 14.0% | 11.3%(+2.63)#232 | 10.9%(+3.12)#6,053 |
| 5. | 65802 | 13.1% | 11.3%(+1.78)#291 | 10.9%(+2.27)#7,746 |
| 6. | 65807 | 13.0% | 11.3%(+1.61)#301 | 10.9%(+2.11)#8,146 |
| 7. | 65804 | 12.8% | 11.3%(+1.49)#310 | 10.9%(+1.99)#8,438 |
| 8. | 65809 | 9.9% | 11.3%(-1.43)#551 | 10.9%(-0.935)#17,370 |
1
Common Questions
What are the Top 5 Zip Codes with the Highest Percentage of Population Employed in Office & Administration in Springfield, MO?
Top 5 Zip Codes with the Highest Percentage of Population Employed in Office & Administration in Springfield, MO are:
What zip code has the Highest Percentage of Population Employed in Office & Administration in Springfield, MO?
65806 has the Highest Percentage of Population Employed in Office & Administration in Springfield, MO with 16.2%.
What is the Percentage of Population Employed in Office & Administration in Springfield, MO?
Percentage of Population Employed in Office & Administration in Springfield is 13.8%.
What is the Percentage of Population Employed in Office & Administration in Missouri?
Percentage of Population Employed in Office & Administration in Missouri is 11.3%.
What is the Percentage of Population Employed in Office & Administration in the United States?
Percentage of Population Employed in Office & Administration in the United States is 10.9%.