Zip Codes with the Highest Percentage of Population with a Degree in Liberal Arts and History in Springfield, MO
RELATED REPORTS & OPTIONS
Liberal Arts and History
Springfield
Compare Zip Codes
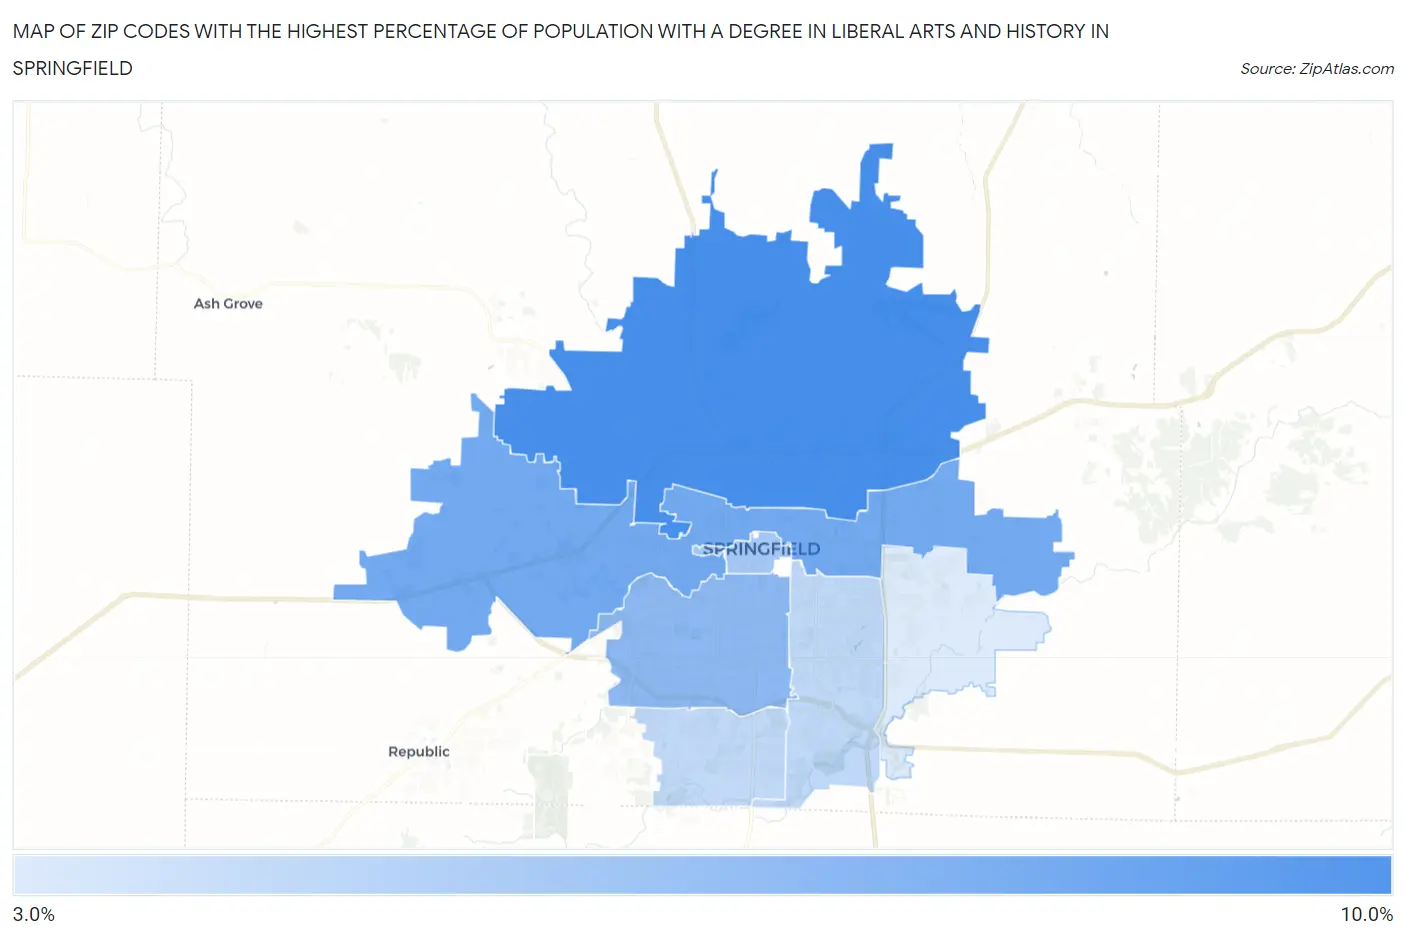
Map of Zip Codes with the Highest Percentage of Population with a Degree in Liberal Arts and History in Springfield
3.9%
8.7%
Zip Codes with the Highest Percentage of Population with a Degree in Liberal Arts and History in Springfield, MO
| Zip Code | % Graduates | vs State | vs National | |
| 1. | 65803 | 8.7% | 4.6%(+4.14)#132 | 4.9%(+3.84)#4,112 |
| 2. | 65802 | 7.3% | 4.6%(+2.68)#178 | 4.9%(+2.38)#5,963 |
| 3. | 65807 | 6.5% | 4.6%(+1.91)#205 | 4.9%(+1.61)#7,383 |
| 4. | 65806 | 5.6% | 4.6%(+1.08)#250 | 4.9%(+0.773)#9,443 |
| 5. | 65804 | 4.9% | 4.6%(+0.302)#305 | 4.9%(+0.000)#11,740 |
| 6. | 65810 | 4.8% | 4.6%(+0.238)#308 | 4.9%(-0.064)#11,948 |
| 7. | 65809 | 3.9% | 4.6%(-0.668)#386 | 4.9%(-0.969)#15,165 |
1
Common Questions
What are the Top 5 Zip Codes with the Highest Percentage of Population with a Degree in Liberal Arts and History in Springfield, MO?
Top 5 Zip Codes with the Highest Percentage of Population with a Degree in Liberal Arts and History in Springfield, MO are:
What zip code has the Highest Percentage of Population with a Degree in Liberal Arts and History in Springfield, MO?
65803 has the Highest Percentage of Population with a Degree in Liberal Arts and History in Springfield, MO with 8.7%.
What is the Percentage of Population with a Degree in Liberal Arts and History in Springfield, MO?
Percentage of Population with a Degree in Liberal Arts and History in Springfield is 6.6%.
What is the Percentage of Population with a Degree in Liberal Arts and History in Missouri?
Percentage of Population with a Degree in Liberal Arts and History in Missouri is 4.6%.
What is the Percentage of Population with a Degree in Liberal Arts and History in the United States?
Percentage of Population with a Degree in Liberal Arts and History in the United States is 4.9%.