Zip Codes with the Highest Percentage of Population with a Degree in Visual and Performing Arts in Springfield, MO
RELATED REPORTS & OPTIONS
Visual and Performing Arts
Springfield
Compare Zip Codes
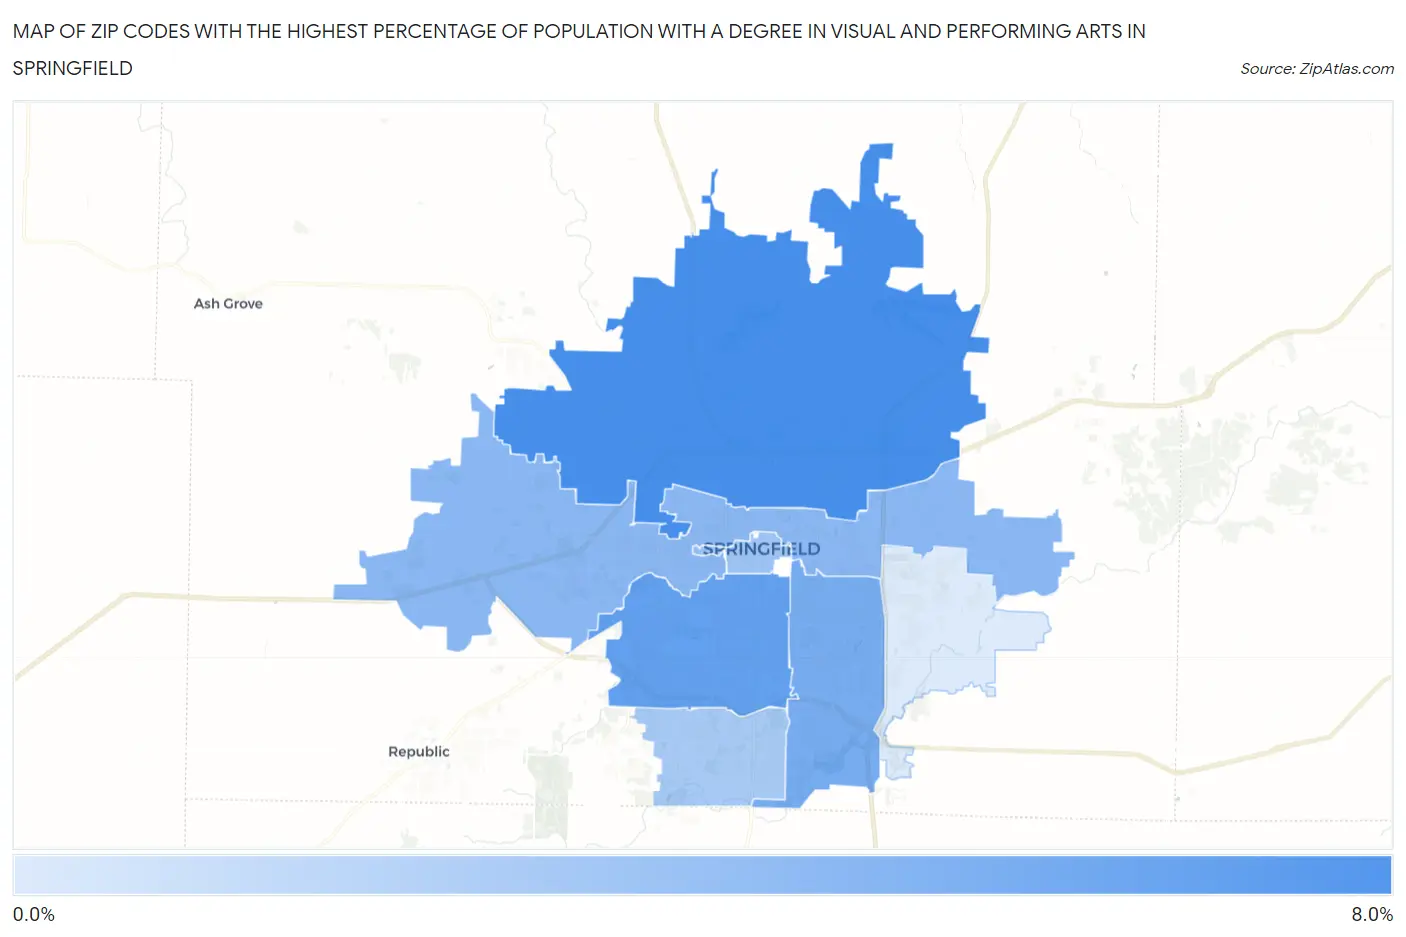
Map of Zip Codes with the Highest Percentage of Population with a Degree in Visual and Performing Arts in Springfield
1.5%
6.2%
Zip Codes with the Highest Percentage of Population with a Degree in Visual and Performing Arts in Springfield, MO
| Zip Code | % Graduates | vs State | vs National | |
| 1. | 65803 | 6.2% | 3.8%(+2.48)#111 | 4.3%(+2.00)#4,545 |
| 2. | 65807 | 5.3% | 3.8%(+1.54)#140 | 4.3%(+1.06)#6,019 |
| 3. | 65804 | 4.7% | 3.8%(+0.888)#163 | 4.3%(+0.407)#7,388 |
| 4. | 65802 | 4.1% | 3.8%(+0.300)#214 | 4.3%(-0.181)#9,027 |
| 5. | 65806 | 3.4% | 3.8%(-0.361)#279 | 4.3%(-0.842)#11,217 |
| 6. | 65810 | 3.1% | 3.8%(-0.662)#301 | 4.3%(-1.14)#12,317 |
| 7. | 65809 | 1.5% | 3.8%(-2.32)#441 | 4.3%(-2.80)#18,317 |
1
Common Questions
What are the Top 5 Zip Codes with the Highest Percentage of Population with a Degree in Visual and Performing Arts in Springfield, MO?
Top 5 Zip Codes with the Highest Percentage of Population with a Degree in Visual and Performing Arts in Springfield, MO are:
What zip code has the Highest Percentage of Population with a Degree in Visual and Performing Arts in Springfield, MO?
65803 has the Highest Percentage of Population with a Degree in Visual and Performing Arts in Springfield, MO with 6.2%.
What is the Percentage of Population with a Degree in Visual and Performing Arts in Springfield, MO?
Percentage of Population with a Degree in Visual and Performing Arts in Springfield is 5.4%.
What is the Percentage of Population with a Degree in Visual and Performing Arts in Missouri?
Percentage of Population with a Degree in Visual and Performing Arts in Missouri is 3.8%.
What is the Percentage of Population with a Degree in Visual and Performing Arts in the United States?
Percentage of Population with a Degree in Visual and Performing Arts in the United States is 4.3%.